Notebookcheck Logo

Apple A18 GPU vs Apple A18 Pro GPU

Apple A18 GPU

► remove from comparison Apple A18 GPU

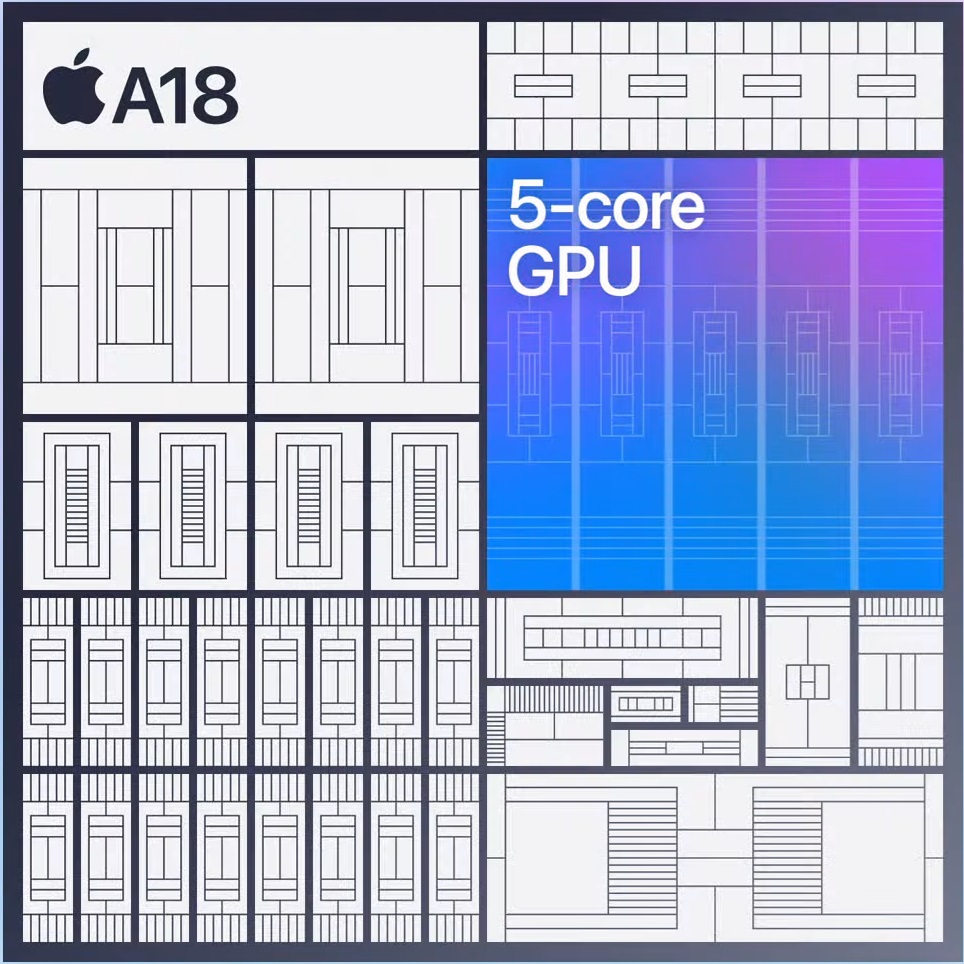
The Apple A18 GPU is an integrated graphics card in the Apple A18 SoC from the iPhone 16 and 16 Plus models in 2024. The A18 GPU integrates five cores, hardware ray tracing and mesh support. Apple states that the A18 GPU is up to 40% faster than the A16 GPU in the iPhone 15. In our benchmarks, the graphics unit is positioned between the old A16 GPU and the A17 Pro GPU with 6 cores.

Compared to the A18 Pro, the A18 does not offer the improved display engines and video processors.

In our measurements, the power consumption under load is just above the older generations but below the A18 Pro GPU.

Apple A18 Pro GPU

► remove from comparison Apple A18 Pro GPU

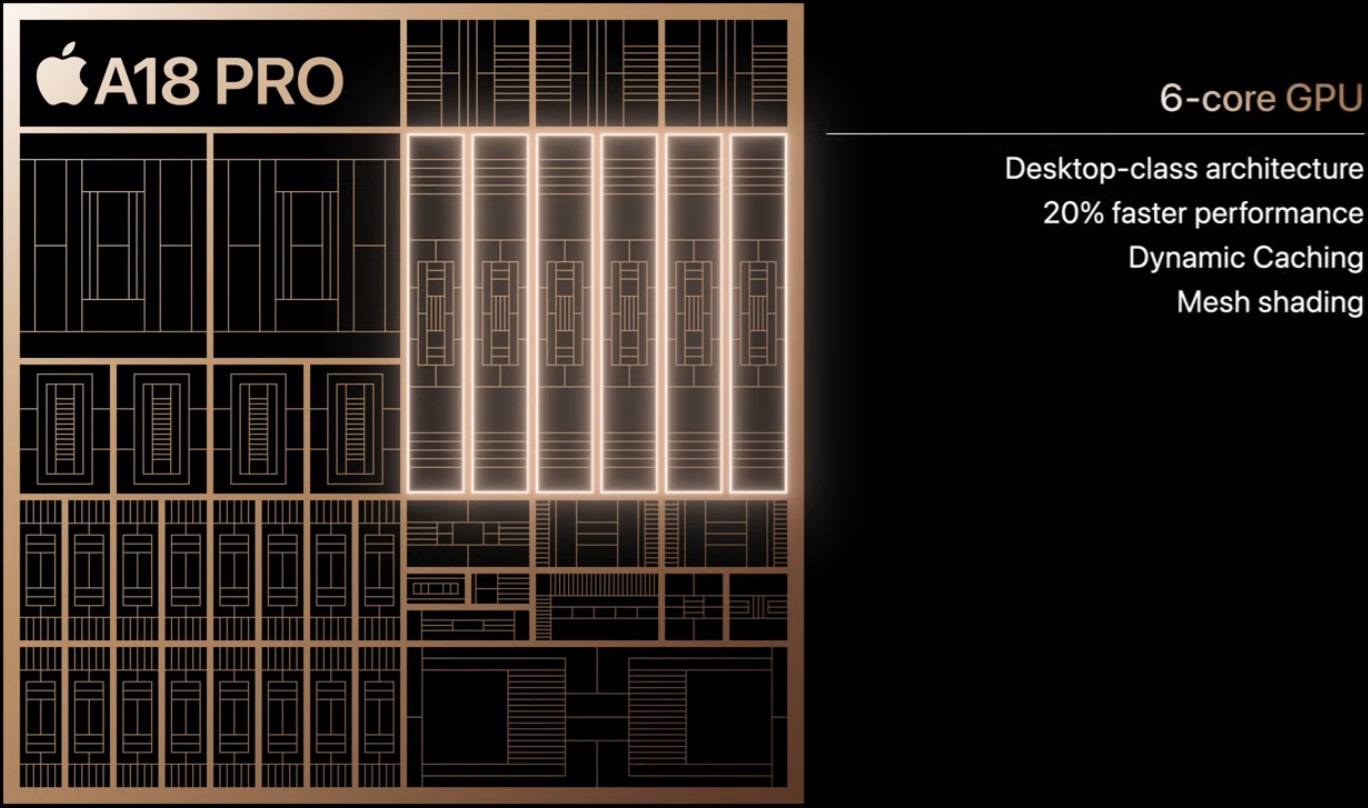
The Apple A18 Pro GPU is a relatively fast graphics adapter that the A18 Pro SoC comes equipped with. This iGPU has 6 cores and is RT-enabled; it may be based on the same architecture as M4-series GPUs are while running at lower clock speeds and having fewer cores to work with.

The slower A18 GPU does not just have 1 core less; it also has to be content with older display engine and video encoder/decoder.

Performance

In our October 2024 testing, it managed to beat the 7-core M1 GPU in many tests. Overall, its benchmark scores are most comparable to those of the Immortalis-G720 MP12, Adreno 740 and Adreno 750.

Any 2024 and 2025 iOS game will run great given the power on offer. We can't help but note however that synthetic benchmarks usually stress the GPU for just a few minutes at a time; sustained performance in real-world tasks will be much lower than what benchmark results suggest, since iPhones come without active cooling of any kind.

Power consumption

The A18 Pro SoC appears to consume up to about 10 W when under high load, with average sustained power consumption figures hovering around 4 W. The GPU's share in these values is probably something close to a half, give or take.

The pretty modern TSMC N3E manufacturing process makes the A18 Pro GPU very power-efficient, as of late 2024.

Apple A18 GPUApple A18 Pro GPU
Apple A18 Series
A18 Pro GPU 6
A18 GPU 5
A18 Pro GPU 6
A18 GPU 5
Pipelines5 - unified6 - unified
Memory TypeLPDDR5xLPDDR5x
Shared Memoryyesyes
Power Consumption6 Watt6 Watt
Date of Announcement09.09.2024 09.09.2024
technology3 nm
PredecessorA17 Pro GPU
CPU in A18 GPUGPU Base SpeedGPU Boost / Turbo
Apple A186 x ? MHz? MHz? MHz

Benchmarks

3DMark - 3DMark Steel Nomad Light
min: 1517     avg: 1651     median: 1634 (4%)     max: 1803 Points
min: 1806     avg: 1938     median: 1937.5 (4%)     max: 2069 Points
3DMark - 3DMark Wild Life Unlimited
min: 14024     avg: 15274     median: 15273.5 (8%)     max: 16523 Points
min: 17967     avg: 18168     median: 18167.5 (9%)     max: 18368 Points
3DMark - 3DMark Wild Life Extreme Unlimited
min: 2827     avg: 3418     median: 3286 (4%)     max: 4142 Points
min: 3987     avg: 4363     median: 4363 (5%)     max: 4739 Points
3DMark - 3DMark Solar Bay
min: 6120     avg: 6708     median: 6552 (3%)     max: 7453 Points
min: 7750     avg: 7948     median: 7948 (4%)     max: 8146 Points
3DMark - 3DMark Sling Shot Extreme (ES 3.1) Unlimited
0 Points (0%)
3DMark - 3DMark Sling Shot Extreme (ES 3.1) Unlimited Graphics
0 Points (0%)
GFXBench - GFXBench 5.0 4K Aztec Ruins High Tier Offscreen
min: 20.6     avg: 22.5     median: 21.3 (8%)     max: 25.5 fps
min: 29.6     avg: 29.8     median: 29.8 (11%)     max: 30 fps
GFXBench - GFXBench 5.0 Aztec Ruins High Tier Offscreen
min: 47.6     avg: 50     median: 50 (9%)     max: 52.3 fps
min: 56     avg: 62.7     median: 62.7 (11%)     max: 69.3 fps
GFXBench - GFXBench 5.0 Aztec Ruins Normal Tier Offscreen
min: 140     avg: 150.7     median: 147.1 (11%)     max: 165 fps
min: 176.1     avg: 180.1     median: 180.1 (13%)     max: 184 fps
GFXBench - GFXBench Car Chase Offscreen
min: 109.5     avg: 125.9     median: 129.1 (12%)     max: 139 fps
min: 143     avg: 148.9     median: 148.9 (14%)     max: 154.7 fps
GFXBench 3.1 - GFXBench Manhattan ES 3.1 Offscreen
min: 174     avg: 183.4     median: 175.3 (4%)     max: 201 fps
min: 225     avg: 231.2     median: 231.2 (5%)     max: 237.3 fps
GFXBench 3.0 - GFXBench 3.0 Manhattan Offscreen
min: 250     avg: 269     median: 259.9 (11%)     max: 297 fps
min: 300     avg: 312     median: 312 (13%)     max: 324 fps
GFXBench (DX / GLBenchmark) 2.7
GFXBench T-Rex HD Offscreen C24Z16 + Apple A18 GPU
GFXBench (DX / GLBenchmark) 2.7 - GFXBench T-Rex HD Offscreen C24Z16
min: 393     avg: 422.5     median: 397.5 (3%)     max: 477 fps
GFXBench T-Rex HD Offscreen C24Z16 + Apple A18 Pro GPU
min: 518     avg: 527     median: 527 (4%)     max: 536 fps
Antutu v10 - AnTuTu v10 GPU
min: 534903     avg: 564418     median: 536572 (37%)     max: 621779 Points
min: 657144     avg: 716269     median: 716269 (49%)     max: 775394 Points
Geekbench 6.5 - Geekbench 6.5 GPU Metal
28031 Points (16%)
33074 Points (18%)
PassMark PerformanceTest Mobile V1 - PerformanceTest Mobile V1 2D Graphics Tests
100%
1 A18 GPU +
47876 Points (16%)
PassMark PerformanceTest Mobile V1 - PerformanceTest Mobile V1 3D Graphics Tests
100%
1 A18 GPU +
16873 Points (28%)
Power Consumption - GFXBench Aztec Ruins Normal Tier Offscreen Power Consumption 150cd *
100%
1 A18 GPU +
min: 4.01     avg: 8.4     median: 9.8 (4%)     max: 11.4 Watt
min: 11.3     avg: 12     median: 12 (5%)     max: 12.6 Watt

Average Benchmarks Apple A18 GPU → 100% n=13

Average Benchmarks Apple A18 Pro GPU → 125% n=13

- Range of benchmark values for this graphics card
red legend - Average benchmark values for this graphics card
* Smaller numbers mean a higher performance
1 This benchmark is not used for the average calculation

Game Benchmarks

The following benchmarks stem from our benchmarks of review laptops. The performance depends on the used graphics memory, clock rate, processor, system settings, drivers, and operating systems. So the results don't have to be representative for all laptops with this GPU. For detailed information on the benchmark results, click on the fps number.

Diablo Immortal

Diablo Immortal

2022
low Medium
100%
A18 GPU:
58.9  fps
98%
A18 Pro GPU:
57.7  fps
ultra Ultra
100%
A18 GPU:
58.9  fps
99%
A18 Pro GPU:
58.2  fps
Call of Duty Mobile

Call of Duty Mobile

2020
high
A18 Pro GPU:
116.8  fps
ultra
A18 Pro GPU:
58.4  fps
Genshin Impact

Genshin Impact

2020
low
100%
A18 GPU:
58.6 58.8 59.1 ~ 59 fps
190%
A18 Pro GPU:
109.3 115.4 ~ 112 fps
med.
100%
A18 GPU:
57.9  fps
185%
A18 Pro GPU:
106.9  fps
ultra
100%
A18 GPU:
56.6 58.1 58.4 ~ 58 fps
129%
A18 Pro GPU:
65.2 85.7 ~ 75 fps
PUBG Mobile

PUBG Mobile

2018
low
100%
A18 GPU:
57.7  fps
201%
A18 Pro GPU:
116.4 116.5 ~ 116 fps
high
100%
A18 GPU:
58.5 58.9 ~ 59 fps
97%
A18 Pro GPU:
57 57.1 ~ 57 fps
ultra
100%
A18 GPU:
40.4 43.6 43.9 ~ 43 fps
98%
A18 Pro GPU:
38.4 46.2 ~ 42 fps

Average Gaming Apple A18 GPU → 100%

Average Gaming 30-70 fps → 100%

Average Gaming Apple A18 Pro GPU → 137%

Average Gaming 30-70 fps → 98%

Apple A18 GPUApple A18 Pro GPU
lowmed.highultraQHD4Klowmed.highultraQHD4K
Diablo Immortal58.958.957.758.2
Genshin Impact5957.958112106.975
PUBG Mobile57.759431165742
Apple A18 GPUApple A18 Pro GPU
lowmed.highultraQHD4Klowmed.highultraQHD4K
< 30 fps
< 60 fps
< 120 fps
≥ 120 fps

3


1


1


3


< 30 fps
< 60 fps
< 120 fps
≥ 120 fps

1
2


1

1


2
1


For more games that might be playable and a list of all games and graphics cards visit our Gaming List

Add one or more devices and compare

In the following list you can select (and also search for) devices that should be added to the comparison. You can select more than one device.

restrict list:
v1.34
log 22. 03:33:25

#0 ran 0s before starting gpusingle class +0s ... 0s

#1 checking url part for id 12806 +0s ... 0s

#2 checking url part for id 12805 +0s ... 0s

#3 redirected to Ajax server, took 1761096805s time from redirect:0 +0s ... 0s

#4 did not recreate cache, as it is less than 5 days old! Created at Tue, 21 Oct 2025 16:37:30 +0200 +0s ... 0s

#5 composed specs +0.025s ... 0.026s

#6 did output specs +0s ... 0.026s

#7 start showIntegratedCPUs +0s ... 0.026s

#8 getting avg benchmarks for device 12806 +0.012s ... 0.037s

#9 got single benchmarks 12806 +0.006s ... 0.043s

#10 getting avg benchmarks for device 12805 +0s ... 0.043s

#11 got single benchmarks 12805 +0.005s ... 0.048s

#12 got avg benchmarks for devices +0s ... 0.048s

#13 No cached benchmark found, getting uncached values +0.004s ... 0.052s

#14 No cached benchmark found, getting uncached values +0s ... 0.052s

#15 min, max, avg, median took s +0.009s ... 0.061s

#16 before gaming benchmark output +0s ... 0.061s

#17 Got 30 rows for game benchmarks. +0.013s ... 0.074s

#18 composed SQL query for gamebenchmarks +0s ... 0.074s

#19 got data and put it in $dataArray +0s ... 0.075s

#20 benchmarks composed for output. +0.002s ... 0.076s

#21 calculated avg scores. +0s ... 0.076s

#22 return log +0.001s ... 0.077s

Please share our article, every link counts!
Mail Logo
> Expert Reviews and News on Laptops, Smartphones and Tech Innovations > Benchmarks / Tech > Graphics Card Comparison - Head 2 Head
Redaktion, 2017-09- 8 (Update: 2023-07- 1)