

Apple A17 Pro vs Apple A18 Pro
Apple A17 Pro
► remove from comparison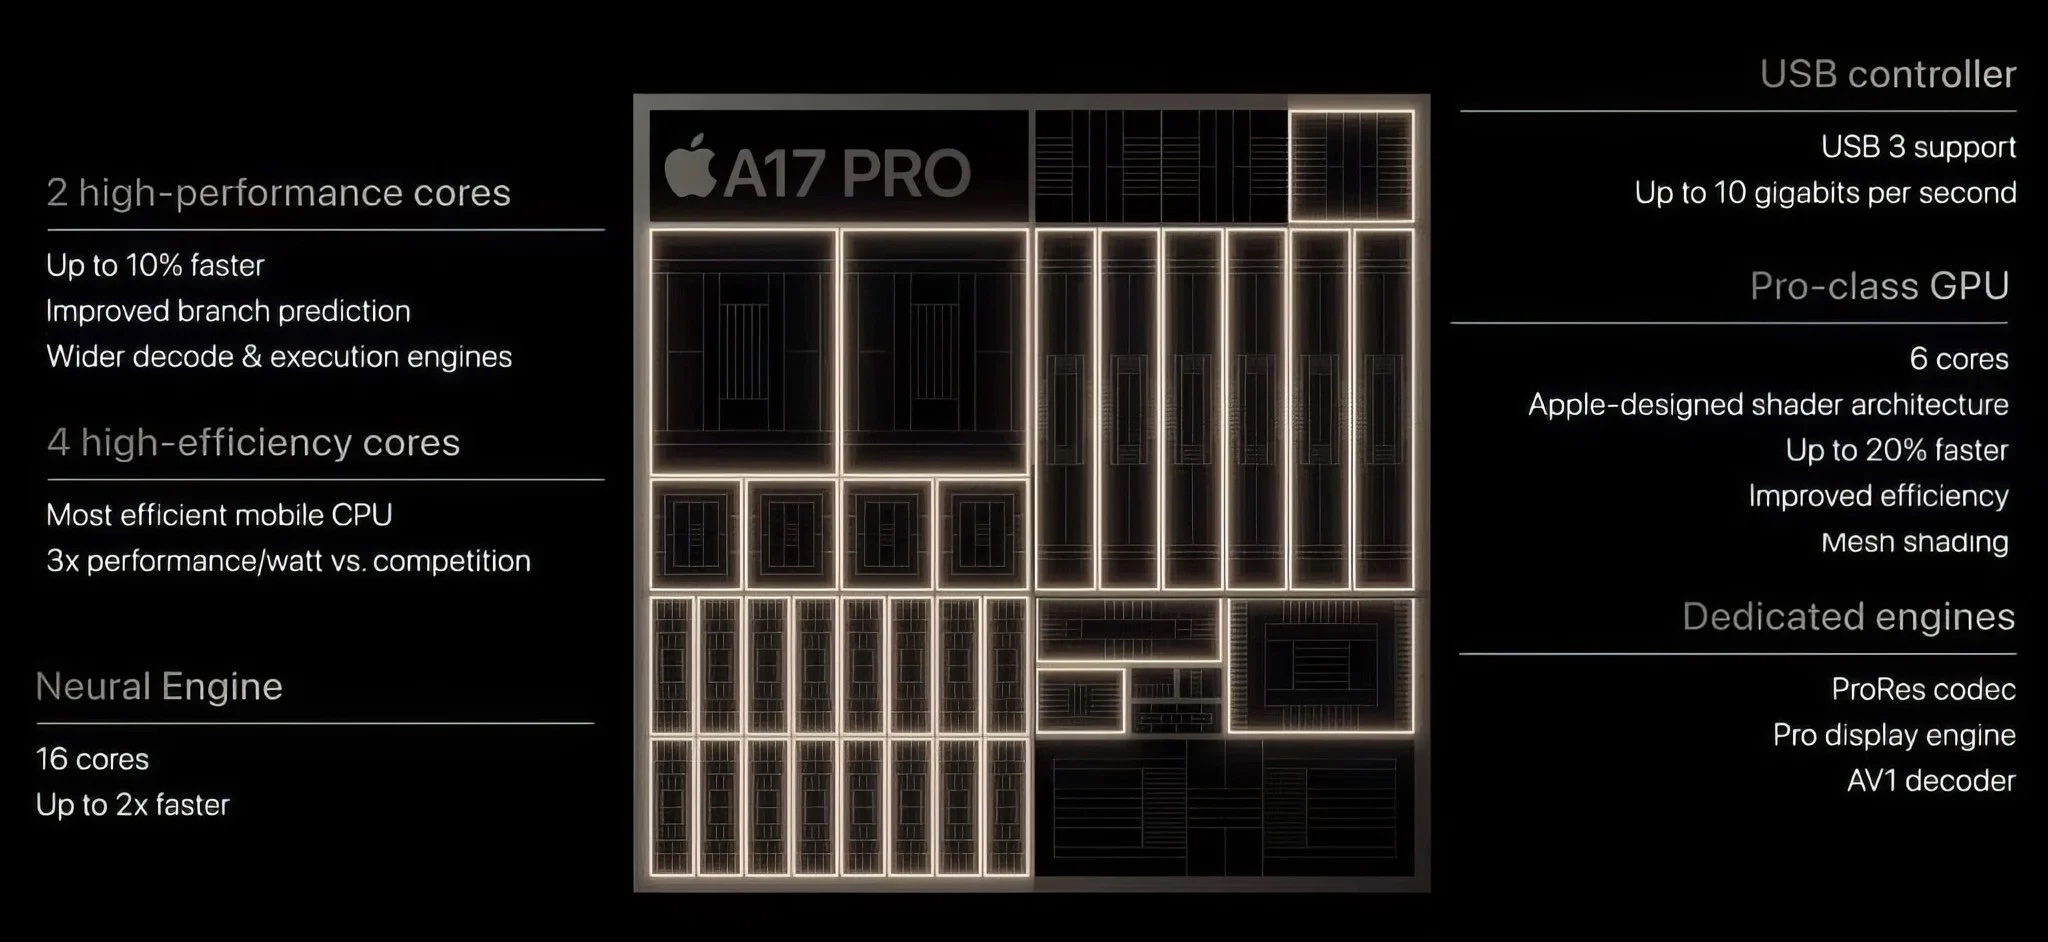
The Apple A17 Pro is a System on a Chip (SoC) from Apple that is found in the iPhone 15 Pro (2023) models. It offers 6 cores divided in two performance cores (up to 3.78 GHz) and four power-efficiency cores (up to 2.11 GHz). Thanks to the higher clock speed and improvements of the branch prediction and a wider design, the A17 is able to be around 10% to 15% faster than the A16 SoC.
The biggest improvement is the new integrated 6-core GPU with ray tracing and mesh shading support. Furthermore, the chip is now able to decode AV1 video in hardware and supports USB 3.2 Gen 2 (10 Gbps). The Neural Engine still offers 16 cores, but should be up to twice as fast now.
The A17 Pro integrates 19 Billion transistors and is manufactured in the bleeding edge 3nm (N3B) process at TSMC.
Apple A18 Pro
► remove from comparison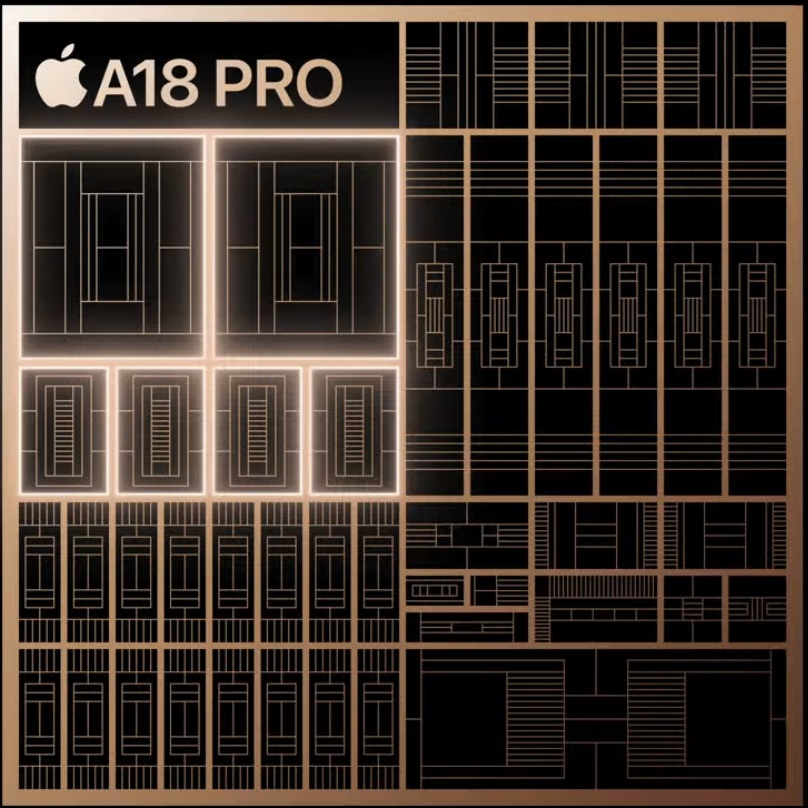
The Apple A18 Pro is a powerful smartphone processor and formal successor to the A17 Pro. This new member of the Apple A processor series debuted in September 2024 alongside the iPhone 16 Pro and iPhone 16 Pro Max; it features 2 performance cores and 4 efficient cores along with a 35 TOPS NPU and the 6-core A18 Pro GPU.
The chip is said to be in large part based on the v9.2A ARM microarchitecture for near-Apple M4 IPC. 5G, Wi-Fi 7, Bluetooth 5.3, various satellite navigation systems and NFC are all supported here.
The more affordable A18 SoC has the same 2 P-cores and 4 E-cores running at slightly lower clock speeds along with a significantly slower graphics adapter. The Pro version of the chip also boasts USB 3.x support whereas devices powered by the A18 are limited to USB 2.0 speeds.
Performance
Its multi-thread benchmark scores leave the Dimensity 9300 as well as the Apple A17 Pro and the Apple A18 pretty far behind with at least a 10% advantage. Overall, Apple M1-like performance is to be expected in short-term workloads.
In the meantime, its single-thread performance comes dangerously close to the M3 and M4 chips despite their higher clocks speeds and slightly more advanced architectures. (The A18 Pro's performance cores can run at just slightly over 4.0 GHz, as far as we know.)
Performance drops are inevitable when under longer-term stress since there is no active cooling solution of any kind here.
Graphics
Like any modern graphics adapter, the 6-core A18 Pro GPU is RT-enabled. It delivers benchmark scores that are most comparable to the Immortalis-G720 MP12, Adreno 740 and Adreno 750; as a matter of fact, it even manages to beat the 7-core M1 GPU in many tests which is rather impressive. Any 2024 and 2025 iOS game will be happy with such an iGPU.
Power consumption
It appears the chip is able to briefly consume up to about 10 W when under high load, with average sustained power consumption figures hovering around 4 W.
The pretty modern TSMC N3E manufacturing process makes the A-series chip very power-efficient, as of late 2024.
| Model | Apple A17 Pro | Apple A18 Pro | ||||||||||||||||||||||||||||||||
| Codename | Coll APL1V02 | |||||||||||||||||||||||||||||||||
| Series | Apple Apple A-Series | Apple Apple A-Series | ||||||||||||||||||||||||||||||||
| Clock | 2110 - 3780 MHz | <=4000 MHz | ||||||||||||||||||||||||||||||||
| Cores / Threads | 6 / 6 2 x 3.8 GHz Apple A17 P-Core 4 x 2.1 GHz Apple A17 E-Core | 6 / 6 2 x 4.0 GHz Apple A18 P-Core 4 x 2.2 GHz Apple A18 E-Core | ||||||||||||||||||||||||||||||||
| Transistors | 19000 Million | |||||||||||||||||||||||||||||||||
| Technology | 3 nm | 3 nm | ||||||||||||||||||||||||||||||||
| Features | 16-Core Neural Engine, Secure Enclave, AV1 decoding, USB 3.2 Gen 2 (10 Gbps) | 16-core Neural Engine, USB 3.2 Gen 2 (10 Gbps) | ||||||||||||||||||||||||||||||||
| iGPU | Apple A17 Pro GPU | |||||||||||||||||||||||||||||||||
| NPU / AI | 35 TOPS INT8 | 35 TOPS INT8 | ||||||||||||||||||||||||||||||||
| Architecture | ARM | ARM | ||||||||||||||||||||||||||||||||
| Announced | ||||||||||||||||||||||||||||||||||
| Series: Apple A-Series |
| |||||||||||||||||||||||||||||||||
| TDP Turbo PL2 | 10 Watt |

Benchmarks
Average Benchmarks Apple A17 Pro → 100% n=11
Average Benchmarks Apple A18 Pro → 117% n=11
* Smaller numbers mean a higher performance
1 This benchmark is not used for the average calculation