Notebookcheck Logo

Apple A13 Bionic vs Intel Core i3-1000G1

Apple A13 Bionic

► remove from comparison Apple A13 Bionic

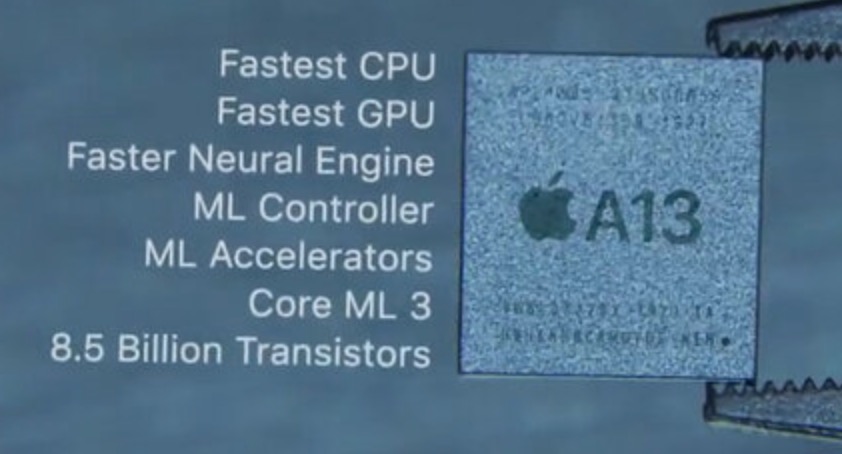
The Apple A13 Bionic is a System on a Chip (SoC) from Apple that is found in the iPhone 11 series. It was announced late 2019 and offers 6 cores divided in 2 performance cores and four power efficiency cores. Compared to the previous A12 Bionic, the A13 should offer a 20% improved CPU performance at 40% lower power (according to Apple).

With 8.5 billion transistors, the A13 Bionic is a big chip especially compared to the Snapdragon 835 (3 Billion) or a Skylake desktop quad-core Soc (1.75 Billion).

Intel Core i3-1000G1

► remove from comparison Intel i3-1000G1

The Intel Core i3-1000G1 is a power efficient dual-core SoC for laptops and Ultrabooks based on the Ice -Lake-U generation that was announced in Mai 2019 (Computex). It integrates two Sunnycove processor cores (4 threads thanks to HyperThreading) clocked at 1.1 (base) - 3.2 GHz (single and dual core Turbo). According to Intel the Sunnycove cores achieve 18% more IPCs (Instructions per Clock).

The biggest improvement for Ice-Lake is the integrated Gen 11 architecture graphics adapter called UHD Graphics G1. The Core i3-1000G1 integrates the smallest GPU, the UHD Graphics that features 32 of the 64 CUs and clocks at 300 - 900 MHz. The faster variants offer higher clock speeds (up to 1100 MHz) and include Iris Plus G4 (e.g. in the similar named Core i3-1000G4) and G7.

Other improvements for Ice Lake are the AI hardware acceleration and the partial integration of Thunderbolt and WiFi 6 in the chip. The integrated DDR4 memory controller supports modules with up to 3200 MHz (and LPDDDR4 3733).

Performance

We have not tested a single system built around the 1000G1 as of August 2023. Expect the chip to be at least as fast as the Pentium 6500Y (two Amber Lakes cores, 4 threads, up to 3.4 GHz). In other words, not fast at all.

Power consumption

This Core i3 has a default TDP (also known as the long-term power limit) of 9 W, a value that laptop manufacturers are allowed to reduce just slightly to 8 W resulting in lower clock speeds and lower performance. TDP values that low are typical for affordable laptops, tablets and mini-PCs, mostly with no active cooling solution.

The processor is built with Intel's 2nd generation 10 nm process for decent, as of late 2022, energy efficiency.

ModelApple A13 BionicIntel Core i3-1000G1
CodenameLightning and ThunderIce Lake-Y
SeriesApple Apple A-SeriesIntel Ice Lake
Clock <=2660 MHz1100 - 3200 MHz
L1 Cache832 KB
L2 Cache12 MB1 MB
Cores / Threads6 / 62 / 4
Transistors6900 Million
Technology7 nm10 nm
FeaturesARMv8 Instruction SetLPDDR4-3733 RAM, PCIe 3, 4 GT/s bus, DL Boost, GNA, MMX, SSE, SSE2, SSE3, SSSE3, SSE4.1, SSE4.2, AVX, AVX2, AVX-512, BMI2, ABM, FMA, ADX, VMX, SMEP, SMAP, EIST, TM1, TM2, HT, Turbo, SST, AES-NI, RDRAND, RDSEED, SHA, SGX
iGPUApple A13 Bionic GPUIntel UHD Graphics G1 (Ice Lake 32 EU) (300 - 900 MHz)
ArchitectureARMx86
Announced
Series: Ice Lake Ice Lake-Y
Intel Core i5-1030G7 compare0.8 - 3.5 GHz4 / 8 cores6 MB L3
Intel Core i5-1030G4 compare0.7 - 3.5 GHz4 / 8 cores6 MB L3
Intel Core i3-1000G4 compare1.1 - 3.2 GHz2 / 4 cores4 MB L3
Intel Core i3-1000G1 « 1.1 - 3.2 GHz2 / 4 cores4 MB L3
L3 Cache4 MB
TDP9 Watt
max. Temp.100 °C
Manufacturerark.intel.com

Benchmarks

3DMark - 3DMark Ice Storm Unlimited Physics
min: 33851     avg: 33885     median: 33881 (28%)     max: 33925 Points
3DMark - 3DMark Sling Shot Extreme (ES 3.1) Unlimited Physics
min: 2078     avg: 2803     median: 2958 (28%)     max: 3219 Points
3DMark - 3DMark Sling Shot (ES 3.0) Unlimited Physics
min: 3411     avg: 3780     median: 3877 (44%)     max: 4052 Points
Geekbench 6.4 - Geekbench 6.4 Single-Core
1760 Points (44%)
Geekbench 6.4 - Geekbench 6.4 Multi-Core
4135 Points (16%)
Geekbench 5.5 - Geekbench 5.1 - 5.5 64 Bit Single-Core
min: 1326     avg: 1333     median: 1332 (52%)     max: 1342 Points
Geekbench 5.5 - Geekbench 5.1 - 5.5 64 Bit Multi-Core
min: 3235     avg: 3381     median: 3378.5 (6%)     max: 3531 Points
Geekbench 5.0 - Geekbench 5.0 64 Bit Single-Core
min: 1343     avg: 1343     median: 1343 (6%)     max: 1344 Points
Geekbench 5.0 - Geekbench 5.0 64 Bit Multi-Core
min: 3242     avg: 3427     median: 3463 (11%)     max: 3575 Points
Mozilla Kraken 1.1 - Kraken 1.1 Total Score *
min: 545     avg: 562     median: 571 (1%)     max: 573 ms
Octane V2 - Octane V2 Total Score
min: 47288     avg: 48727     median: 48991 (37%)     max: 49388 Points
WebXPRT 3 - WebXPRT 3 Score
min: 146     avg: 179.2     median: 183 (33%)     max: 202 Points
AnTuTu v7 - AnTuTu v7 MEM
min: 10494     avg: 12510     median: 12592 (39%)     max: 14443 Points
AnTuTu v7 - AnTuTu v7 UX
min: 77118     avg: 77810     median: 78032 (96%)     max: 78279 Points
AnTuTu v7 - AnTuTu v7 GPU
min: 218738     avg: 219891     median: 218937 (68%)     max: 221998 Points
AnTuTu v7 - AnTuTu v7 CPU
min: 147281     avg: 149542     median: 148191 (91%)     max: 153154 Points
AnTuTu v7 - AnTuTu v7 Total Score
min: 456891     avg: 459752     median: 459850 (81%)     max: 462516 Points
AnTuTu v8 - AnTuTu v8 UX
min: 64361     avg: 75201     median: 78294 (65%)     max: 82947 Points
AnTuTu v8 - AnTuTu v8 MEM
min: 67691     avg: 75819     median: 74262 (60%)     max: 85504 Points
AnTuTu v8 - AnTuTu v8 GPU
min: 190559     avg: 203672     median: 209164 (38%)     max: 211292 Points
AnTuTu v8 - AnTuTu v8 CPU
min: 149088     avg: 156731     median: 152919 (55%)     max: 168185 Points
AnTuTu v8 - AnTuTu v8 Total Score
min: 489463     avg: 511422     median: 510245 (49%)     max: 534558 Points
Antutu v9 - AnTuTu v9 Total Score
622382 Points (30%)
Antutu v9 - AnTuTu v9 CPU
147649 Points (37%)
Antutu v10 - AnTuTu v10 Total Score
904153 Points (30%)
Antutu v10 - AnTuTu v10 CPU
236453 Points (7%)
PassMark PerformanceTest Mobile V1 - PerformanceTest Mobile V1 CPU Tests
min: 650706     avg: 678820     median: 683897 (90%)     max: 701856 Points
CrossMark - CrossMark Overall
min: 776     avg: 835     median: 849 (32%)     max: 864 Points
Power Consumption - Geekbench 5.5 Power Consumption 150cd *
7 Watt (3%)
Power Consumption - Idle Power Consumption 150cd 1min *
2.9 Watt (3%)

Average Benchmarks Apple A13 Bionic → 0% n=0

- Range of benchmark values for this graphics card
red legend - Average benchmark values for this graphics card
* Smaller numbers mean a higher performance
1 This benchmark is not used for the average calculation

Add one or more devices and compare

In the following list you can select (and also search for) devices that should be added to the comparison. You can select more than one device.

restrict list:
v1.33
log 03. 22:04:52

#0 ran 0s before starting gpusingle class +0s ... 0s

#1 checking url part for id 11496 +0s ... 0s

#2 checking url part for id 11452 +0s ... 0s

#3 redirected to Ajax server, took 1751573092s time from redirect:0 +0s ... 0s

#4 did not recreate cache, as it is less than 5 days old! Created at Thu, 03 Jul 2025 17:00:01 +0200 +0s ... 0s

#5 composed specs +0.005s ... 0.005s

#6 did output specs +0s ... 0.005s

#7 getting avg benchmarks for device 11496 +0.001s ... 0.006s

#8 got single benchmarks 11496 +0.006s ... 0.011s

#9 getting avg benchmarks for device 11452 +0.001s ... 0.012s

#10 got single benchmarks 11452 +0s ... 0.012s

#11 got avg benchmarks for devices +0s ... 0.012s

#12 min, max, avg, median took s +0.014s ... 0.026s

#13 return log +0s ... 0.026s

Please share our article, every link counts!
Mail Logo
> Expert Reviews and News on Laptops, Smartphones and Tech Innovations > Benchmarks / Tech > Processor Comparison - Head 2 Head
Redaktion, 2017-09- 8 (Update: 2023-07- 1)