

Amazfit T-Rex 3: A closer look at a new feature
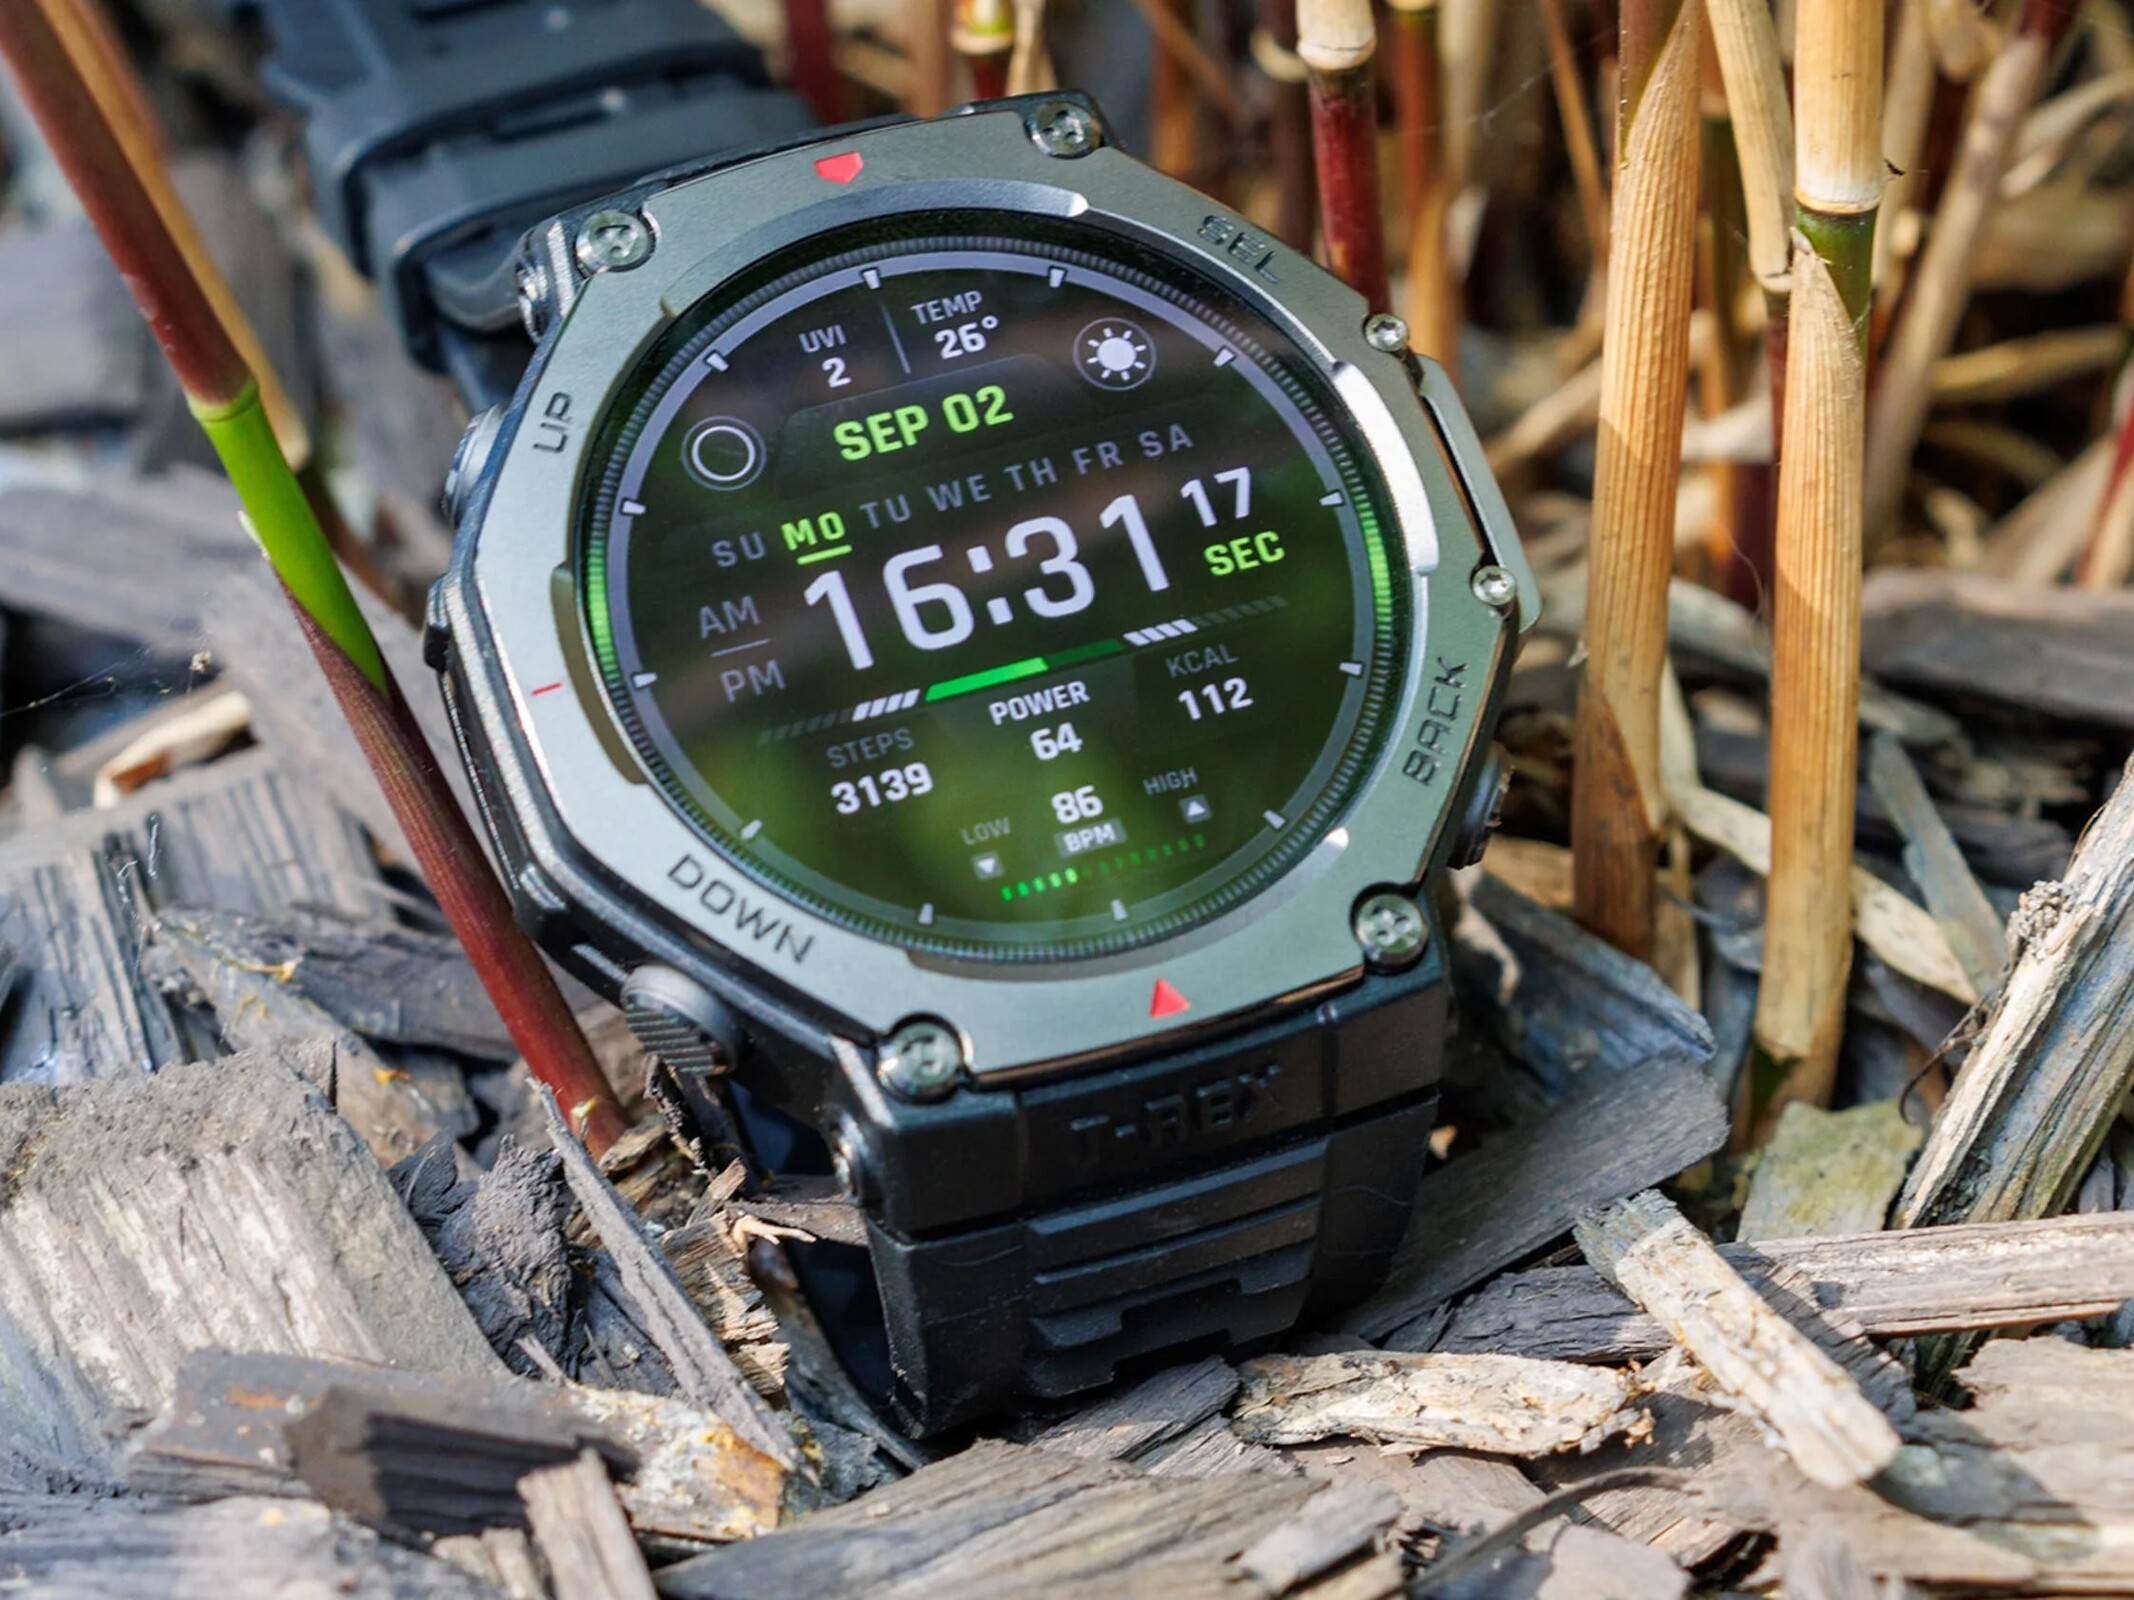
Amazfit has released a new software update for the T-Rex 3 that not only fixes bugs but also significantly expands its range of functions, at least for users who wear their T-Rex 3 during runs. Disclaimer: In this article, we describe the function, not evaluate it. We plan to assess the quality of the determination of running efficiency parameters very soon, not just for the T-Rex 3 but also for other wearables. An exact quantification of possible measurement deviations remains elusive for the time being.
Thanks to the update, the T-Rex 3 can now record ground contact time and vertical movement. This allows for derived or calculated values such as the vertical ratio, which is the relationship of vertical movement—in simple terms, the height of the jump when running—to stride length. "Ground contact time" self-evidently indicates the time a foot remains on the ground before coming off again. Both vertical movement and ground contact time should be low, as the aim of running is usually to cover distance rather than to bounce. However, even with seemingly perfect measurements, these values should always be treated with a certain degree of caution, but they can provide indications of problems with running technique. What the T-Rex 3 cannot record, even following the update, is the balance of ground contact time, which can allow imbalances to be identified relatively quickly.
During a not-so-slow six-kilometer test run on Sunday at an average pace of 4:58 minutes per kilometer, the Amazfit T-Rex 3 measured an average vertical drop of 7.3% and an average ground contact time of 306 milliseconds. Since the run wasn't performed at the author's personal limit, a slightly higher ground contact is likely.
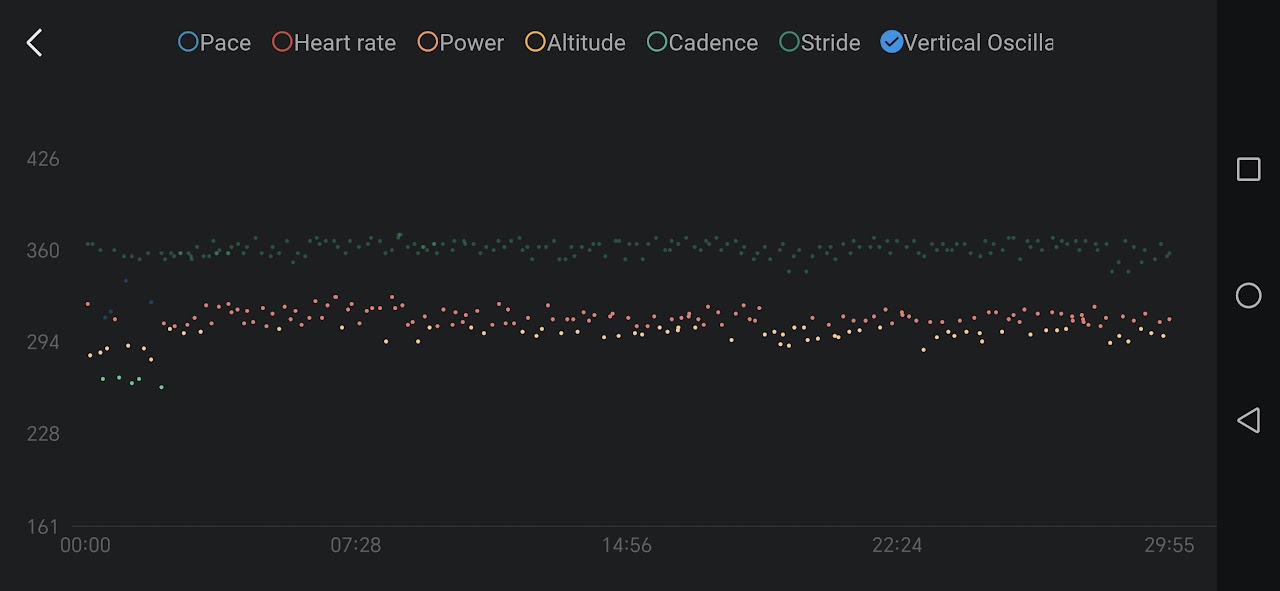
Generally speaking, measurement data is provided every ten seconds, which should be sufficient for interval runs. The app allows you to plot the individual measurement points over time; at the touch of a button, the measured values are described and an approximate classification is made. On the watch itself, these values can be displayed both as quasi-instantaneous and average values. This may be useful for very long runs in order to be informed about fatigue-related deterioration in running technique.
Source(s)
Own


