Notebookcheck Logo

MediaTek Dimensity 1080 vs MediaTek Dimensity 8050

MediaTek Dimensity 1080

► remove from comparison Mediatek Dimensity 1080

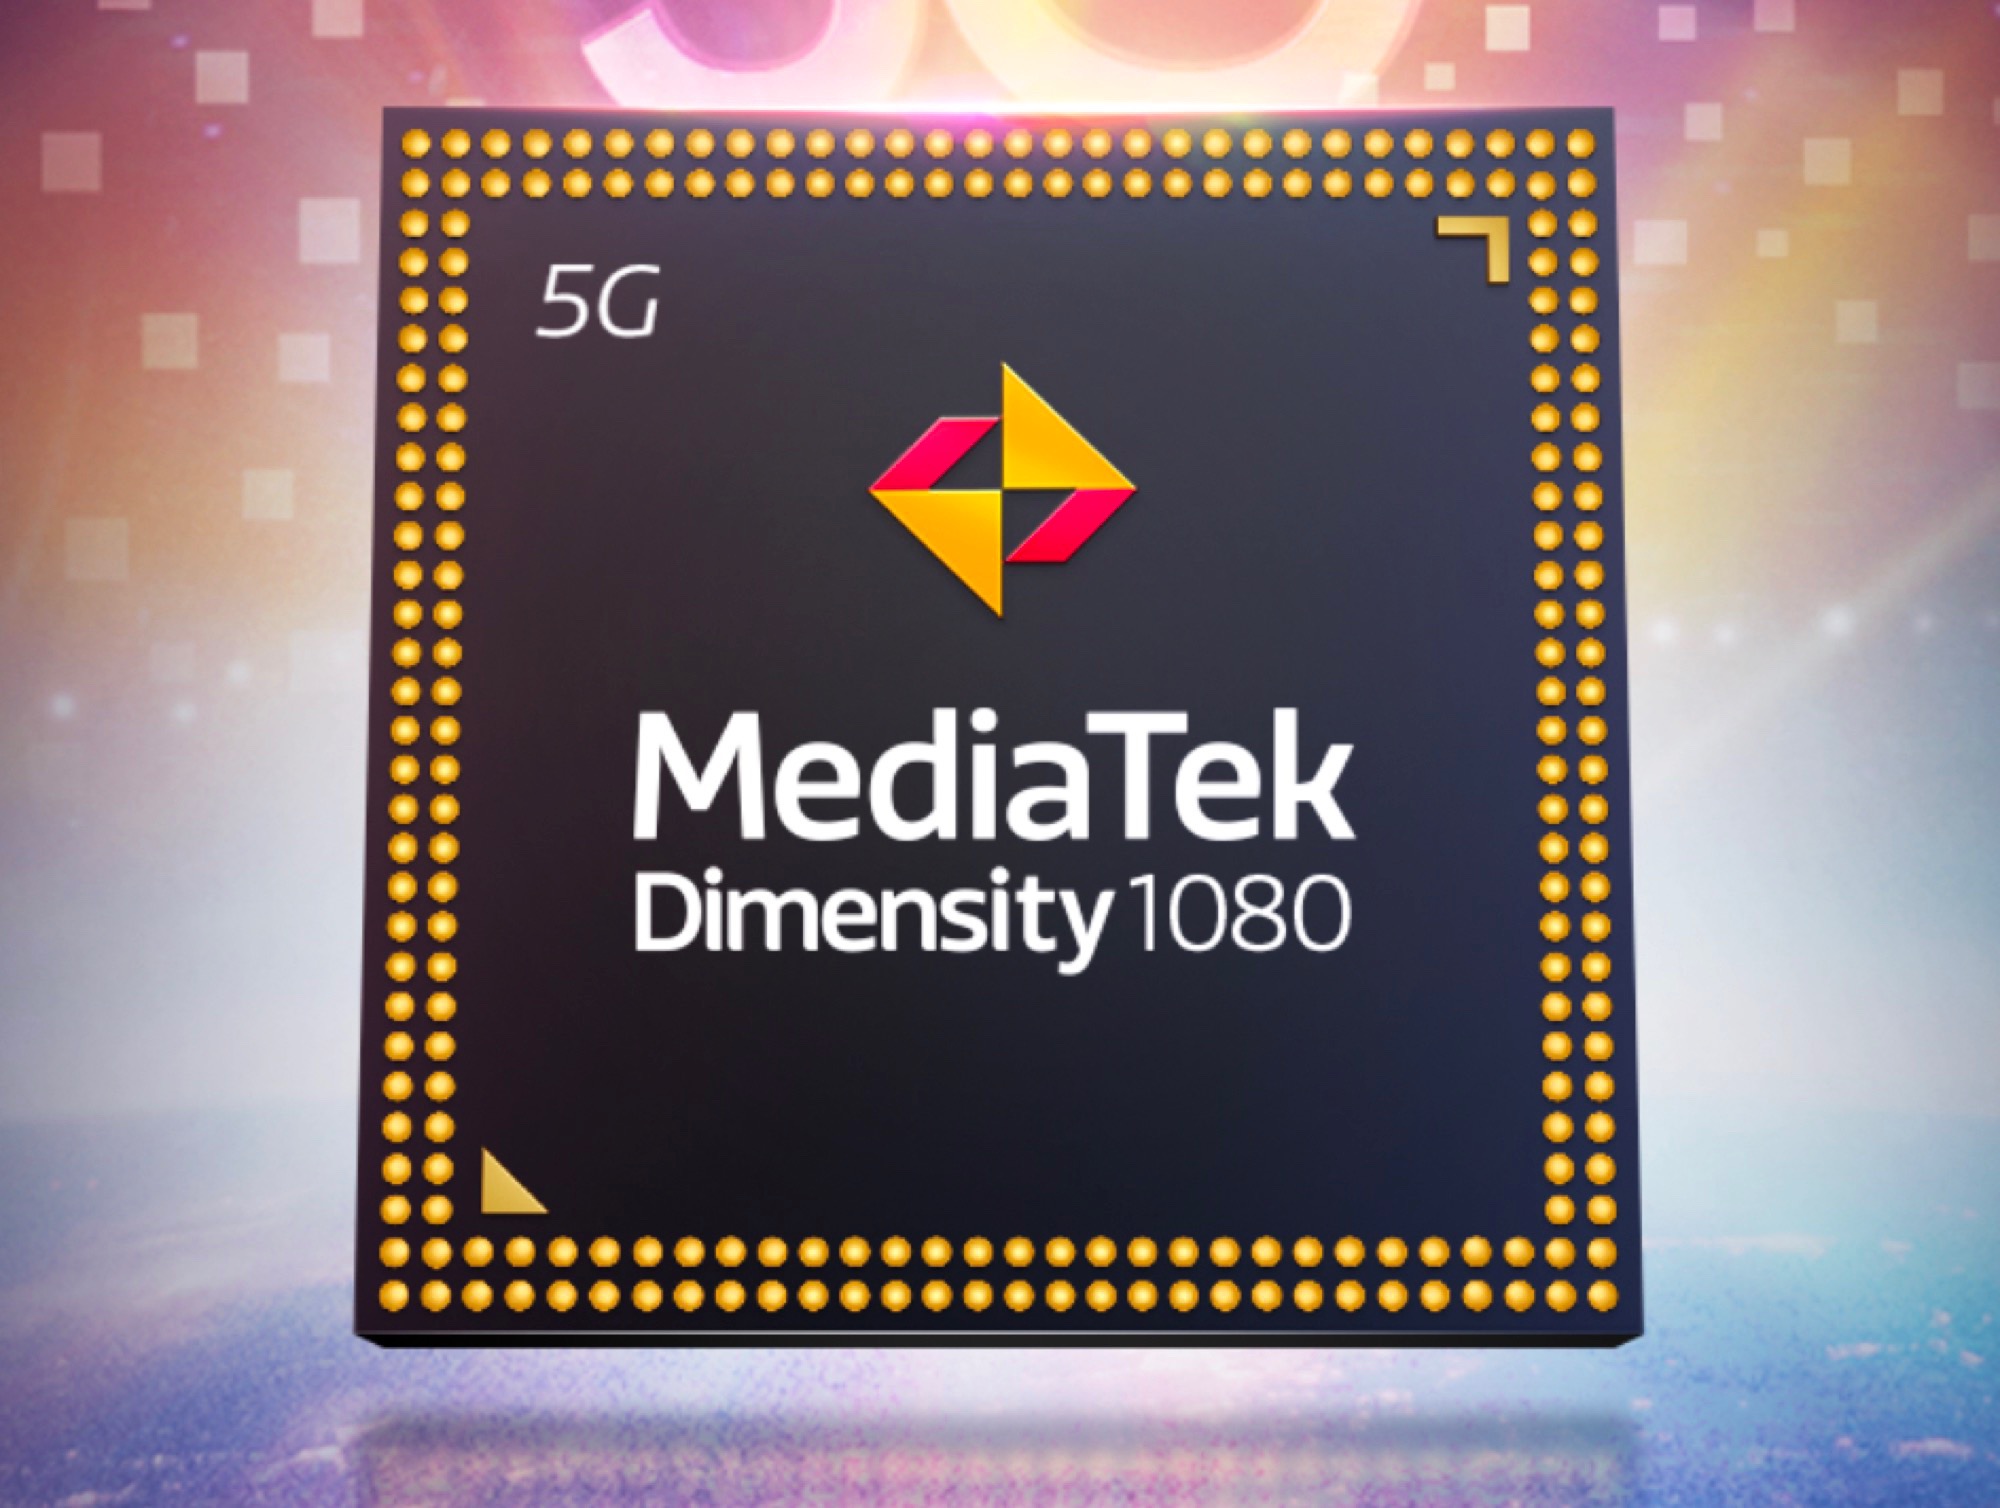
The Mediatek Dimensity 1080 is a mid-range ARM SoC (system-on-a-chip) that can be used in both smartphones and tablets (mainly Android). The SoC integrates two ARM Cortex-A78 cores with up to 2.6 GHz for demanding tasks and six power-saving ARM Cortex-A55 cores with clock rates of up to 2 GHz.

The chip has an integrated sub-6 GHz 5G modem including dual-SIM support that can reach a maximum download speed of up to 2.77 Gbit/s. Wi-Fi 6 (802.11ax) is supported as well as Bluetooth 5.2.;

The memory controller copes with LPDDR4x or LPDDR5 working memory as well as UFS 3.1 mass storage. As an integrated graphics card, the SoC uses the ARM Mali-G68 MC4, which supports displays with 120 Hz as well as HDR10+ at a maximum resolution of 2,520 x 1,440 pixels.

The differences to the Dimensity 920 are minor, only the slightly higher maximum clock and a support for higher-resolution cameras can be found.

The MediaTek Dimensity 1080 is still manufactured in 6 nm.

MediaTek Dimensity 8050

► remove from comparison Mediatek Dimensity 8050

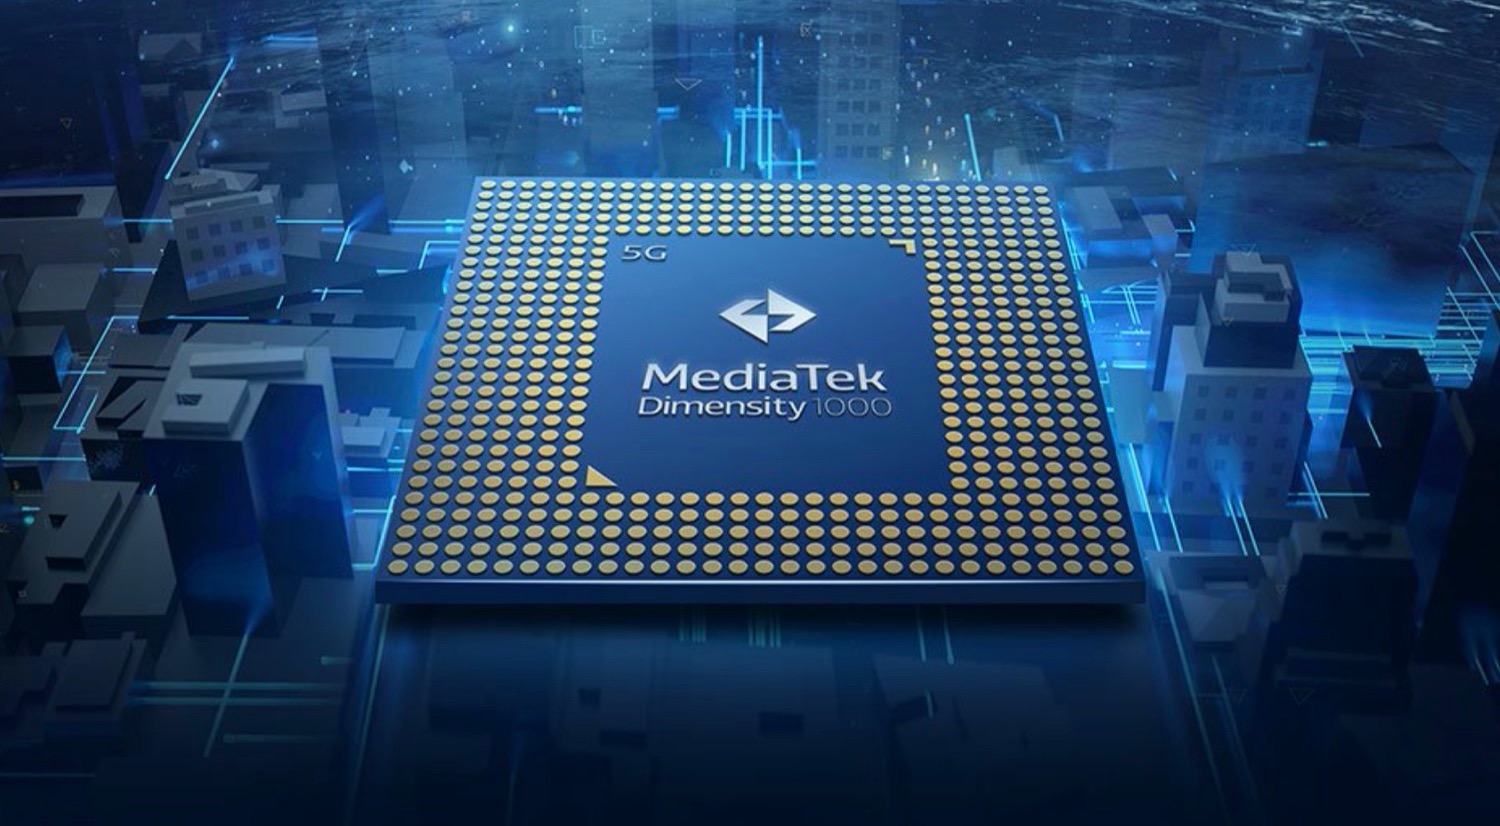
The MediaTek Dimensity 8050 is an ARM-based SoC (System-on-a-Chip) manufactured at TSMC using the 6nm process.  It supports all current mobile standards including dual-SIM 5G (5G SA & NSA, max 4.7 Gbps download and 2.5 Gbps upload). The SoC also supports Wi-Fi 6 and Bluetooth 5.2.

The MediaTek Dimensity 8050 was specially designed for use in Android smartphones and is classified in the upper mid-range in terms of performance.

The CPU part consists of three clusters: a fast performance core, based on the ARM Cortex A78 architecture and clocked at up to 3 GHz. The second cluster consists of three Cortex-A78 cores with up to 2.6 GHz. Four ARM Cortex-A55 cores with up to 2 GHz are installed as a power-saving cluster.

The integrated ARM Mali-G77 MC9 graphics unit can drive displays with a resolution of up to 2,560 x 1,080 and a refresh rate of up to 144 Hz (possibly only with Full HD+).

Technically, the SoC is similar to the older Dimensity 1300.

ModelMediaTek Dimensity 1080MediaTek Dimensity 8050
SeriesMediatek Mediatek
CodenameCortex-A78 / A55Cortex-A78 / A55
Series: Cortex-A78 / A55
MediaTek Dimensity 80502 - 3 GHz8 / 8 cores Cortex-A78 / A55
MediaTek Dimensity 1300 compare2 - 3 GHz8 / 8 cores Cortex-A78 / A55
MediaTek Dimensity 8100 compare2 - 2.85 GHz8 / 8 cores Cortex-A78 / A55
MediaTek Dimensity 1200 compare2 - 3 GHz8 / 8 cores Cortex-A78 / A55
MediaTek Kompanio 1300T compare2 - 2.6 GHz8 / 8 cores Cortex-A78 / A55
MediaTek Dimensity 8200-Ultra compare2 - 3.1 GHz8 / 8 cores4 MB L3 Cortex-A78 / A55
MediaTek Dimensity 8020 compare2 - 2.6 GHz8 / 8 cores Cortex-A78 / A55
MediaTek Dimensity 1100 compare2 - 2.6 GHz8 / 8 cores Cortex-A78 / A55
MediaTek Dimensity 7050 compare2 - 2.6 GHz8 / 8 cores Cortex-A78 / A55
MediaTek Dimensity 7030 compare2 - 2.5 GHz8 / 8 cores Cortex-A78 / A55
MediaTek Dimensity 1080 « 2 - 2.6 GHz8 / 8 cores Cortex-A78 / A55
MediaTek Dimensity 920 compare2 - 2.5 GHz8 / 8 cores Cortex-A78 / A55
MediaTek Dimensity 7020 compare2 - 2.5 GHz8 / 8 cores Cortex-A78 / A55
MediaTek Dimensity 930 compare2 - 2.2 GHz8 / 8 cores Cortex-A78 / A55
MediaTek MT8188J compare2 - 2.2 GHz8 / 8 cores Cortex-A78 / A55
MediaTek Dimensity 900 compare2 - 2.4 GHz8 / 8 cores Cortex-A78 / A55
MediaTek Dimensity 8050 « 2 - 3 GHz8 / 8 cores Cortex-A78 / A55
MediaTek Dimensity 1300 compare2 - 3 GHz8 / 8 cores Cortex-A78 / A55
MediaTek Dimensity 8100 compare2 - 2.85 GHz8 / 8 cores Cortex-A78 / A55
MediaTek Dimensity 1200 compare2 - 3 GHz8 / 8 cores Cortex-A78 / A55
MediaTek Kompanio 1300T compare2 - 2.6 GHz8 / 8 cores Cortex-A78 / A55
MediaTek Dimensity 8200-Ultra compare2 - 3.1 GHz8 / 8 cores4 MB L3 Cortex-A78 / A55
MediaTek Dimensity 8020 compare2 - 2.6 GHz8 / 8 cores Cortex-A78 / A55
MediaTek Dimensity 1100 compare2 - 2.6 GHz8 / 8 cores Cortex-A78 / A55
MediaTek Dimensity 7050 compare2 - 2.6 GHz8 / 8 cores Cortex-A78 / A55
MediaTek Dimensity 7030 compare2 - 2.5 GHz8 / 8 cores Cortex-A78 / A55
MediaTek Dimensity 10802 - 2.6 GHz8 / 8 cores Cortex-A78 / A55
MediaTek Dimensity 920 compare2 - 2.5 GHz8 / 8 cores Cortex-A78 / A55
MediaTek Dimensity 7020 compare2 - 2.5 GHz8 / 8 cores Cortex-A78 / A55
MediaTek Dimensity 930 compare2 - 2.2 GHz8 / 8 cores Cortex-A78 / A55
MediaTek MT8188J compare2 - 2.2 GHz8 / 8 cores Cortex-A78 / A55
MediaTek Dimensity 900 compare2 - 2.4 GHz8 / 8 cores Cortex-A78 / A55
Clock2000 - 2600 MHz2000 - 3000 MHz
Cores / Threads8 / 88 / 8
1 x 3.0 GHz ARM Cortex-A78
3 x 2.6 GHz ARM Cortex-A78
4 x 2.0 GHz ARM Cortex-A55
Technology6 nm6 nm
Features2x ARM Cortex-A78 (2.6 GHz), 6x ARM Cortex-A55 (2 GHz), ARM Mali-G68 MC4, 5G NR Sub-6 GHz, LTE1x ARM Cortex-A77 (3 GHz), 3x ARM Cortex-A77 (2.6 GHz), 4x ARM Cortex-A55 (2 GHz), ARM Mali-G77 MP9, APU 570, 5G Modem, MiraVision HDR10+, Wi-Fi 6, Bluetooth 5.2, UFS 3.1, LPDDR4x
iGPUARM Mali-G68 MP4ARM Mali-G77 MP9
ArchitectureARMARM
Announced
Manufactureri.mediatek.comwww.mediatek.com

Benchmarks

3DMark - 3DMark Sling Shot Extreme (ES 3.1) Unlimited Physics
min: 4047     avg: 4229     median: 4229 (50%)     max: 4411 Points
3DMark - 3DMark Sling Shot (ES 3.0) Unlimited Physics
4053 Points (46%)
Geekbench 6.2 - Geekbench 6.2 Single-Core
954 Points (29%)
min: 958     avg: 1036     median: 1036 (31%)     max: 1114 Points
Geekbench 6.2 - Geekbench 6.2 Multi-Core
2229 Points (9%)
min: 2926     avg: 3173     median: 3173 (13%)     max: 3420 Points
Geekbench 5.5 - Geekbench 5.1 - 5.4 64 Bit Single-Core
min: 761     avg: 769     median: 765 (32%)     max: 782 Points
min: 864     avg: 868     median: 867.5 (37%)     max: 871 Points
Geekbench 5.5 - Geekbench 5.1 - 5.4 64 Bit Multi-Core
min: 2035     avg: 2130     median: 2041 (4%)     max: 2315 Points
min: 2779     avg: 2852     median: 2852 (5%)     max: 2925 Points
Geekbench 5.0 - Geekbench 5.0 64 Bit Single-Core
786 Points (3%)
Geekbench 5.0 - Geekbench 5.0 64 Bit Multi-Core
2342 Points (7%)
Geekbench 4.4 - Geekbench 4.1 - 4.4 64 Bit Single-Core
min: 3722     avg: 3755     median: 3754.5 (38%)     max: 3787 Points
4348 Points (43%)
Geekbench 4.4 - Geekbench 4.1 - 4.4 64 Bit Multi-Core
min: 8568     avg: 8894     median: 8894 (10%)     max: 9220 Points
11466 Points (13%)
Geekbench 4.0 - Geekbench 4.0 64 Bit Single-Core
3585 Points (49%)
Geekbench 4.0 - Geekbench 4.0 64 Bit Multi-Core
8800 Points (21%)
Geekbench 3 - Geekbench 3 64 Bit Multi-Core
10840 Points (17%)
Geekbench 3 - Geekbench 3 64 Bit Single-Core
3670 Points (55%)
Mozilla Kraken 1.1 - Kraken 1.1 Total Score *
min: 1746.5     avg: 1770     median: 1766.4 (2%)     max: 1796.7 ms
min: 1395.4     avg: 1713     median: 1713.3 (2%)     max: 2031.1 ms
Octane V2 - Octane V2 Total Score
min: 25154     avg: 29552     median: 31662 (28%)     max: 31839 Points
min: 29792     avg: 31904     median: 31904 (29%)     max: 34016 Points
WebXPRT 4 - WebXPRT 4 Score
min: 71     avg: 77.3     median: 74 (21%)     max: 87 Points
min: 71     avg: 76     median: 76 (22%)     max: 81 Points
WebXPRT 3 - WebXPRT 3 Score
min: 99     avg: 105     median: 102 (21%)     max: 114 Points
89 Points (19%)
Antutu v9 - AnTuTu v9 Total Score
min: 458379     avg: 465350     median: 465350 (28%)     max: 472321 Points
min: 643695     avg: 685759     median: 685759 (42%)     max: 727823 Points
Antutu v9 - AnTuTu v9 CPU
min: 120607     avg: 125961     median: 125960 (35%)     max: 131314 Points
min: 161711     avg: 173949     median: 173948 (48%)     max: 186186 Points
PassMark PerformanceTest Mobile V1 - PerformanceTest Mobile V1 CPU Tests
5411 Points (1%)
min: 4722     avg: 6101     median: 6101 (1%)     max: 7480 Points
PCMark for Android - PCM f. Android Storage 2.0 random write internal
44.3 MB/s (33%)
min: 62.3     avg: 76.5     median: 76.5 (56%)     max: 90.6 MB/s
PCMark for Android - PCM f. Android Storage 2.0 seq write internal
750 MB/s (23%)
min: 1180     avg: 1354     median: 1353.5 (42%)     max: 1527 MB/s
PCMark for Android - PCM f. Android Storage 2.0 random read internal
31.5 MB/s (39%)
min: 42.8     avg: 44.5     median: 44.5 (55%)     max: 46.2 MB/s
PCMark for Android - PCM f. Android Storage 2.0 seq read internal
859 MB/s (24%)
min: 1484     avg: 1547     median: 1547 (43%)     max: 1610 MB/s
PCMark for Android - PCM f. Android Storage 2.0 score
min: 18538     avg: 22226     median: 22225.5 (35%)     max: 25913 Points
min: 37737     avg: 39361     median: 39360.5 (62%)     max: 40984 Points
PCMark for Android - PCM f. Android Work Score 3.0
min: 11721     avg: 12016     median: 11763 (54%)     max: 12564 Points
min: 11254     avg: 12862     median: 12862 (59%)     max: 14470 Points
CrossMark - CrossMark Overall
min: 657     avg: 665     median: 665 (25%)     max: 672 Points
min: 738     avg: 741     median: 741 (28%)     max: 744 Points
Power Consumption - Geekbench 5.5 Power Consumption 150cd *
min: 3.64     avg: 3.8     median: 3.7 (2%)     max: 3.94 Watt
Power Consumption - Idle Power Consumption 150cd 1min *
min: 1.147     avg: 1.3     median: 1.2 (1%)     max: 1.691 Watt

Average Benchmarks MediaTek Dimensity 1080 → 100% n=20

Average Benchmarks MediaTek Dimensity 8050 → 131% n=20

- Range of benchmark values for this graphics card
- Average benchmark values for this graphics card
* Smaller numbers mean a higher performance
1 This benchmark is not used for the average calculation

Add one or more devices and compare

In the following list you can select (and also search for) devices that should be added to the comparison. You can select more than one device.

restrict list:

show all (including archived), 2024, 2023
v1.26
log 02. 08:28:45

#0 checking url part for id 15003 +0s ... 0s

#1 checking url part for id 15089 +0s ... 0s

#2 not redirecting to Ajax server +0s ... 0s

#3 did not recreate cache, as it is less than 5 days old! Created at Wed, 01 May 2024 05:34:47 +0200 +0.001s ... 0.001s

#4 composed specs +0.092s ... 0.093s

#5 did output specs +0s ... 0.093s

#6 getting avg benchmarks for device 15003 +0.003s ... 0.096s

#7 got single benchmarks 15003 +0.015s ... 0.111s

#8 getting avg benchmarks for device 15089 +0.003s ... 0.114s

#9 got single benchmarks 15089 +0.009s ... 0.123s

#10 got avg benchmarks for devices +0s ... 0.123s

#11 min, max, avg, median took s +0.118s ... 0.241s

#12 return log +0.026s ... 0.267s

Please share our article, every link counts!
> Expert Reviews and News on Laptops, Smartphones and Tech Innovations > Benchmarks / Tech > Processor Comparison - Head 2 Head
Redaktion, 2017-09- 8 (Update: 2023-07- 1)