Notebookcheck Logo

NXP i.MX 6SLL vs Marvell PXA986 vs Broadcom BCM21664T

NXP i.MX 6SLL

► remove from comparison  i.MX 6SLL

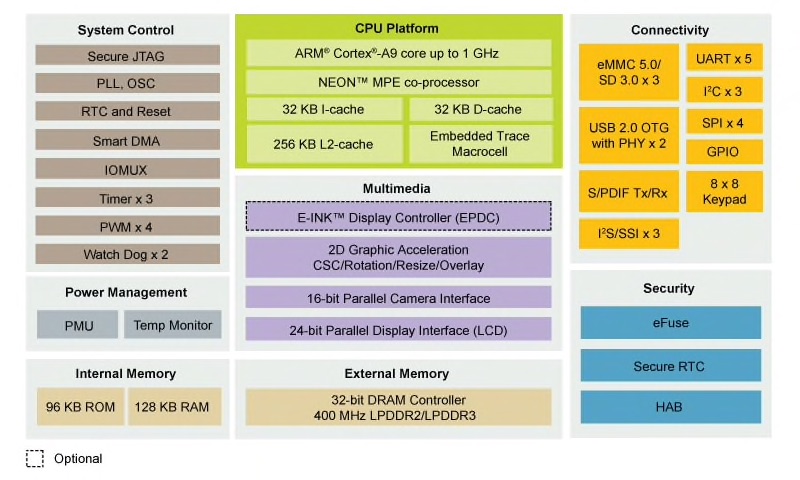
The NXP i.MX 6SLL or i.MX6SLL (i.MX 6 Series, MCIMX6V7DVN10AB Part Number) is a single core processor for e-readers. It integrates a single ARM Cortex-A9 processor core clocked at up to 1 GHz and a 2D graphics accelerator called Pixel Processor PXP (including E-INK display controller EPDC with support of up to 2332x1650 and 5-bit greyscale). The integrated memory controller supports up to 400 MHz LPDDR2 or LPDDR3 (32-bit interface). Flash memory can be attached using eMMC 5.0 or SD 3.0 (three connections available). Furthermore, the SoC supports 2x USB 2.0 OTH with PHY. The chip is pin-compatible with the i.MX 6SoloLite which features an additional Vivante GC320 graphics card. WiFi, Bluetooth, GPS or other peripherals have to be connected with external chips.

Marvell PXA986

► remove from comparison Marvell Technology Group PXA986

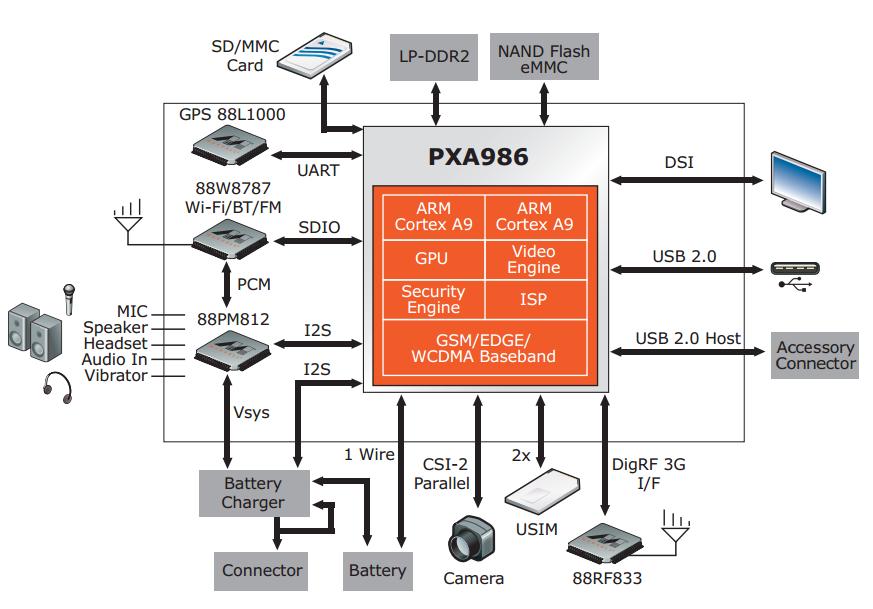
The Marvell PXA986 is an ARM based dual-core SoC for smartphones and tablets (mostly Android based). It contains two Cortex-A9 CPU cores usually clocked around 1.2 GHz and a Vivante GC1000 graphics card. The integrated video processor is able to handle 720p30 content in H.263, H.264 BP and MPEG4 SP encoding. Furthermore, a GSM/EDGE/WCDMA/HSDPA radio is included in the chip.

Broadcom BCM21664T

► remove from comparison Broadcom BCM21664T

The Broadcom BCM21664T is an ARM based entry-level SoC for smartphones that integrates two Cortex-A9 CPU cores clocked at up to 1.2 GHz and a HSPA+ modem with support for 21 Mbps HSDPA and 5.8 Mbps HSUPA. Furthermore, a VideoCore-IV GPU and a video decoder (H.264 1080p capable) and encoder (720p) are built into the SoC.

ModelNXP i.MX 6SLLMarvell PXA986Broadcom BCM21664T
Series Marvell Technology Group Broadcom
CodenameCortex-A9Cortex-A9Cortex-A9
Series: Cortex-A9
HiSilicon Kirin 910T1.8 GHz4 / 4 cores Cortex-A9
Rockchip RK31881.8 GHz4 / 4 cores Cortex-A9
HiSilicon Kirin 9101.6 GHz4 / 4 cores Cortex-A9
Renesas MP52321.5 GHz2 / 2 cores Cortex-A9
Broadcom BCM21664T1.2 GHz2 / 2 cores Cortex-A9
Marvell PXA9861.2 GHz2 / 2 cores Cortex-A9
NXP i.MX 6SLL « 1 GHz1 / 1 cores Cortex-A9
WonderMedia PRIZM WM89501 GHz1 / 1 cores Cortex-A9
HiSilicon Kirin 910T1.8 GHz4 / 4 cores Cortex-A9
Rockchip RK31881.8 GHz4 / 4 cores Cortex-A9
HiSilicon Kirin 9101.6 GHz4 / 4 cores Cortex-A9
Renesas MP52321.5 GHz2 / 2 cores Cortex-A9
Broadcom BCM21664T1.2 GHz2 / 2 cores Cortex-A9
Marvell PXA986 « 1.2 GHz2 / 2 cores Cortex-A9
NXP i.MX 6SLL1 GHz1 / 1 cores Cortex-A9
WonderMedia PRIZM WM89501 GHz1 / 1 cores Cortex-A9
HiSilicon Kirin 910T1.8 GHz4 / 4 cores Cortex-A9
Rockchip RK31881.8 GHz4 / 4 cores Cortex-A9
HiSilicon Kirin 9101.6 GHz4 / 4 cores Cortex-A9
Renesas MP52321.5 GHz2 / 2 cores Cortex-A9
Broadcom BCM21664T « 1.2 GHz2 / 2 cores Cortex-A9
Marvell PXA9861.2 GHz2 / 2 cores Cortex-A9
NXP i.MX 6SLL1 GHz1 / 1 cores Cortex-A9
WonderMedia PRIZM WM89501 GHz1 / 1 cores Cortex-A9
Clock1000 MHz1200 MHz1200 MHz
L1 Cache64 KB
L2 Cache256 KB
Cores / Threads1 / 12 / 22 / 2
Technology40 nm45 nm
Features32-Bit DRAM Controller 400 MHz LPDDR2/LPDDR3, E-INK Display Controller, 2D Graphics Acceleration, eMMC 5.0, USB 2.0 OTGHSPA+ modem, H.264 1080p decoder, 720p encoder
iGPUNXP PXP
ArchitectureARMARMARM
Announced
Manufacturerwww.nxp.comwww.marvell.com

Benchmarks

3DMark - 3DMark Ice Storm Physics
100%
1 PXA986 +
min: 2623     avg: 2874     median: 2740 (2%)     max: 3258 Points
3801 Points (3%)
3DMark - 3DMark Ice Storm Extreme Physics
100%
1 PXA986 +
min: 2709     avg: 2985     median: 2985 (2%)     max: 3261 Points
3846 Points (3%)
3DMark - 3DMark Ice Storm Unlimited Physics
100%
1 PXA986 +
3675 Points (3%)
Geekbench 3 - Geekbench 3 32 Bit Multi-Core
100%
1 PXA986 +
min: 631     avg: 647     median: 646.5 (1%)     max: 662 Points
658 Points (1%)
Geekbench 3 - Geekbench 3 32 Bit Single-Core
100%
1 PXA986 +
min: 376     avg: 379.5     median: 379.5 (7%)     max: 383 Points
353 Points (7%)
Geekbench 2 - 32 Bit - Geekbench Stream
100%
1 PXA986 +
min: 437     avg: 439.5     median: 439.5 (4%)     max: 442 Points
Geekbench 2 - 32 Bit - Geekbench Memory
100%
1 PXA986 +
min: 1337     avg: 1448     median: 1448 (13%)     max: 1559 Points
Geekbench 2 - 32 Bit - Geekbench Floating Point
100%
1 PXA986 +
min: 1275     avg: 1284     median: 1284 (3%)     max: 1293 Points
Geekbench 2 - 32 Bit - Geekbench Integer
100%
1 PXA986 +
min: 709     avg: 720     median: 720 (1%)     max: 731 Points
Geekbench 2 - 32 Bit - Geekbench Total Score
100%
1 PXA986 +
min: 1005     avg: 1035     median: 1034.5 (3%)     max: 1064 Points
Linpack Android / IOS - Linpack Multi Thread
100%
1 PXA986 +
min: 73.7     avg: 74.3     median: 74 (3%)     max: 75.3 MFLOPS
75.7 MFLOPS (3%)
Linpack Android / IOS - Linpack Single Thread
100%
1 PXA986 +
min: 39.83     avg: 41.6     median: 41.4 (4%)     max: 43.69 MFLOPS
15.8 MFLOPS (2%)
Mozilla Kraken 1.1 - Kraken 1.1 Total Score *
100%
1 PXA986 +
min: 23941     avg: 25315     median: 25315 (30%)     max: 26689 ms
16763 ms (20%)
Sunspider - Sunspider 1.0 Total Score *
6771 ms (74%)
min: 1428     avg: 1608     median: 1624 (18%)     max: 1771 ms
1316 ms (14%)
Sunspider - Sunspider 0.9.1 Total Score *
100%
1 PXA986 +
min: 1453     avg: 1531     median: 1530.5 (15%)     max: 1608 ms
1348 ms (13%)
Octane V2 - Octane V2 Total Score
100%
1 PXA986 +
1448 Points (1%)
2121 Points (2%)
Quadrant Standard Edition 2.0 - Quadrant Standard 2.0 Total Score
100%
1 PXA986 +
min: 3257     avg: 3515     median: 3514.5 (8%)     max: 3772 points
3490 points (8%)
AnTuTu v3 - AnTuTu v3 CPU
100%
1 PXA986 +
2945 Points (19%)
AnTuTu v4 - AnTuTu v4 Total Score
100%
1 PXA986 +
min: 11051     avg: 11392     median: 11392 (26%)     max: 11733 Points
12059 Points (28%)
AndEBench - AndEBench Java
100%
1 PXA986 +
min: 137     avg: 160     median: 159 (5%)     max: 184 Iter./s
180 Iter./s (6%)
AndEBench - AndEBench Native
100%
1 PXA986 +
min: 4077     avg: 4208     median: 4266 (14%)     max: 4281 Iter./s
4041 Iter./s (13%)
PassMark PerformanceTest Mobile V1 - PerformanceTest Mobile V1 CPU Tests
100%
1 PXA986 +
min: 3273     avg: 3820     median: 3976 (1%)     max: 4210 Points
4230 Points (1%)

Average Benchmarks NXP i.MX 6SLL → 100% n=1

Average Benchmarks Marvell PXA986 → 319% n=1

Average Benchmarks Broadcom BCM21664T → 332% n=1

- Range of benchmark values for this graphics card
- Average benchmark values for this graphics card
* Smaller numbers mean a higher performance
1 This benchmark is not used for the average calculation

v1.26
log 23. 11:10:34

#0 checking url part for id 11524 +0s ... 0s

#1 checking url part for id 4461 +0s ... 0s

#2 checking url part for id 5948 +0s ... 0s

#3 not redirecting to Ajax server +0s ... 0s

#4 did not recreate cache, as it is less than 5 days old! Created at Tue, 23 Apr 2024 05:40:15 +0200 +0.001s ... 0.001s

#5 composed specs +0.103s ... 0.103s

#6 did output specs +0s ... 0.104s

#7 getting avg benchmarks for device 11524 +0.003s ... 0.106s

#8 got single benchmarks 11524 +0.007s ... 0.113s

#9 getting avg benchmarks for device 4461 +0.003s ... 0.116s

#10 got single benchmarks 4461 +0.01s ... 0.126s

#11 getting avg benchmarks for device 5948 +0.003s ... 0.129s

#12 got single benchmarks 5948 +0.006s ... 0.135s

#13 got avg benchmarks for devices +0s ... 0.135s

#14 min, max, avg, median took s +0.095s ... 0.231s

#15 return log +0s ... 0.231s

Please share our article, every link counts!
> Expert Reviews and News on Laptops, Smartphones and Tech Innovations > Benchmarks / Tech > Processor Comparison - Head 2 Head
Redaktion, 2017-09- 8 (Update: 2023-07- 1)