Notebookcheck Logo

Intel Core i9-10900K vs Intel Core i9-10910 vs Intel Core i5-10600K

Intel Core i9-10900K

► remove from comparison Intel i9-10900K

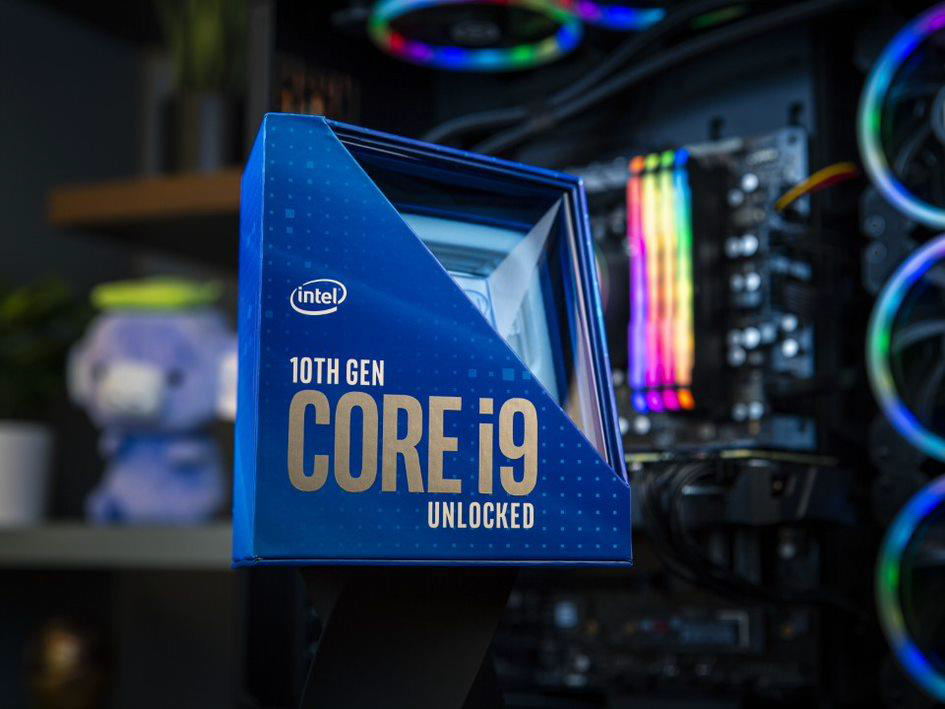
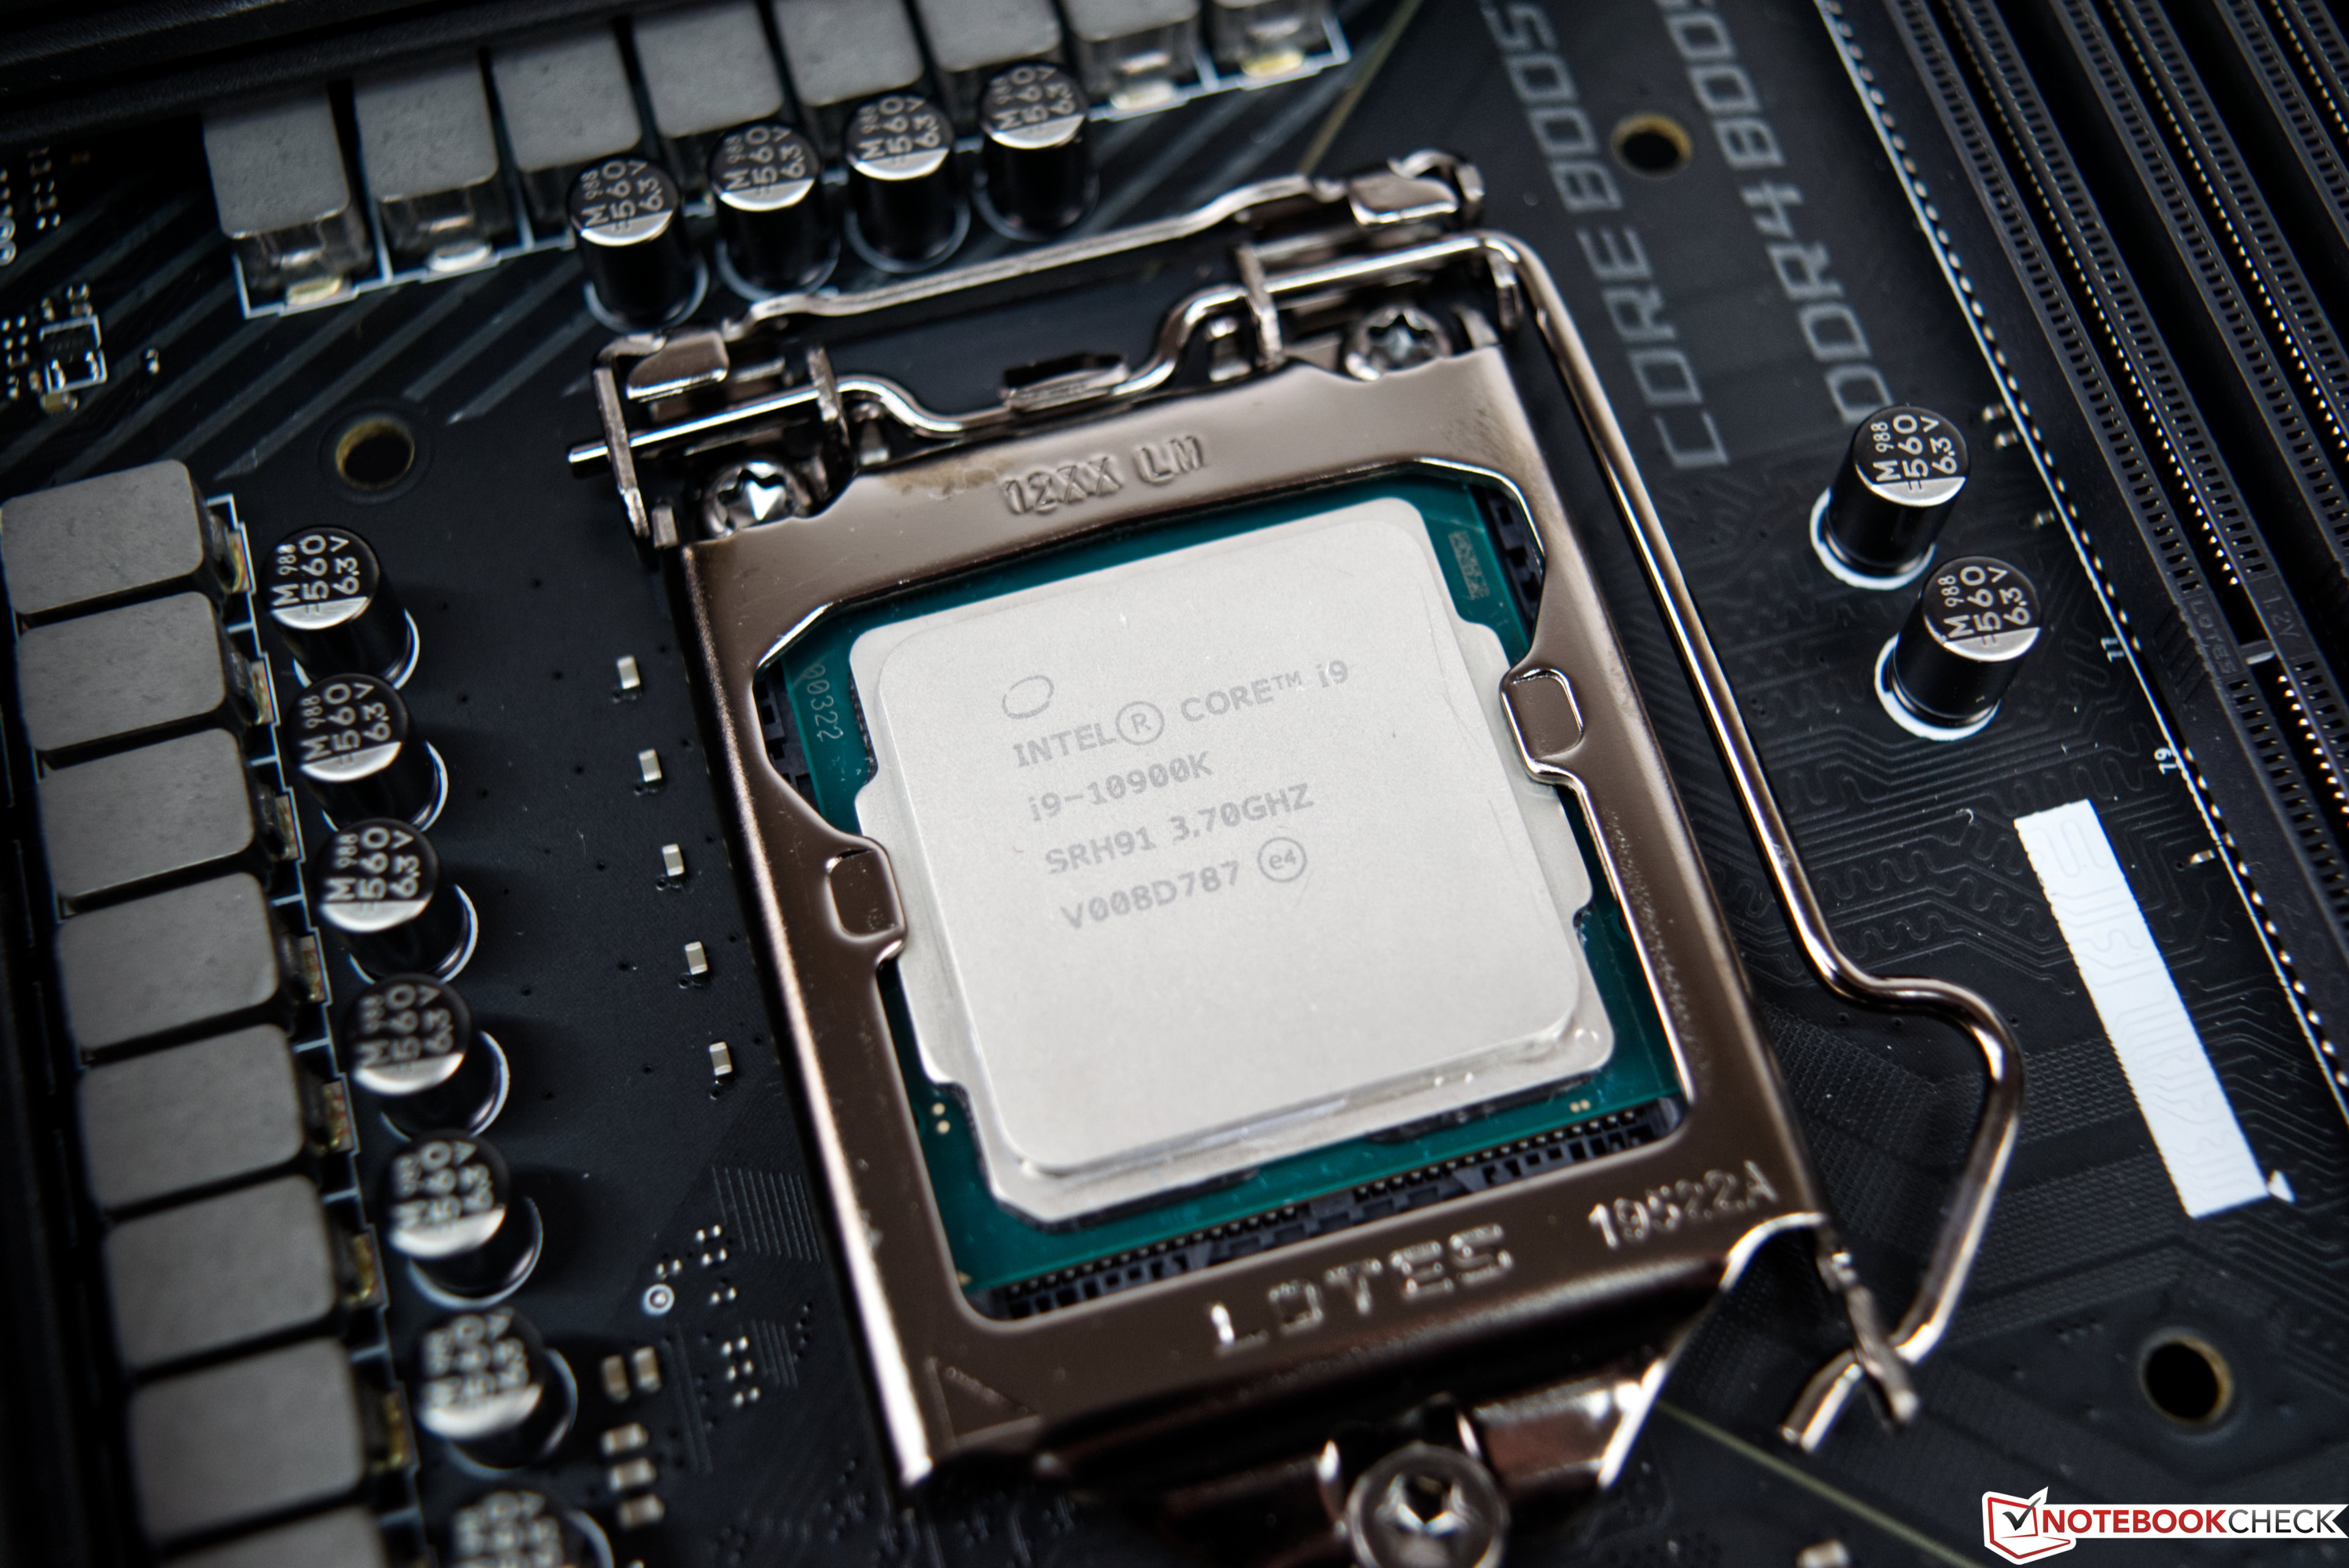
The Intel Core i9-10900K is a high-end processor for desktops with ten cores based on the Comet Lake architecture (CML-S, 4th generation of Skylake). The processor clocks at between 3.7 and 5.3 GHz (all 10 cores up to 4.8 GHz) and can execute up to twenty threads simultaneously thanks to Hyper-Threading. The 5.3 GHz can be only achieved below 70°C core temperature (Thermal Velocity Boost of 100 MHz).

The processor is still manufactured in the old 14nm (14nm++) process. Compared to the predecessor, the Core i9-9900K, the 10900K offers increased clock speeds and two more cores. Thanks to the free multiplicator, the CPU can also be easily overclocked (but may not have much headroom).

The Comet Lake architecture is similar to Coffee Lake and offers the same features and is produced in the same 14nm process. Other than the improved clock rates, the memory controller now also supports faster DDR4-2933 RAM. More information on Comet Lake and all the models and articles on it can be found here.

Performance

Thanks to the high Turbo Boost, the CPU is the fastest gaming CPU available at the time of announcement. Using all cores, the i9 however is slower than the top Ryzen CPUs (like the Ryzen 9 3950X) which offer more cores.

Graphics

The integrated Intel UHD Graphics 630 iGPU is supposed to offer a similar performance as the UHD630 in the Core i7-9900K. As a  low-end solution it will only run current games smoothly at reduced details - if at all.

Power Consumption

Intel specifies the TDP with 125 Watts (PL1) but under full load up to 250 Watt are consumed (PL2). In default mode these 250 Watt and therefore high clock speeds can be maintained for up to 56 seconds, however, all boards offer the option to alter these settings.

Intel Core i9-10910

► remove from comparison Intel i9-10910

The Intel Core i9-10910 is a high-end processor for desktops with ten cores based on the Comet Lake architecture (CML-S, 4th generation of Skylake). The processor clocks at between 3.6 and 5.0 GHz (all 10 cores up to 4.6 GHz) and can execute up to twenty threads simultaneously thanks to Hyper-Threading. The 5.0 GHz can be only achieved below 70°C core temperature (Thermal Velocity Boost of 100 MHz).

The processor is still manufactured in the old 14nm (14nm++) process. Compared to the predecessor, the Core i9-9900K, the 10900K offers increased clock speeds and two more cores.

The Comet Lake architecture is similar to Coffee Lake and offers the same features and is produced in the same 14nm process. Other than the improved clock rates, the memory controller now also supports faster DDR4-2933 RAM. More information on Comet Lake and all the models and articles on it can be found here.

Performance

Thanks to the high Turbo Boost, the CPU is the fastest gaming CPU available at the time of announcement. Using all cores, the i9 however is slower than the top Ryzen CPUs (like the Ryzen 9 3950X) which offer more cores.

Graphics

The integrated Intel UHD Graphics 630 iGPU is supposed to offer a similar performance as the UHD630 in the Core i7-9900K. As a  low-end solution it will only run current games smoothly at reduced details - if at all.

Power Consumption

Intel specifies the TDP with 125 Watts (PL1) but under full load up to 250 Watt are consumed (PL2). In default mode these 250 Watt and therefore high clock speeds can be maintained for up to 56 seconds, however, all boards offer the option to alter these settings.

Intel Core i5-10600K

► remove from comparison Intel i5-10600K

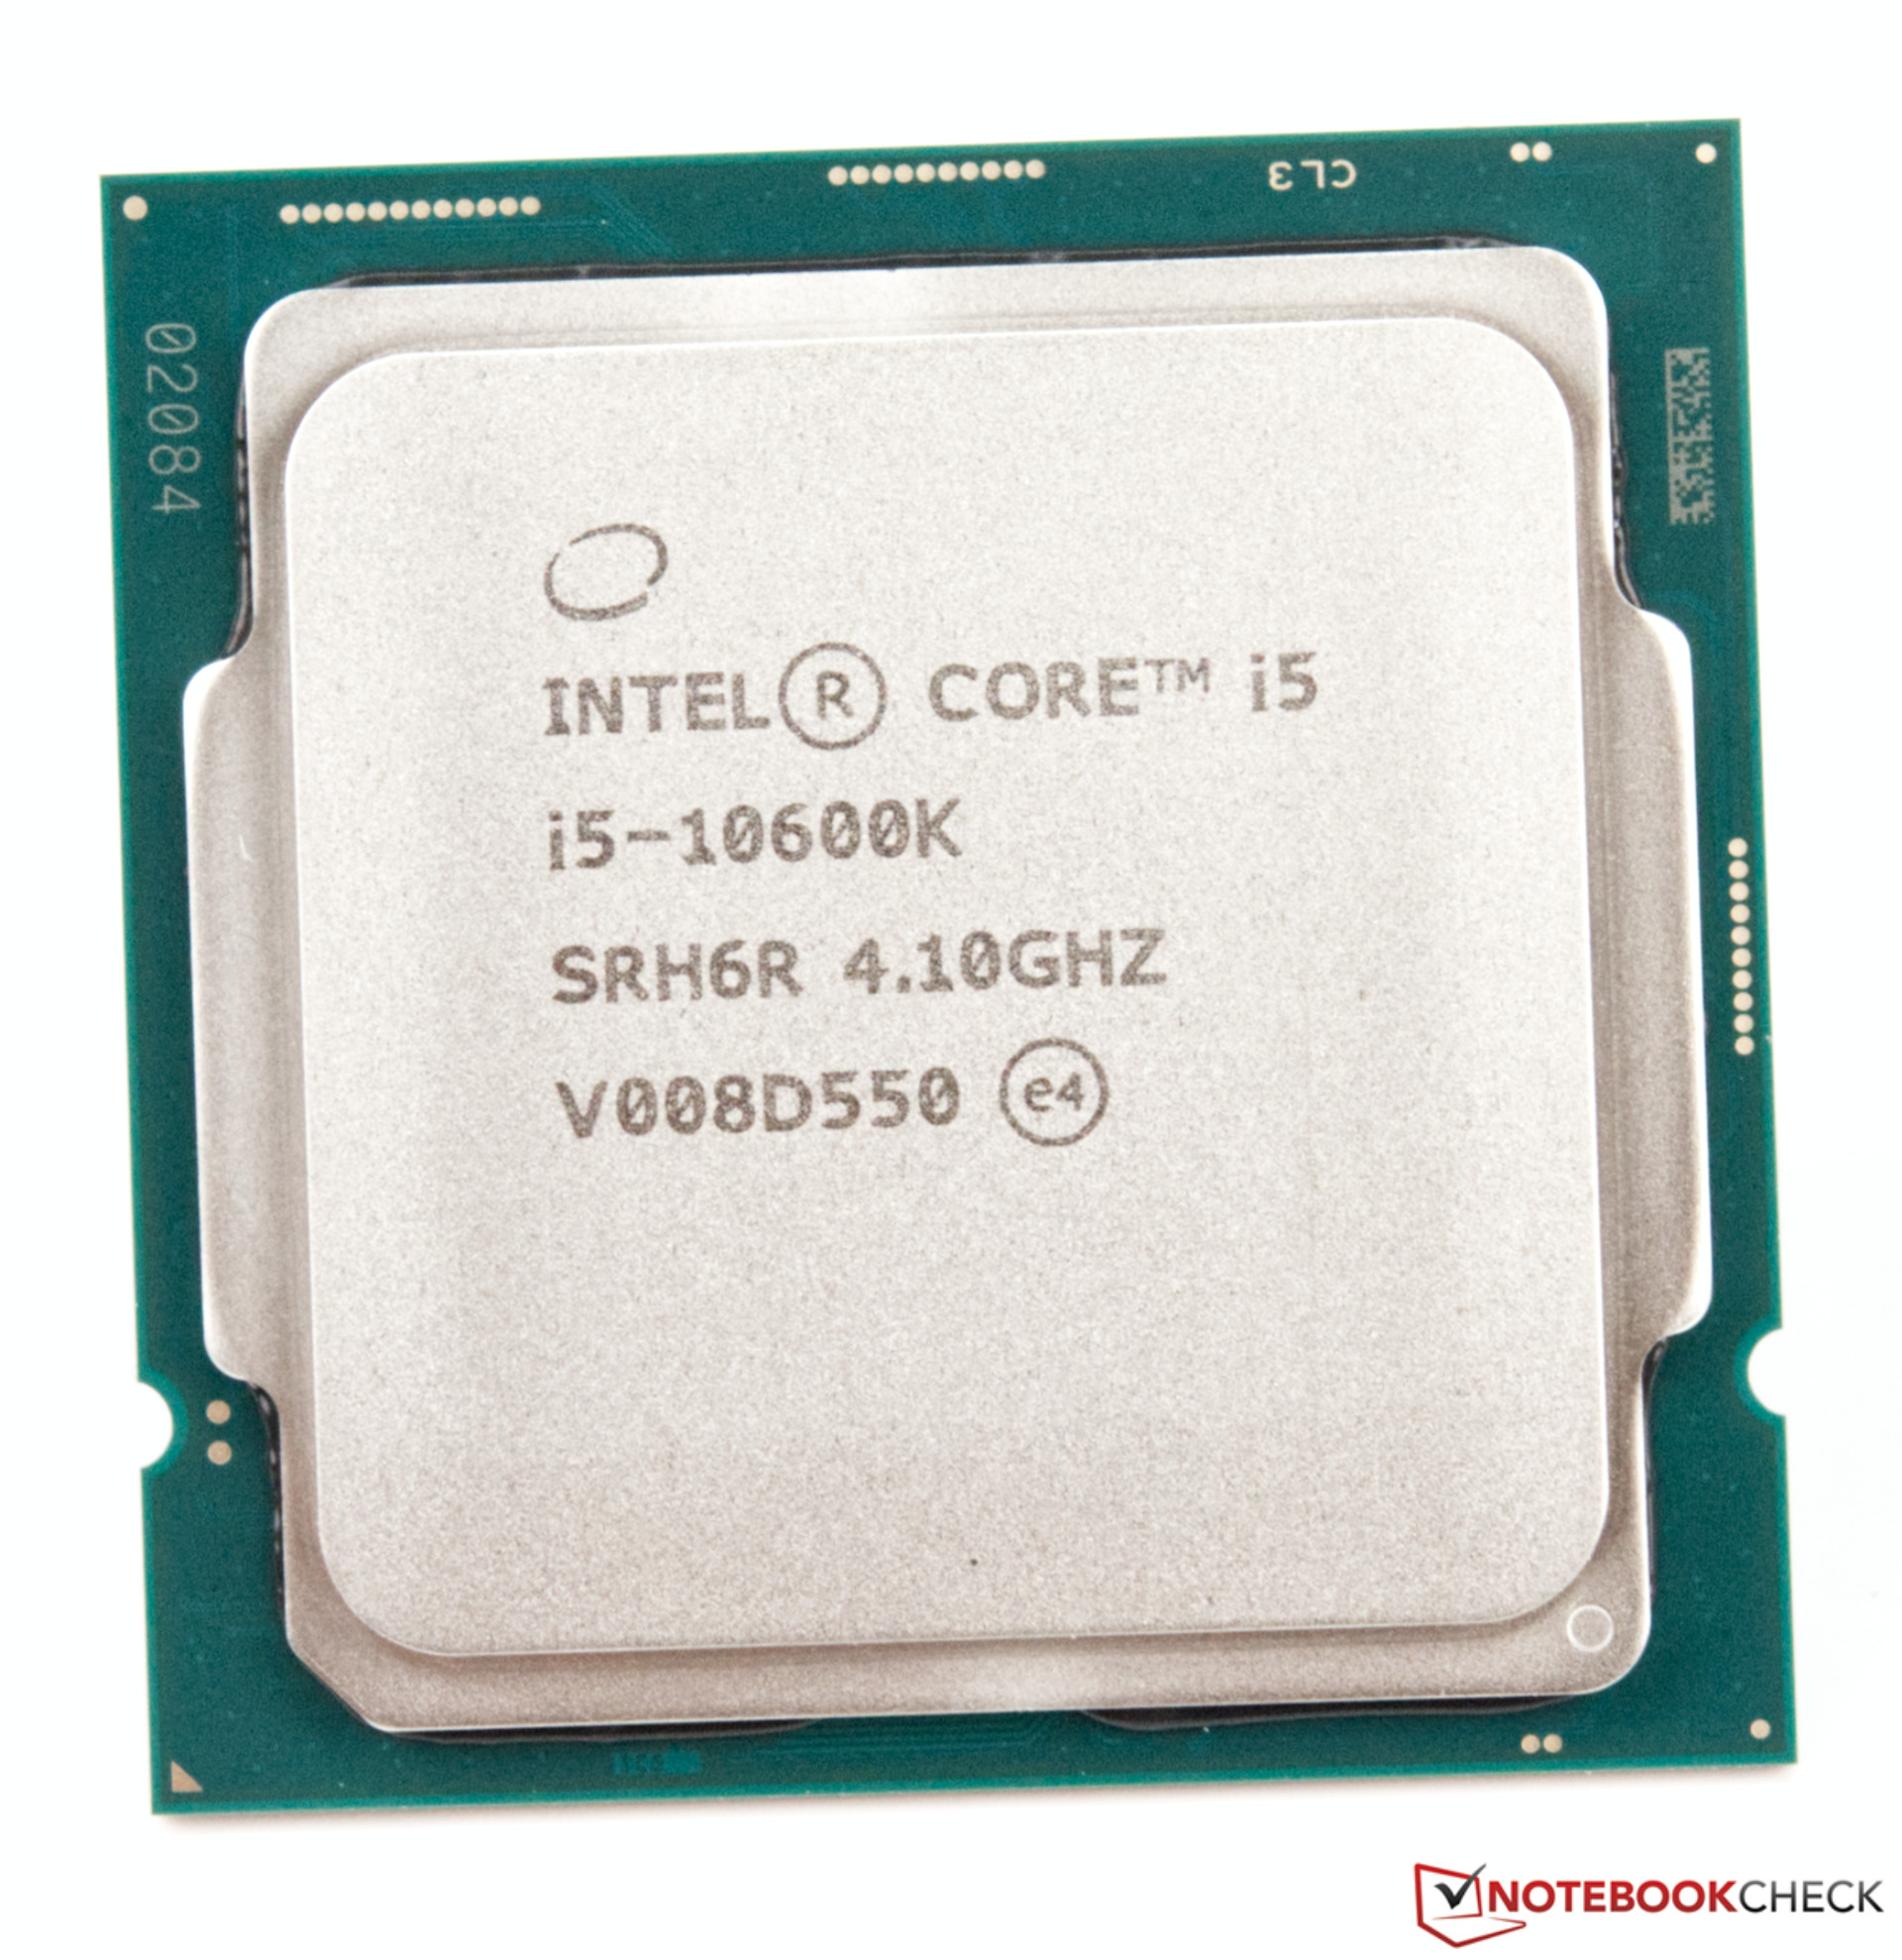
The Intel Core i5-10600K is a mid-range processor for desktops with six cores based on the Comet Lake architecture (CML-S, 4th generation of Skylake). The processor clocks at between 4.1 and 4.8 GHz and can execute up to twelfe threads simultaneously thanks to Hyper-Threading. 

The processor is still manufactured in the old 14nm (14nm++) process. Thanks to the free multiplicator, the CPU can also be easily overclocked (but may not have much headroom).

The Comet Lake architecture is similar to Coffee Lake and offers the same features and is produced in the same 14nm process. Other than the improved clock rates, the memory controller now also supports faster DDR4-2933 RAM. More information on Comet Lake and all the models and articles on it can be found here.

Performance

Thanks to the high clock speeds (and possible TDP settings with most mainboards), the Core i5-10600K offers a similar speed than the old Core i7-9700K quad core. Compared to current AMD offerings, the multi-core performance is on par with a Ryzen 5 3600, single core and gaming performance with a faster Ryzen 9 3900.

Graphics

The integrated Intel UHD Graphics 630 iGPU is supposed to offer a similar performance as the UHD630 in the Core i7-9900K. As a  low-end solution it will only run current games smoothly at reduced details - if at all.

Power Consumption

Intel specifies the TDP with 125 Watts (PL1) but under full load up to 250 Watt are consumed (PL2). In default mode these 250 Watt and therefore high clock speeds can be maintained for up to 56 seconds, however, all boards offer the option to alter these settings.

ModelIntel Core i9-10900KIntel Core i9-10910Intel Core i5-10600K
SeriesIntel Comet LakeIntel Comet LakeIntel Comet Lake
CodenameComet LakeComet Lake-SComet Lake
Series: Comet Lake Comet Lake
Intel Core i9-10900K « 3.7 - 5.3 GHz10 / 20 cores20 MB L3
Intel Core i7-10700K3.8 - 5.1 GHz8 / 16 cores16 MB L3
Intel Core i7-107002.9 - 4.8 GHz8 / 16 cores16 MB L3
Intel Core i5-10600K4.1 - 4.8 GHz6 / 12 cores12 MB L3
Intel Core i5-10400F2.9 - 4.3 GHz6 / 12 cores12 MB L3
Intel Core i3-10100F3.6 - 4.3 GHz4 / 8 cores6 MB L3
Intel Core i9-10850K3.6 - 5.2 GHz10 / 20 cores20 MB L3
Intel Core i9-10910 « 3.6 - 5 GHz10 / 20 cores20 MB L3
Intel Core i3-103203.8 - 4.6 GHz4 / 8 cores7.9 MB L3
Intel Core i3-101003.6 - 4.3 GHz4 / 8 cores6 MB L3
Intel Core i9-10900K3.7 - 5.3 GHz10 / 20 cores20 MB L3
Intel Core i7-10700K3.8 - 5.1 GHz8 / 16 cores16 MB L3
Intel Core i7-107002.9 - 4.8 GHz8 / 16 cores16 MB L3
Intel Core i5-10600K « 4.1 - 4.8 GHz6 / 12 cores12 MB L3
Intel Core i5-10400F2.9 - 4.3 GHz6 / 12 cores12 MB L3
Intel Core i3-10100F3.6 - 4.3 GHz4 / 8 cores6 MB L3
Clock3700 - 5300 MHz3600 - 5000 MHz4100 - 4800 MHz
L1 Cache640 KB640 KB384 KB
L2 Cache2.5 MB2.5 MB1.5 MB
L3 Cache20 MB20 MB12 MB
Cores / Threads10 / 2010 / 206 / 12
TDP125 Watt125 Watt125 Watt
Technology14 nm14 nm14 nm
max. Temp.100 °C100 °C100 °C
SocketLGA1200LGA 1200LGA1200
FeaturesDDR4-2933 RAM, PCIe 3, 8 GT/s bus, vPro, MMX, SSE, SSE2, SSE3, SSSE3, SSE4.1, SSE4.2, AVX, AVX, BMI2, ABM, FMA, ADX, VMX, SMX, SMEP, SMAP, MPX, EIST, TM1, TM2, HT, Turbo, SST, AES-NI, RDRAND, RDSEED, SGXTVB, HyperThreading, AVX, AVX2, FMA3, Quick Sync, VirtualizationDDR4-2666 RAM, PCIe 3, 8 GT/s bus, vPro, MMX, SSE, SSE2, SSE3, SSSE3, SSE4.1, SSE4.2, AVX, AVX2, BMI2, ABM, FMA, ADX, VMX, SMX, SMEP, SMAP, MPX, EIST, TM1, TM2, HT, Turbo, SST, AES-NI, RDRAND, RDSEED, SGX
iGPUIntel UHD Graphics 630 (350 - 1200 MHz)Intel UHD Graphics 630Intel UHD Graphics 630 (350 - 1200 MHz)
Architecturex86x86x86
$488 U.S.$488 U.S.$262 U.S.
Announced
Manufacturerark.intel.comark.intel.com

Benchmarks

Performance Rating - CB R15 + R20 + 7-Zip + X265 + Blender + 3DM11 CPU - i9-10900K
40.4 pt (56%)
Performance Rating - CB R15 + R20 + 7-Zip + X265 + Blender + 3DM11 CPU - i9-10910
38.8 pt (54%)
Performance Rating - CB R15 + R20 + 7-Zip + X265 + Blender + 3DM11 CPU - i5-10600K
35.1 pt (49%)
Cinebench R23 - Cinebench R23 Multi Core
15821 Points (15%)
10475 Points (10%)
Cinebench R23 - Cinebench R23 Single Core
1374 Points (58%)
1385 Points (59%)
Cinebench R20 - Cinebench R20 CPU (Single Core)
min: 493     avg: 516     median: 524 (58%)     max: 532 Points
501 Points (56%)
464 Points (52%)
Cinebench R20 - Cinebench R20 CPU (Multi Core)
min: 5825     avg: 6129     median: 6181 (15%)     max: 6381 Points
5196 Points (13%)
3443 Points (8%)
Cinebench R15 - Cinebench R15 CPU Multi 64 Bit
min: 2513     avg: 2555     median: 2533 (16%)     max: 2620 Points
2302 Points (15%)
1452 Points (9%)
Cinebench R15 - Cinebench R15 CPU Single 64 Bit
min: 206     avg: 215.7     median: 217 (65%)     max: 224 Points
215 Points (65%)
205 Points (62%)
Cinebench R11.5 - Cinebench R11.5 CPU Multi 64 Bit
29 Points (38%)
25.6 Points (33%)
15.8 Points (21%)
Cinebench R11.5 - Cinebench R11.5 CPU Single 64 Bit
2.6 Points (64%)
2.4 Points (61%)
2.2 Points (54%)
Cinebench R10 - Cinebench R10 Rend. Single (32bit)
8127 Points (49%)
8131 Points (49%)
7343 Points (44%)
Cinebench R10 - Cinebench R10 Rend. Multi (32bit)
59368 Points (43%)
57842 Points (42%)
40074 Points (29%)
Cinebench R10 - Cinebench R10 Rend. Multi (64bit)
80495 Points (56%)
51816 Points (36%)
Cinebench R10 - Cinebench R10 Rend. Single (64bit)
10625 Points (13%)
9594 Points (12%)
wPrime 2.10 - wPrime 2.0 1024m *
66.3 s (1%)
113.2 s (1%)
wPrime 2.10 - wPrime 2.0 32m *
3.6 s (1%)
4.6 s (1%)
wPrime 1.55 - wPrime 1.55 1024m *
243.5 s (1%)
wPrime 1.55 - wPrime 1.55 32m *
7.8 s (4%)
WinRAR - WinRAR 4.0
9739 Points (15%)
8613 Points (14%)
6536 Points (10%)
7-Zip 18.03 - 7-Zip 18.03 Multli Thread 4 runs
min: 67252     avg: 69402     median: 69987 (40%)     max: 70968 MIPS
60747 MIPS (35%)
40379 MIPS (23%)
7-Zip 18.03 - 7-Zip 18.03 Single Thread 4 runs
min: 5349     avg: 5705     median: 5811 (69%)     max: 5954 MIPS
5690 MIPS (68%)
5289 MIPS (63%)
X264 HD Benchmark 4.0 - x264 Pass 2
149 fps (52%)
88.2 fps (31%)
X264 HD Benchmark 4.0 - x264 Pass 1
289.5 fps (67%)
251.5 fps (58%)
HWBOT x265 Benchmark v2.2 - HWBOT x265 4k Preset
min: 18.2     avg: 19.7     median: 19.8 (35%)     max: 21 fps
16.8 fps (30%)
12.2 fps (21%)
TrueCrypt - TrueCrypt Serpent
1.5 GB/s (0%)
0.8 GB/s (0%)
TrueCrypt - TrueCrypt Twofish
2.6 GB/s (45%)
1.4 GB/s (24%)
TrueCrypt - TrueCrypt AES
14.6 GB/s (38%)
8 GB/s (21%)
Blender - Blender 2.79 BMW27 CPU *
min: 167.3     avg: 178.8     median: 179 (1%)     max: 190 Seconds
208 Seconds (1%)
302.4 Seconds (2%)
R Benchmark 2.5 - R Benchmark 2.5 *
min: 0.528     avg: 0.5     median: 0.5 (11%)     max: 0.567 sec
0.5 sec (12%)
0.6 sec (13%)
Super Pi mod 1.5 XS 1M - Super Pi mod 1.5 XS 1M *
7.2 s (2%)
7.8 s (2%)
Super Pi mod 1.5 XS 2M - Super Pi mod 1.5 XS 2M *
16 s (1%)
16.8 s (1%)
17.5 s (1%)
Super Pi Mod 1.5 XS 32M - Super Pi mod 1.5 XS 32M *
403.4 s (2%)
432.5 s (2%)
438.7 s (2%)
3DMark 11 - 3DM11 Performance Physics
min: 20541     avg: 21539     median: 21935 (59%)     max: 22140 Points
18348 Points (50%)
15961 Points (43%)
3DMark - 3DMark Ice Storm Physics
74951 Points (61%)
68275 Points (55%)
3DMark - 3DMark Ice Storm Extreme Physics
75063 Points (61%)
68908 Points (56%)
3DMark - 3DMark Ice Storm Unlimited Physics
76898 Points (65%)
70668 Points (60%)
3DMark - 3DMark Cloud Gate Physics
min: 19766     avg: 20118     median: 20117.5 (51%)     max: 20469 Points
13014 Points (33%)
3DMark - 3DMark Fire Strike Standard Physics
min: 29145     avg: 29466     median: 29447 (53%)     max: 29805 Points
25520 Points (46%)
20040 Points (36%)
3DMark - 3DMark Time Spy CPU
min: 13028     avg: 13470     median: 13056 (55%)     max: 14326 Points
11771 Points (50%)
8290 Points (35%)
Geekbench 5.5 - Geekbench 5.1 - 5.4 64 Bit Single-Core
min: 1336     avg: 1404     median: 1428 (60%)     max: 1449 Points
1381 Points (58%)
1286 Points (54%)
Geekbench 5.5 - Geekbench 5.1 - 5.4 64 Bit Multi-Core
min: 10725     avg: 11177     median: 11393 (20%)     max: 11414 Points
10244 Points (18%)
7248 Points (13%)
Geekbench 5.0 - Geekbench 5.0 64 Bit Single-Core
min: 1330     avg: 1385     median: 1385 (6%)     max: 1440 Points
1281 Points (6%)
Geekbench 5.0 - Geekbench 5.0 64 Bit Multi-Core
min: 10714     avg: 11061     median: 11060.5 (35%)     max: 11407 Points
7237 Points (23%)
Geekbench 4.4 - Geekbench 4.1 - 4.4 64 Bit Single-Core
min: 5904     avg: 6126     median: 6126 (61%)     max: 6348 Points
5821 Points (58%)
Geekbench 4.4 - Geekbench 4.1 - 4.4 64 Bit Multi-Core
min: 40236     avg: 41647     median: 41647 (46%)     max: 43058 Points
28391 Points (32%)
Mozilla Kraken 1.1 - Kraken 1.1 Total Score *
min: 709     avg: 720     median: 721 (1%)     max: 729 ms
737 ms (1%)
760 ms (1%)
Octane V2 - Octane V2 Total Score
55976 Points (50%)
WebXPRT 3 - WebXPRT 3 Score
min: 243     avg: 251     median: 255 (53%)     max: 255 Points
236 Points (49%)
239 Points (50%)
Power Consumption - Prime95 Power Consumption - external Monitor *
275.7 Watt (48%)
204.4 Watt (35%)
Power Consumption - Cinebench R15 Multi Power Consumption - external Monitor *
268.5 Watt (49%)
172.5 Watt (31%)
Power Consumption - Cinebench R15 Multi Power Efficiency - external Monitor
9.8 Points per Watt (7%)
8.4 Points per Watt (6%)

Average Benchmarks Intel Core i9-10900K → 100% n=24

Average Benchmarks Intel Core i9-10910 → 94% n=24

Average Benchmarks Intel Core i5-10600K → 80% n=24

- Range of benchmark values for this graphics card
- Average benchmark values for this graphics card
* Smaller numbers mean a higher performance
1 This benchmark is not used for the average calculation

v1.26
log 19. 08:53:20

#0 checking url part for id 12211 +0s ... 0s

#1 checking url part for id 12832 +0s ... 0s

#2 checking url part for id 12212 +0s ... 0s

#3 not redirecting to Ajax server +0s ... 0s

#4 did not recreate cache, as it is less than 5 days old! Created at Fri, 19 Apr 2024 05:38:49 +0200 +0.001s ... 0.001s

#5 composed specs +0.033s ... 0.035s

#6 did output specs +0s ... 0.035s

#7 getting avg benchmarks for device 12211 +0.022s ... 0.057s

#8 got single benchmarks 12211 +0.021s ... 0.078s

#9 getting avg benchmarks for device 12832 +0.021s ... 0.099s

#10 got single benchmarks 12832 +0.011s ... 0.109s

#11 getting avg benchmarks for device 12212 +0.022s ... 0.131s

#12 got single benchmarks 12212 +0.011s ... 0.142s

#13 got avg benchmarks for devices +0s ... 0.142s

#14 min, max, avg, median took s +0.533s ... 0.675s

#15 return log +0s ... 0.675s

Please share our article, every link counts!
> Expert Reviews and News on Laptops, Smartphones and Tech Innovations > Benchmarks / Tech > Processor Comparison - Head 2 Head
Redaktion, 2017-09- 8 (Update: 2023-07- 1)