Intel Core i5-9600K vs Intel Core i3-9100F
Intel Core i5-9600K ► remove from comparison
The Intel Core i5-9600K is a high end desktop processor based on the Coffee Lake architecture. It offers an open multiplicator for easy overclocking and integrates 6 cores (no Hyperthreading therefore also 6 threads) clocked at 3.7 - 4.6 GHz and it needs a new Z390 based mainboard. It is manufactured in the second iteration of the improved 14nm process (14nm++).
Compared to the older Core i5-8600K, the 9600K offers about 10 to 15% higher performance. As the CPU still offers 6 cores and threads, the improvements are mostly due to the higher clock speeds. As a fast mid range desktop CPU, the i5-9600K is suited even for very demanding applications and perfect for 3D gaming.
The integrated Intel UHD Graphics 630 graphics card is clocked at up to 1.15 GHz and offers no advantage compared to previous generations. As it is a very low end GPU, only some low demanding games like Hearthstone can be played with it (see GPU page for benchmarks).
Intel specifies the TDP at 95 Watt, so if the CPU is used in laptops a big and chunky cooling system is needed to avoid throttling and lower clock speeds under sustained loads. When overclocking the CPU, the power consumption can easily rise up to 150 Watt and higher.
Intel Core i3-9100F ► remove from comparison
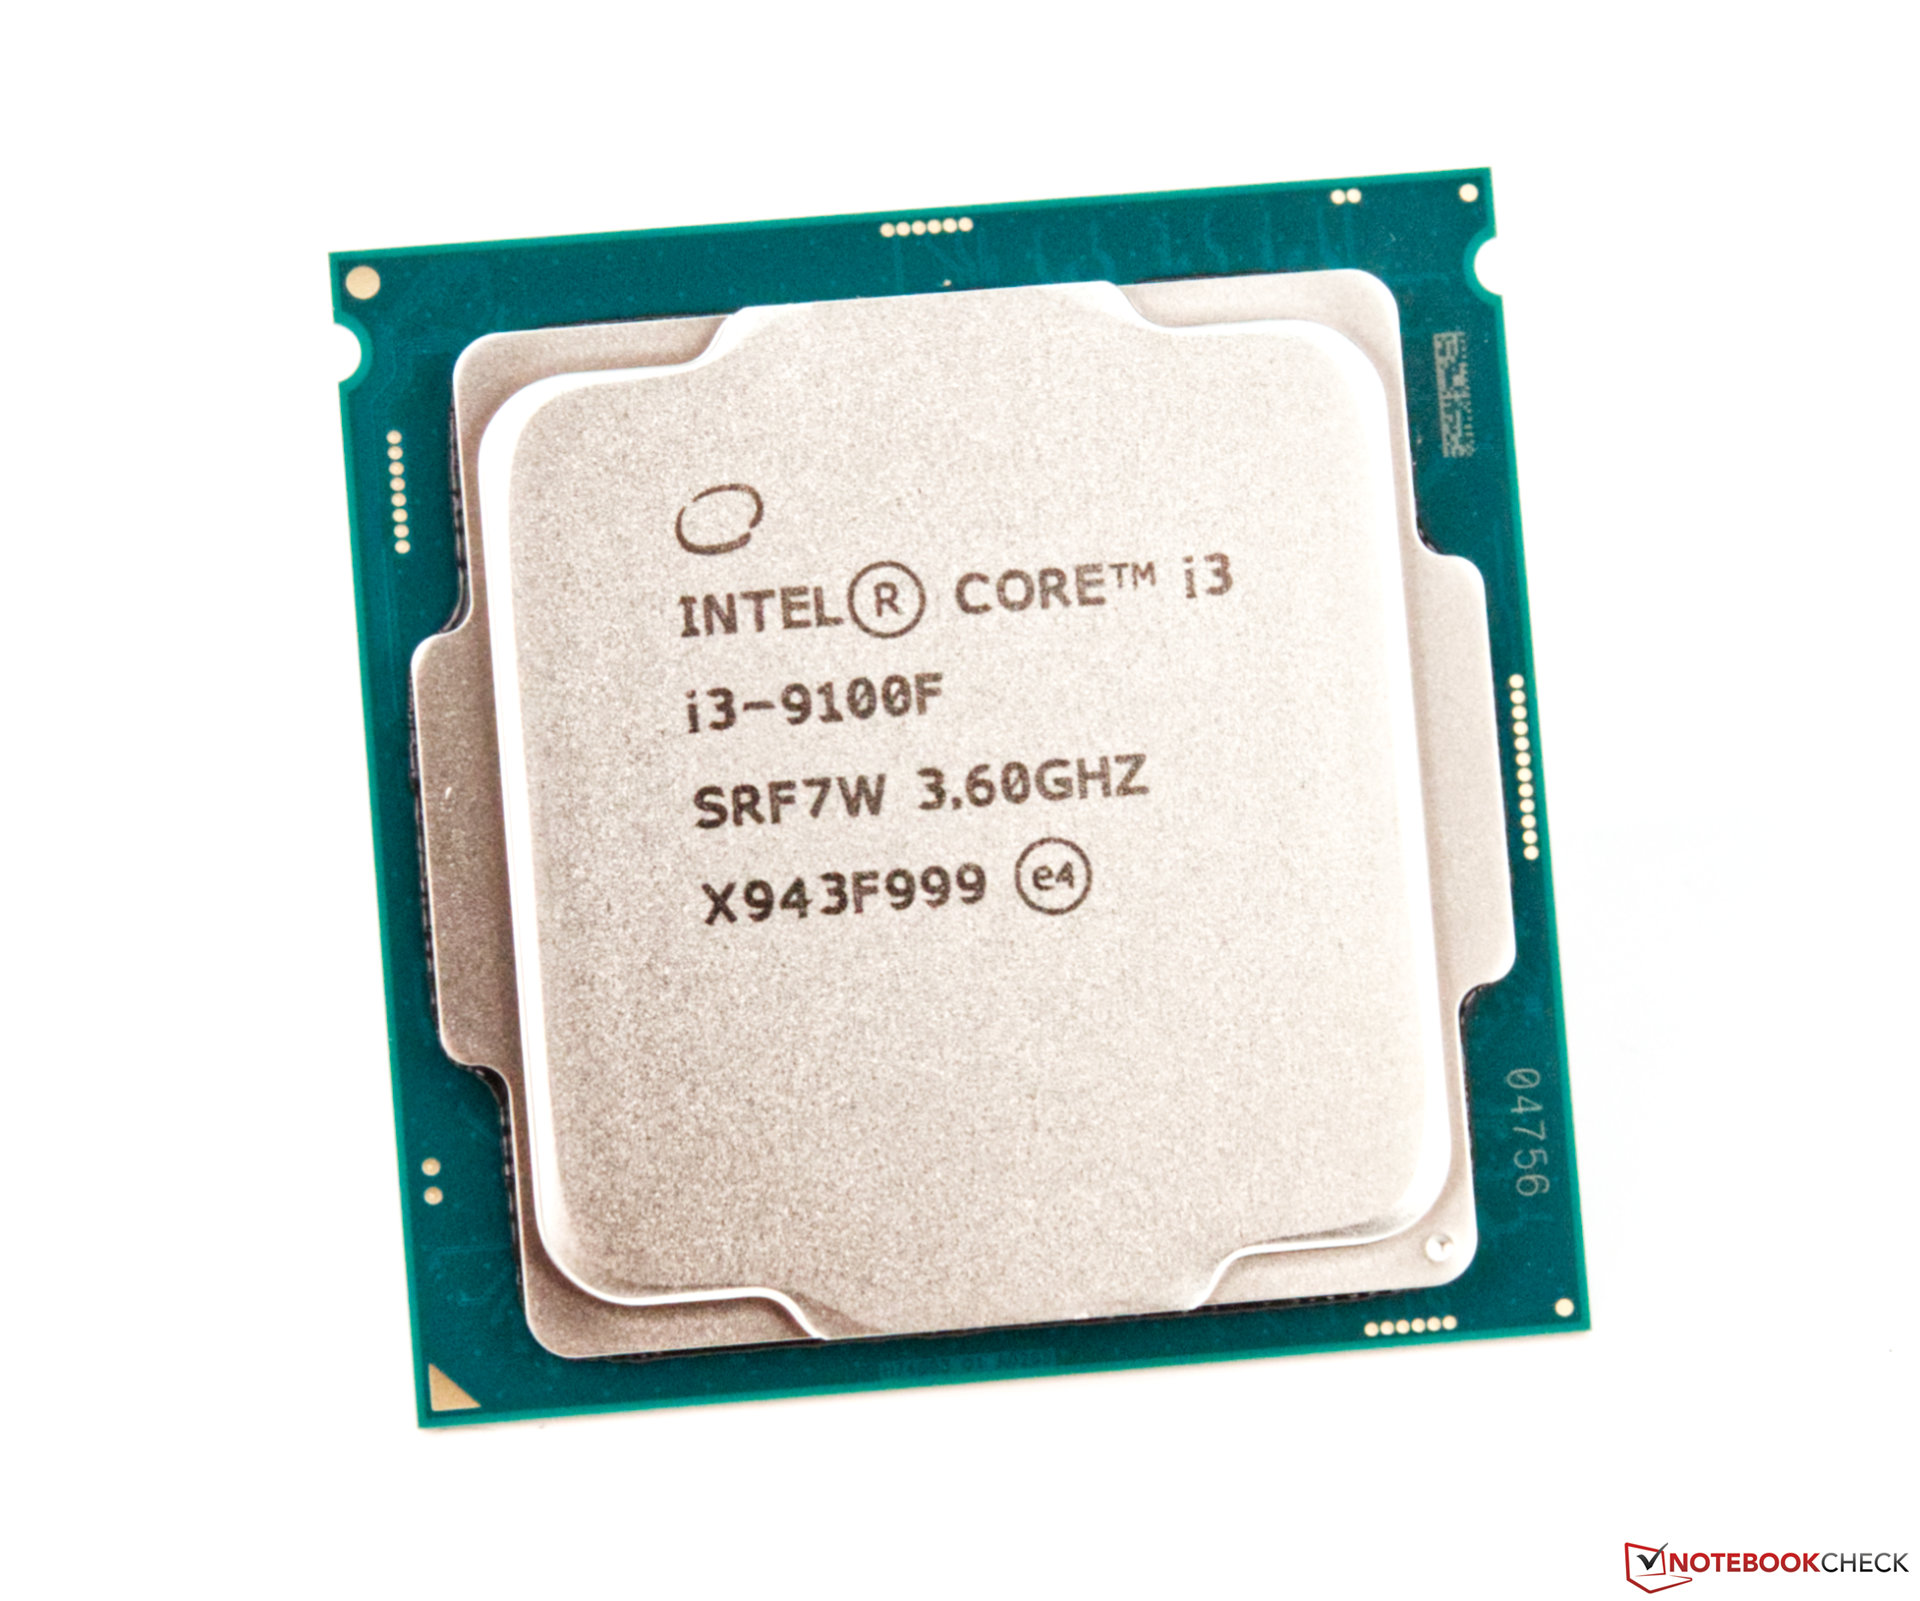
The Intel Core i3-9100F is an entry level Quad-Core processor for desktop PCs based on the Coffee Lake architecture. It offers four cores clocked at 3.6 - 4.2 GHz without HyperThreading / SMT support (4 threads only). The CPU is still manufactured in 14nm++ and does not feature an integrated graphics card.
Compared to the older Core i3-8100, the i3-9100F offers around 10 to 15 percent higher performance. Therefore, the CPU is well suited for simple office tasks but less for high end gaming or demanding applications.
Intel specifies the CPU with a TDP of 65 Watt. For desktops that means that the processor wont need big cooling solutions and can be used in small cases.
Model Intel Core i5-9600K Intel Core i3-9100F Series Intel Coffee Lake Intel Coffee Lake Codename Coffee Lake-R Coffee Lake-R Series: Coffee Lake Coffee Lake-R Clock 3700 - 4600 MHz 3600 - 4200 MHz L1 Cache 512 KB 256 KB L2 Cache 1.5 MB 1 MB L3 Cache 9 MB 6 MB Cores / Threads 6 / 6 4 / 4 TDP 95 Watt 65 Watt Technology 14++ nm 14 nm Die Size 178 mm2 126 mm2 max. Temp. 100 °C 100 °C Socket FCLGA1151 LGA 1151-2 Features Dual-Channel DDR4-2666 Memory Controller, HyperThreading, AVX, AVX2, AES-NI, TSX-NI, Quick Sync, Virtualization, vPro Dual-Channel DDR4-2400 Memory Controller, AVX, AVX2, AES-NI, TSX, Quick Sync, Virtualization iGPU Intel UHD Graphics 630 (350 - 1150 MHz)Architecture x86 x86 $262 U.S. $122 U.S. Announced Manufacturer ark.intel.com
Benchmarks Performance Rating - CB R15 + R20 + 7-Zip + X265 + Blender + 3DM11 CPU - i3-9100F
29.5 pt (41%)
...
...
Cinebench R20 - Cinebench R20 CPU (Single Core)
414 Points (46%)
Cinebench R20 - Cinebench R20 CPU (Multi Core)
1175 Points (3%)
Cinebench R15 - Cinebench R15 CPU Multi 64 Bit
1094 Points (7%)
Model CPU GPU RAM Value Intel Core i5-9600K, AMD Radeon RX Vega 64 i5-9600K RX Vega 64 1630 / 945 MHz 8 GB 16 GB 1094
634 Points (4%)
Cinebench R15 - Cinebench R15 CPU Single 64 Bit
193 Points (58%)
Model CPU GPU RAM Value Intel Core i5-9600K, AMD Radeon RX Vega 64 i5-9600K RX Vega 64 1630 / 945 MHz 8 GB 16 GB 193
171 Points (52%)
Cinebench R11.5 - Cinebench R11.5 CPU Multi 64 Bit
11 Points (14%)
Model CPU GPU RAM Value Intel Core i5-9600K, AMD Radeon RX Vega 64 i5-9600K RX Vega 64 1630 / 945 MHz 8 GB 16 GB 10.98
5.4 Points (7%)
Cinebench R11.5 - Cinebench R11.5 CPU Single 64 Bit
2.2 Points (56%)
Model CPU GPU RAM Value Intel Core i5-9600K, AMD Radeon RX Vega 64 i5-9600K RX Vega 64 1630 / 945 MHz 8 GB 16 GB 2.24
2 Points (49%)
Cinebench R10 - Cinebench R10 Rend. Single (32bit)
7205 Points (44%)
Model CPU GPU RAM Value Intel Core i5-9600K, AMD Radeon RX Vega 64 i5-9600K RX Vega 64 1630 / 945 MHz 8 GB 16 GB 7205
6509 Points (39%)
Cinebench R10 - Cinebench R10 Rend. Multi (32bit)
33950 Points (25%)
Model CPU GPU RAM Value Intel Core i5-9600K, AMD Radeon RX Vega 64 i5-9600K RX Vega 64 1630 / 945 MHz 8 GB 16 GB 33950
18118 Points (13%)
Cinebench R10 - Cinebench R10 Rend. Multi (64bit)
39494 Points (27%)
Model CPU GPU RAM Value Intel Core i5-9600K, AMD Radeon RX Vega 64 i5-9600K RX Vega 64 1630 / 945 MHz 8 GB 16 GB 39494
21908 Points (15%)
Cinebench R10 - Cinebench R10 Rend. Single (64bit)
9318 Points (11%)
Model CPU GPU RAM Value Intel Core i5-9600K, AMD Radeon RX Vega 64 i5-9600K RX Vega 64 1630 / 945 MHz 8 GB 16 GB 9318
8472 Points (10%)
wPrime 2.10 - wPrime 2.0 1024m *
176.2 s (2%)
Model CPU GPU RAM Value Intel Core i5-9600K, AMD Radeon RX Vega 64 i5-9600K RX Vega 64 1630 / 945 MHz 8 GB 16 GB 176.2
345.9 s (4%)
wPrime 2.10 - wPrime 2.0 32m *
6 s (1%)
Model CPU GPU RAM Value Intel Core i5-9600K, AMD Radeon RX Vega 64 i5-9600K RX Vega 64 1630 / 945 MHz 8 GB 16 GB 6.033
11.8 s (2%)
5903 Points (9%)
Model CPU GPU RAM Value Intel Core i5-9600K, AMD Radeon RX Vega 64 i5-9600K RX Vega 64 1630 / 945 MHz 8 GB 16 GB 5903
4052 Points (6%)
7-Zip 18.03 - 7-Zip 18.03 Multli Thread 4 runs
17150 MIPS (10%)
7-Zip 18.03 - 7-Zip 18.03 Single Thread 4 runs
4682 MIPS (56%)
X264 HD Benchmark 4.0 - x264 Pass 2
68.8 fps (24%)
Model CPU GPU RAM Value Intel Core i5-9600K, AMD Radeon RX Vega 64 i5-9600K RX Vega 64 1630 / 945 MHz 8 GB 16 GB 68.8
44.4 fps (15%)
X264 HD Benchmark 4.0 - x264 Pass 1
250 fps (58%)
Model CPU GPU RAM Value Intel Core i5-9600K, AMD Radeon RX Vega 64 i5-9600K RX Vega 64 1630 / 945 MHz 8 GB 16 GB 250
218 fps (50%)
HWBOT x265 Benchmark v2.2 - HWBOT x265 4k Preset
8 fps (14%)
Model CPU GPU RAM Value Intel Core i5-9600K, AMD Radeon RX Vega 64 i5-9600K RX Vega 64 1630 / 945 MHz 8 GB 16 GB 8.02
6.1 fps (11%)
TrueCrypt - TrueCrypt Serpent
0.4 GB/s (0%)
Model CPU GPU RAM Value Intel Core i5-9600K, AMD Radeon RX Vega 64 i5-9600K RX Vega 64 1630 / 945 MHz 8 GB 16 GB 0.43
0.3 GB/s (0%)
TrueCrypt - TrueCrypt Twofish
0.6 GB/s (11%)
Model CPU GPU RAM Value Intel Core i5-9600K, AMD Radeon RX Vega 64 i5-9600K RX Vega 64 1630 / 945 MHz 8 GB 16 GB 0.629
0.5 GB/s (9%)
TrueCrypt - TrueCrypt AES
5.6 GB/s (15%)
Model CPU GPU RAM Value Intel Core i5-9600K, AMD Radeon RX Vega 64 i5-9600K RX Vega 64 1630 / 945 MHz 8 GB 16 GB 5.6
3 GB/s (8%)
Blender - Blender 2.79 BMW27 CPU *
444.4 Seconds (3%)
Model CPU GPU RAM Value Intel Core i5-9600K, AMD Radeon RX Vega 64 i5-9600K RX Vega 64 1630 / 945 MHz 8 GB 16 GB 444.4
687 Seconds (5%)
R Benchmark 2.5 - R Benchmark 2.5 *
0.7 sec (14%)
3DMark 06 - CPU - 3DMark 06 - CPU
10974 Points (23%)
Model CPU GPU RAM Value Intel Core i5-9600K, AMD Radeon RX Vega 64 i5-9600K RX Vega 64 1630 / 945 MHz 8 GB 16 GB 10974
Super Pi mod 1.5 XS 1M - Super Pi mod 1.5 XS 1M *
7.7 s (2%)
Model CPU GPU RAM Value Intel Core i5-9600K, AMD Radeon RX Vega 64 i5-9600K RX Vega 64 1630 / 945 MHz 8 GB 16 GB 7.739
9.3 s (2%)
Super Pi mod 1.5 XS 2M - Super Pi mod 1.5 XS 2M *
17.4 s (1%)
Model CPU GPU RAM Value Intel Core i5-9600K, AMD Radeon RX Vega 64 i5-9600K RX Vega 64 1630 / 945 MHz 8 GB 16 GB 17.44
21 s (1%)
Super Pi Mod 1.5 XS 32M - Super Pi mod 1.5 XS 32M *
421.1 s (2%)
Model CPU GPU RAM Value Intel Core i5-9600K, AMD Radeon RX Vega 64 i5-9600K RX Vega 64 1630 / 945 MHz 8 GB 16 GB 421.1
495.5 s (2%)
3DMark Vantage - 3DM Vant. Perf. CPU no Physx
37593 Points (33%)
Model CPU GPU RAM Value Intel Core i5-9600K, AMD Radeon RX Vega 64 i5-9600K RX Vega 64 1630 / 945 MHz 8 GB 16 GB 37593
3DMark 11 - 3DM11 Performance Physics
11938 Points (32%)
Model CPU GPU RAM Value Intel Core i5-9600K, AMD Radeon RX Vega 64 i5-9600K RX Vega 64 1630 / 945 MHz 8 GB 16 GB 11938
8742 Points (24%)
3DMark - 3DMark Ice Storm Physics
78929 Points (64%)
Model CPU GPU RAM Value Intel Core i5-9600K, AMD Radeon RX Vega 64 i5-9600K RX Vega 64 1630 / 945 MHz 8 GB 16 GB 78929
68492 Points (56%)
3DMark - 3DMark Ice Storm Extreme Physics
78531 Points (64%)
Model CPU GPU RAM Value Intel Core i5-9600K, AMD Radeon RX Vega 64 i5-9600K RX Vega 64 1630 / 945 MHz 8 GB 16 GB 78531
68473 Points (56%)
3DMark - 3DMark Ice Storm Unlimited Physics
80235 Points (68%)
Model CPU GPU RAM Value Intel Core i5-9600K, AMD Radeon RX Vega 64 i5-9600K RX Vega 64 1630 / 945 MHz 8 GB 16 GB 80235
68727 Points (58%)
3DMark - 3DMark Cloud Gate Physics
9031 Points (23%)
Model CPU GPU RAM Value Intel Core i5-9600K, AMD Radeon RX Vega 64 i5-9600K RX Vega 64 1630 / 945 MHz 8 GB 16 GB 9031
6295 Points (16%)
3DMark - 3DMark Fire Strike Standard Physics
13701 Points (24%)
Model CPU GPU RAM Value Intel Core i5-9600K, AMD Radeon RX Vega 64 i5-9600K RX Vega 64 1630 / 945 MHz 8 GB 16 GB 13701
8958 Points (16%)
3DMark - 3DMark Time Spy CPU
6071 Points (26%)
Model CPU GPU RAM Value Intel Core i5-9600K, AMD Radeon RX Vega 64 i5-9600K RX Vega 64 1630 / 945 MHz 8 GB 16 GB 6071
4218 Points (18%)
Geekbench 5.5 - Geekbench 5.1 - 5.4 64 Bit Single-Core
1217 Points (51%)
Model CPU GPU RAM Value Intel Core i5-9600K, AMD Radeon RX Vega 64 i5-9600K RX Vega 64 1630 / 945 MHz 8 GB 16 GB 1217
1152 Points (49%)
Geekbench 5.5 - Geekbench 5.1 - 5.4 64 Bit Multi-Core
5855 Points (10%)
Model CPU GPU RAM Value Intel Core i5-9600K, AMD Radeon RX Vega 64 i5-9600K RX Vega 64 1630 / 945 MHz 8 GB 16 GB 5855
4074 Points (7%)
Geekbench 5.0 - Geekbench 5.0 64 Bit Single-Core
1146 Points (5%)
Geekbench 5.0 - Geekbench 5.0 64 Bit Multi-Core
4060 Points (13%)
Geekbench 4.4 - Geekbench 4.1 - 4.4 64 Bit Single-Core
5916 Points (59%)
Model CPU GPU RAM Value Intel Core i5-9600K, AMD Radeon RX Vega 64 i5-9600K RX Vega 64 1630 / 945 MHz 8 GB 16 GB 5916
5301 Points (53%)
Geekbench 4.4 - Geekbench 4.1 - 4.4 64 Bit Multi-Core
23810 Points (27%)
Model CPU GPU RAM Value Intel Core i5-9600K, AMD Radeon RX Vega 64 i5-9600K RX Vega 64 1630 / 945 MHz 8 GB 16 GB 23810
15937 Points (18%)
Mozilla Kraken 1.1 - Kraken 1.1 Total Score *
866 ms (1%)
WebXPRT 3 - WebXPRT 3 Score
204 Points (43%)
Power Consumption - Prime95 Power Consumption - external Monitor *
145.9 Watt (25%)
Model CPU GPU RAM Value Intel Core i5-9600K, AMD Radeon RX Vega 64 i5-9600K RX Vega 64 1630 / 945 MHz 8 GB 16 GB 145.9
139 Watt (24%)
Power Consumption - Cinebench R15 Multi Power Consumption - external Monitor *
134 Watt (24%)
Model CPU GPU RAM Value Intel Core i5-9600K, AMD Radeon RX Vega 64 i5-9600K RX Vega 64 1630 / 945 MHz 8 GB 16 GB 134
101.5 Watt (19%)
Power Consumption - Cinebench R15 Multi Power Efficiency - external Monitor
8.2 Points per Watt (6%)
Model CPU GPU RAM Value Intel Core i5-9600K, AMD Radeon RX Vega 64 i5-9600K RX Vega 64 1630 / 945 MHz 8 GB 16 GB 8.16
6.3 Points per Watt (5%)
Average Benchmarks Intel Core i5-9600K → 100% n=32 Average Benchmarks Intel Core i3-9100F → 79% n=32
- Range of benchmark values for this graphics card
- Average benchmark values for this graphics card
* Smaller numbers mean a higher performance
1 This benchmark is not used for the average calculation
v1.26
log 19. 15:35:47
#0 checking url part for id 11231 +0s ... 0s
#1 checking url part for id 12190 +0s ... 0s
#2 not redirecting to Ajax server +0s ... 0s
#3 did not recreate cache, as it is less than 5 days old! Created at Fri, 19 Apr 2024 05:38:49 +0200 +0.001s ... 0.001s
#4 composed specs +0.015s ... 0.016s
#5 did output specs +0s ... 0.016s
#6 getting avg benchmarks for device 11231 +0.003s ... 0.019s
#7 got single benchmarks 11231 +0.008s ... 0.028s
#8 getting avg benchmarks for device 12190 +0.02s ... 0.047s
#9 got single benchmarks 12190 +0.007s ... 0.055s
#10 got avg benchmarks for devices +0s ... 0.055s
#11 min, max, avg, median took s +0.275s ... 0.329s
#12 return log +0.024s ... 0.353s
Please share our article, every link counts!
Redaktion, 2017-09- 8 (Update: 2023-07- 1)
 Deutsch
 English
 Español
 Français
 Italiano
 Nederlands
 Polski
 Português
 Русский
 Türkçe
 Svenska
 Chinese
 Magyar