Notebookcheck Logo

Intel Core i5-10400F vs Intel Core i3-10320 vs Intel Core i3-10100F

Intel Core i5-10400F

► remove from comparison Intel i5-10400F

The Intel Core i5-10400F is a mid-range processor for desktops with six cores based on the Comet Lake architecture (CML-S, 4th generation of Skylake). The processor clocks at between 2.9 and 4.3 GHz and can execute up to 12 threads simultaneously thanks to Hyper-Threading.

The processor is still manufactured on the old 14nm (14nm++) process.

The Comet Lake architecture is similar to Coffee Lake and offers the same features and is made with the same 14 nm process. Other than the improved clock rates, the memory controller now also supports faster DDR4-2666 RAM. More information on Comet Lake and all the models and articles on it can be found here.

Performance

The average 10400F in our database matches the Ryzen 7 4800U and also the Core i7-9700K in multi-thread performance to be a more than decent mid-range option for your gaming rig, as of early 2022.

Graphics

The CPUs with an "F" suffix do not feature an integrated graphics adapter. The Intel UHD Graphics 630 iGPU is deactivated.

Power consumption

This Core i5 has a default TDP (also known as the long-term power limit) of 65 W which is in line with most desktop chips.

The i5-10400F is built with one of the old 14 nm Intel processes for poor, as of mid 2023, energy efficiency.

Intel Core i3-10320

► remove from comparison Intel i3-10320

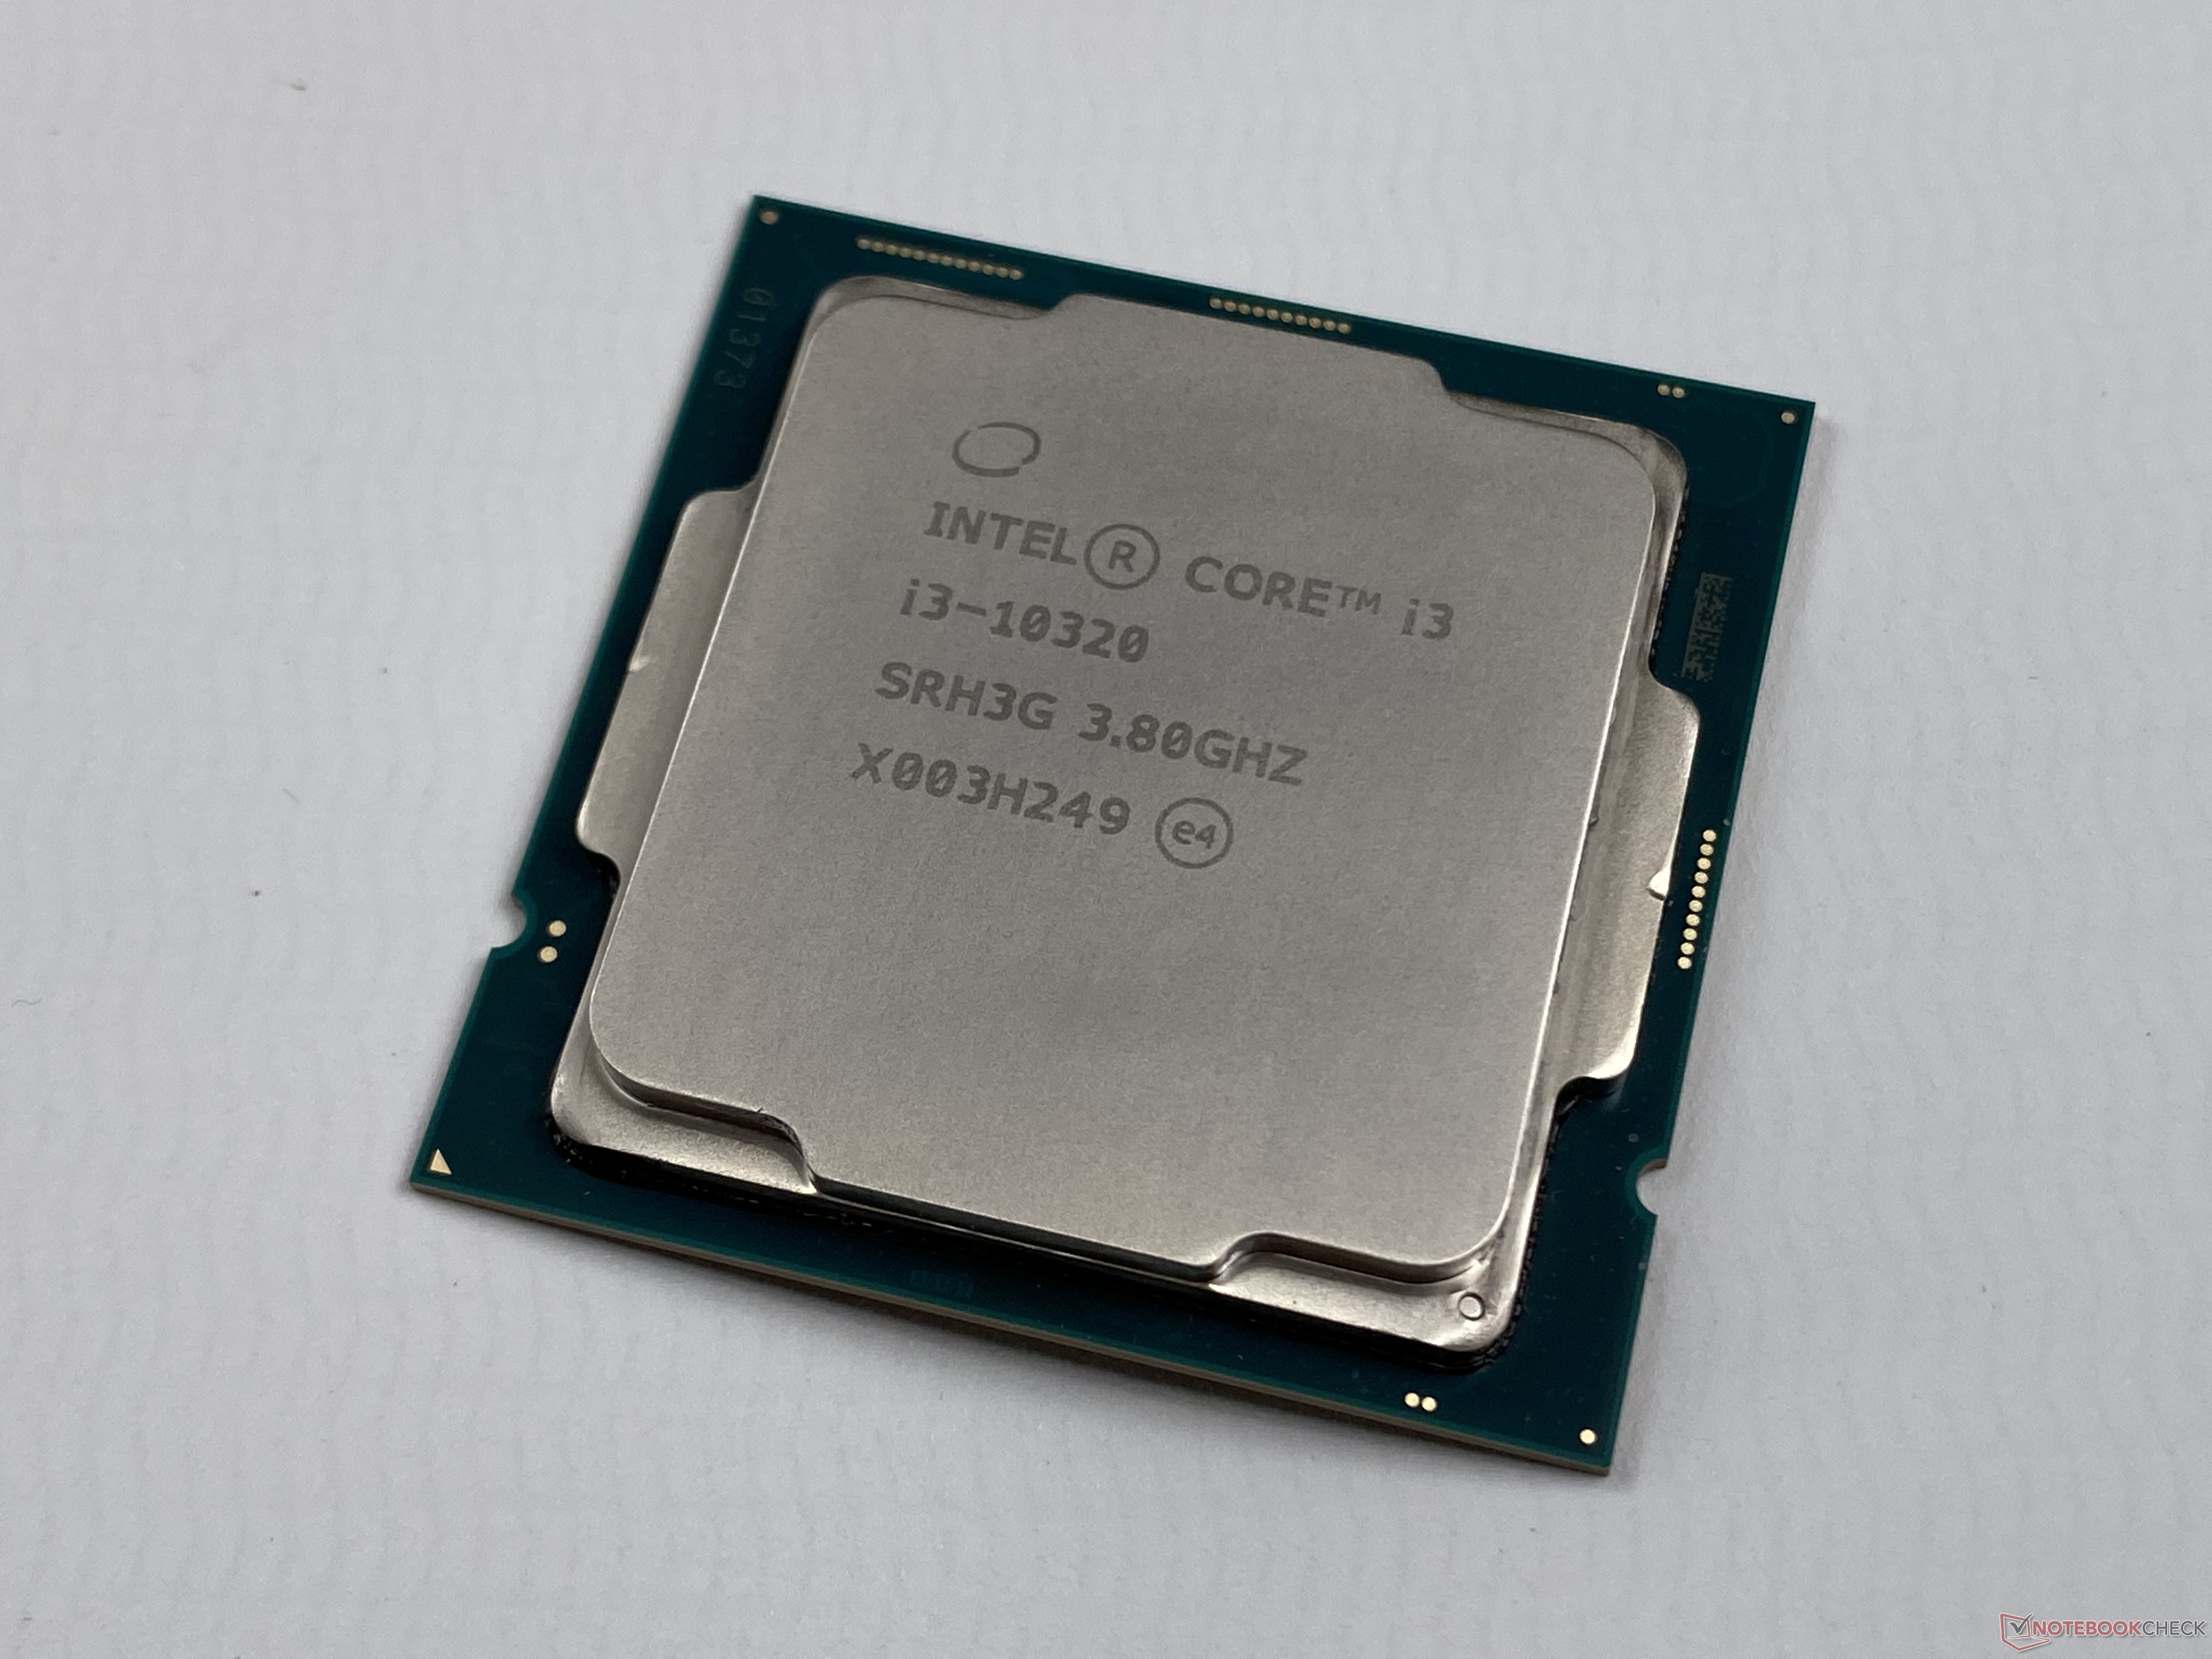
The Intel Core i3-10320 is an entry level quad-core desktop processor based on the Comet Lake-S architecture (CML-S, 4th generation of Skylake). The processor clocks at between 3.8 and 4.6 GHz and can execute up to eight threads with its four cores simultaneously thanks to Hyper-Threading. 

The processor is still manufactured in the old 14nm (14nm++) process. Thanks to the free multiplicator, the CPU can also be easily overclocked (but may not have much headroom).

The Comet Lake architecture is similar to Coffee Lake and offers the same features and is produced in the same 14nm process. Other than the improved clock rates, the memory controller now also supports faster DDR4-2933 RAM. More information on Comet Lake and all the models and articles on it can be found here.

Performance

The performance is similar to the old high end Intel Core i7-7700K due to the same architecture and similar clock speeds. 

Graphics

The integrated Intel UHD Graphics 630 iGPU is supposed to offer a similar performance as the UHD630 in the Core i7-9900K. As a  low-end solution it will only run current games smoothly at reduced details - if at all.

Power Consumption

Intel specifies the TDP with 65 Watts (PL1) but under full load up to 90 Watt are consumed (PL2 for 28s).

Intel Core i3-10100F

► remove from comparison Intel i3-10100F

The Intel Core i3-10100F is an entry level quad-core processor for desktop PCs based on the Comet Lake-S architecture. It offers four cores clocked at 3.6 - 4.3 GHz with HyperThreading / SMT support (8 threads). The CPU is still manufactured on 14nm++ and does not feature an integrated graphics card. Compared to the older Coffee Lake Core i3-9100F, the i3-10100F offers a 100 MHz higher Boost speed, HyperThreading and support for faster DDR4 memory (2666 MHz).

Performance

While we have not tested a single system powered by the 10100F as of August 2023, it's reasonable to expect the chip to be just slightly faster than the Core i5-10200H.

Intel specifies the CPU with a TDP of 65 Watt. For desktops that means that the processor won't need big cooling solutions and can be used in small cases.

ModelIntel Core i5-10400FIntel Core i3-10320Intel Core i3-10100F
SeriesIntel Comet LakeIntel Comet LakeIntel Comet Lake
CodenameComet LakeComet Lake-SComet Lake
Series: Comet Lake Comet Lake
Intel Core i9-10900K3.7 - 5.3 GHz10 / 20 cores20 MB L3
Intel Core i7-10700K3.8 - 5.1 GHz8 / 16 cores16 MB L3
Intel Core i7-107002.9 - 4.8 GHz8 / 16 cores16 MB L3
Intel Core i5-10600K4.1 - 4.8 GHz6 / 12 cores12 MB L3
Intel Core i5-10400F « 2.9 - 4.3 GHz6 / 12 cores12 MB L3
Intel Core i3-10100F3.6 - 4.3 GHz4 / 8 cores6 MB L3
Intel Core i9-10850K3.6 - 5.2 GHz10 / 20 cores20 MB L3
Intel Core i9-109103.6 - 5 GHz10 / 20 cores20 MB L3
Intel Core i3-10320 « 3.8 - 4.6 GHz4 / 8 cores7.9 MB L3
Intel Core i3-101003.6 - 4.3 GHz4 / 8 cores6 MB L3
Intel Core i9-10900K3.7 - 5.3 GHz10 / 20 cores20 MB L3
Intel Core i7-10700K3.8 - 5.1 GHz8 / 16 cores16 MB L3
Intel Core i7-107002.9 - 4.8 GHz8 / 16 cores16 MB L3
Intel Core i5-10600K4.1 - 4.8 GHz6 / 12 cores12 MB L3
Intel Core i5-10400F2.9 - 4.3 GHz6 / 12 cores12 MB L3
Intel Core i3-10100F « 3.6 - 4.3 GHz4 / 8 cores6 MB L3
Clock2900 - 4300 MHz3800 - 4600 MHz3600 - 4300 MHz
L1 Cache384 KB256 KB256 KB
L2 Cache1.5 MB1 MB1 MB
L3 Cache12 MB7.9 MB6 MB
Cores / Threads6 / 124 / 84 / 8
TDP65 Watt65 Watt65 Watt
Technology14 nm14 nm14 nm
max. Temp.100 °C100 °C100 °C
SocketLGA1200LGA 1200LGA1200
FeaturesDDR4-2666 RAM, PCIe 3, 8 GT/s bus, MMX, SSE, SSE2, SSE3, SSSE3, SSE4.1, SSE4.2, AES, AVX, AVX2, FMA3HyperThreading, AVX, AVX2, FMA3, Quick Sync, VirtualizationDDR4-2666 RAM, PCIe 3, 8 GT/s bus, MMX, SSE, SSE2, SSE3, SSSE3, SSE4.1, SSE4.2, AES, AVX, AVX2, FMA3
Architecturex86x86x86
$155 U.S.$162 U.S.$122 U.S.
Announced
Manufacturerark.intel.comark.intel.comark.intel.com
iGPUIntel UHD Graphics 630 (350 - 1150 MHz)
Die Size126 mm2

Benchmarks

Performance Rating - CB R15 + R20 + 7-Zip + X265 + Blender + 3DM11 CPU - i5-10400F
33.2 pt (46%)
Performance Rating - CB R15 + R20 + 7-Zip + X265 + Blender + 3DM11 CPU - i3-10320
32.2 pt (45%)
Cinebench R23 - Cinebench R23 Multi Core
5986 Points (6%)
Cinebench R23 - Cinebench R23 Single Core
1185 Points (50%)
Cinebench R20 - Cinebench R20 CPU (Single Core)
438 Points (49%)
458 Points (51%)
Cinebench R20 - Cinebench R20 CPU (Multi Core)
3201 Points (8%)
2320 Points (6%)
Cinebench R15 - Cinebench R15 CPU Multi 64 Bit
1332 Points (8%)
949 Points (6%)
Cinebench R15 - Cinebench R15 CPU Single 64 Bit
180 Points (54%)
188 Points (57%)
Cinebench R11.5 - Cinebench R11.5 CPU Multi 64 Bit
14.4 Points (19%)
10.5 Points (14%)
Cinebench R11.5 - Cinebench R11.5 CPU Single 64 Bit
2 Points (50%)
2.1 Points (52%)
Cinebench R10 - Cinebench R10 Rend. Single (32bit)
6719 Points (41%)
7164 Points (43%)
Cinebench R10 - Cinebench R10 Rend. Multi (32bit)
36564 Points (26%)
28383 Points (21%)
Cinebench R10 - Cinebench R10 Rend. Multi (64bit)
47901 Points (33%)
Cinebench R10 - Cinebench R10 Rend. Single (64bit)
8849 Points (11%)
wPrime 2.10 - wPrime 2.0 1024m *
134.7 s (2%)
wPrime 2.10 - wPrime 2.0 32m *
6.3 s (1%)
7-Zip 18.03 - 7-Zip 18.03 Multli Thread 4 runs
36731 MIPS (21%)
25864 MIPS (15%)
7-Zip 18.03 - 7-Zip 18.03 Single Thread 4 runs
5064 MIPS (61%)
4899 MIPS (59%)
X264 HD Benchmark 4.0 - x264 Pass 2
81.2 fps (28%)
58.8 fps (21%)
X264 HD Benchmark 4.0 - x264 Pass 1
228.5 fps (53%)
218 fps (50%)
HWBOT x265 Benchmark v2.2 - HWBOT x265 4k Preset
11.2 fps (20%)
8.2 fps (14%)
TrueCrypt - TrueCrypt Serpent
0.5 GB/s (0%)
TrueCrypt - TrueCrypt Twofish
0.9 GB/s (16%)
TrueCrypt - TrueCrypt AES
5.3 GB/s (14%)
Blender - Blender 2.79 BMW27 CPU *
332.4 Seconds (2%)
469 Seconds (3%)
R Benchmark 2.5 - R Benchmark 2.5 *
0.6 sec (13%)
0.6 sec (14%)
3DMark 06 - CPU - 3DMark 06 - CPU
9911 Points (21%)
Super Pi mod 1.5 XS 1M - Super Pi mod 1.5 XS 1M *
8.7 s (2%)
9.7 s (2%)
Super Pi mod 1.5 XS 2M - Super Pi mod 1.5 XS 2M *
19.2 s (1%)
Super Pi Mod 1.5 XS 32M - Super Pi mod 1.5 XS 32M *
470.4 s (2%)
516 s (2%)
3DMark 11 - 3DM11 Performance Physics
14539 Points (39%)
10518 Points (28%)
3DMark - 3DMark Ice Storm Physics
62086 Points (50%)
63063 Points (51%)
3DMark - 3DMark Ice Storm Extreme Physics
61795 Points (50%)
3DMark - 3DMark Ice Storm Unlimited Physics
62883 Points (53%)
3DMark - 3DMark Cloud Gate Physics
11914 Points (30%)
9675 Points (24%)
3DMark - 3DMark Fire Strike Standard Physics
13564 Points (24%)
3DMark - 3DMark Time Spy CPU
7548 Points (32%)
4368 Points (18%)
Geekbench 5.5 - Geekbench 5.1 - 5.4 64 Bit Single-Core
min: 1217     avg: 1220     median: 1220 (51%)     max: 1223 Points
1217 Points (51%)
1072 Points (45%)
Geekbench 5.5 - Geekbench 5.1 - 5.4 64 Bit Multi-Core
min: 6358     avg: 6365     median: 6365 (11%)     max: 6372 Points
4846 Points (9%)
3650 Points (7%)
Geekbench 5.0 - Geekbench 5.0 64 Bit Single-Core
1217 Points (5%)
Geekbench 5.0 - Geekbench 5.0 64 Bit Multi-Core
6349 Points (20%)
Geekbench 4.4 - Geekbench 4.1 - 4.4 64 Bit Single-Core
5587 Points (56%)
Geekbench 4.4 - Geekbench 4.1 - 4.4 64 Bit Multi-Core
25403 Points (28%)
Mozilla Kraken 1.1 - Kraken 1.1 Total Score *
849 ms (1%)
784 ms (1%)
Sunspider - Sunspider 1.0 Total Score *
160 ms (2%)
WebXPRT 3 - WebXPRT 3 Score
215 Points (45%)
224 Points (47%)
CrossMark - CrossMark Overall
1254 Points (48%)
Power Consumption - Prime95 Power Consumption - external Monitor *
135.8 Watt (23%)
115 Watt (20%)
Power Consumption - Cinebench R15 Multi Power Consumption - external Monitor *
125.5 Watt (23%)
96.3 Watt (18%)
Power Consumption - Cinebench R15 Multi Power Efficiency - external Monitor
10.6 Points per Watt (8%)
9.9 Points per Watt (7%)

Average Benchmarks Intel Core i5-10400F → 100% n=2

Average Benchmarks Intel Core i3-10320 → 88% n=2

Average Benchmarks Intel Core i3-10100F → 73% n=2

- Range of benchmark values for this graphics card
- Average benchmark values for this graphics card
* Smaller numbers mean a higher performance
1 This benchmark is not used for the average calculation

v1.26
log 16. 06:28:07

#0 checking url part for id 12714 +0s ... 0s

#1 checking url part for id 14009 +0s ... 0s

#2 checking url part for id 12774 +0s ... 0s

#3 not redirecting to Ajax server +0s ... 0s

#4 did not recreate cache, as it is less than 5 days old! Created at Tue, 16 Apr 2024 05:37:29 +0200 +0.001s ... 0.001s

#5 composed specs +0.034s ... 0.036s

#6 did output specs +0s ... 0.036s

#7 getting avg benchmarks for device 12714 +0.021s ... 0.057s

#8 got single benchmarks 12714 +0.01s ... 0.067s

#9 getting avg benchmarks for device 14009 +0.018s ... 0.084s

#10 got single benchmarks 14009 +0.01s ... 0.095s

#11 getting avg benchmarks for device 12774 +0.003s ... 0.098s

#12 got single benchmarks 12774 +0.008s ... 0.106s

#13 got avg benchmarks for devices +0s ... 0.106s

#14 min, max, avg, median took s +0.338s ... 0.444s

#15 return log +0s ... 0.444s

Please share our article, every link counts!
> Expert Reviews and News on Laptops, Smartphones and Tech Innovations > Benchmarks / Tech > Processor Comparison - Head 2 Head
Redaktion, 2017-09- 8 (Update: 2023-07- 1)