 Deutsch
 English
 Español
 Français
 Italiano
 Nederlands
 Polski
 Português
 Русский
 Türkçe
 Svenska
 Chinese
 Magyar
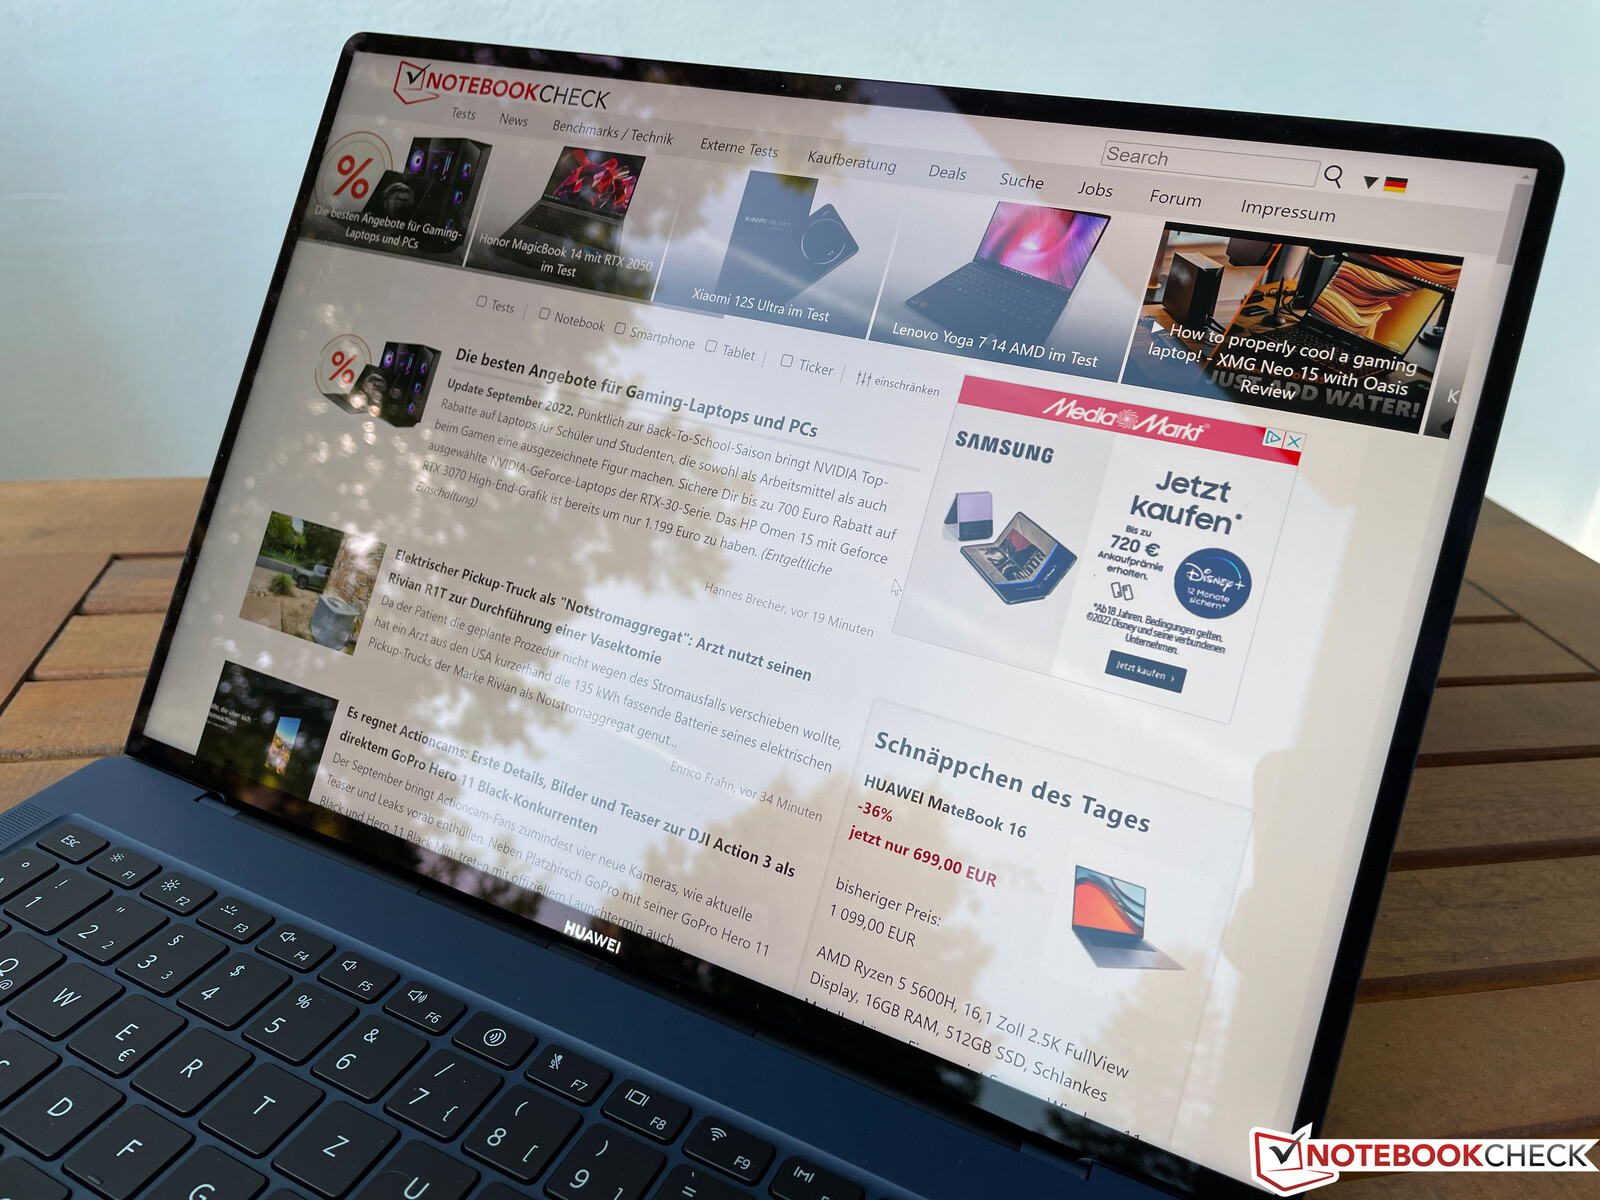
Huawei MateBook X Pro 2022 laptop review: MacBook Air competitor scores with top IPS display
The MateBook X Pro is traditionally Huawei's flagship ultrabook and the new 2022 model holds true to this claim. For 2,199 Euros (~US$ 2199) you get a new chassis with a large 14.2-inch IPS display in 3:2 format, an Intel Alder Lake P processor, plenty of USB-C ports together with Thunderbolt 4 support, and a modern Wi-Fi 6E module. Users can also expect an improved keyboard and a large touchpad with additional features.
Is this enough to contend for the top position among Windows ultrabooks? Does the MateBook X Pro even pose a threat to the new Apple MacBook Air M2? Or should you rather opt for the MateBook X Pro 2021 with its Core i7-1165G7, which is currently on offer at Huawei for a very affordable 1,099 Euros (~US$ 1100)?
Possible Competitors in Comparison
Rating | Date | Model | Weight | Height | Size | Resolution | Best Price |
|---|---|---|---|---|---|---|---|
| 90.3 % | 09/2022 | Huawei MateBook X Pro 2022 i7-1260P, Iris Xe G7 96EUs | 1.3 kg | 15.6 mm | 14.20" | 3120x2080 | |
| 92 % | 08/2022 | Apple MacBook Air M2 10C GPU M2, M2 10-Core GPU | 1.2 kg | 11.3 mm | 13.60" | 2560x1664 | |
| 90.6 % | 05/2022 | Lenovo Yoga 9i 14 2022 i7-1260P i7-1260P, Iris Xe G7 96EUs | 1.4 kg | 15.25 mm | 14.00" | 3840x2400 | |
| 90.1 % | 07/2022 | Asus Zenbook S 13 OLED R7 6800U, Radeon 680M | 1.1 kg | 14.9 mm | 13.30" | 2880x1800 | |
| 86.9 % | 07/2022 | Dell XPS 13 Plus 9320 4K i7-1260P, Iris Xe G7 96EUs | 1.2 kg | 15.3 mm | 13.40" | 3840x2400 | |
| 87.8 % | 03/2021 | Huawei MateBook X Pro 2021 i7-1165G7, Iris Xe G7 96EUs | 1.3 kg | 14.6 mm | 13.90" | 3000x2000 |
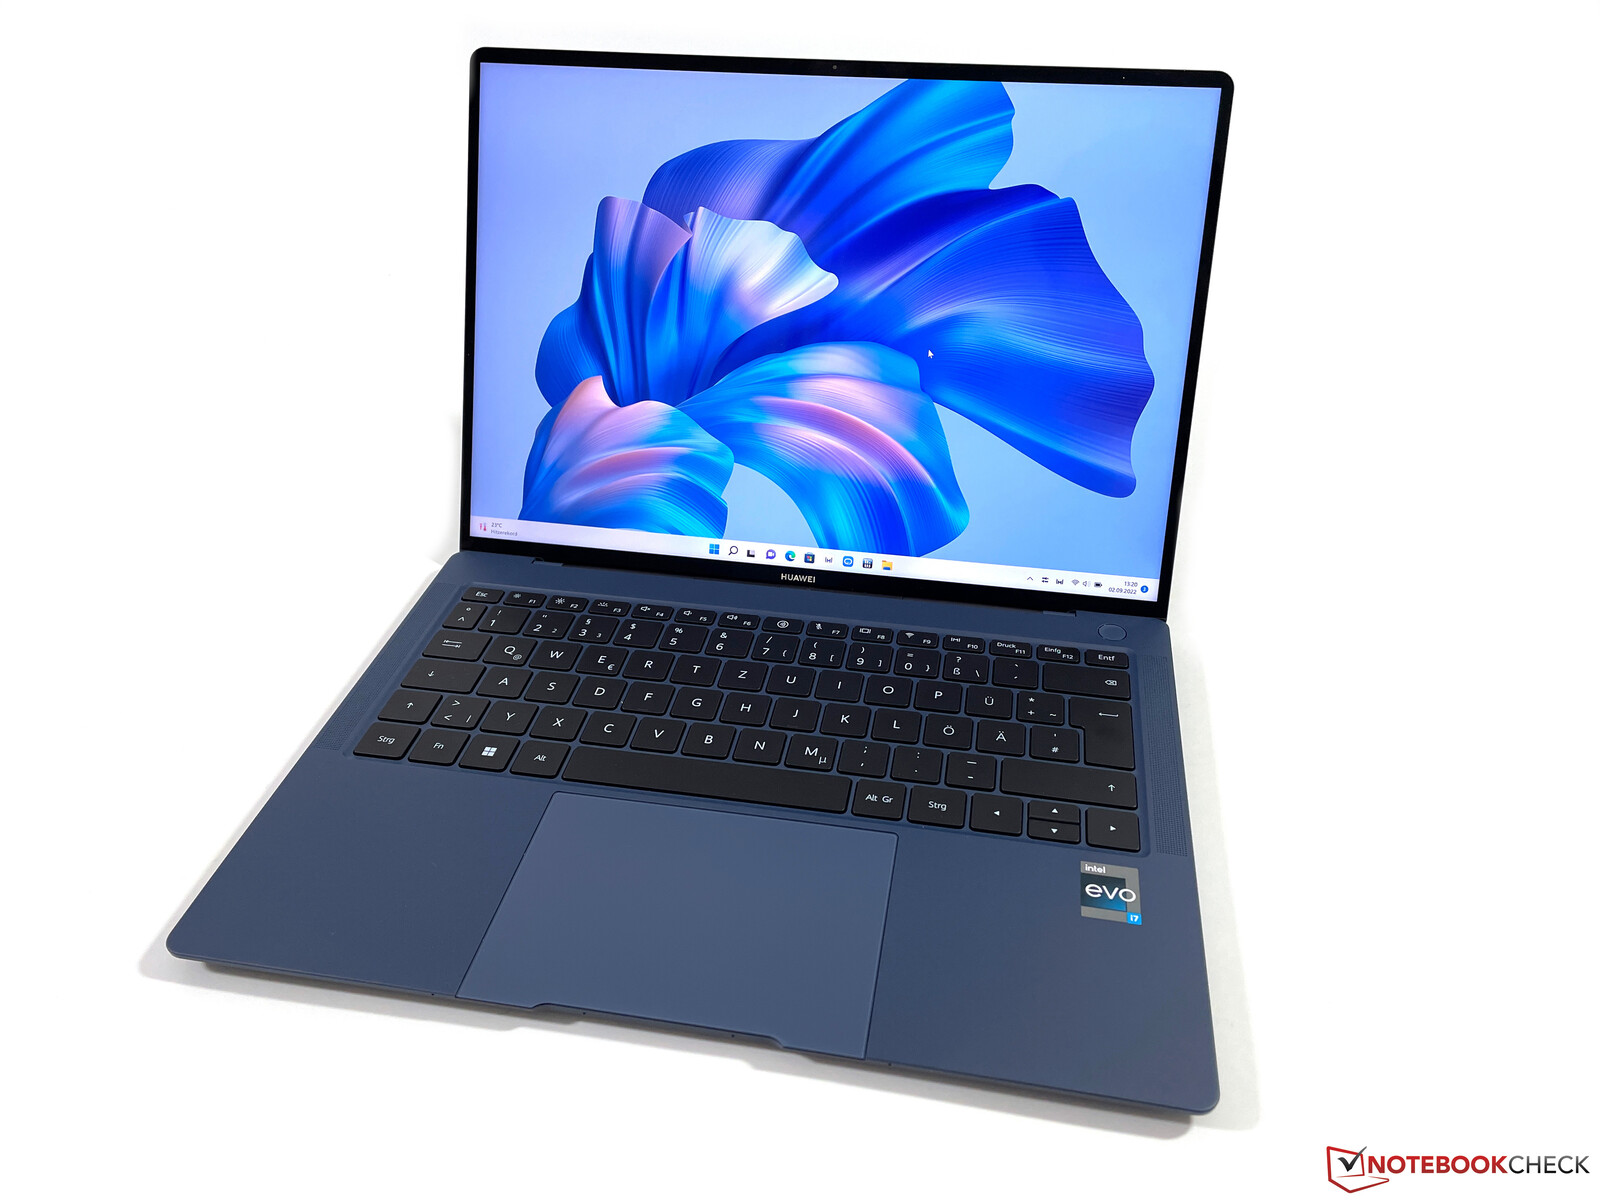
Case - Huawei brings magnesium into play
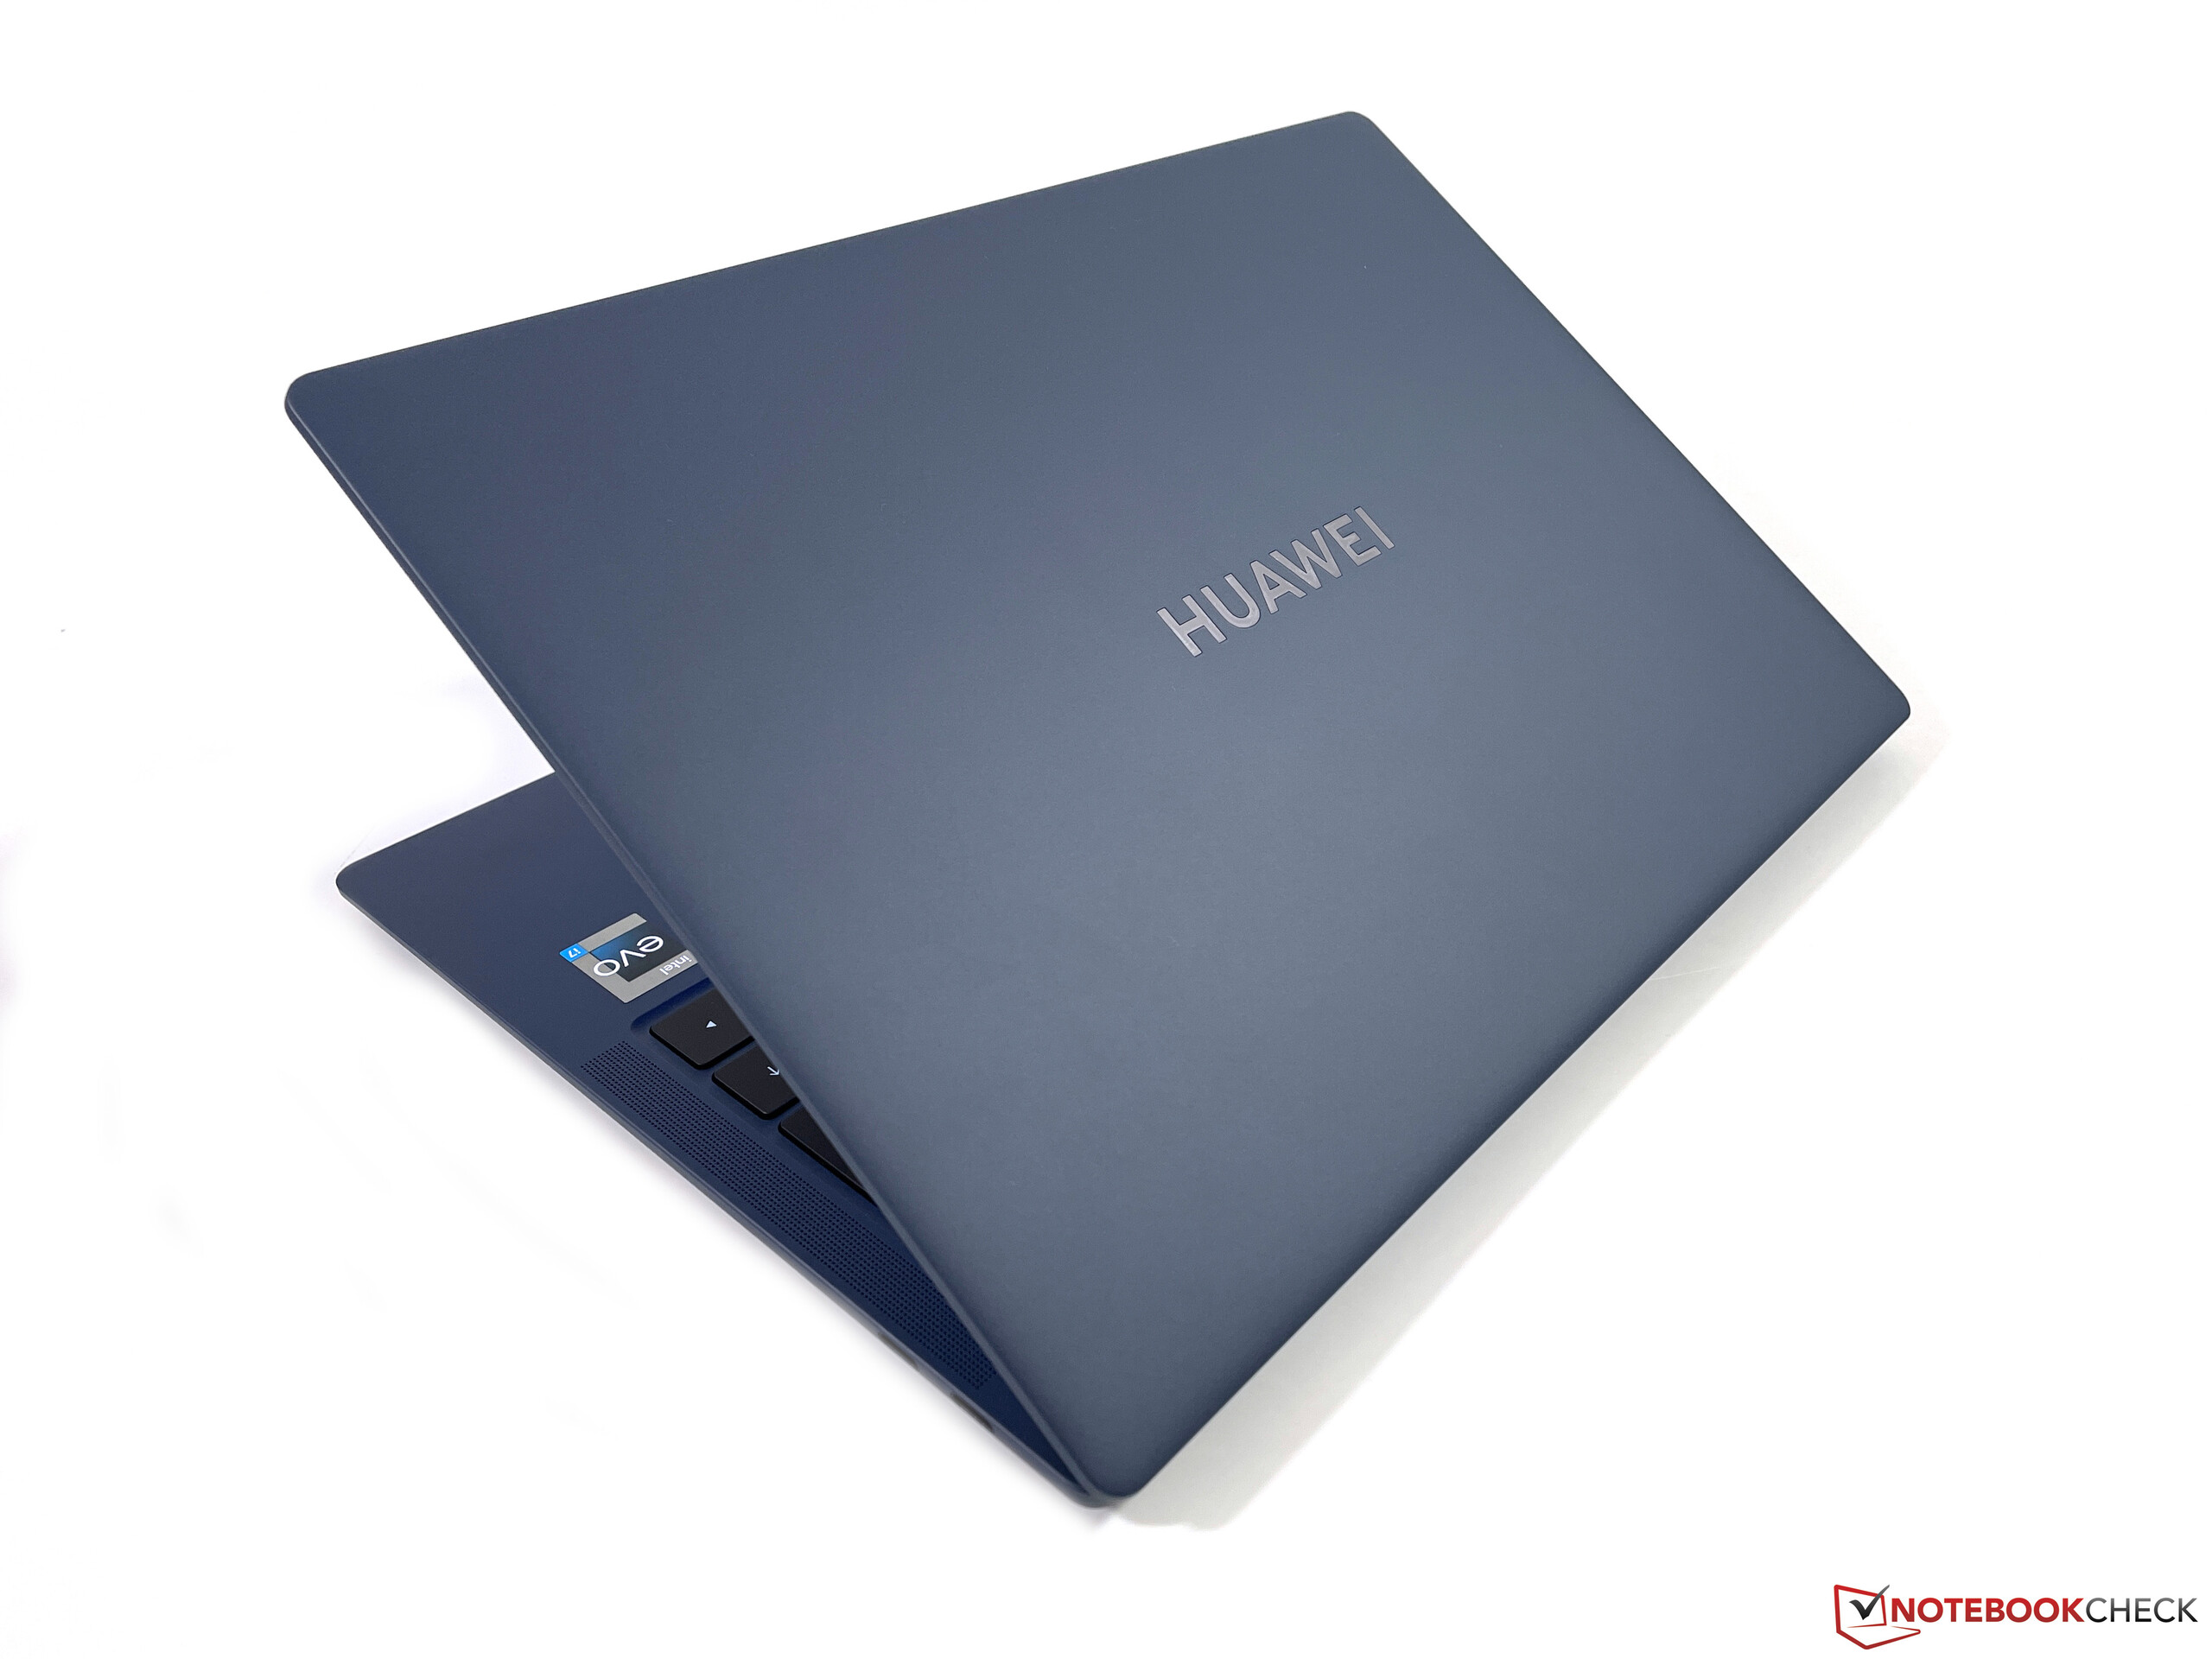
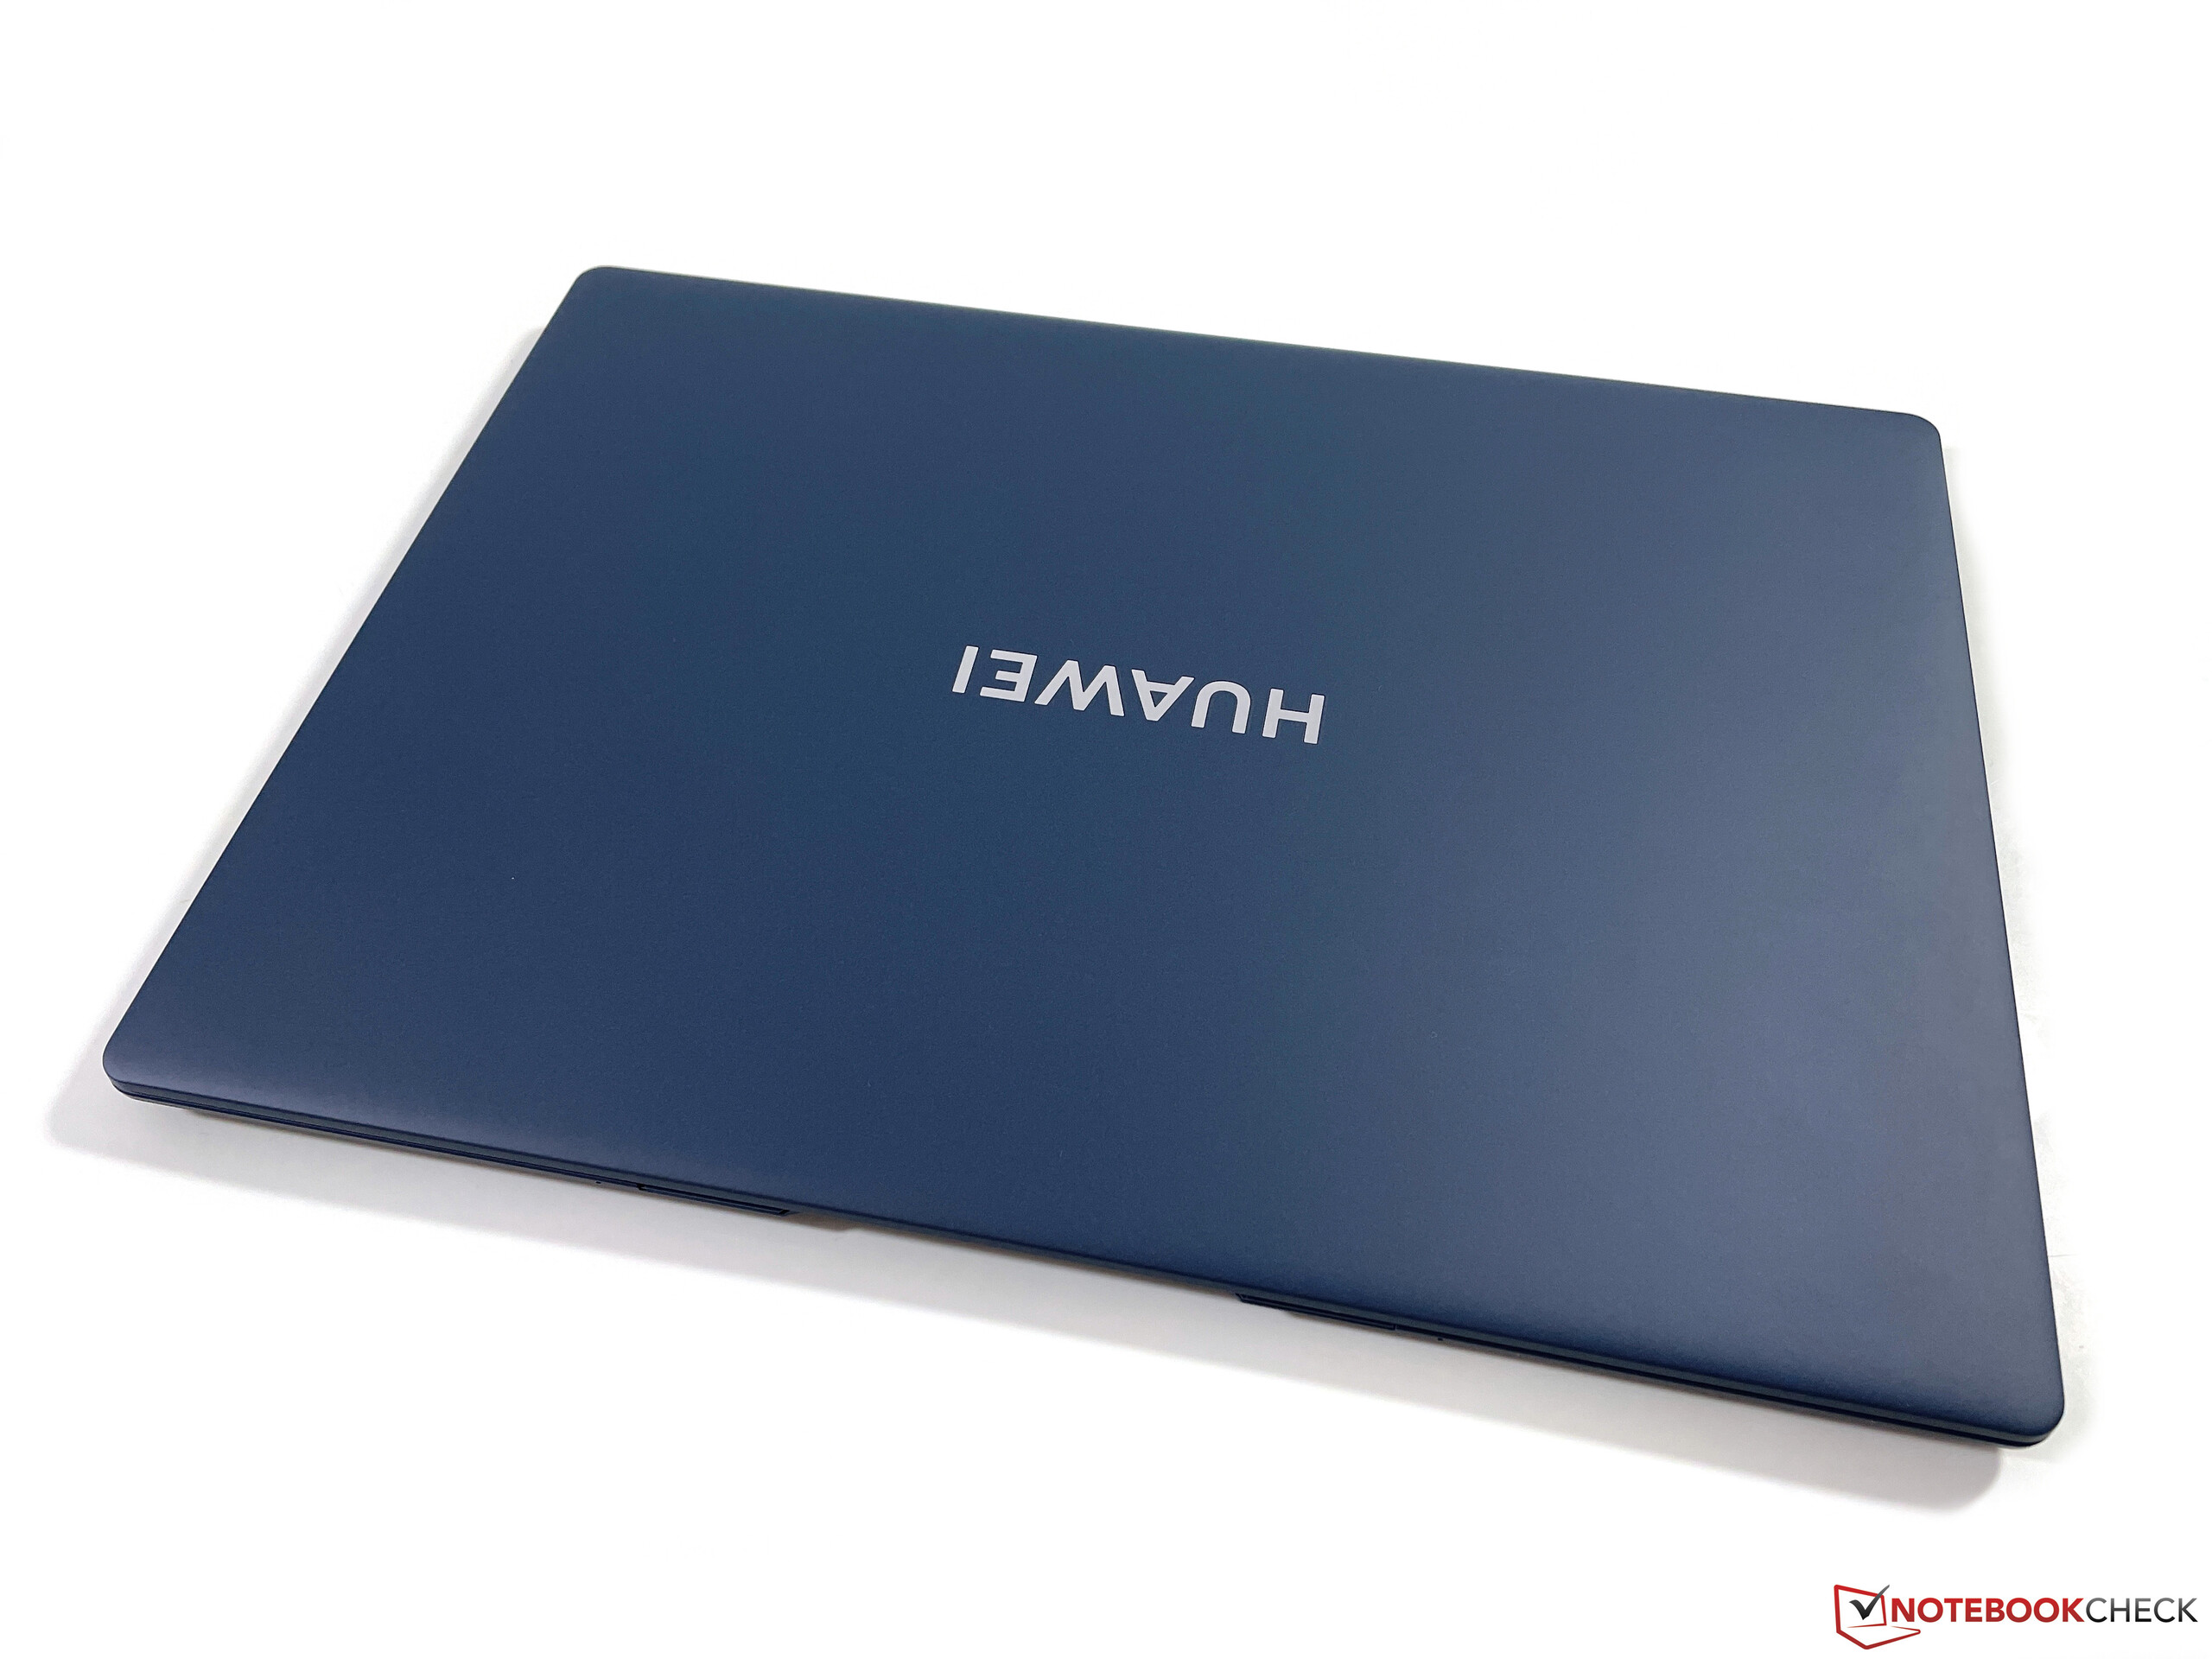
There are two versions of the MateBook X Pro 2022. According to the spec sheet, our review sample is the premium version that uses the new "soft" surface in combination with a magnesium chassis. In addition to the dark blue color variant (Ink Blue), a white model is also advertised, but this is currently unavailable. The regular Space Gray version offers normal, smooth surfaces in an aluminum case and also weighs a little more. The case is completely new; there is no longer the polished edge on the top of the base unit, for example, as was the case with the old MateBook X Pro, but the device still looks very high-quality and is also directly recognizable as a MateBook. Thanks to the narrow screen edges, the notebook also looks very modern.
The dark blue color is of course reminiscent of the new color variant of the Apple MacBook Air M2, which is a little darker. In contrast to the MacBook Air, we can report that the surfaces, which have a velvety soft feel, are fortunately much less sensitive to fingerprints and we hardly see any traces even after several days. The entire case also makes a very high-quality and stable impression. The base unit yields only minimally in the upper center of the keyboard area, but this does not prove bothersome in everyday use. The display lid is also stable and produces no creaking noises. We were able to induce image artifacts only with a lot of selective pressure from behind. The screen hinge is fundamentally well adjusted and the lid can also be opened with one hand without problems. However, screen teetering cannot be completely prevented.
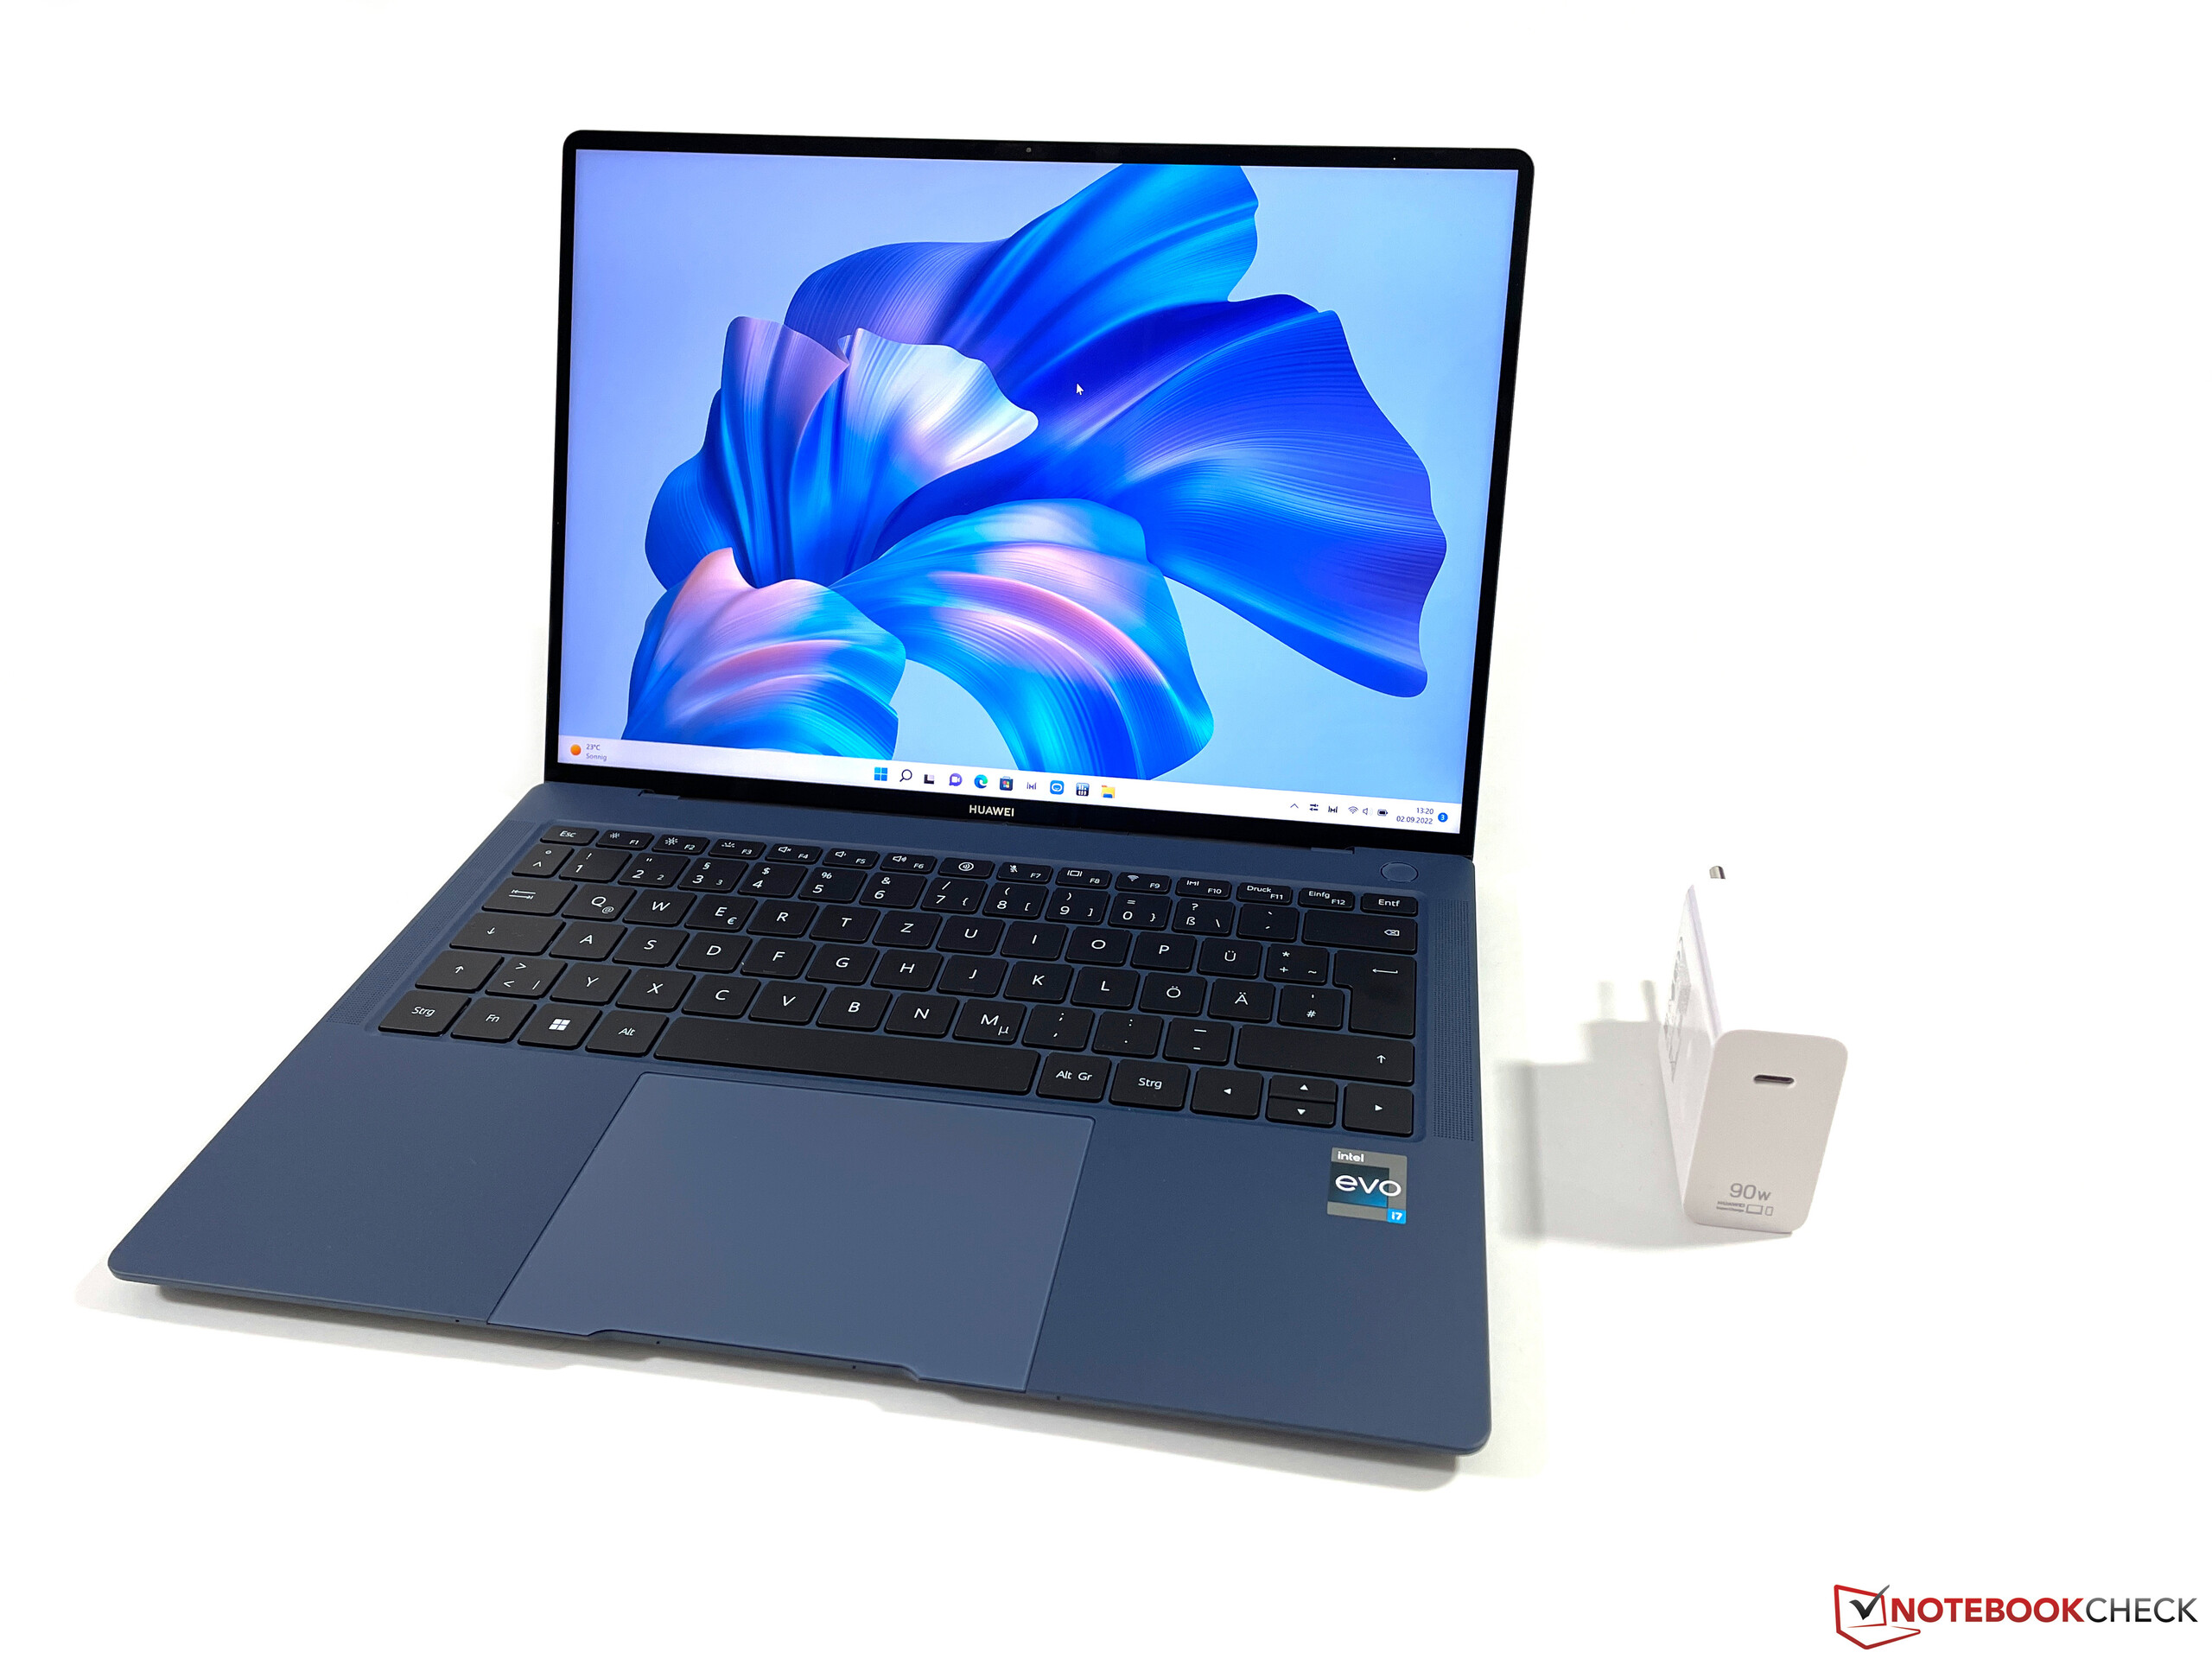
The new case has grown slightly compared to the predecessor, but the display is larger and also one of the largest in our comparison group. The new MateBook X Pro 2022 also has a slightly larger surface area than the new MacBook Air M2, but the difference is hardly significant. Lenovos Yoga 9i 14 convertible is even slightly larger. The 90-watt power adapter, including the USB-C cable, weighs 240 grams.
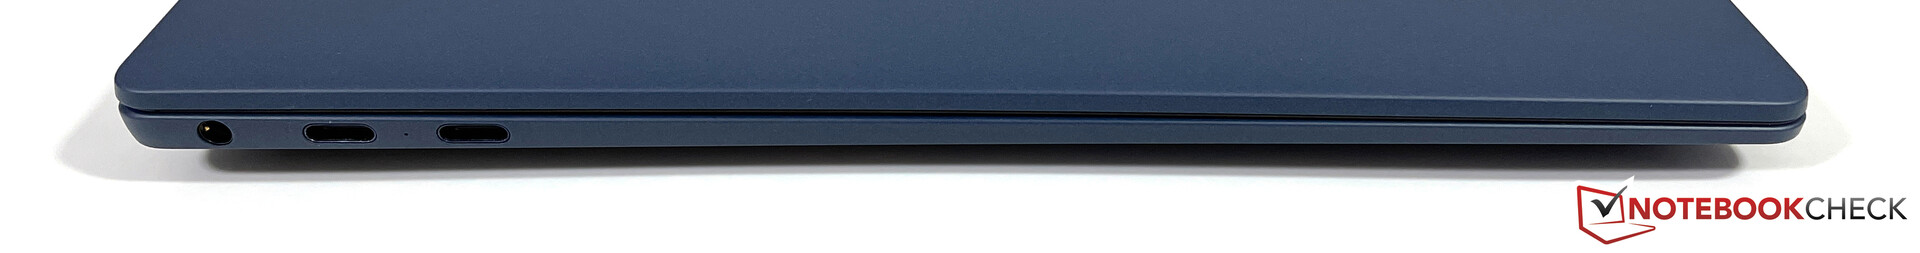
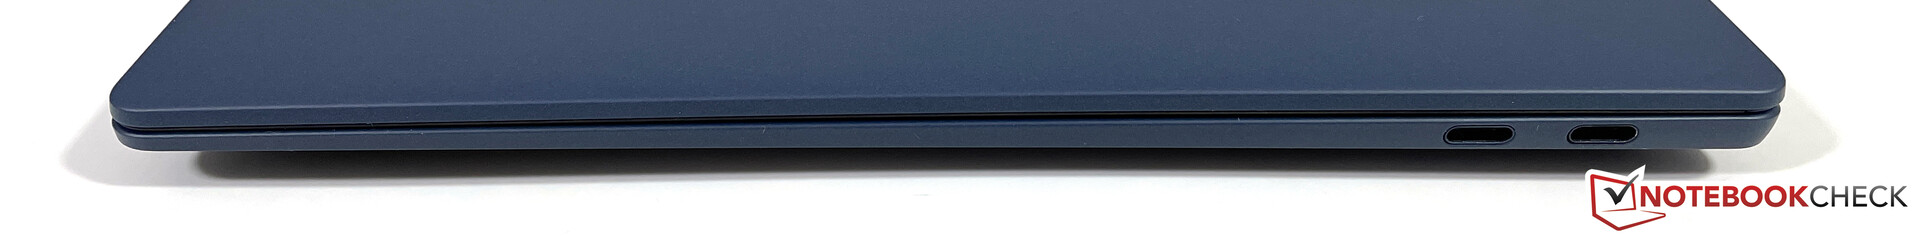
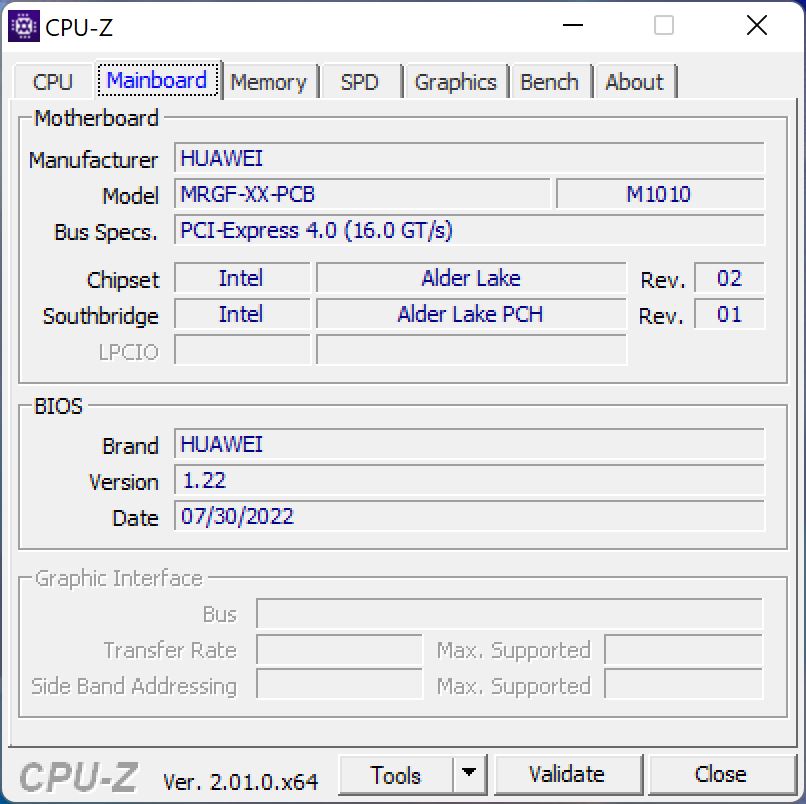
Equipment - Huawei finally brings Thunderbolt 4 on board
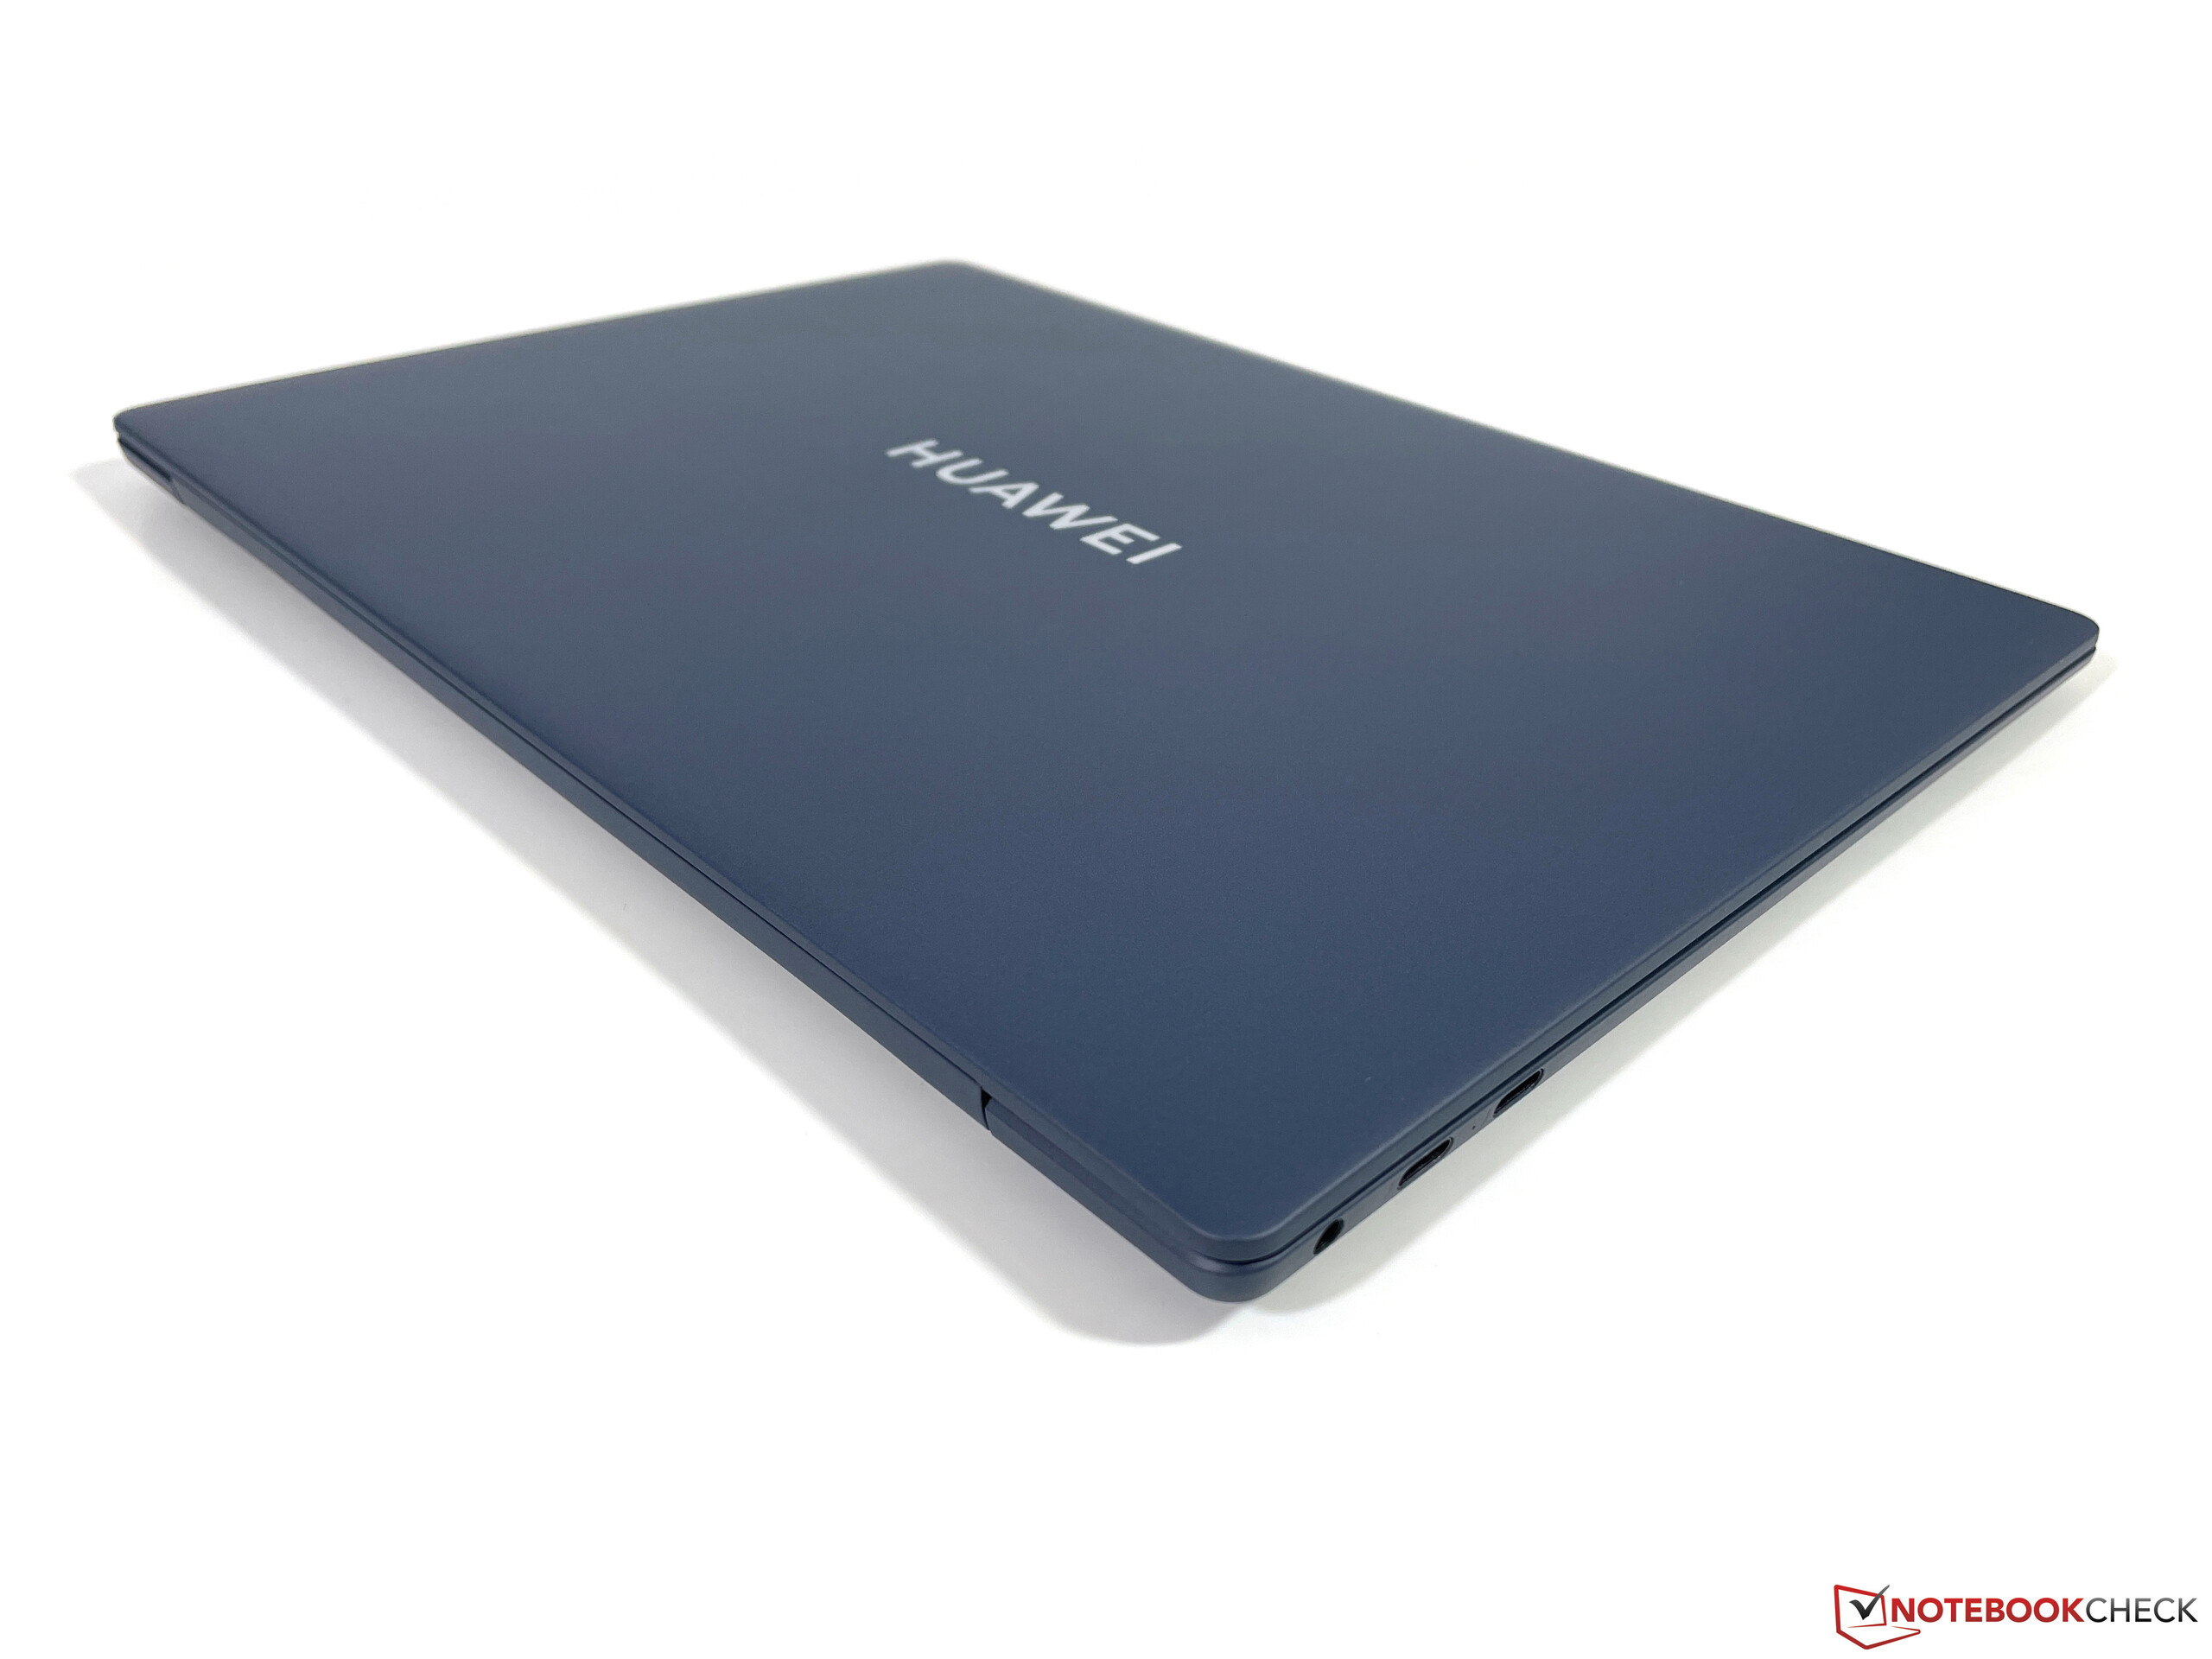
Thunderbolt was always a missing feature in the old MateBook X Pro. Now the new 2022 model now offers two USB-C ports with Thunderbolt 4 support on the left side. On the right side, there are two additional USB-C ports that can also be used for charging. The scope of delivery also includes a short adapter cable for USB-A.
Those who also use other Huawei devices (e.g. tablets, smartphones, monitors) will benefit from the so-called Super Device function. Similarly to Apple, this enables users to easily share or transfer content among synchronized devices or expand the screen to the tablet, for example. Using up to three smartphone apps on the laptop is also possible.
Communication
The new MateBook X Pro offers an up-to-date WLAN module from Intel (AX211E), which supports 6 GHz networks (Wi-Fi 6E) as well as Bluetooth 5.2. We were able to connect to the 6 GHz network of our Asus reference router without any problems and the transfer rates were consistently very high at around 1.7 GBit/s.
| Networking | |
| iperf3 transmit AXE11000 6GHz | |
| Huawei MateBook X Pro 2022 | |
| Lenovo Yoga 9i 14 2022 i7-1260P | |
| Average Intel Wi-Fi 6E AX211 (632 - 1851, n=173) | |
| iperf3 receive AXE11000 6GHz | |
| Huawei MateBook X Pro 2022 | |
| Average Intel Wi-Fi 6E AX211 (883 - 1857, n=172) | |
| Lenovo Yoga 9i 14 2022 i7-1260P | |
| iperf3 receive AXE11000 | |
| Dell XPS 13 Plus 9320 4K | |
| Asus Zenbook S 13 OLED | |
| Average Intel Wi-Fi 6E AX211 (582 - 1890, n=186) | |
| Apple MacBook Air M2 Entry | |
| iperf3 transmit AXE11000 | |
| Dell XPS 13 Plus 9320 4K | |
| Asus Zenbook S 13 OLED | |
| Average Intel Wi-Fi 6E AX211 (464 - 1861, n=186) | |
| Apple MacBook Air M2 Entry | |
Webcam
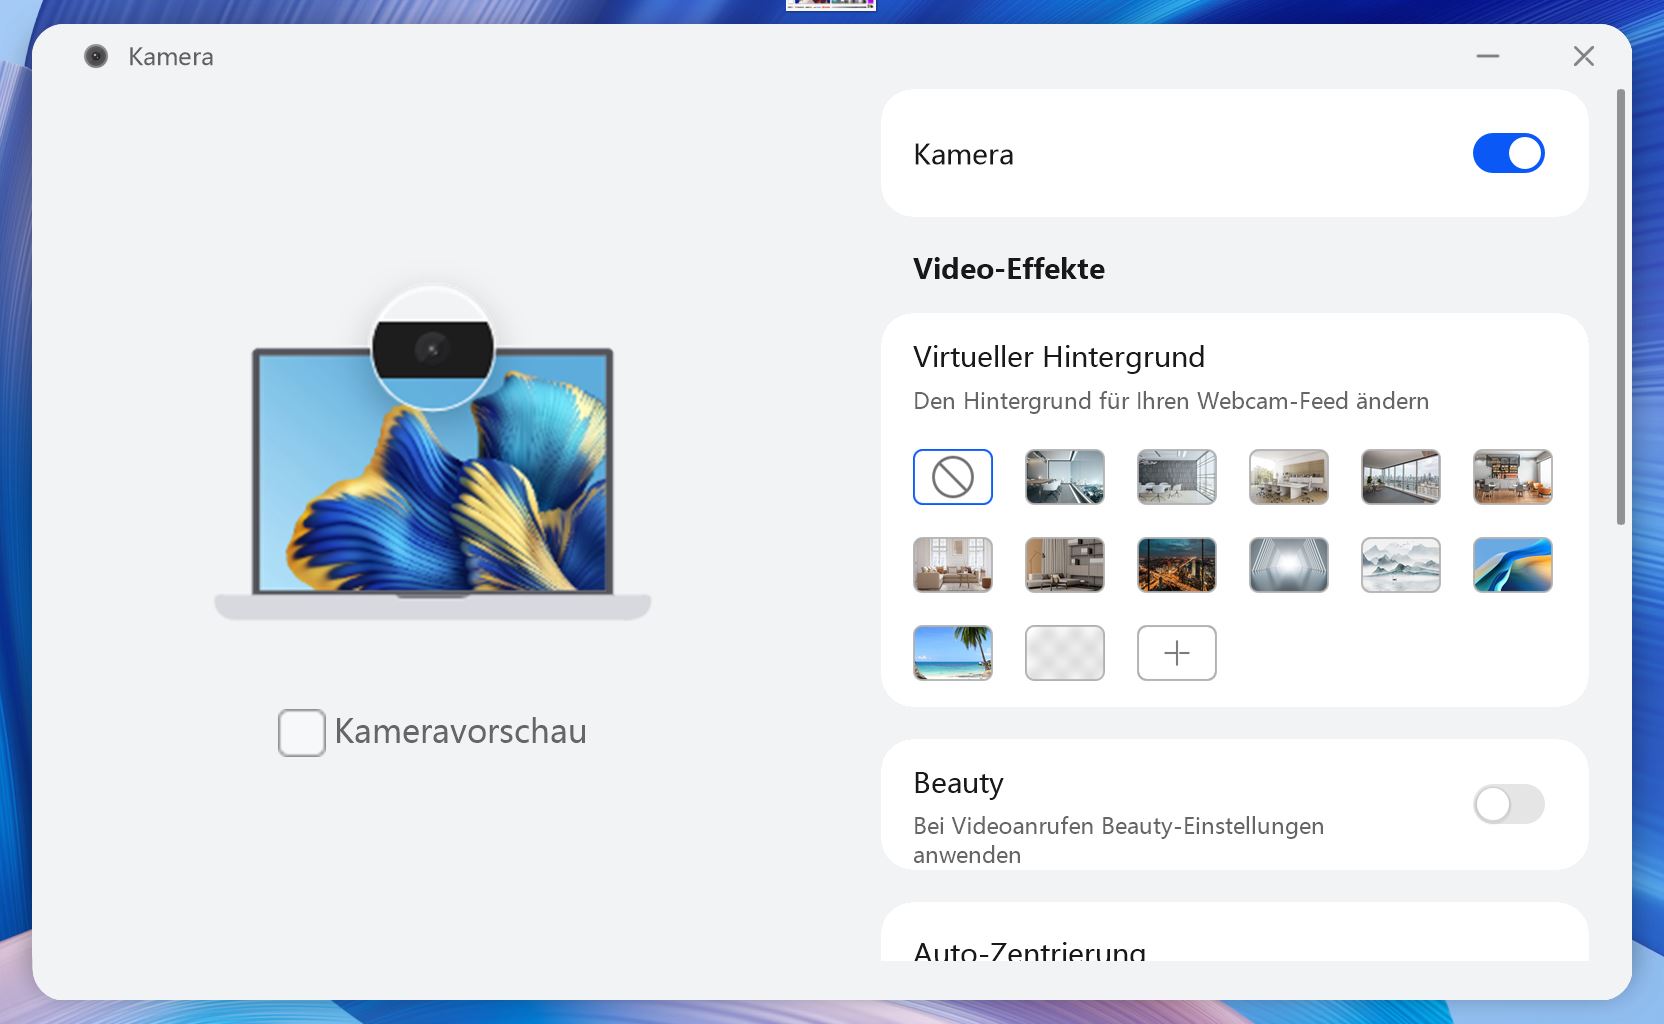
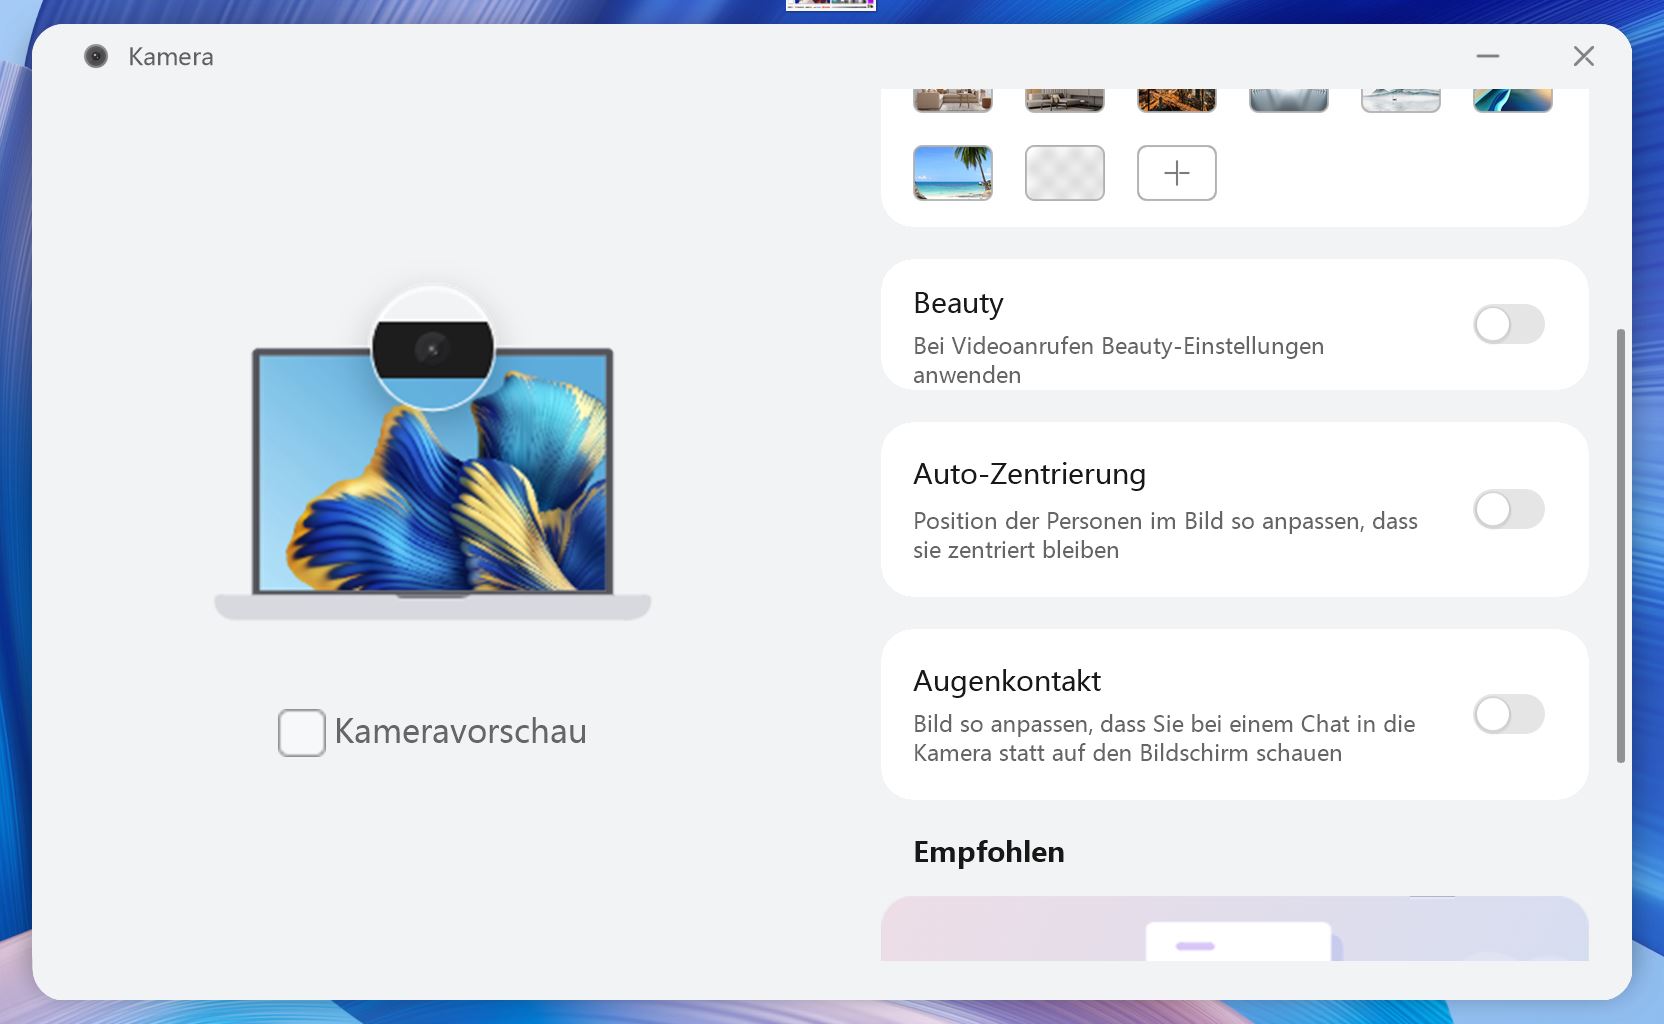
The webcam has been moved from the keyboard to the upper screen frame, but only a 720p sensor is used, which does not offer good image quality even in good lighting conditions. There is also no mechanical shutter or IR camera.
As in the MateBook 16s, Huawei offers some additional AI features for the webcam. These include practical features such as virtual backgrounds (independent of the software), but also rather unnecessary gimmicks such as beauty mode. The auto-centering also worked a little better on the 1080p webcam of the MateBook 16s.


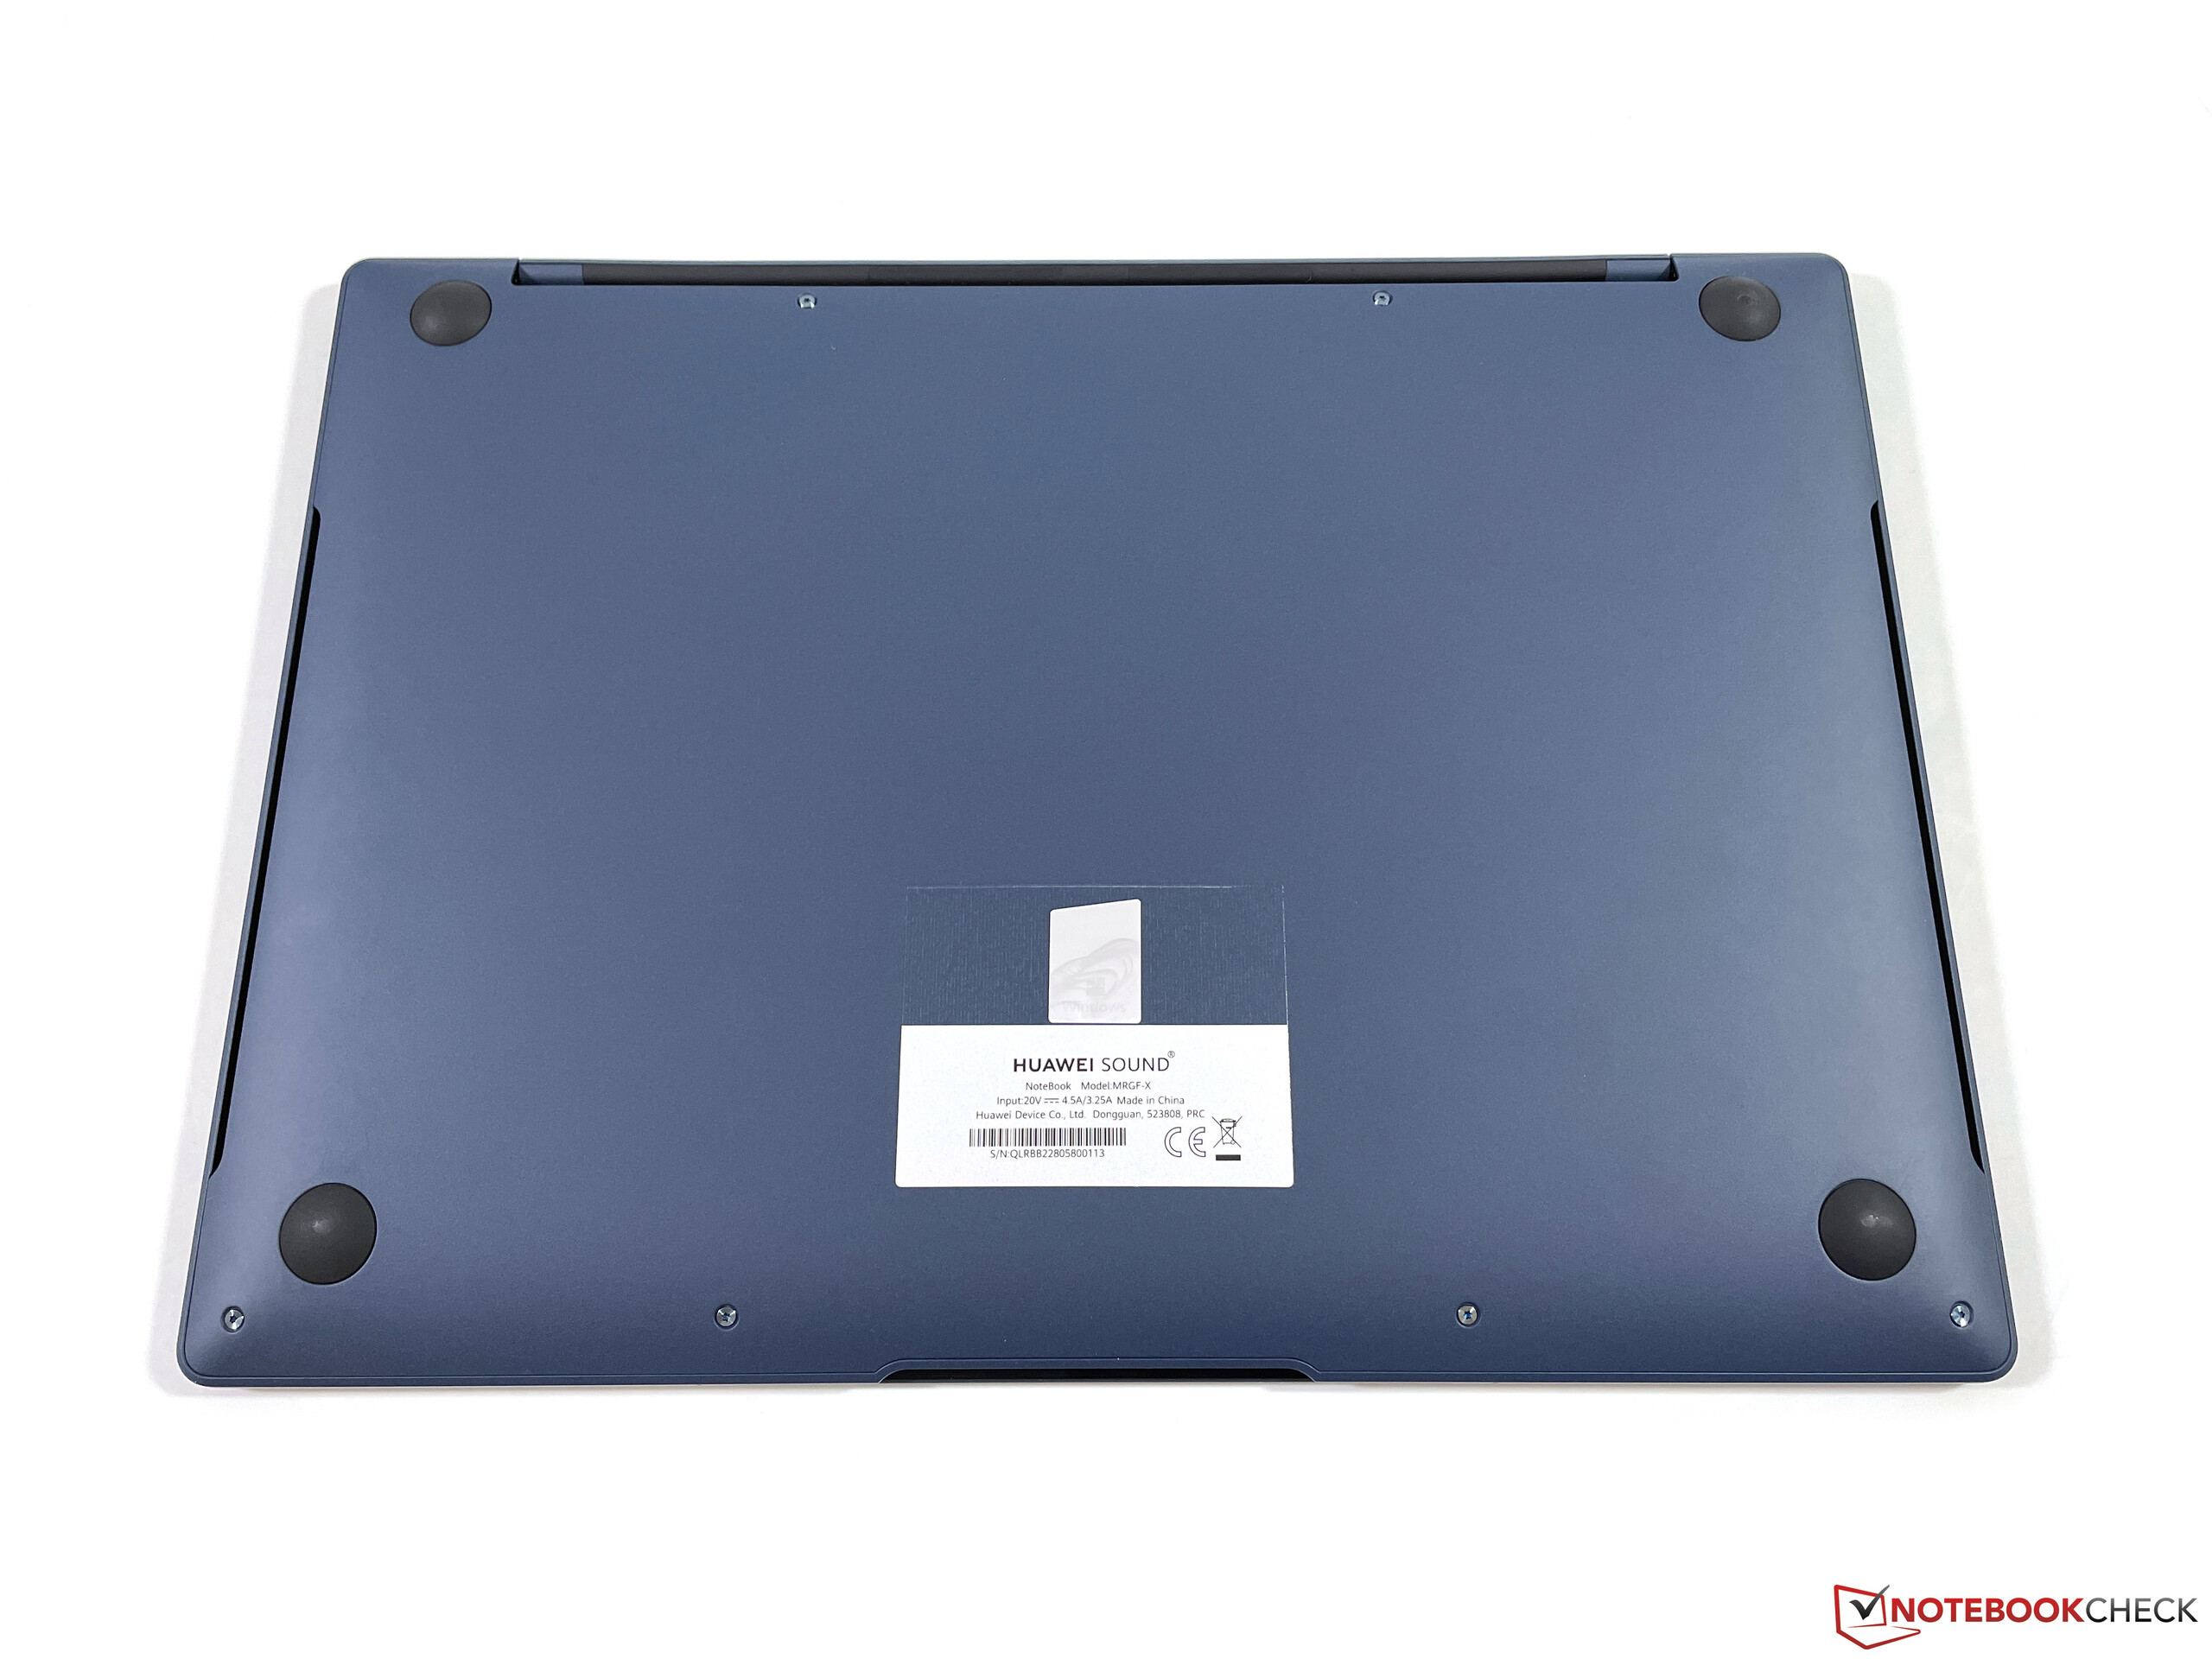
Maintenance
There are six Torx screws (T5) on the bottom and these can be unscrewed easily, but we still could not remove the baseplate. We suspected that there were more hidden screws under the rear rubber feet, which was confirmed in a promotional video from Huawei. However, the rubber feet are extremely tight and Huawei also requested us not to remove them as well as not to open the case for fear of damage. Users therefore have no possibility to carry out maintenance work, which we view as an unnecessary limitation.
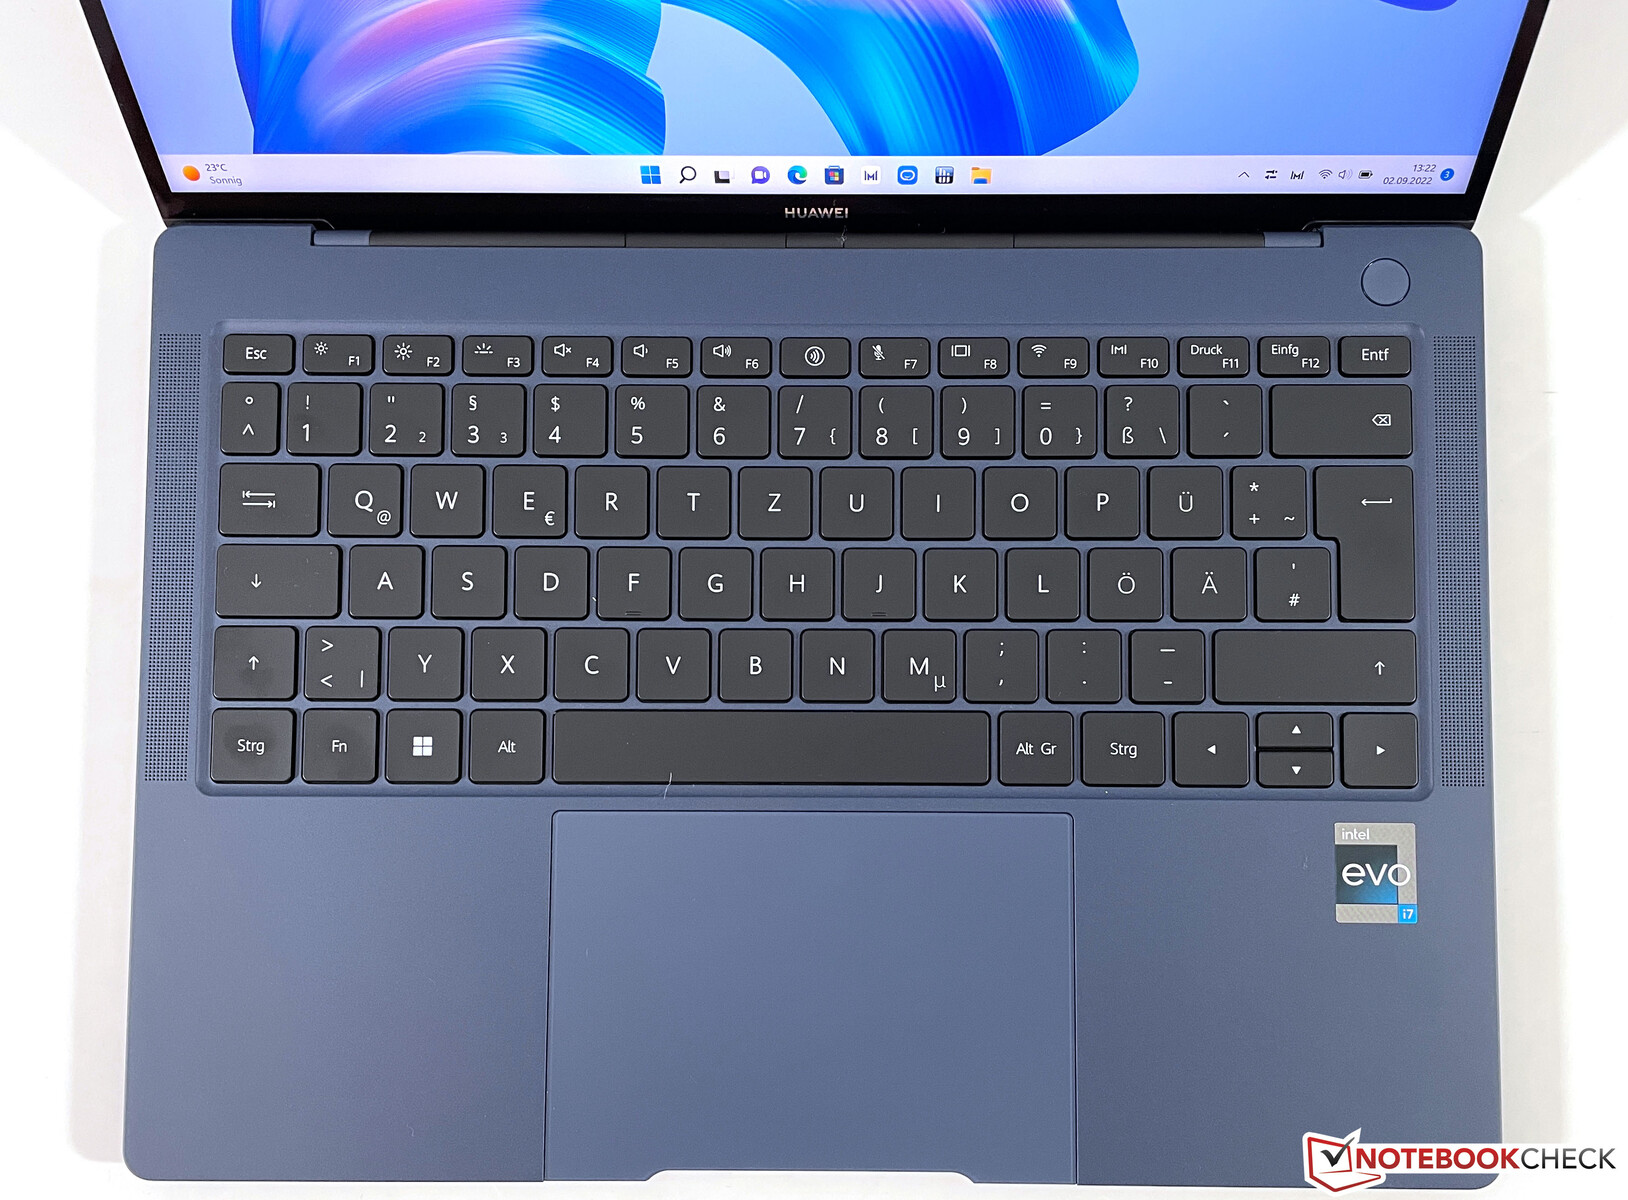
Input Devices - 1.5 mm key travel and FreeTouch
Keyboard
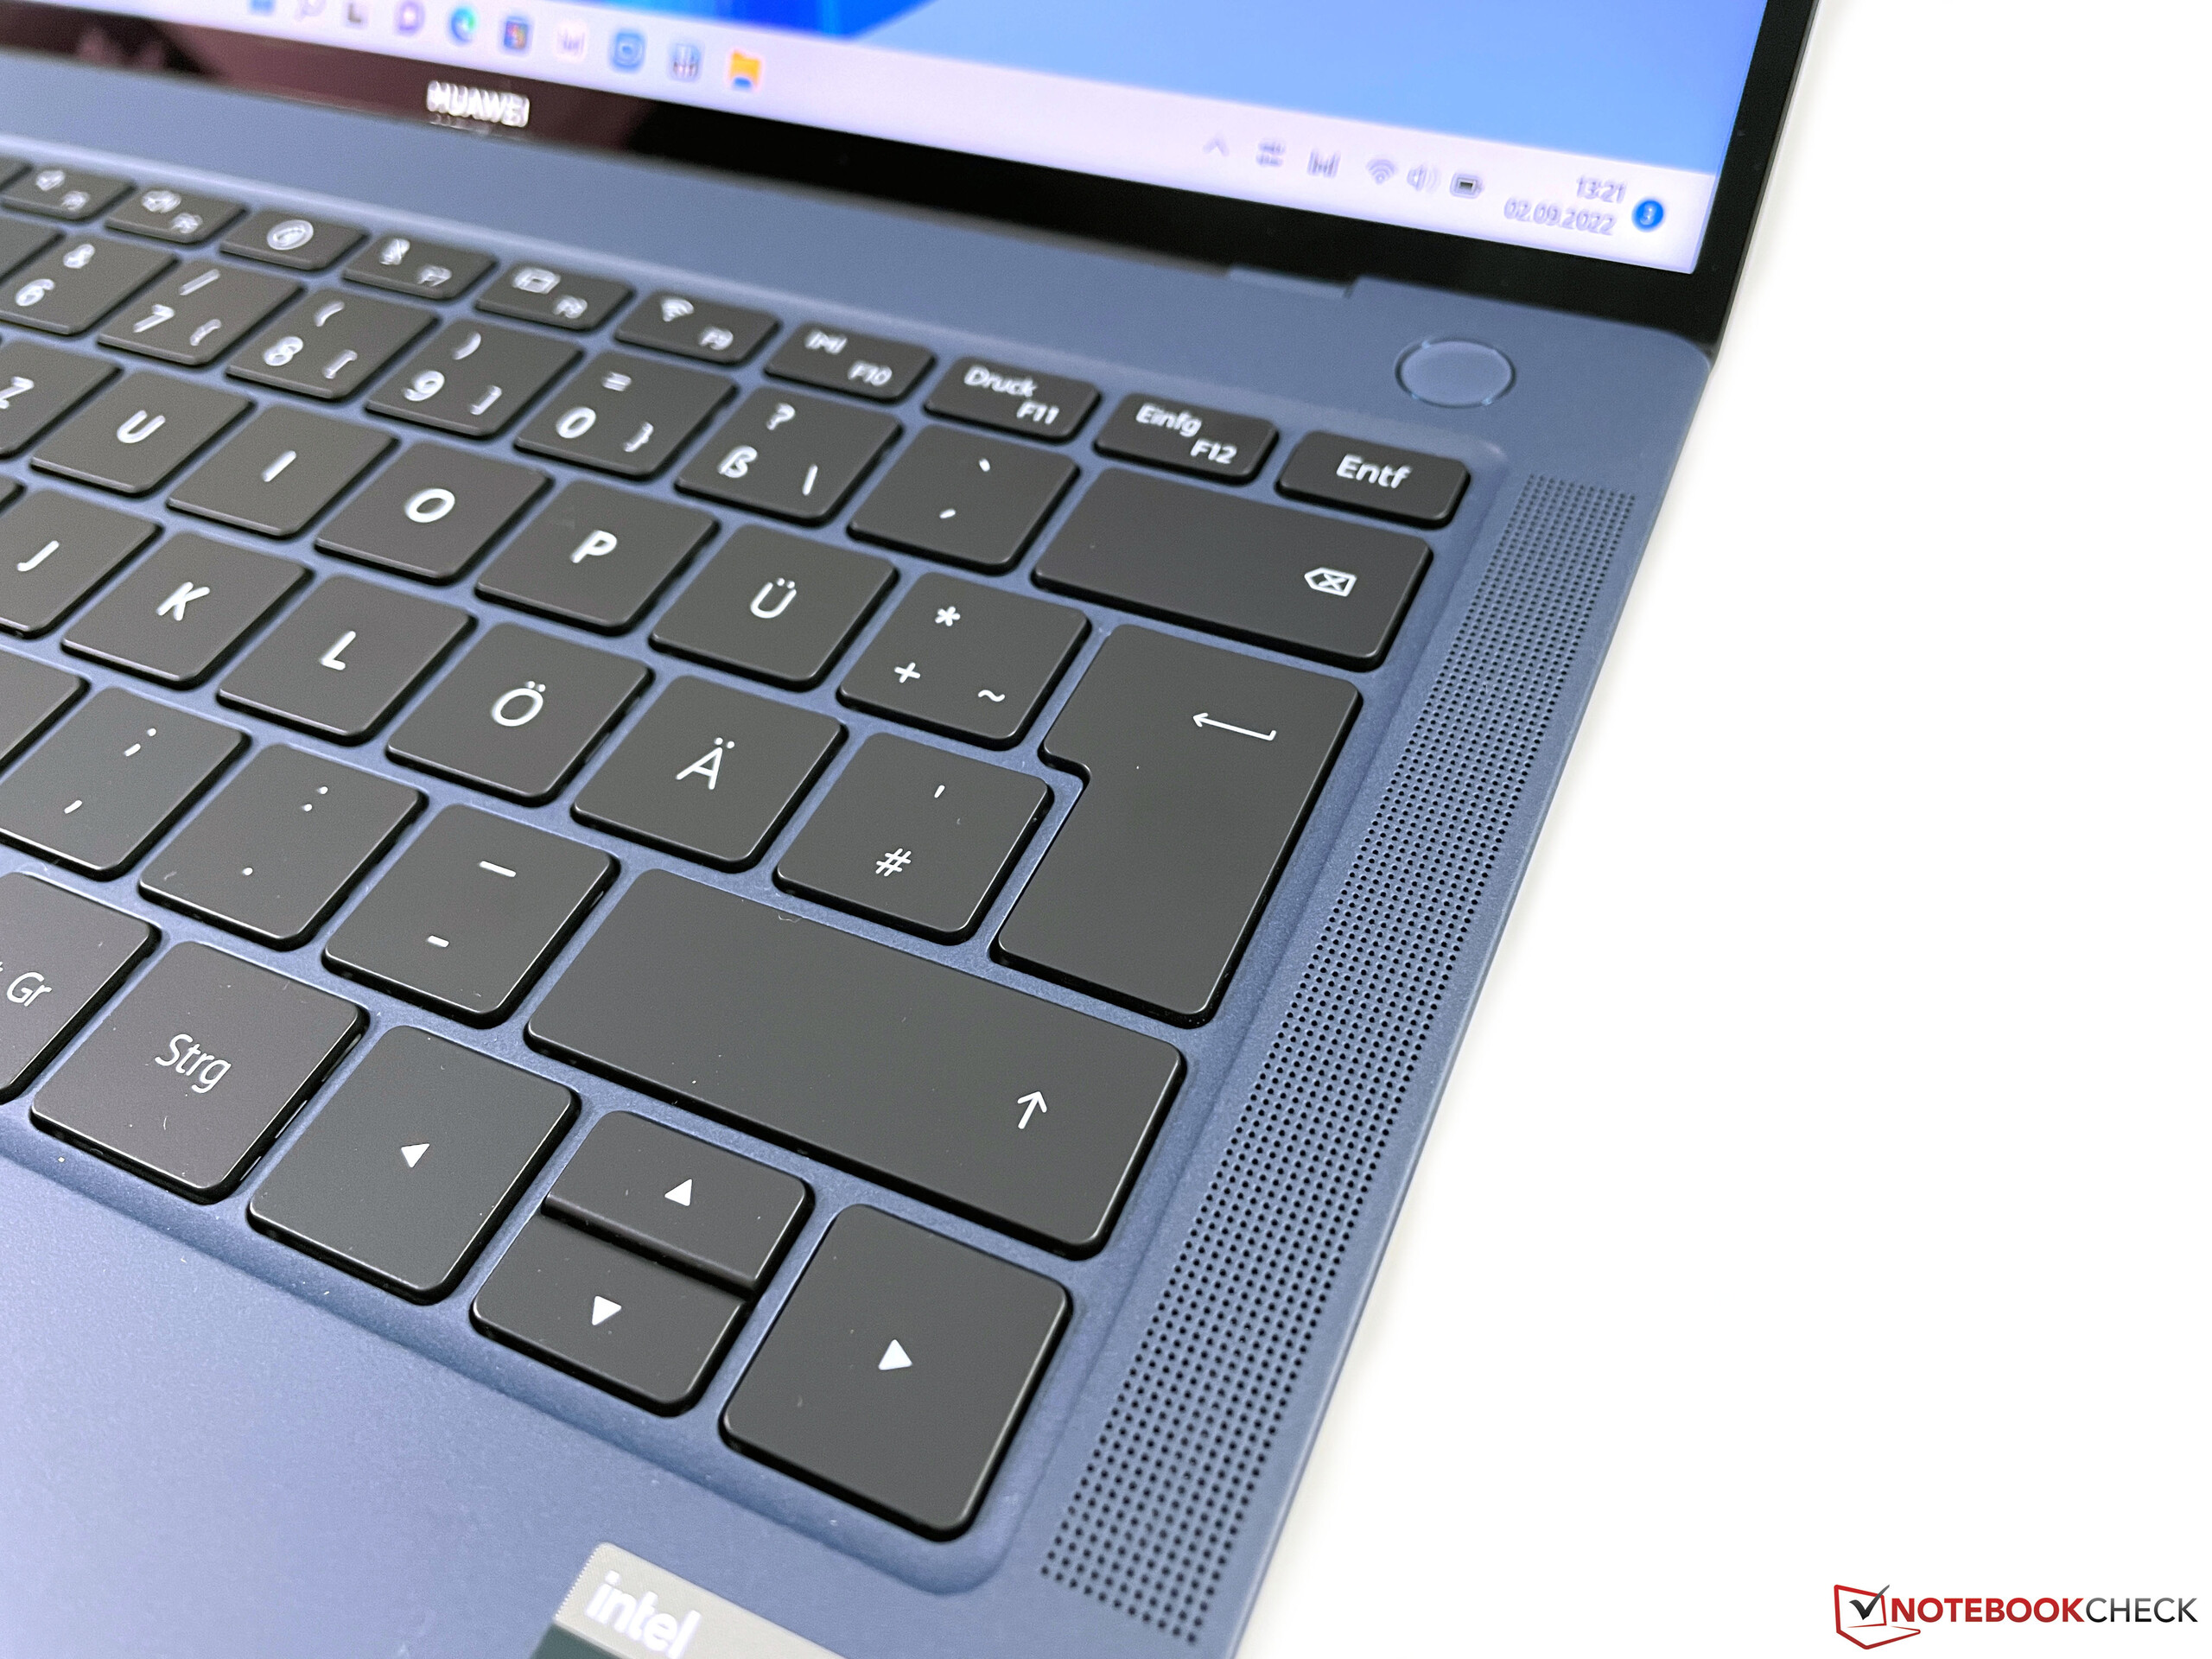
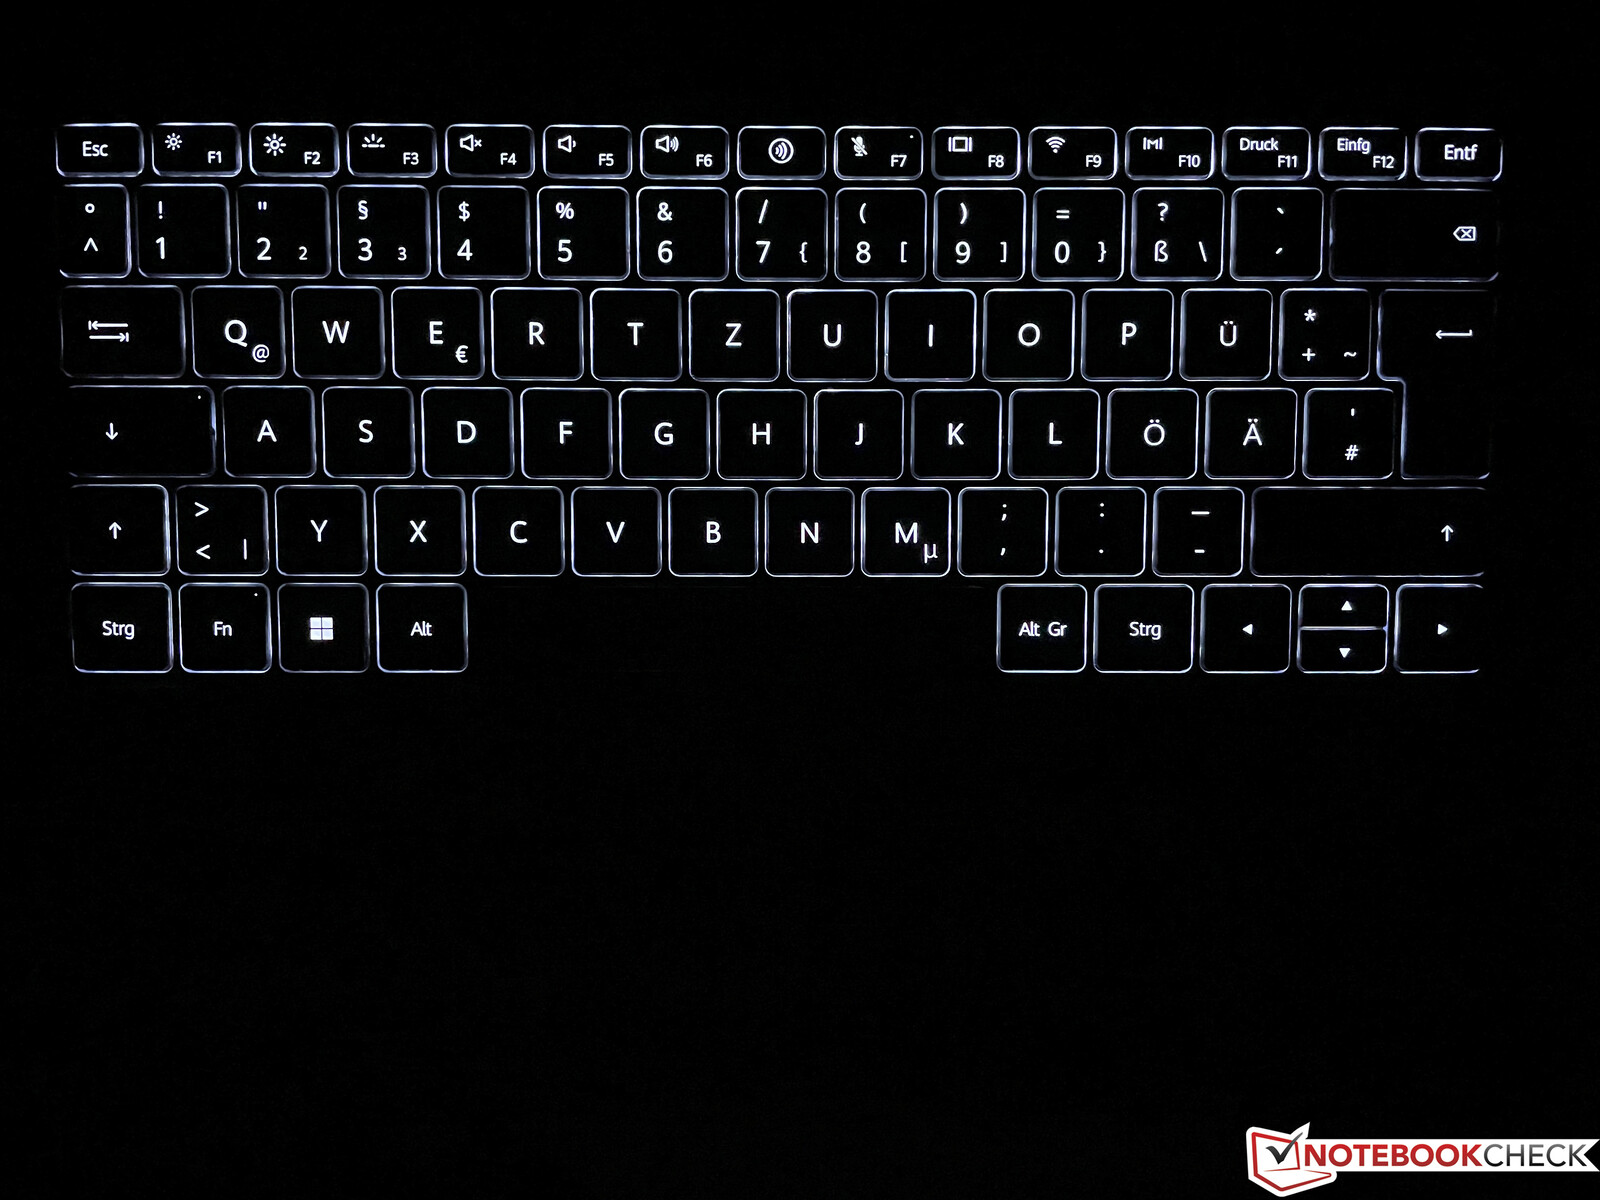
Compared to the old model, Huawei has improved the keyboard and increased the key drop to 1.5 mm. The typing feel is very precise and pleasant, especially for such a compact device. The typing noise is average, but apart from the space bar, nothing rattles. Overall, it is a good keyboard that can be used to write long texts without any problems. A two-stage white backlight helps in dark environments, but this has to be manually activated. In the PC Manager, users can manually set the backlight to be automatically deactivated during inactivity; 15 seconds is the default setting. The power button is located above the keyboard and does not interfere with typing. It also contains the fingerprint scanner, which works reliably.
Touchpad
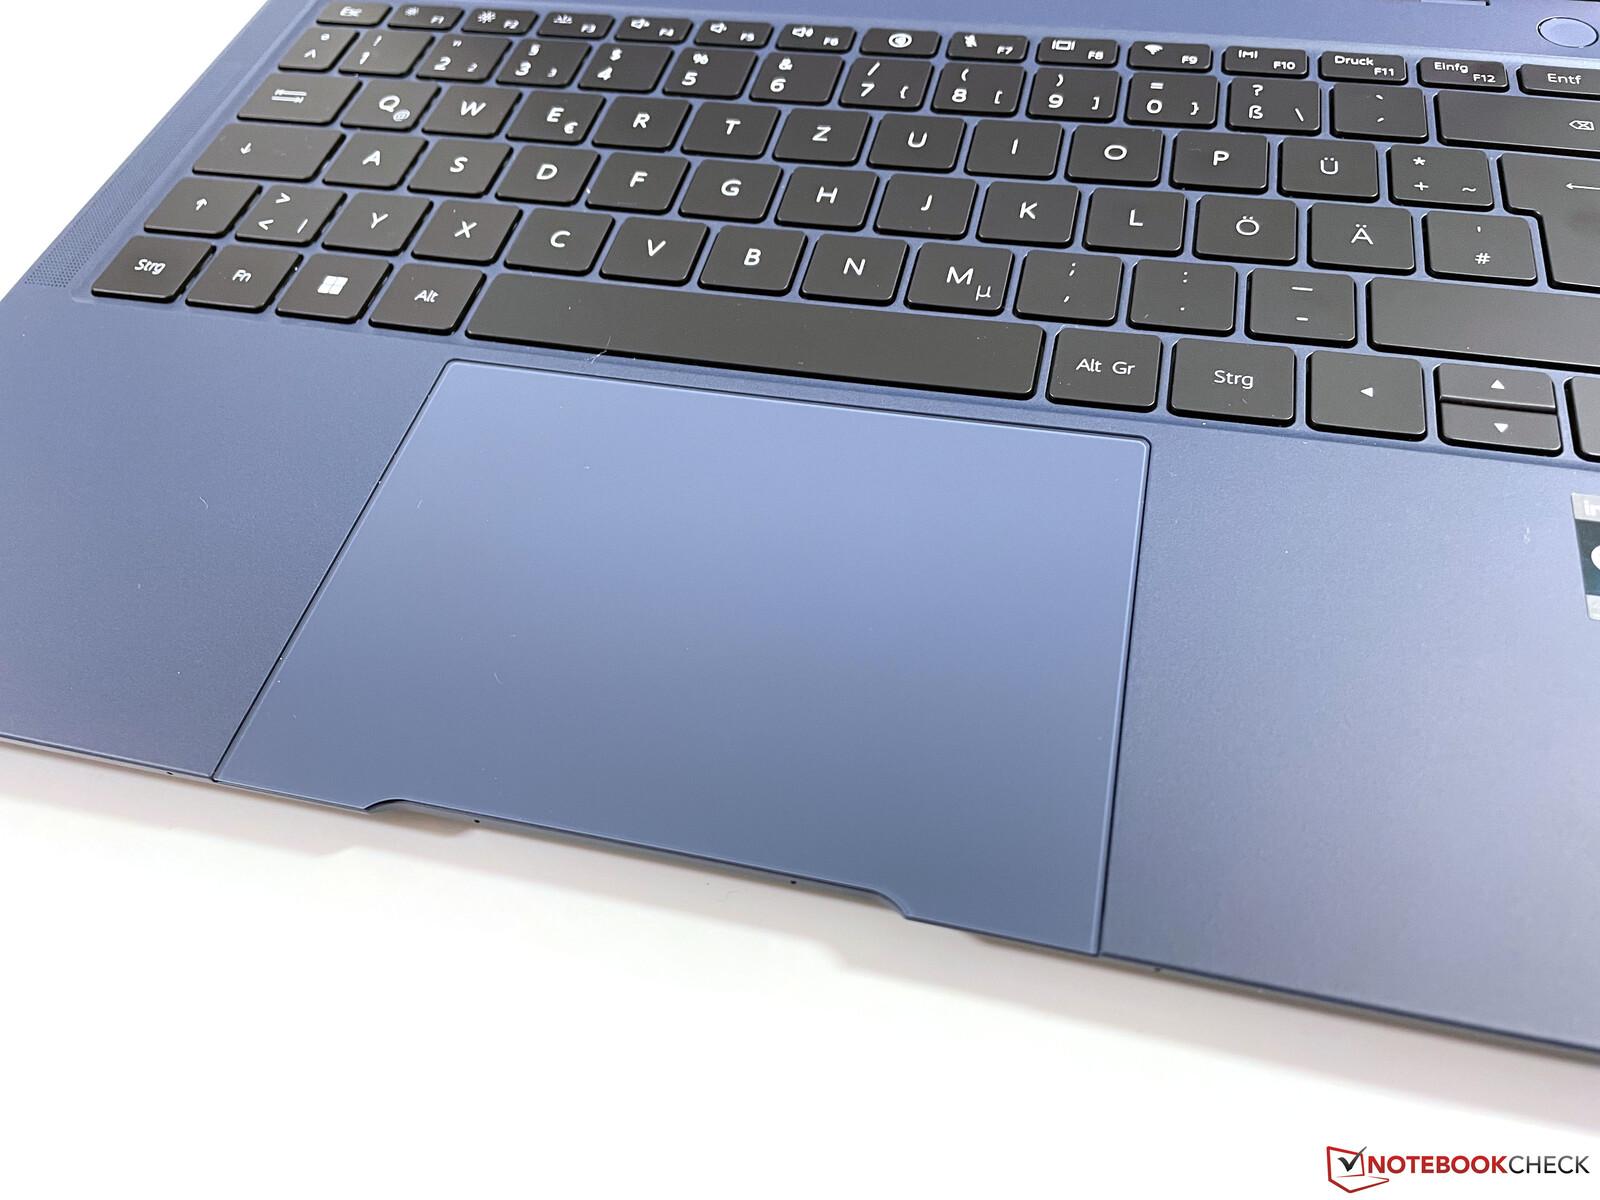
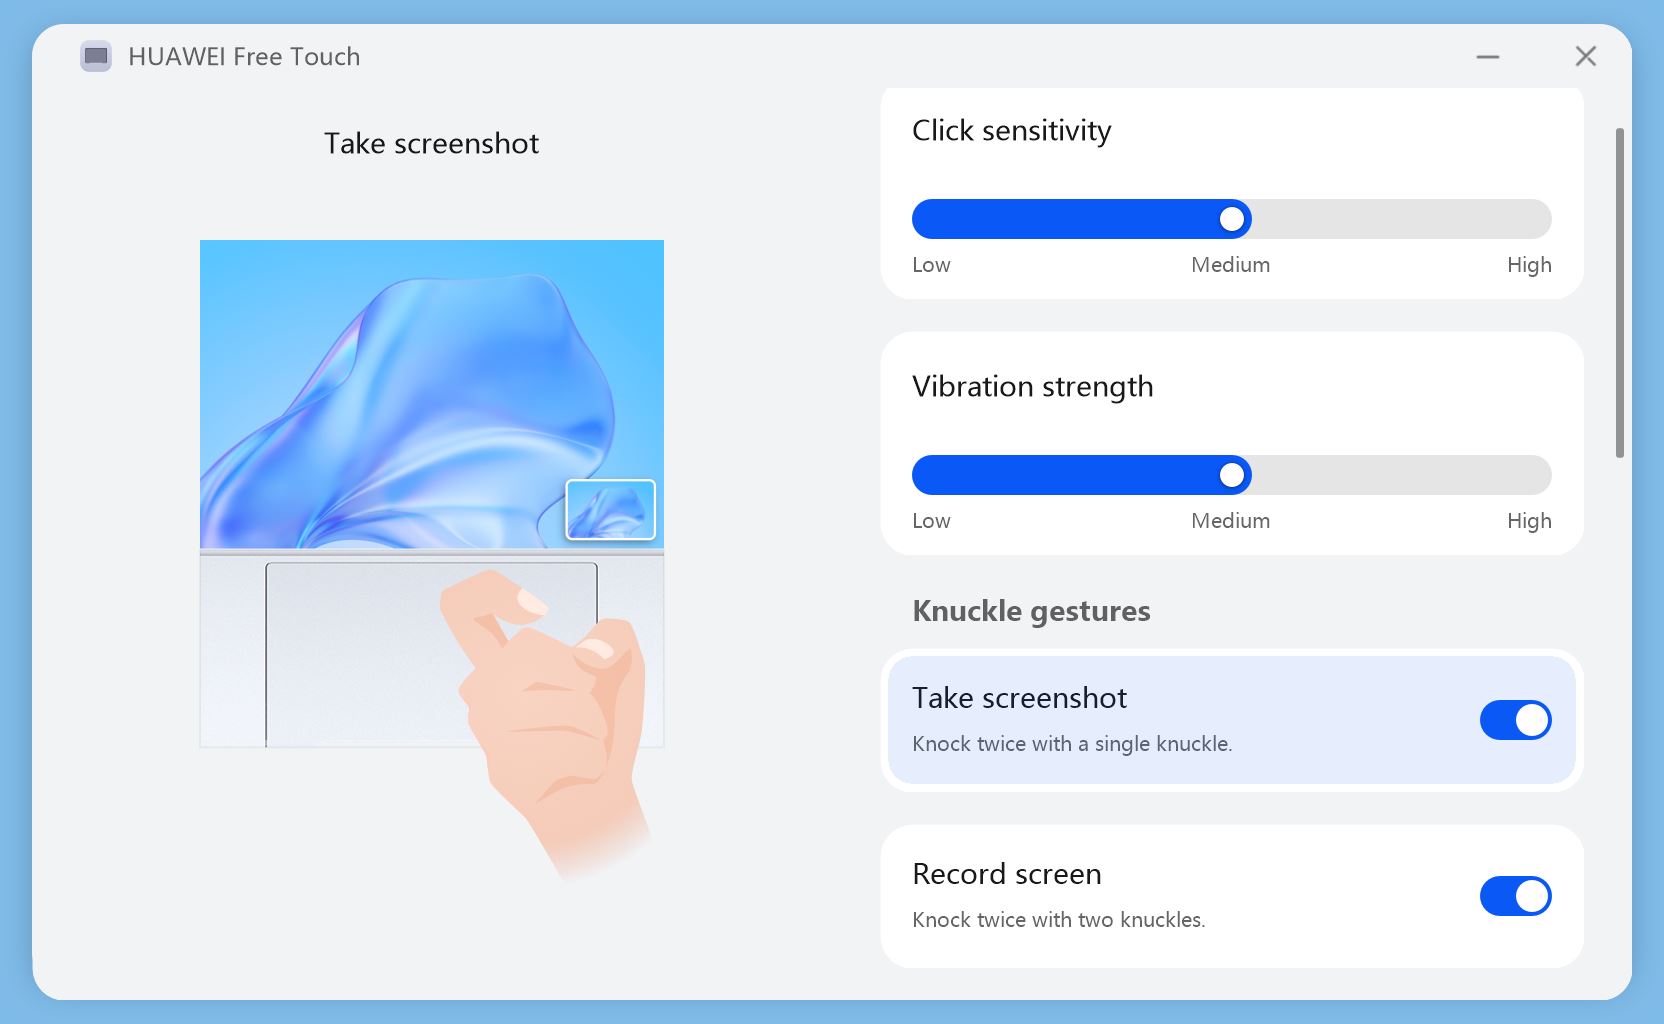
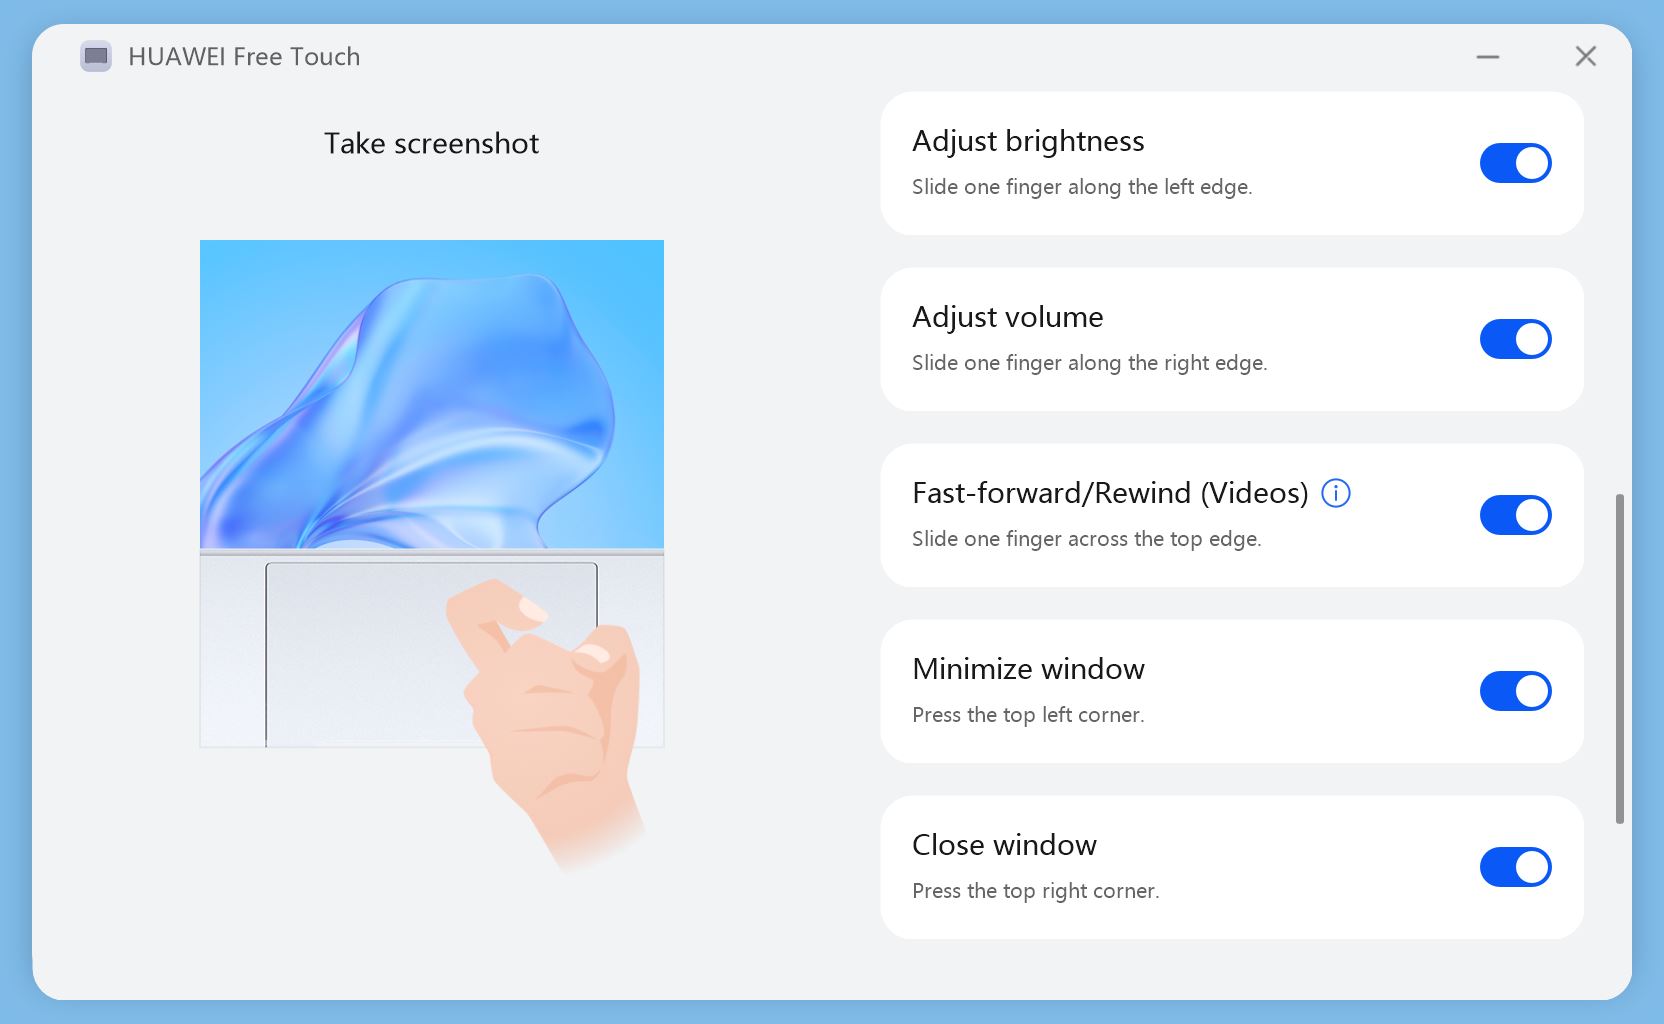
The touchpad is definitely one of the highlights of the new MateBook X Pro 2022. Not only is it very large, extending all the way to the front edge of the case (including the recess), but it also offers a lot of additional functions. Huawei groups these under the term FreeTouch, which involves additional gestures. For example, you can scroll along the two vertical edges to change the screen brightness or volume, which is also supported by a haptic grid effect. You can also scroll through videos or music by scrolling along the upper edge. Other gestures are also available, which are shown in the screenshots below.
The basic pointer control also works flawlessly. Gliding properties are very good and the entire pad allows for clear downward clicking. Like Apple, this is confirmed by haptic feedback that results in a very even and pleasantly quiet clicking noise. At the same time, the component itself is completely solid.
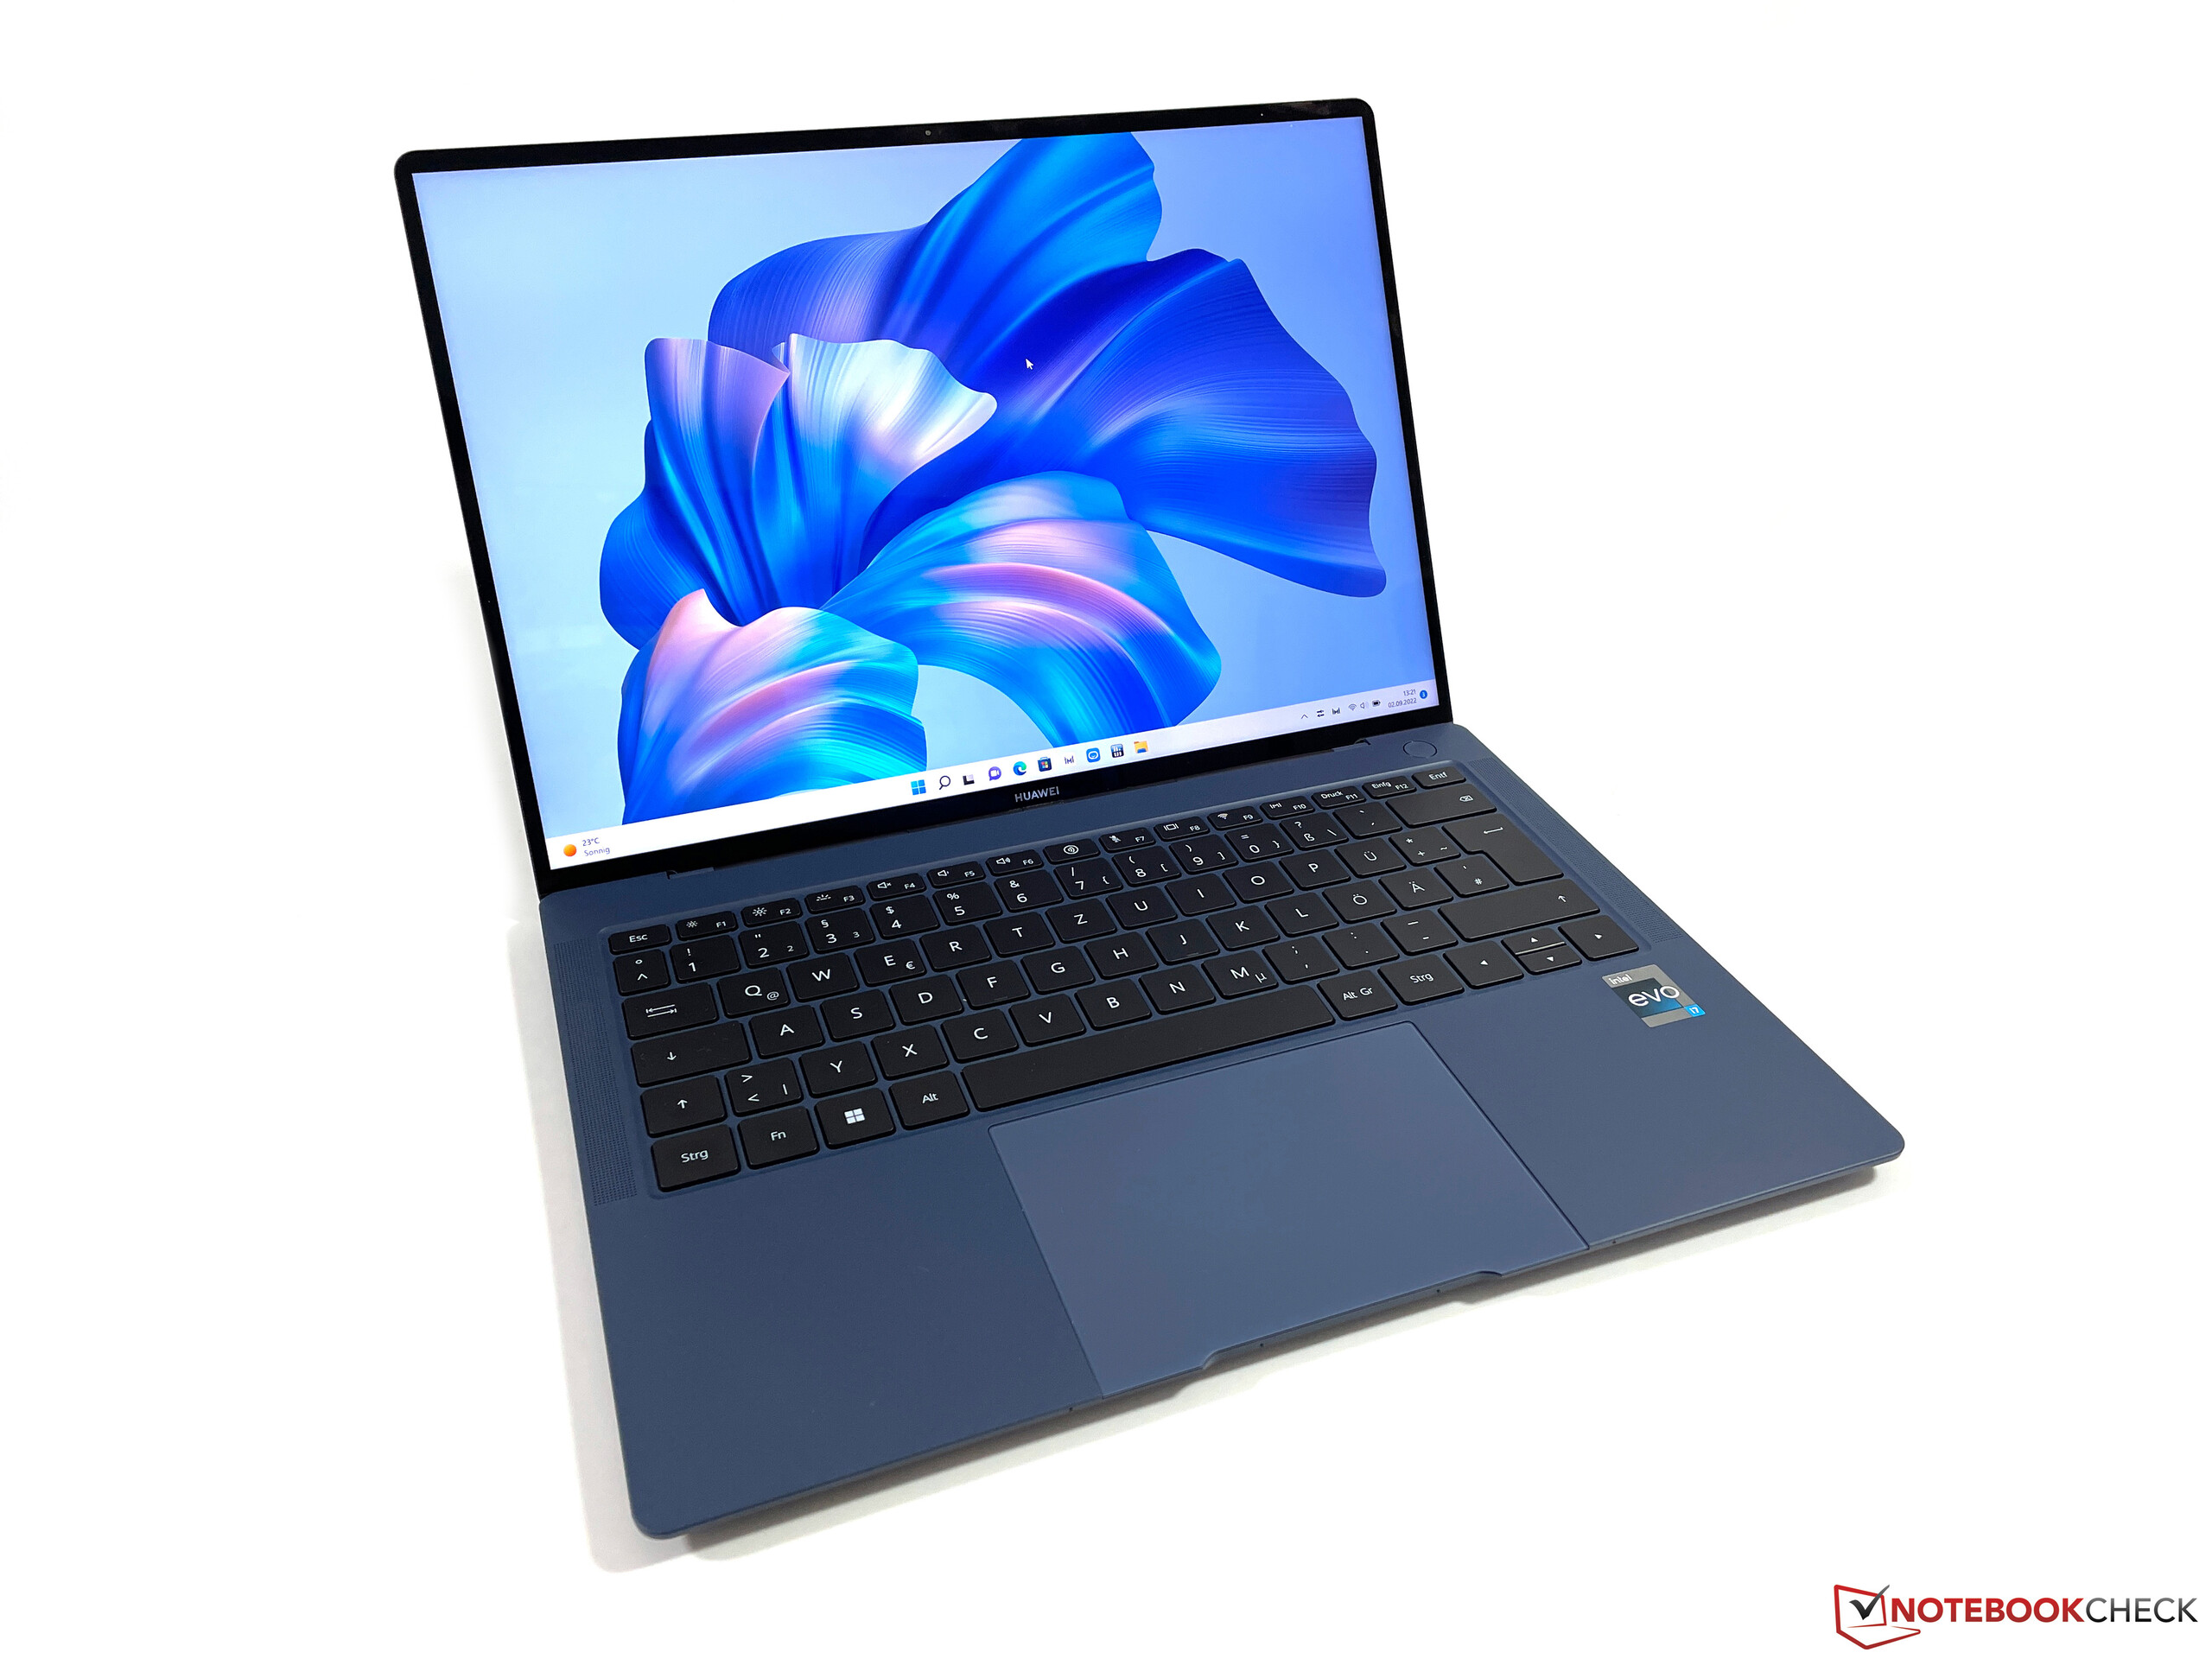
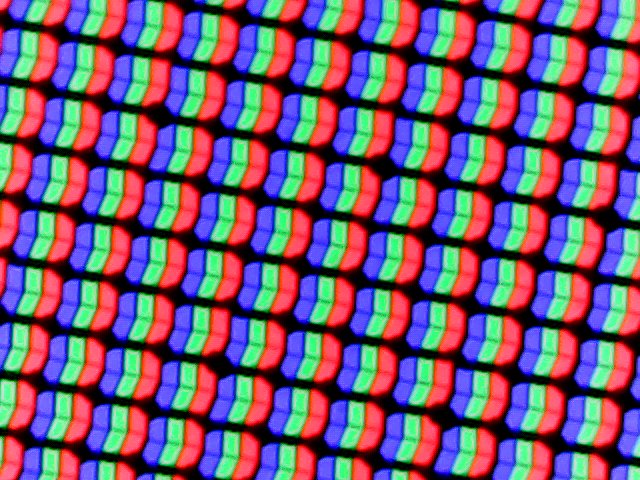
Display - 90 Hz, IPS and no PWM
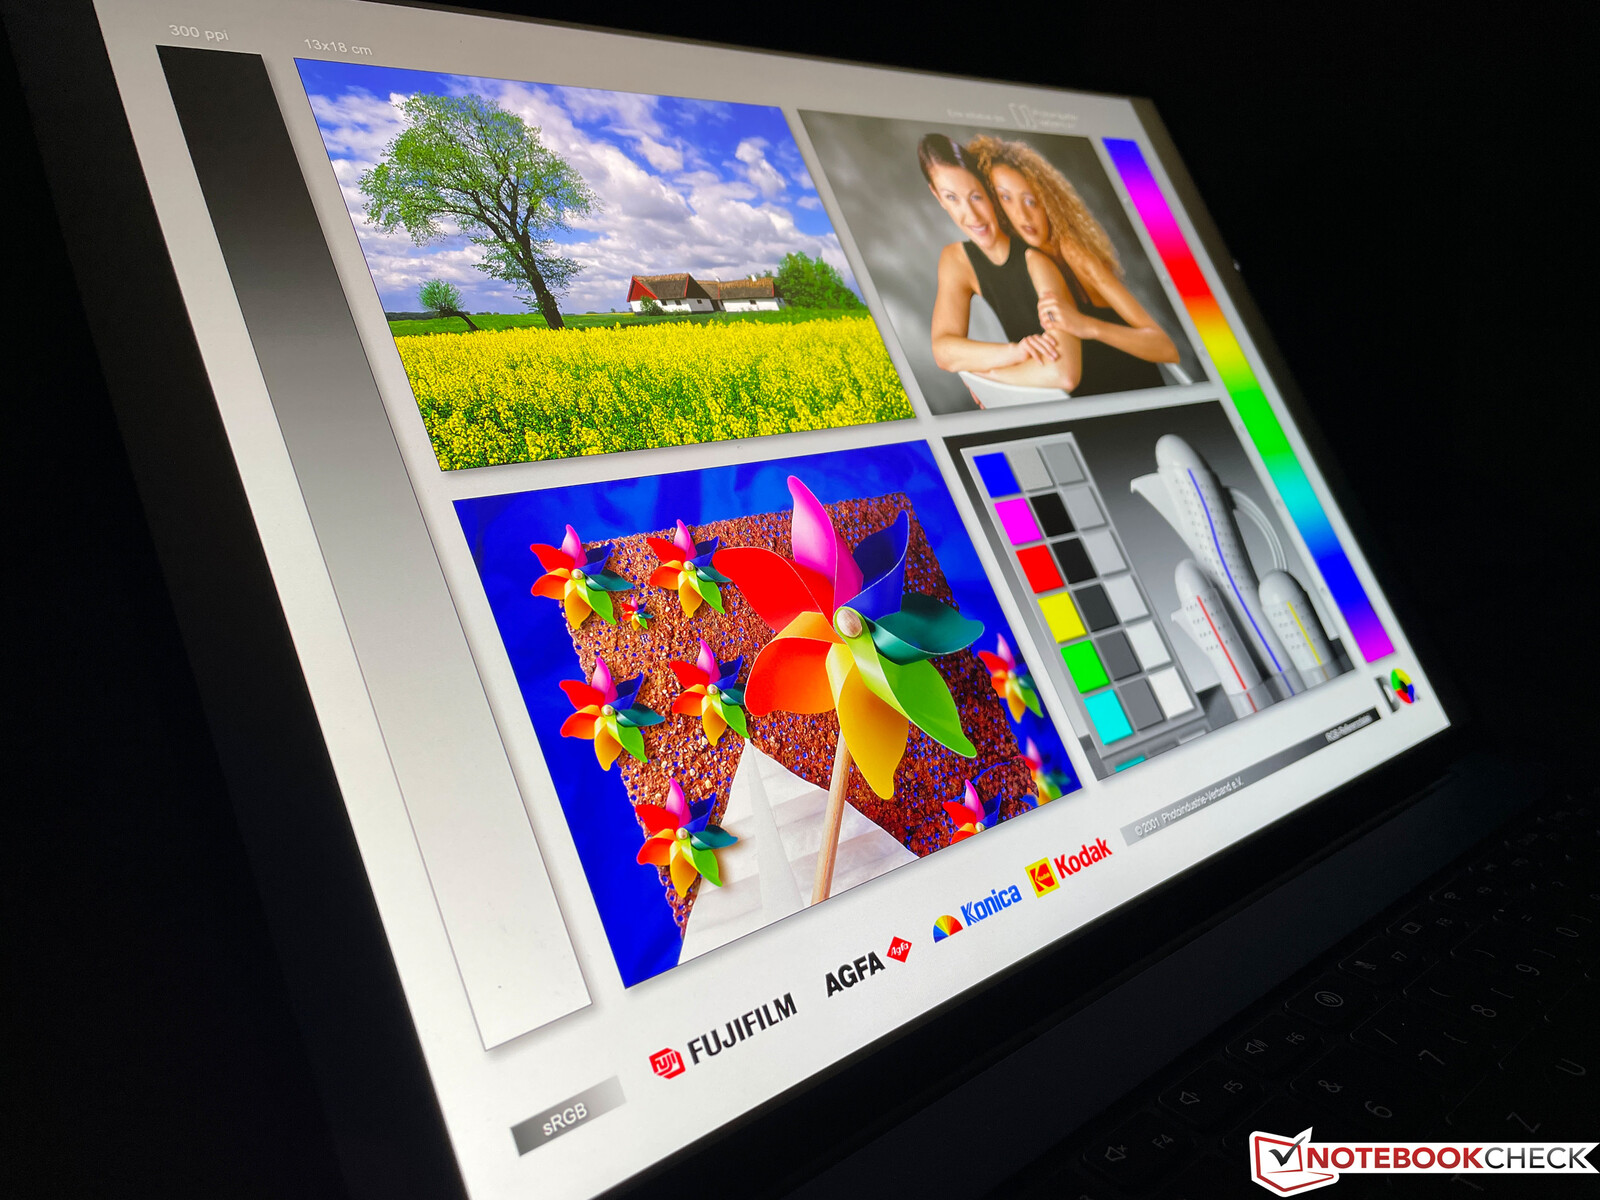
Huawei continues to use a 3:2 IPS display as in the predecessor, but has increased the screen diagonal from 13.9 to 14.2 inches. The resolution is also minimal at 3120x2080 pixels, resulting in a high pixel density of 264 DPI. The subjective picture impression of the capacitive touchscreen is excellent, as colors appear very rich and the content is extremely sharp. In addition, the monitor offers a higher refresh rate of 90 Hz, which enables a much smoother picture impression during visual media playback. However, this has to be activated manually first, either in the display settings or via the Fn+R key combination. The brightness can be controlled automatically via sensor and the color temperature can also be adjusted to the lighting conditions.
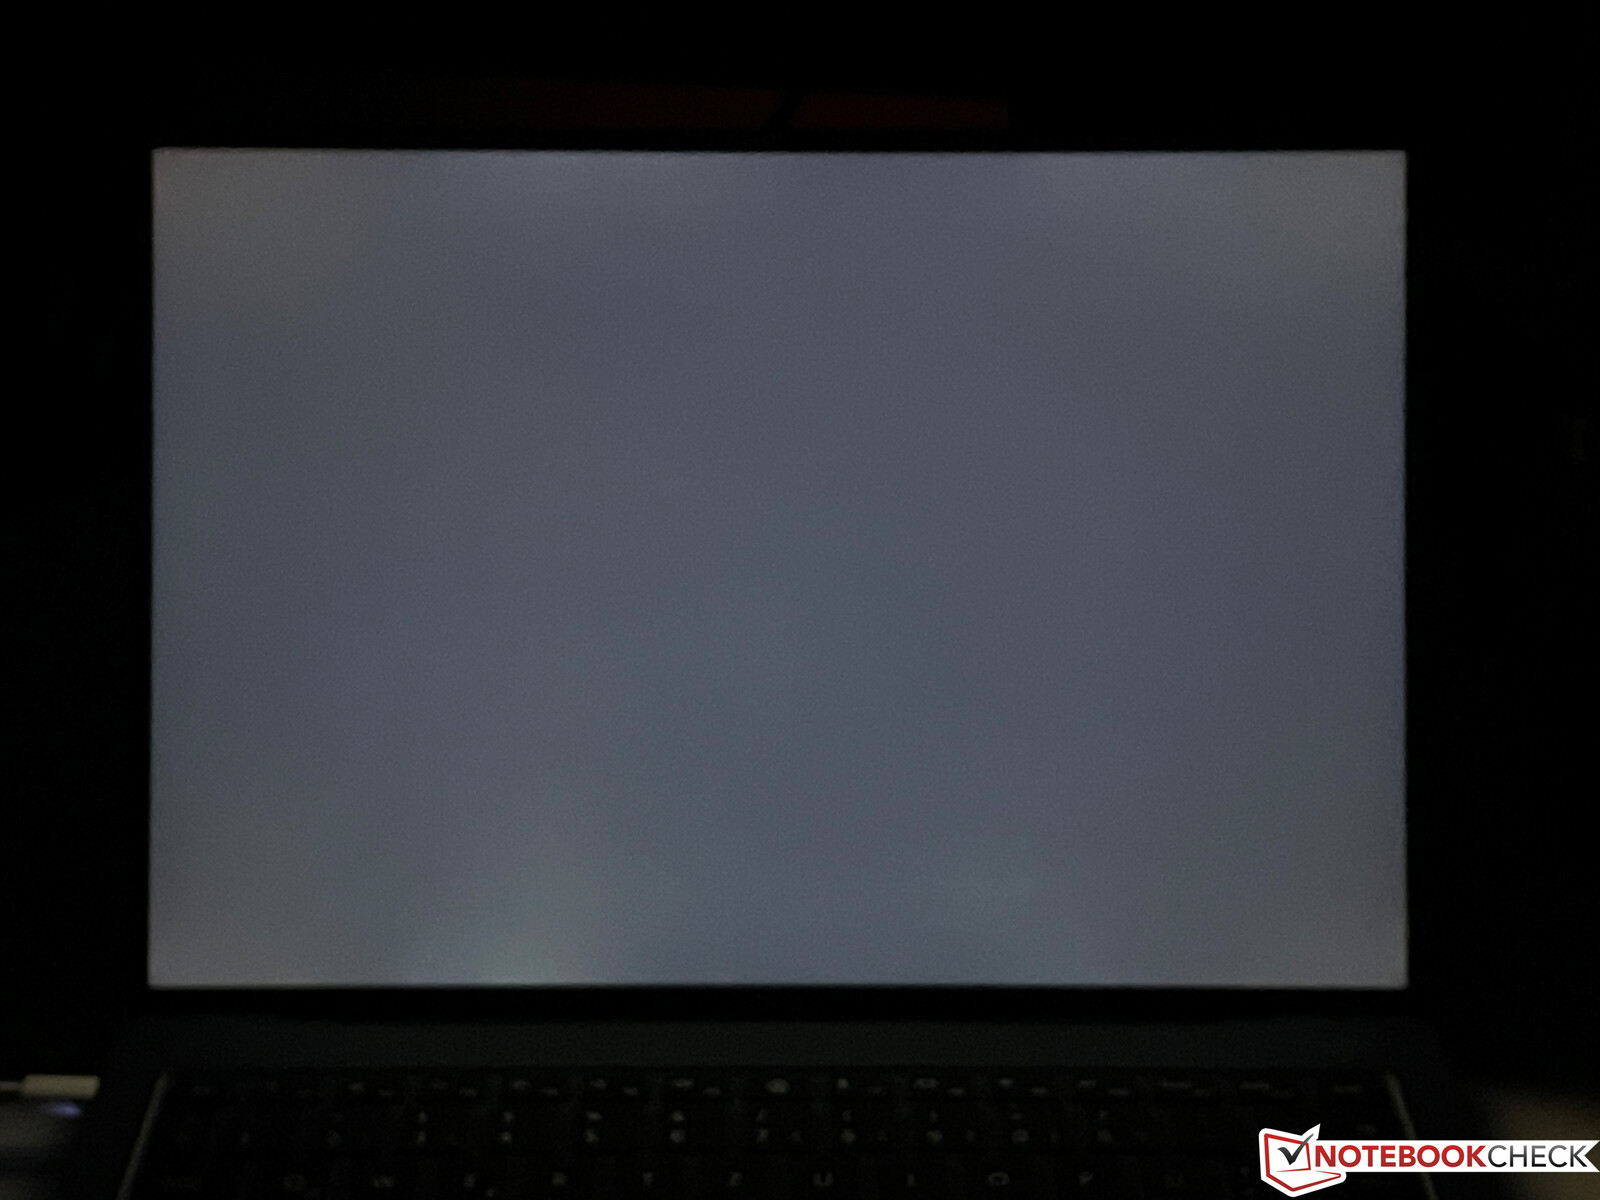
Huawei specifies a brightness of 500 cd/m², which our review sample easily surpasses with an average brightness of almost 590 cd/m². This gives the panel an advantage over many OLED screens, which usually only reach 400 cd/m² in normal SDR mode. The black value (0.39) and contrast (>1,500:1) of the IPS panel are of course inferior to OLEDs, but the performance is still very good. You can only really see halos at maximum brightness on a dark background, which shouldn't happen too often in practice. The response times are very good for an IPS panel and no PWM flickering was detected.
The panel also supports HDR content, but this also has to be activated in the Windows settings first. The playback of corresponding HDR content works fine, but subjectively, HDR images look better on OLED or mini-LED panels, which is mainly due to the higher contrast ratio.
| |||||||||||||||||||||||||
Brightness Distribution: 91 %
Center on Battery: 598 cd/m²
Contrast: 1546:1 (Black: 0.39 cd/m²)
ΔE Color 1.1 | 0.5-29.43 Ø5, calibrated: 1.2
ΔE Greyscale 1.5 | 0.57-98 Ø5.3
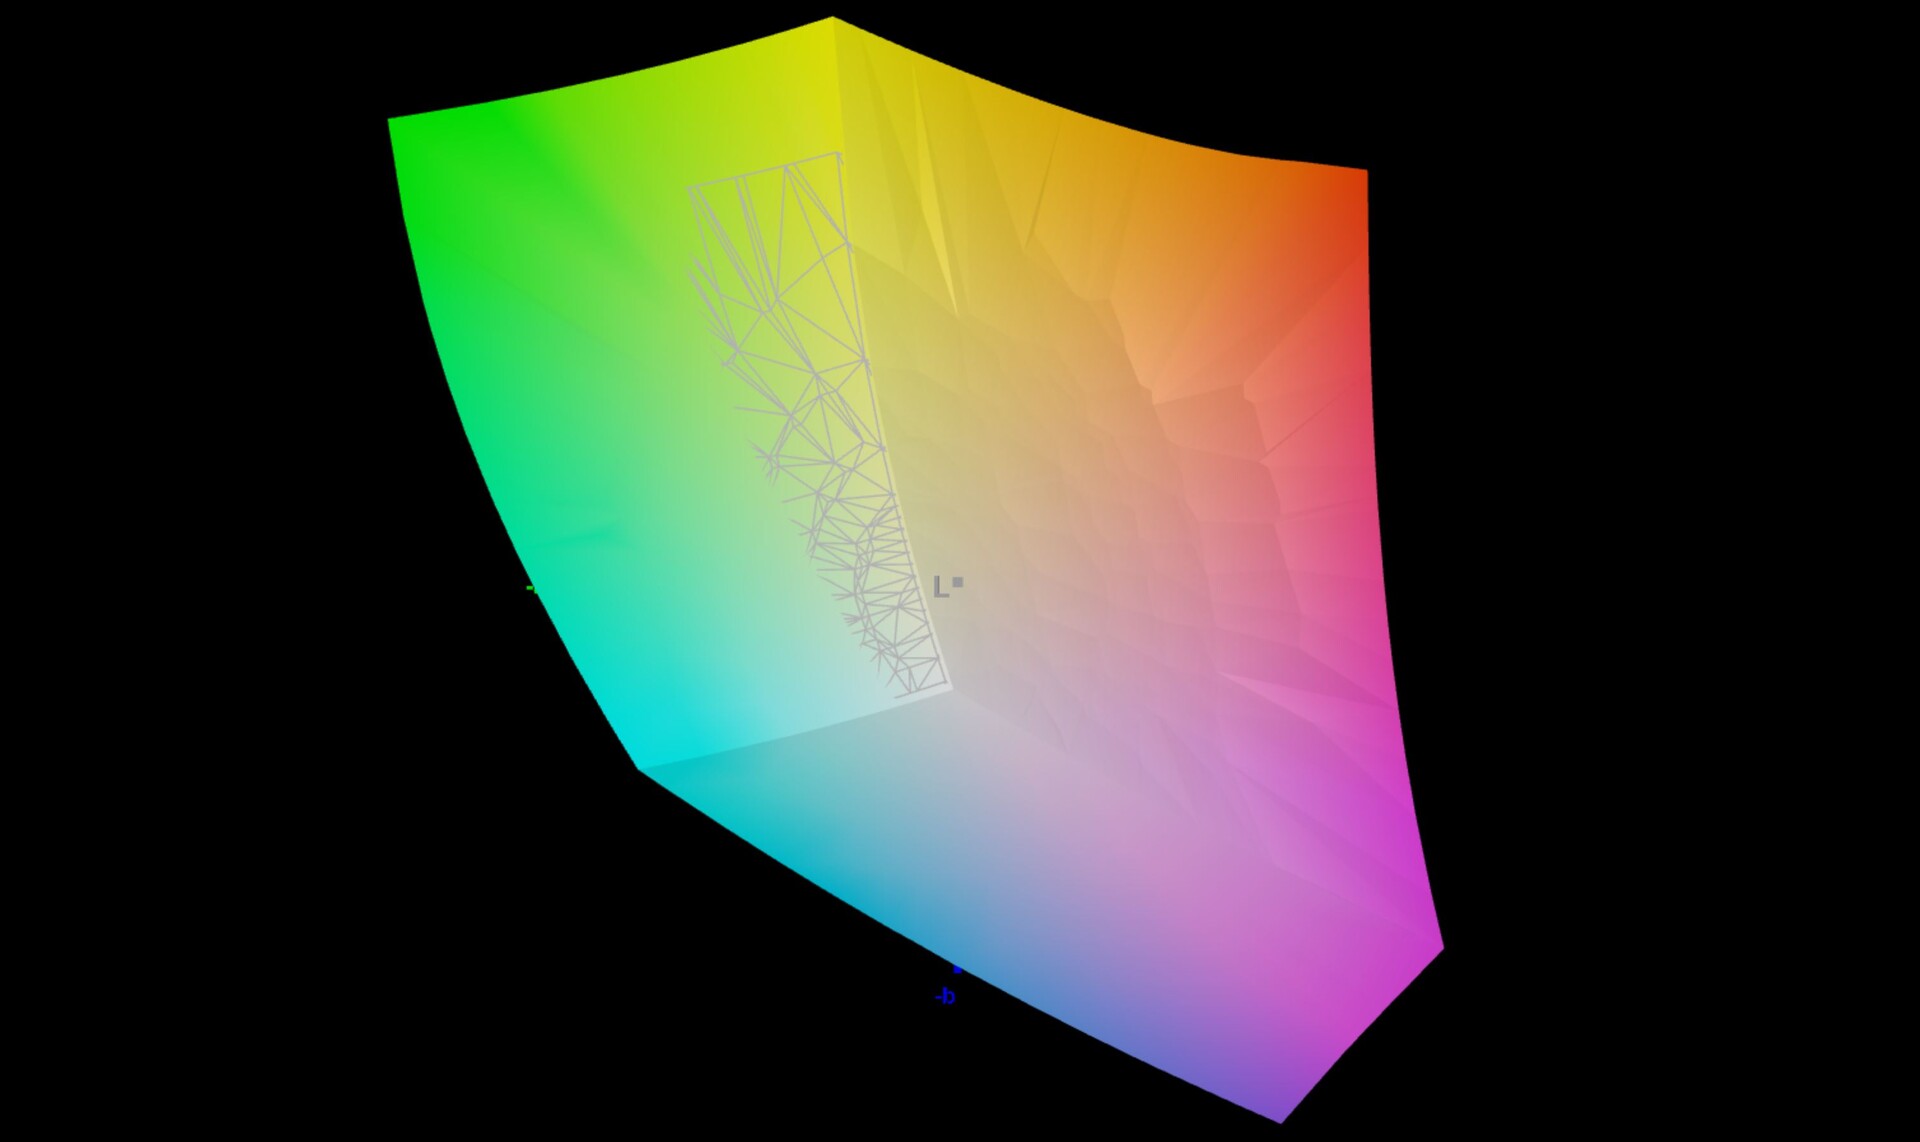
86.5% AdobeRGB 1998 (Argyll 2.2.0 3D)
99.5% sRGB (Argyll 2.2.0 3D)
94.6% Display P3 (Argyll 2.2.0 3D)
Gamma: 2.17
| Huawei MateBook X Pro 2022 TMX1422, IPS, 3120x2080, 14.20 | Apple MacBook Air M2 Entry IPS, 2560x1664, 13.60 | Lenovo Yoga 9i 14 2022 i7-1260P LEN140WQUXGA, OLED, 3840x2400, 14.00 | Asus Zenbook S 13 OLED SDC4172, OLED, 2880x1800, 13.30 | Dell XPS 13 Plus 9320 4K LQ134R1, IPS, 3840x2400, 13.40 | Huawei MateBook X Pro 2021 TIANMA XM, IPS, 3000x2000, 13.90 | |
|---|---|---|---|---|---|---|
| Display | 2% | 6% | 6% | -10% | -20% | |
| Display P3 Coverage | 94.6 | 98.4 4% | 98.7 4% | 99.8 5% | 76.5 -19% | 64.9 -31% |
| sRGB Coverage | 99.5 | 99.9 0% | 99.8 0% | 100 1% | 100 1% | 94.4 -5% |
| AdobeRGB 1998 Coverage | 86.5 | 87.6 1% | 98.5 14% | 97.8 13% | 76 -12% | 66.3 -23% |
| Response Times | -38% | 87% | 91% | -41% | -51% | |
| Response Time Grey 50% / Grey 80% * | 25.4 ? | 32.9 ? -30% | 2.8 ? 89% | 2.1 ? 92% | 38.9 ? -53% | 37.6 ? -48% |
| Response Time Black / White * | 17.1 ? | 24.9 ? -46% | 2.8 ? 84% | 1.68 ? 90% | 21.9 ? -28% | 26.4 ? -54% |
| PWM Frequency | 239.2 ? | 240.4 ? | ||||
| Screen | -8% | 2867% | 95% | -45% | -14% | |
| Brightness middle | 603 | 526 -13% | 361 -40% | 336 -44% | 494 -18% | 502 -17% |
| Brightness | 586 | 486 -17% | 362 -38% | 338 -42% | 474 -19% | 474 -19% |
| Brightness Distribution | 91 | 87 -4% | 98 8% | 99 9% | 89 -2% | 89 -2% |
| Black Level * | 0.39 | 0.38 3% | 0.001 100% | 0.02 95% | 0.28 28% | 0.33 15% |
| Contrast | 1546 | 1384 -10% | 361000 23251% | 16800 987% | 1764 14% | 1521 -2% |
| Colorchecker dE 2000 * | 1.1 | 1.3 -18% | 2.8 -155% | 1.8 -64% | 3.1 -182% | 1.35 -23% |
| Colorchecker dE 2000 max. * | 2.2 | 2.7 -23% | 5.8 -164% | 3.8 -73% | 4.2 -91% | 3.67 -67% |
| Colorchecker dE 2000 calibrated * | 1.2 | 0.7 42% | 1.8 -50% | 1.5 -25% | 1.2 -0% | |
| Greyscale dE 2000 * | 1.5 | 2 -33% | 1.9 -27% | 0.9 40% | 3.2 -113% | 1.7 -13% |
| Gamma | 2.17 101% | 2.25 98% | 2.16 102% | 2.22 99% | 2.41 91% | 2.24 98% |
| CCT | 6549 99% | 6858 95% | 6181 105% | 6580 99% | 6189 105% | 6440 101% |
| Color Space (Percent of AdobeRGB 1998) | 61.1 | |||||
| Color Space (Percent of sRGB) | 94.3 | |||||
| Total Average (Program / Settings) | -15% /
-10% | 987% /
1779% | 64% /
76% | -32% /
-37% | -28% /
-21% |
* ... smaller is better
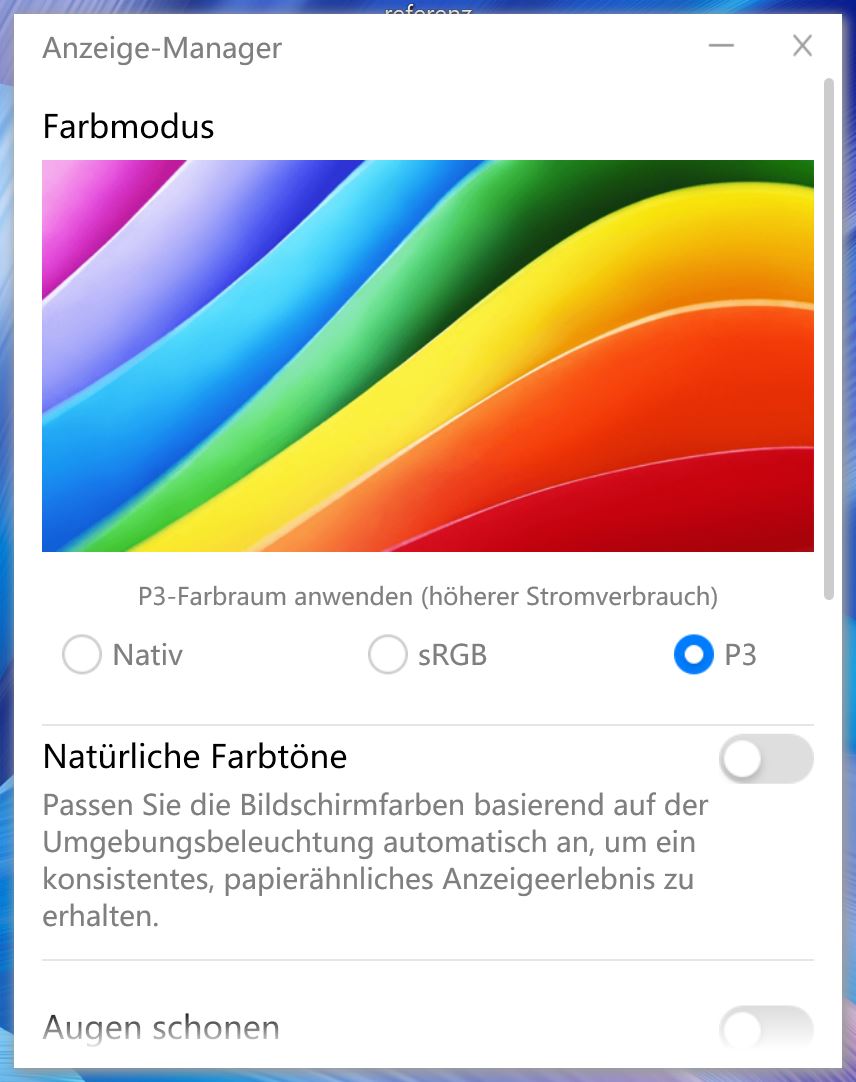
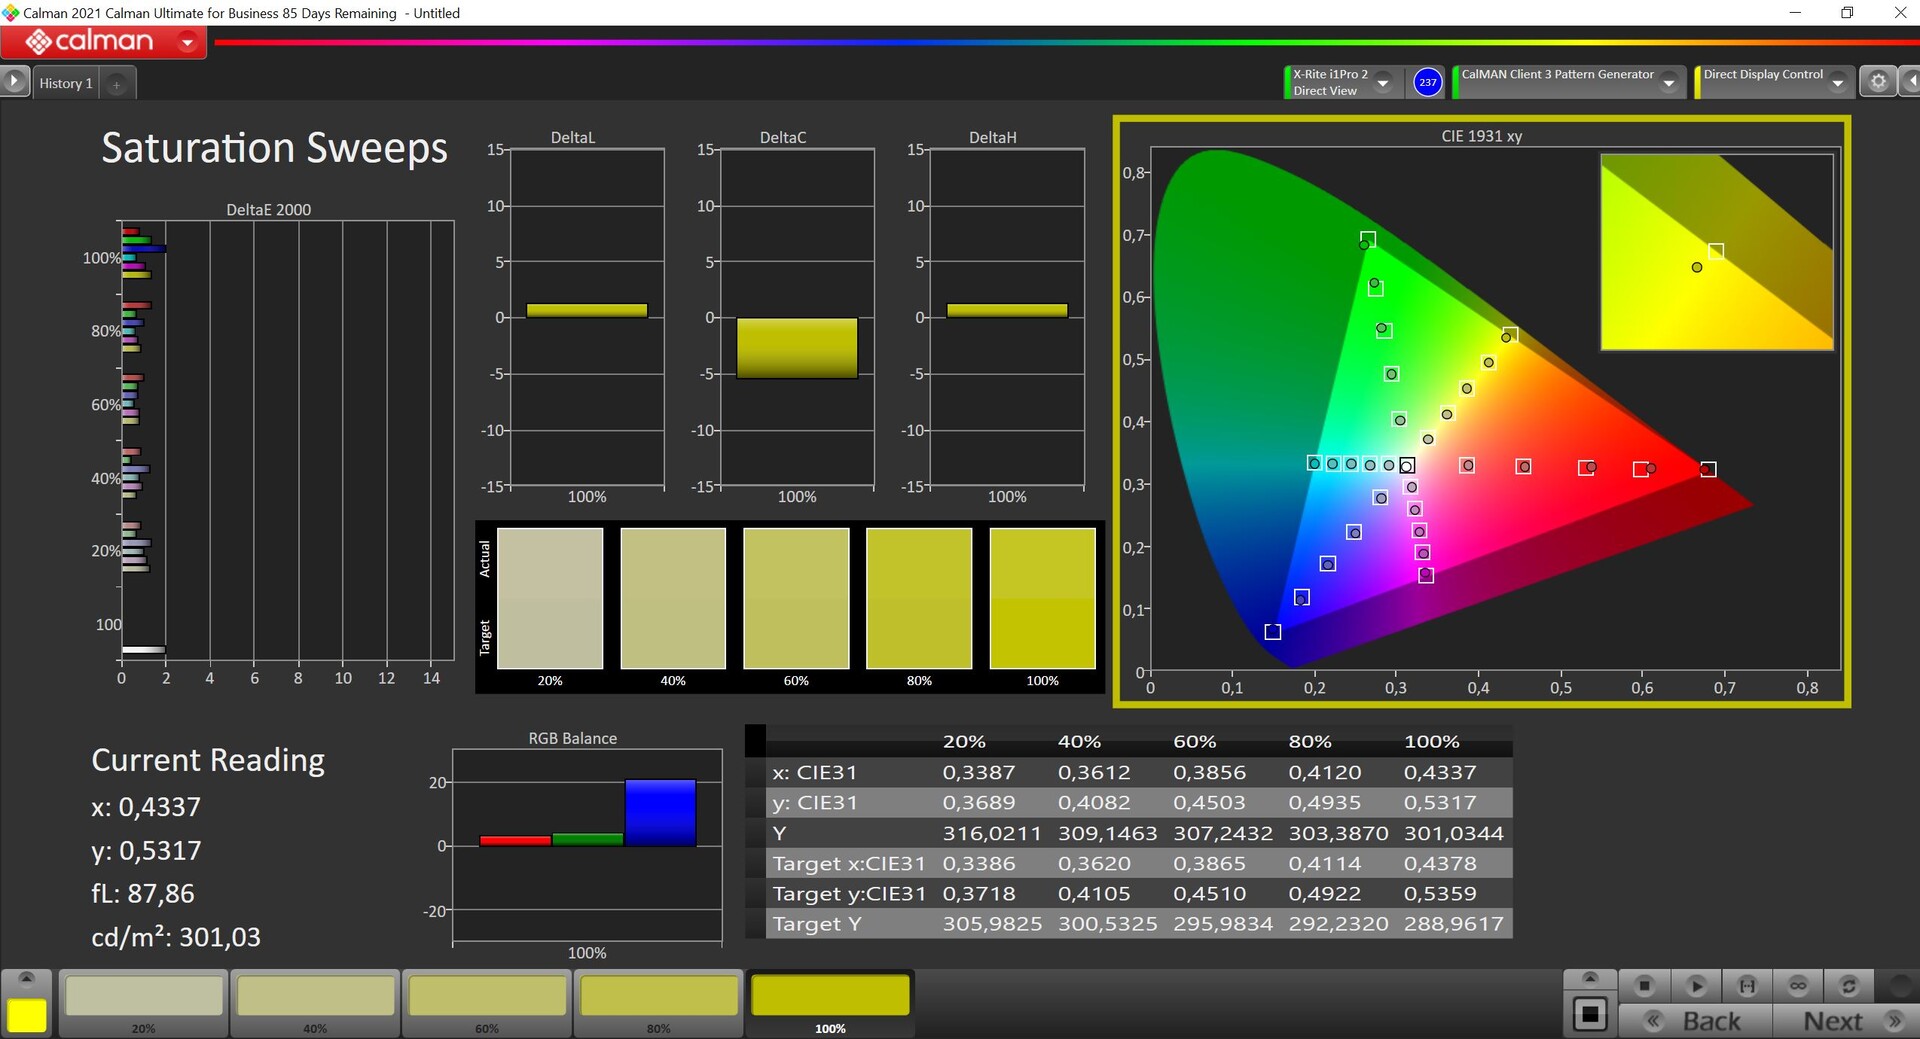
We measured the display with the professional CalMAN software and the X-Rite i1 Pro 2 spectrophotometer. Readers should note that Huawei provides three different profiles ex-factory: Native (P3), sRGB, and P3. We measured all three profiles before deciding on the P3 profile. Although the native profile also has P3 as the target color space, it shows higher deviations and subjectively produces somewhat richer colors. With the P3 profile, on the other hand, colors are extremely accurate right out of the box and, together with the almost complete P3 coverage, users are able carry out pictures/video editing, since all values are already below the important DeltaE-2000 deviation of 3. There is also no color cast in grayscale and the color temperature is very close to the ideal value of 6,500K.


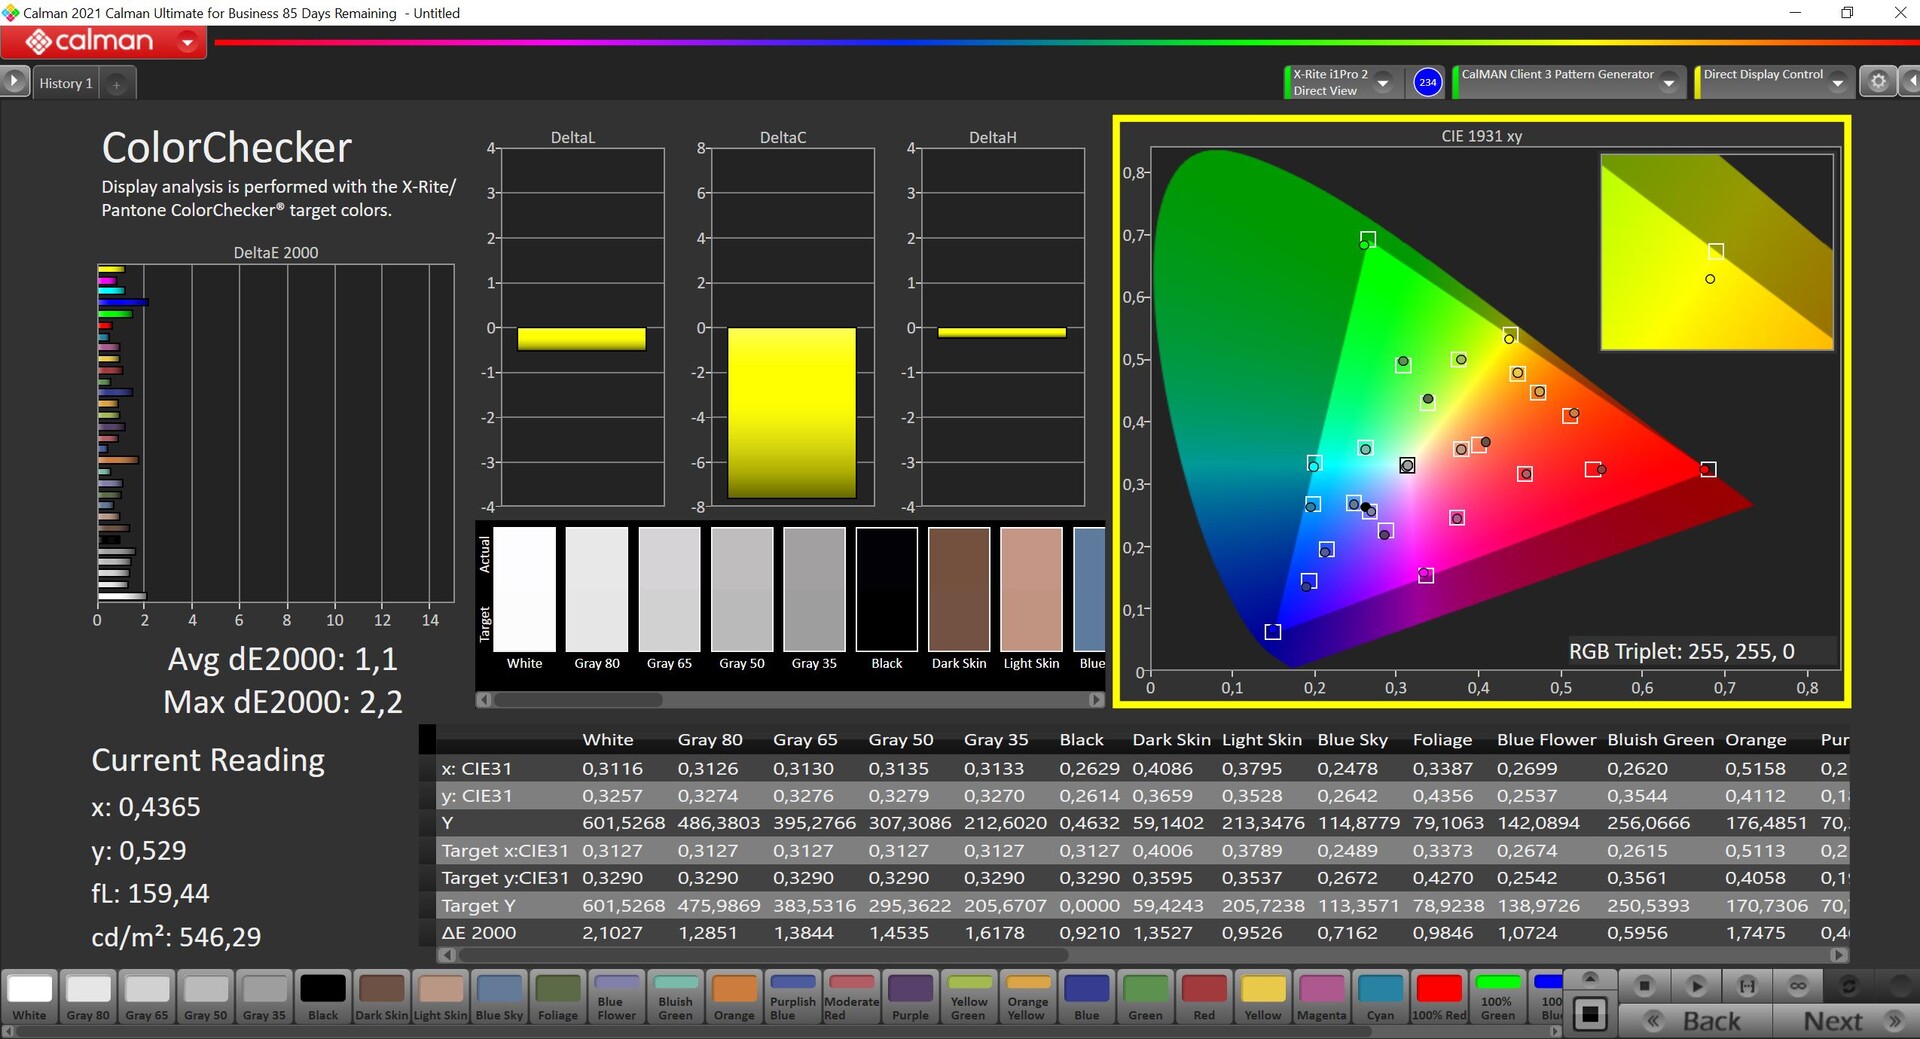
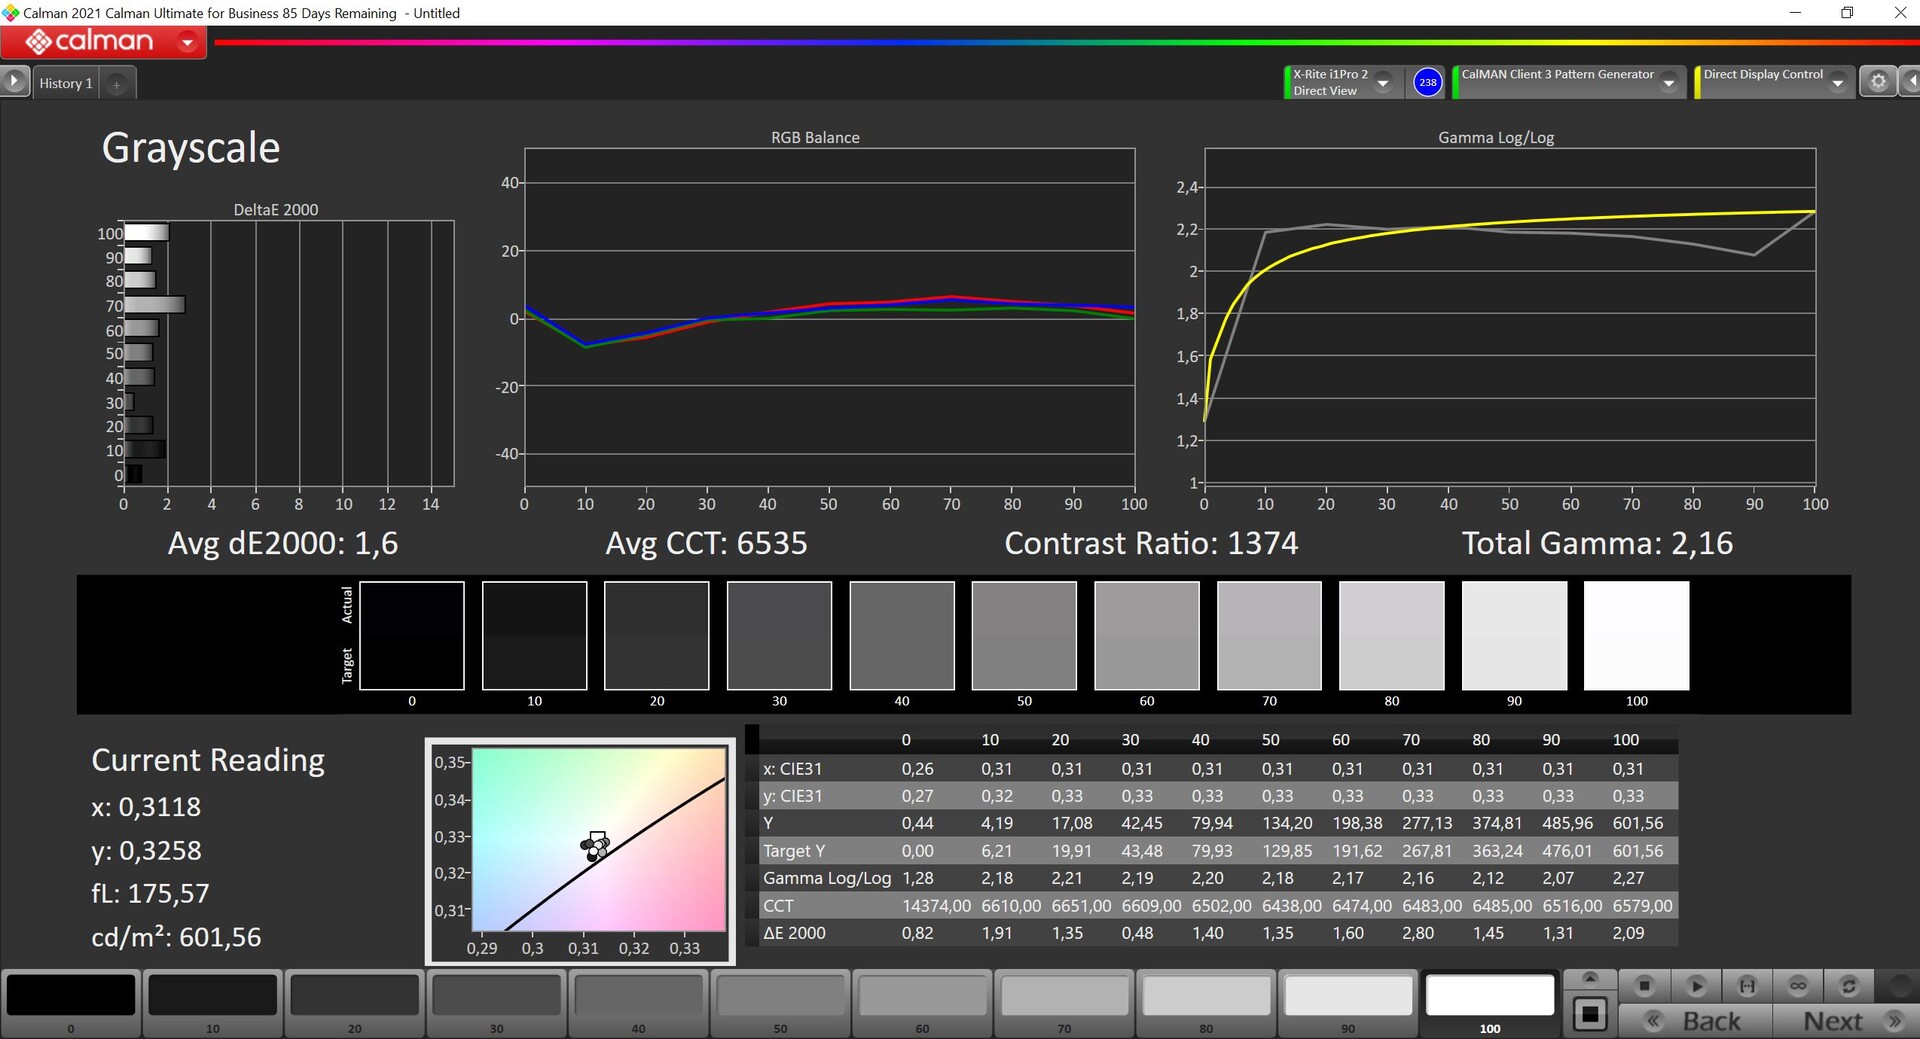

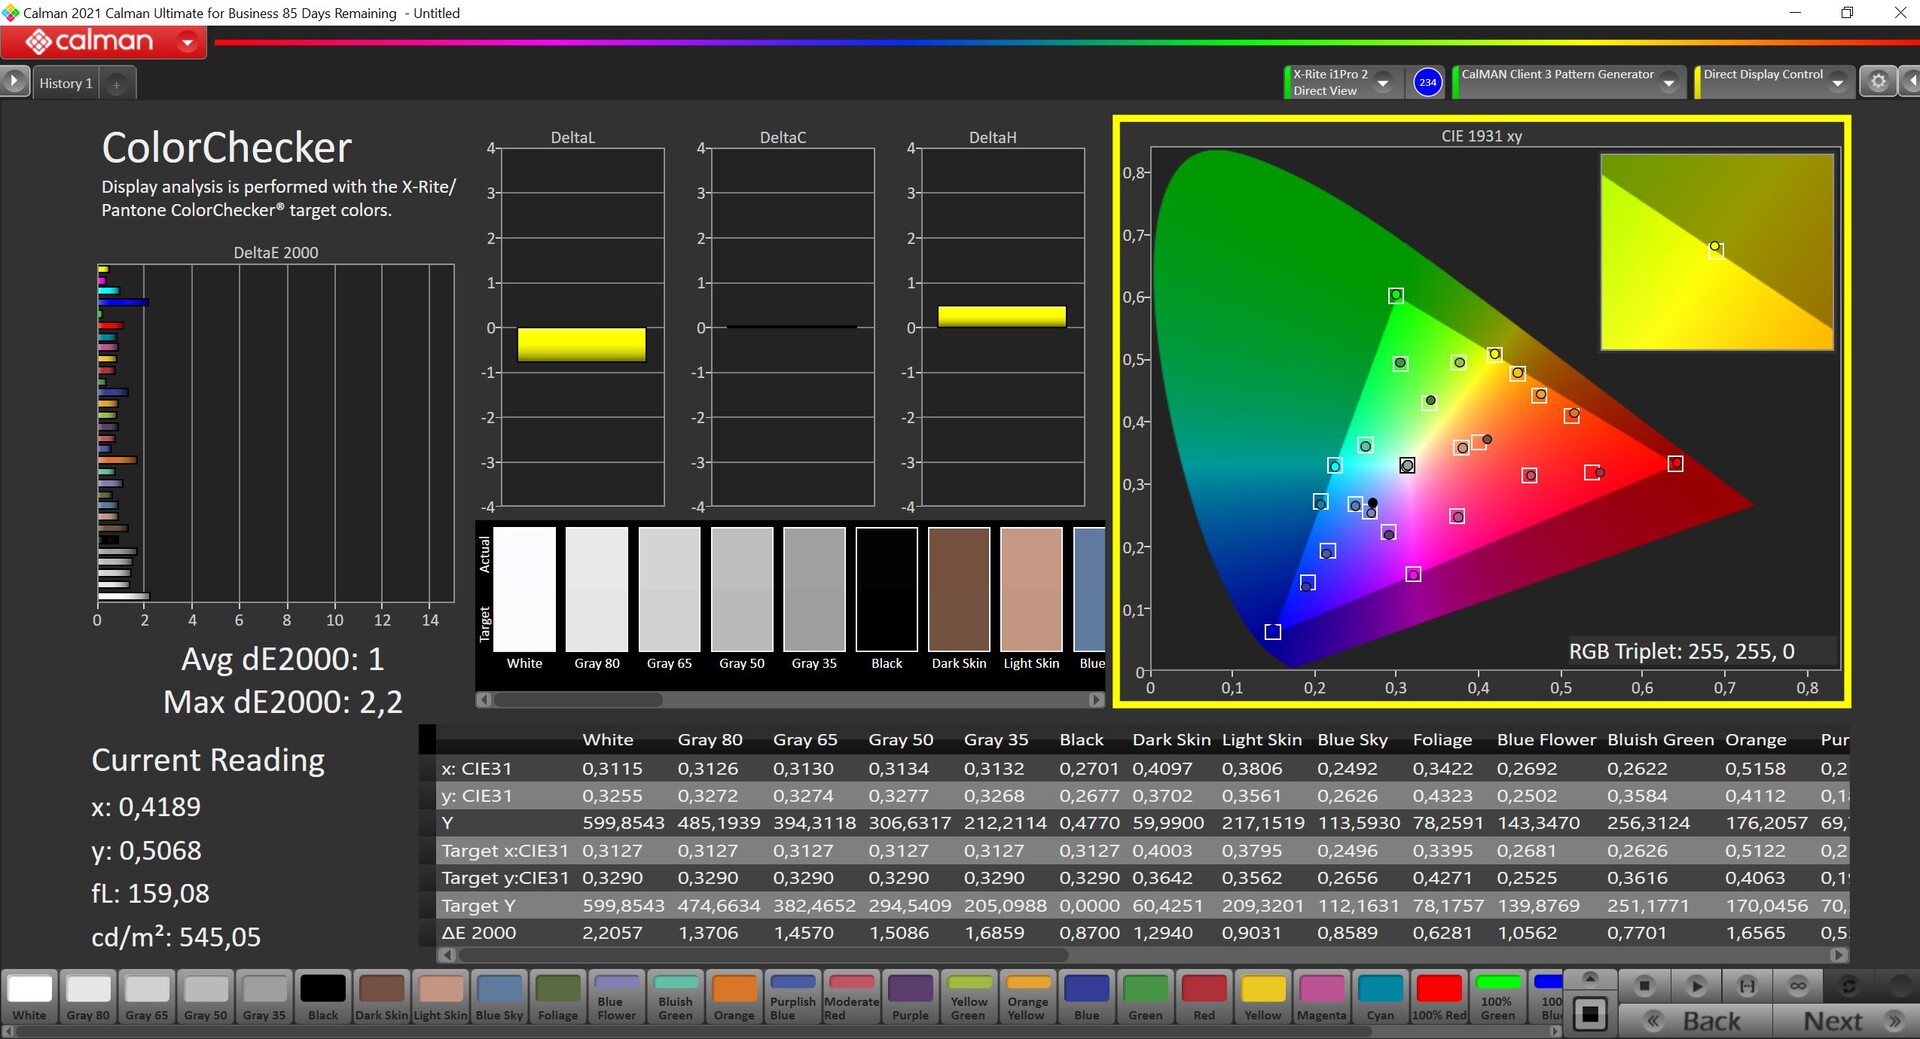
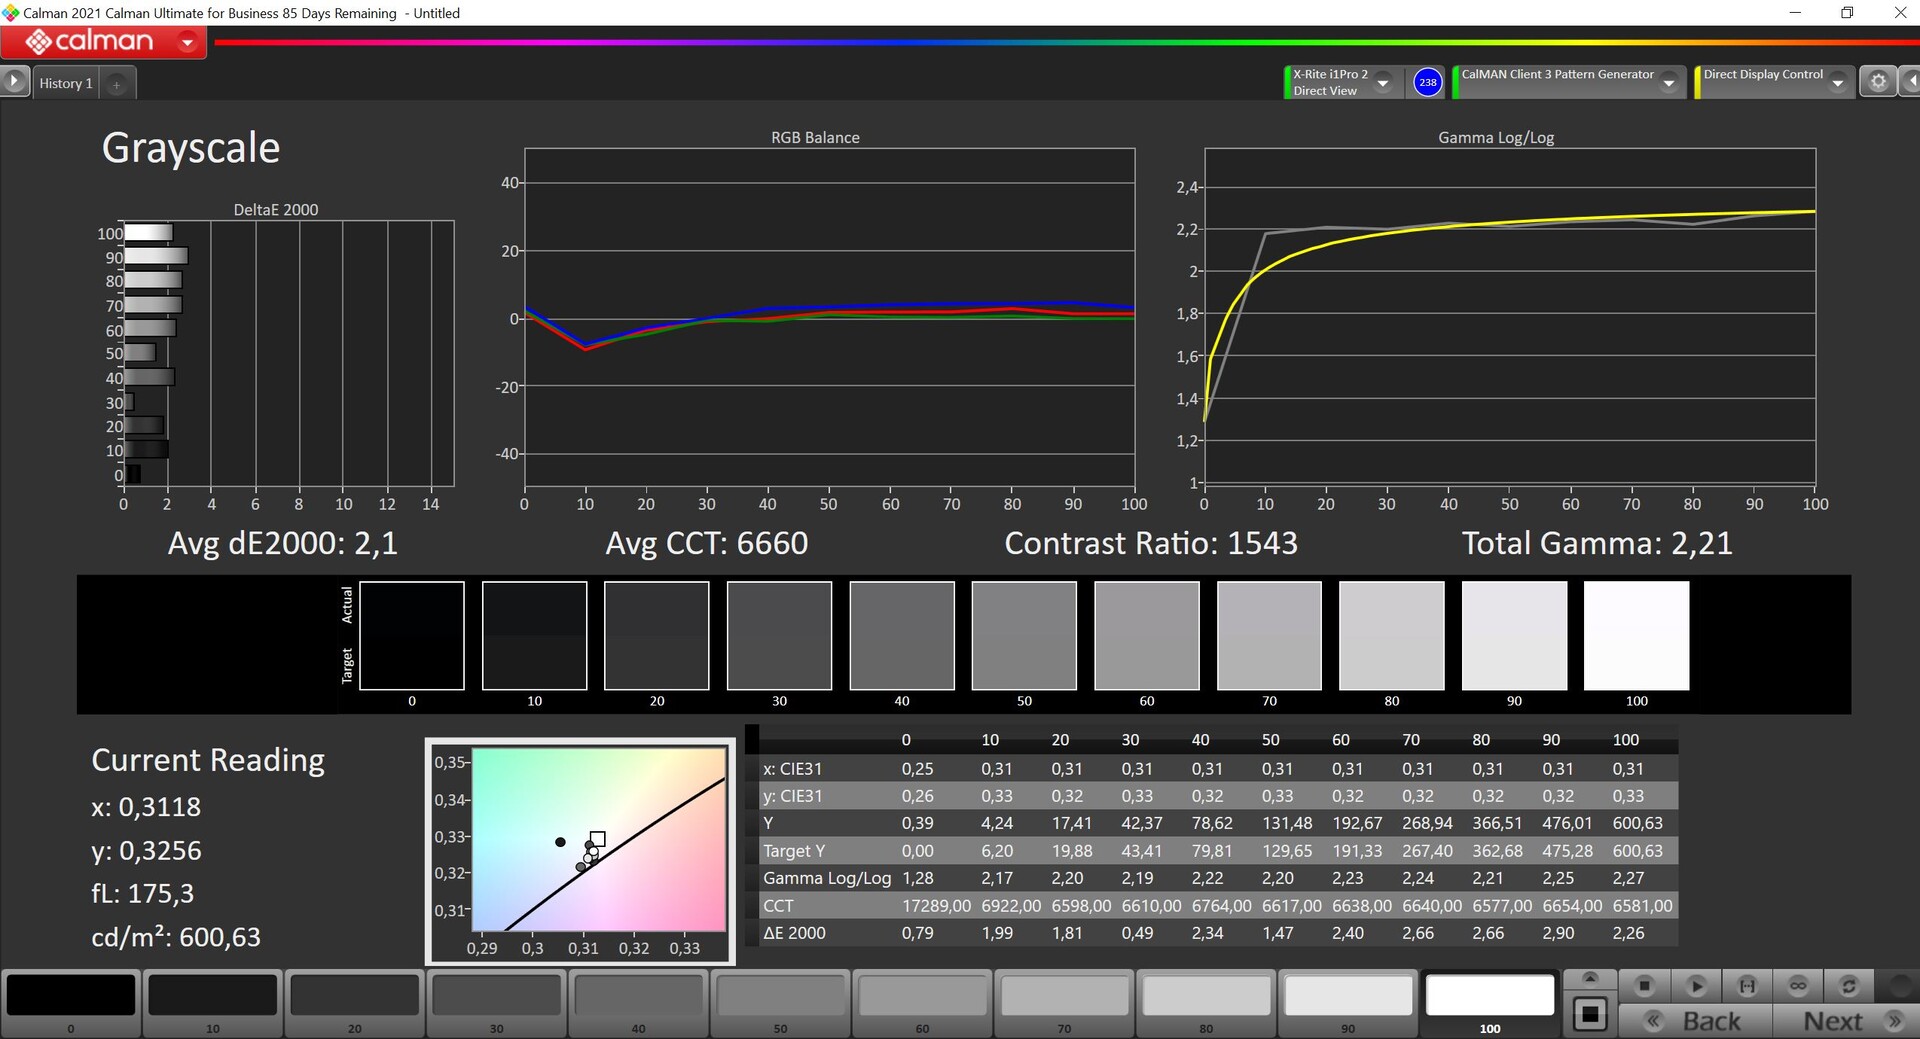


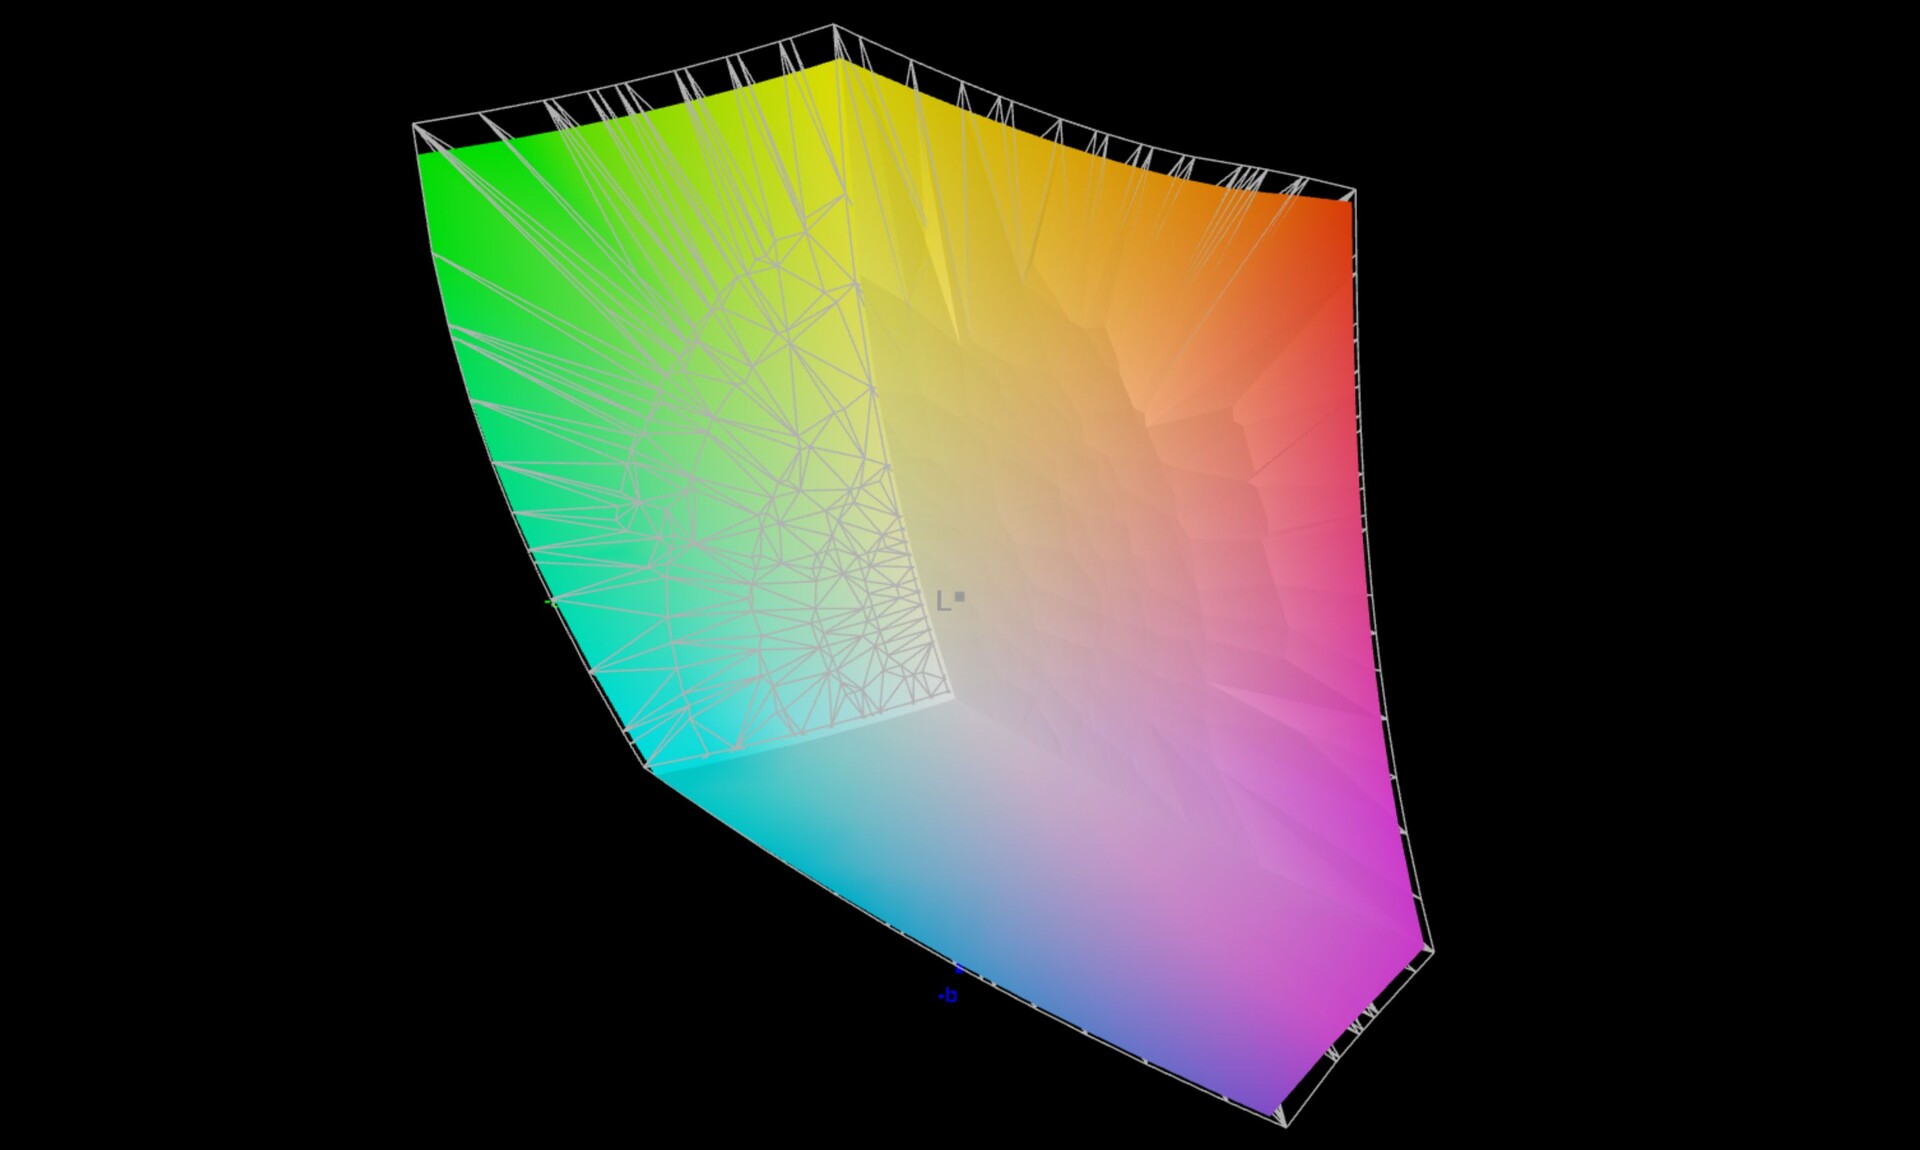

sRGB mode is also very accurate and really limits the color space to the sRGB spectrum. This is a clear advantage over almost all other consumer notebooks on the market. Since our own calibration efforts only resulted in a degradation of display values, we do not provide a corresponding profile here.
Display Response Times
| ↔ Response Time Black to White | ||
|---|---|---|
| 17.1 ms ... rise ↗ and fall ↘ combined | ↗ 8.6 ms rise | 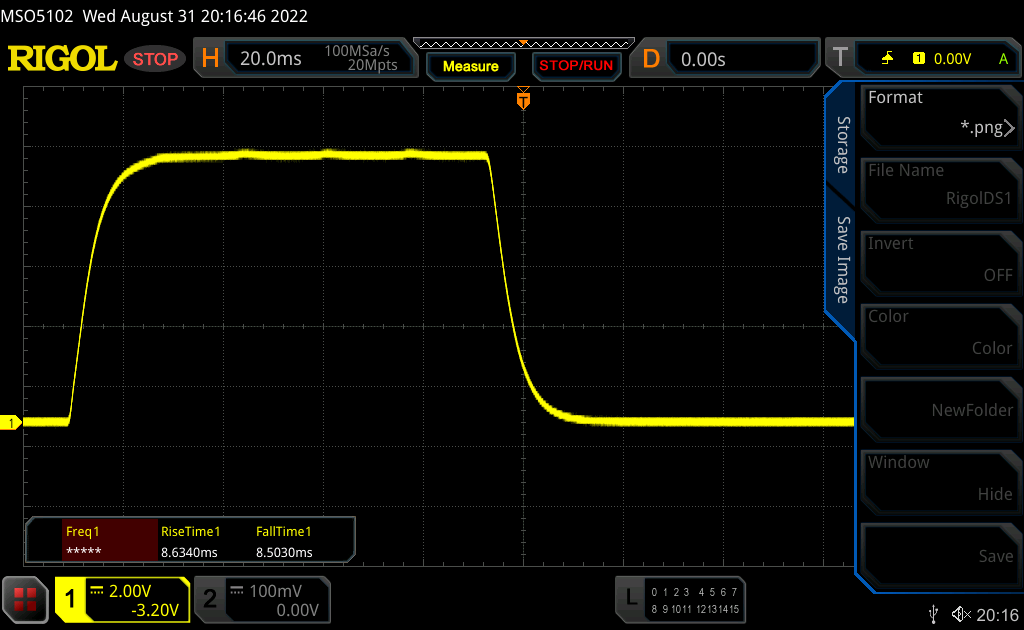 |
| ↘ 8.51 ms fall | ||
| The screen shows good response rates in our tests, but may be too slow for competitive gamers. In comparison, all tested devices range from 0.1 (minimum) to 240 (maximum) ms. » 34 % of all devices are better. This means that the measured response time is better than the average of all tested devices (21.5 ms). | ||
| ↔ Response Time 50% Grey to 80% Grey | ||
| 25.4 ms ... rise ↗ and fall ↘ combined | ↗ 11.7 ms rise | 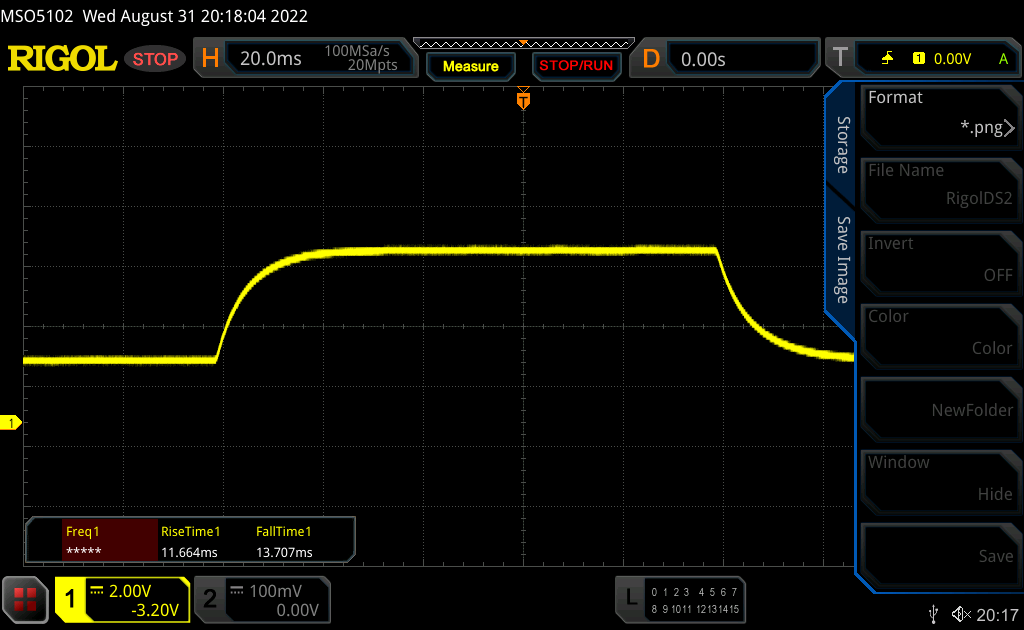 |
| ↘ 13.7 ms fall | ||
| The screen shows relatively slow response rates in our tests and may be too slow for gamers. In comparison, all tested devices range from 0.2 (minimum) to 636 (maximum) ms. » 30 % of all devices are better. This means that the measured response time is better than the average of all tested devices (33.7 ms). | ||
Screen Flickering / PWM (Pulse-Width Modulation)
| Screen flickering / PWM not detected |  | ||
In comparison: 53 % of all tested devices do not use PWM to dim the display. If PWM was detected, an average of 17900 (minimum: 5 - maximum: 3846000) Hz was measured. | |||
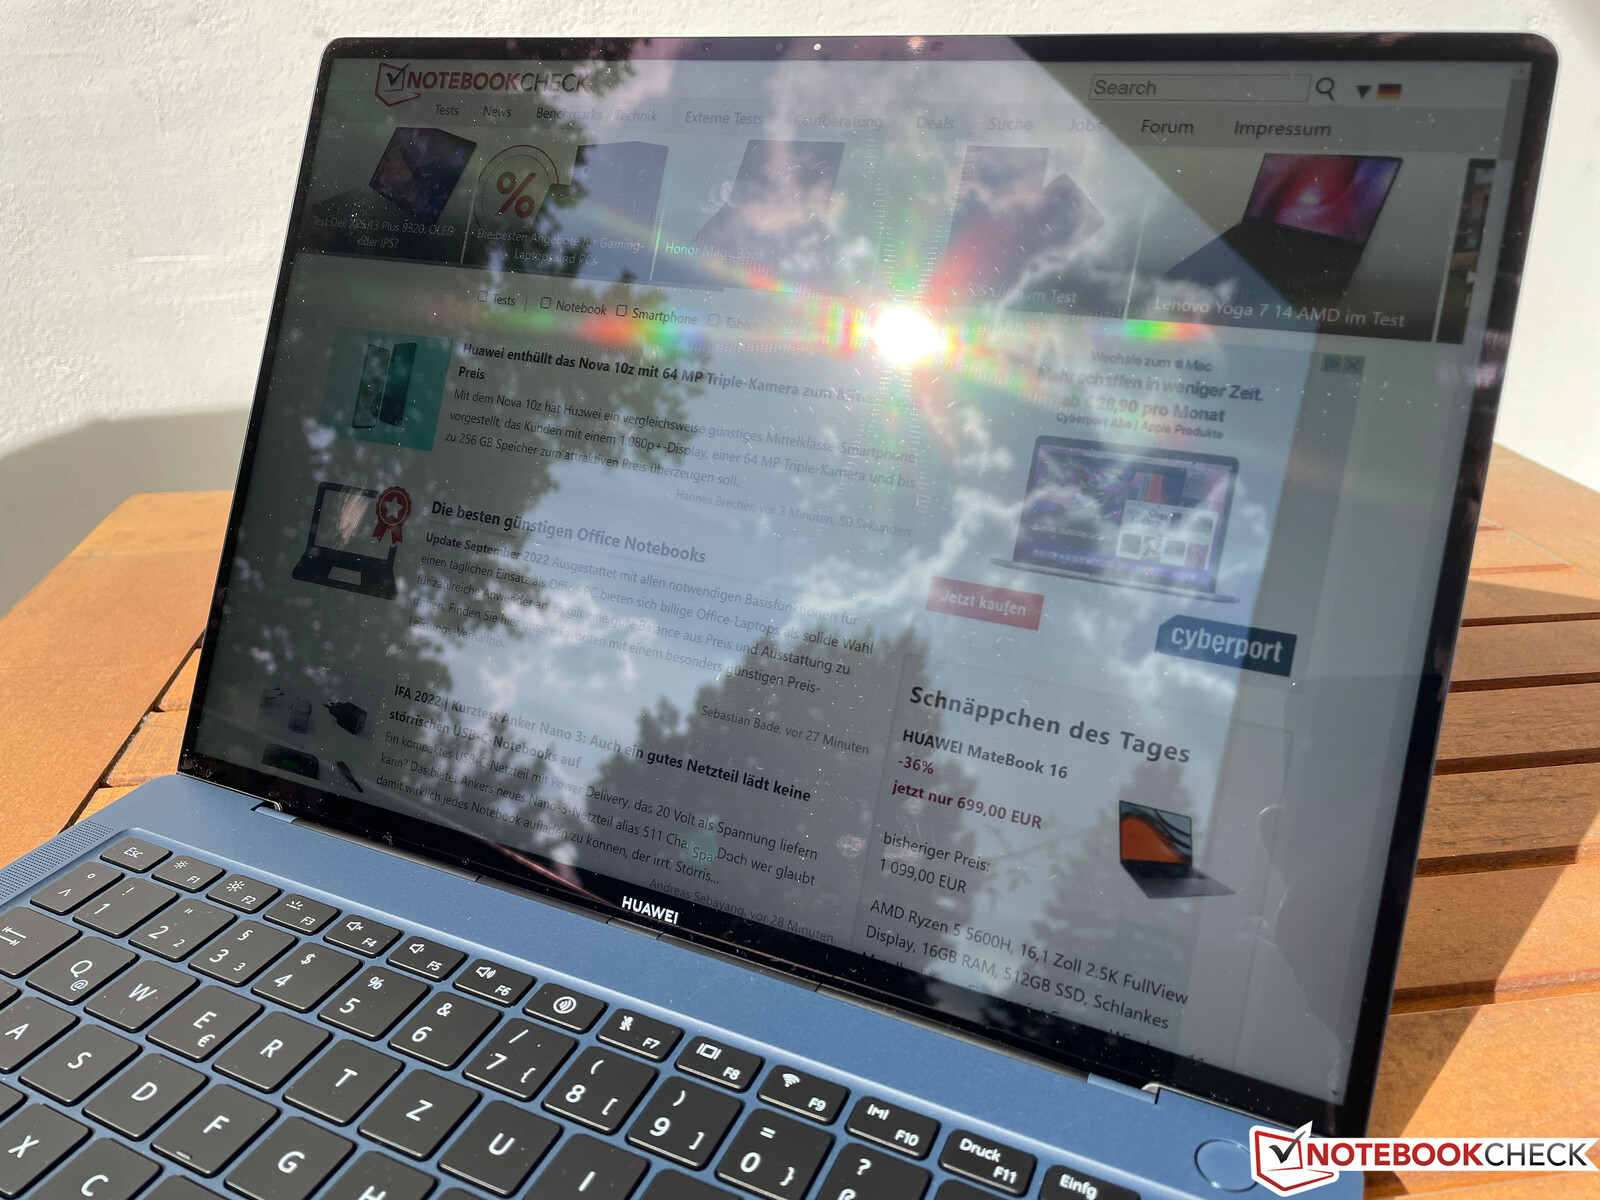
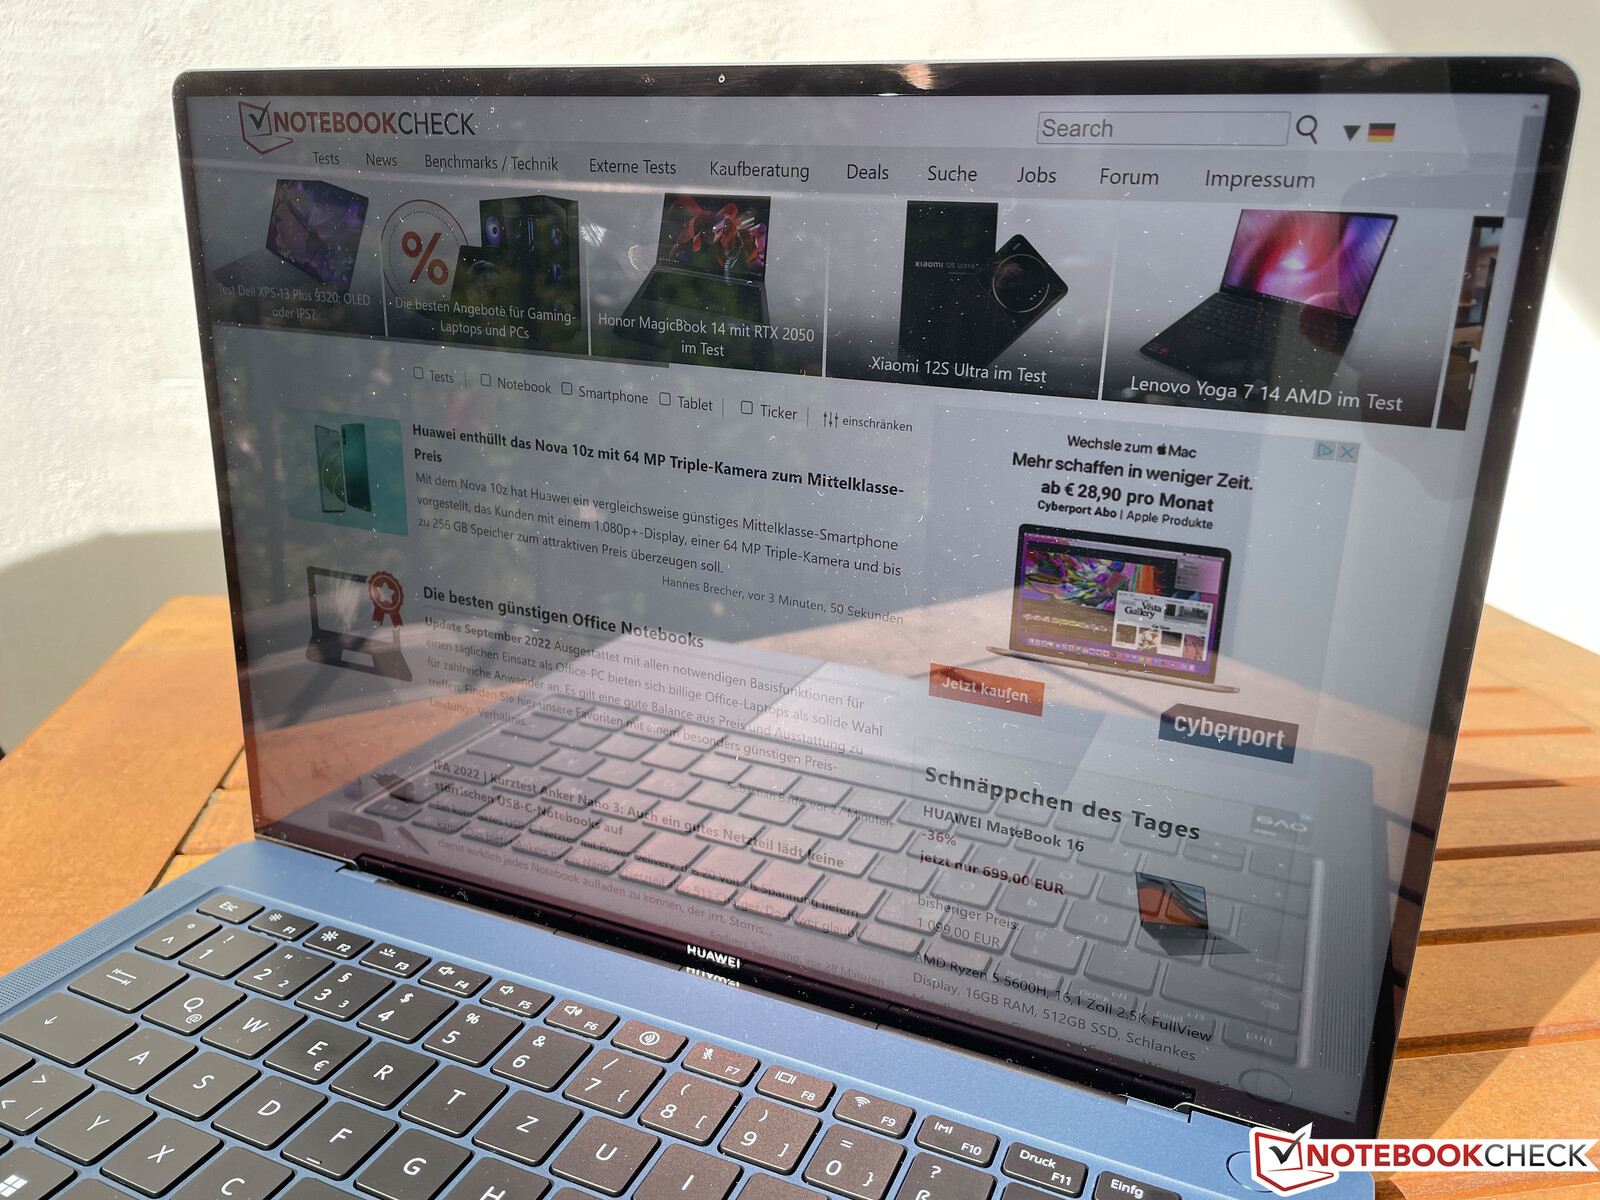
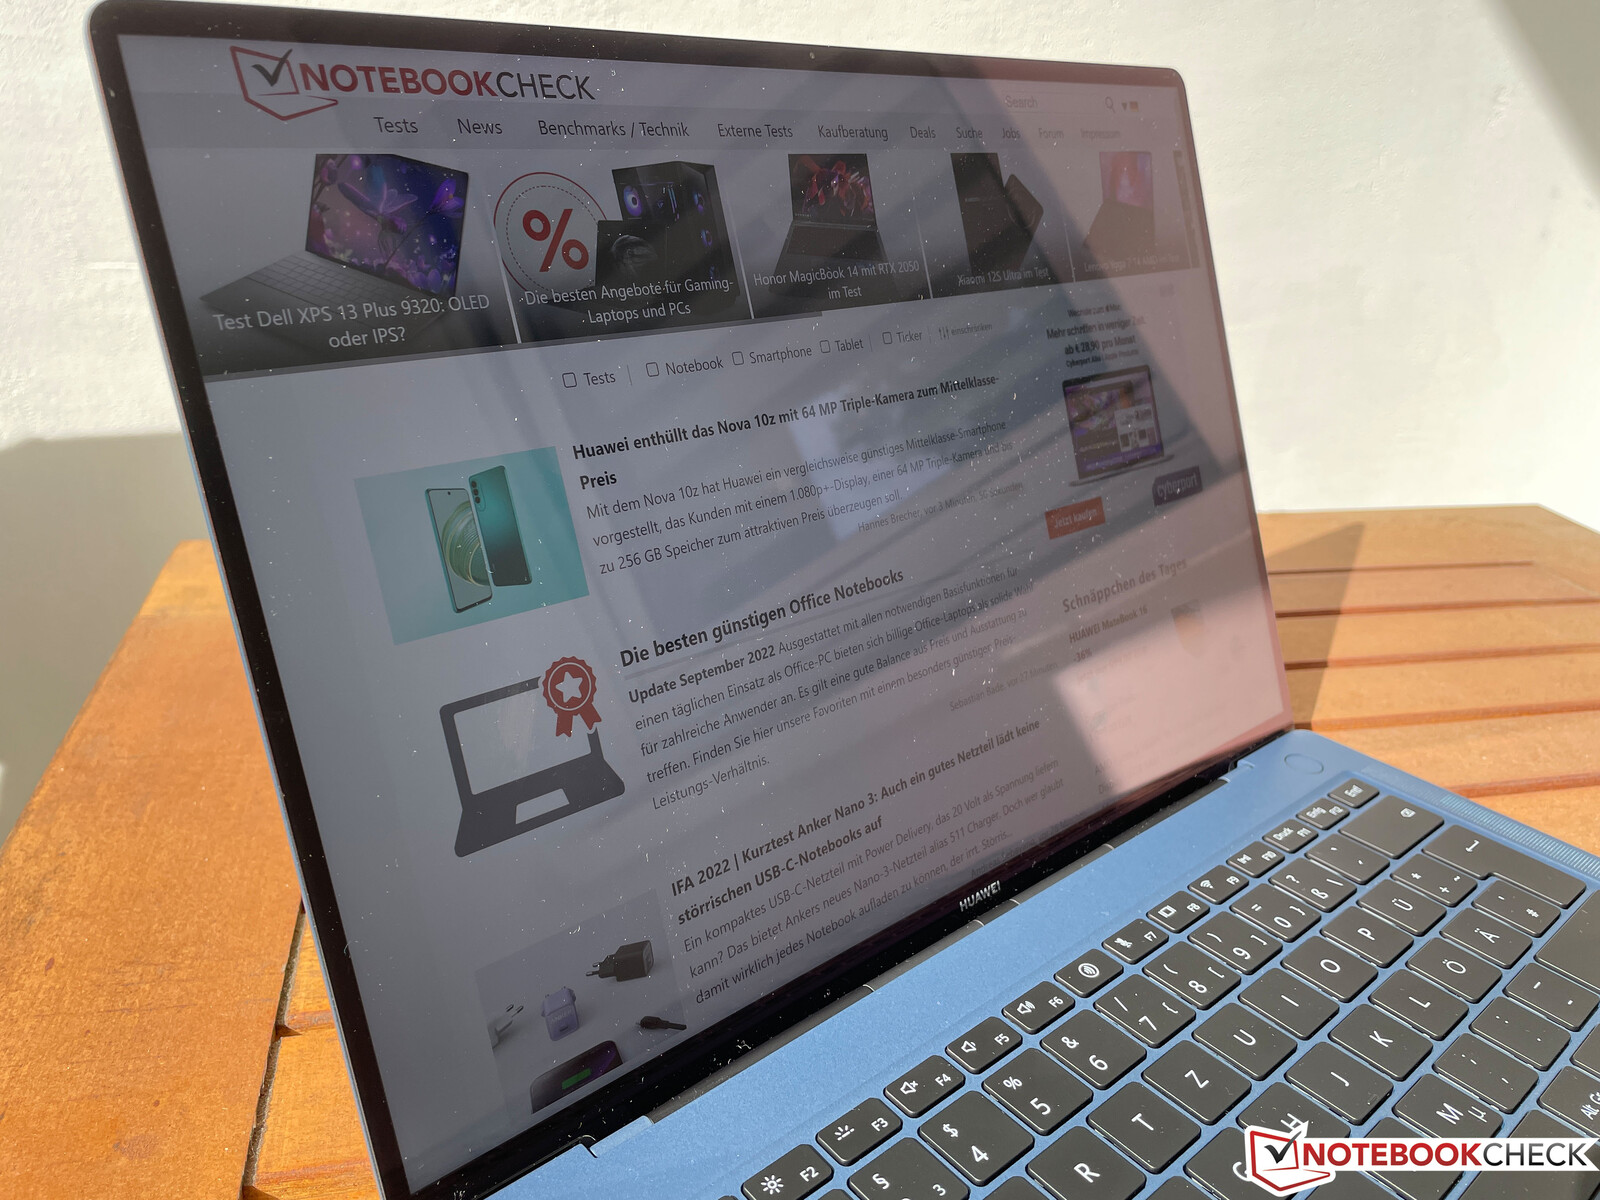
The glossy touchscreen naturally struggles with reflections outdoors, but the panel is not quite as reflective as, for example, the recently reviewed Honor MagicBook 14. In addition, the high screen brightness also helps to compensate for possible reflections. Even on bright days, you should still be able to find positions where you can view content reasonably. Cloudy days, on the other hand, do not cause any problems.

Performance - Alder Lake-P, but without PCIe 4.0
Testing Conditions
As usual, the pre-installed PC Manager offers two performance modes, with Balanced mode activated by default. Performance mode is available as the optional alternative, but only in mains operation. We have listed the TDP values of the processor in the table below. Benchmarks and measurements were performed in Performance mode, but you can certainly use Balanced mode for peace of mind and to benefit from the much quieter fans, especially in everyday use.
| Modes | CPU load | Maximum fan noise |
|---|---|---|
| Balanced | 64 watt -> 25 watt | 33,4 dB(A) |
| Performance | 64 watt -> 30 watt | 40,6 -> 38,2 dB(A) |
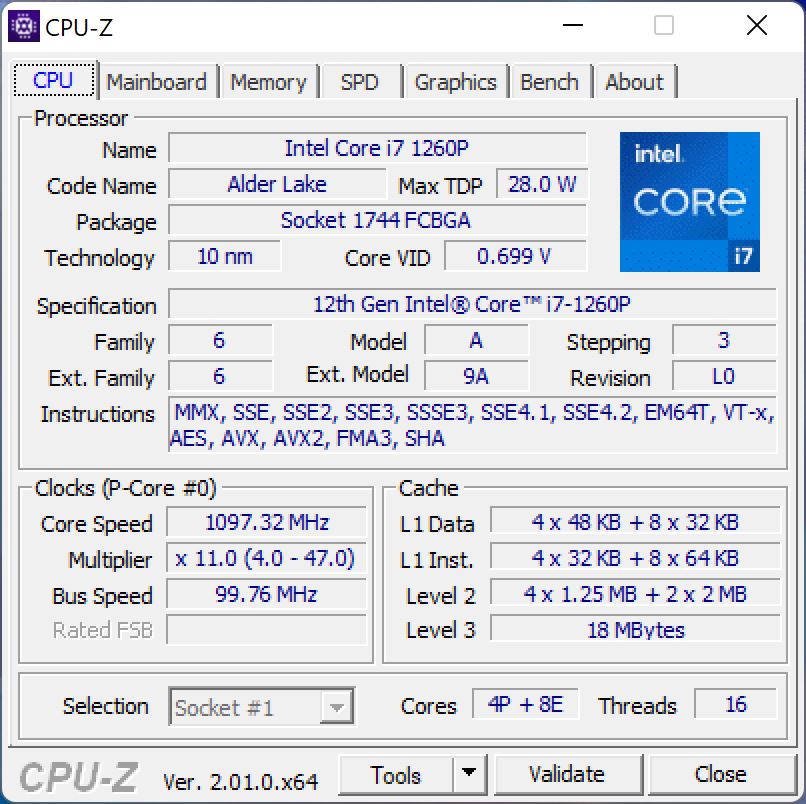
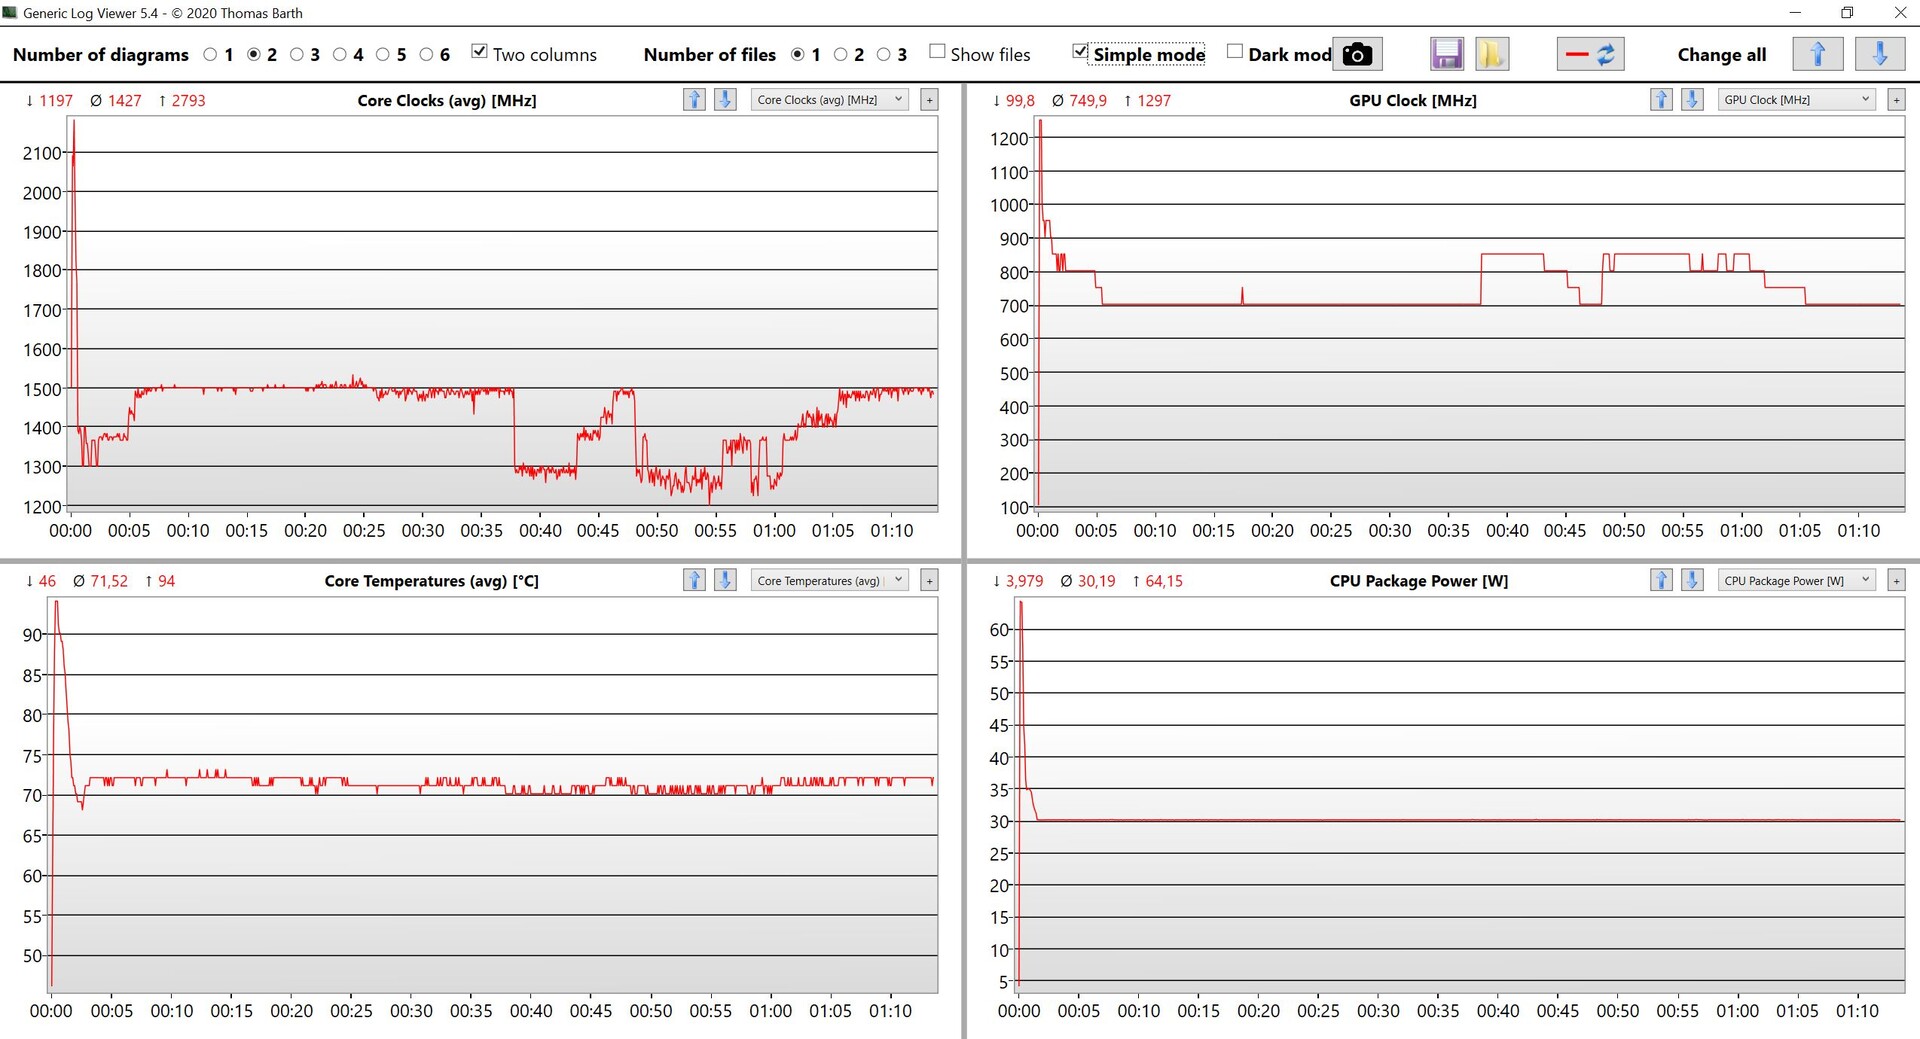
Processor - Core i7-1260P
The Core i7-1260P is the second fastest processor in Intel's Alder Lake P range after the Core i7-1280P and offers a hybrid architecture consisting of 4 fast performance cores and 8 efficiency cores. As previously described, the maximum short-term consumption is 64 watts, which is also the maximum limit of Intel's Alder-Lake-P chips. However, this is still not enough for the maximum clock on all cores.
After a few seconds, the consumption levels off at 30 or 25 watts, depending on the selected power mode, and then remains stable at this level. The MateBook X Pro is therefore not one of the fastest devices under constant load, but it naturally benefits from the high power limits and the high single-core performance of the new performance cores in everyday use and also in the short benchmarks. The predecessor, with its Tiger Lake Core i7-1165G7, quickly throttles to 18 watts and offers significantly less multi-core performance.
In battery mode, the processor is able to consume a maximum of 40 watts before stabilizing at 25 watts, which corresponds to the level of Balanced mode in mains operation. Further CPU benchmarks are available in our tech section.
Cinebench R15 Multi Sustained Load
Cinebench R23: Multi Core | Single Core
Cinebench R20: CPU (Multi Core) | CPU (Single Core)
Cinebench R15: CPU Multi 64Bit | CPU Single 64Bit
Blender: v2.79 BMW27 CPU
7-Zip 18.03: 7z b 4 | 7z b 4 -mmt1
Geekbench 5.5: Multi-Core | Single-Core
HWBOT x265 Benchmark v2.2: 4k Preset
LibreOffice : 20 Documents To PDF
R Benchmark 2.5: Overall mean
| CPU Performance Rating | |
| Lenovo Yoga 9i 14 2022 i7-1260P | |
| Huawei MateBook X Pro 2022 | |
| Dell XPS 13 Plus 9320 4K | |
| Average of class Subnotebook | |
| Asus Zenbook S 13 OLED | |
| Average Intel Core i7-1260P | |
| Apple MacBook Air M2 10C GPU -5! | |
| Huawei MateBook X Pro 2021 | |
| Cinebench R23 / Multi Core | |
| Lenovo Yoga 9i 14 2022 i7-1260P | |
| Asus Zenbook S 13 OLED | |
| Average of class Subnotebook (2485 - 16201, n=68, last 2 years) | |
| Dell XPS 13 Plus 9320 4K | |
| Average Intel Core i7-1260P (3173 - 12150, n=27) | |
| Huawei MateBook X Pro 2022 | |
| Apple MacBook Air M2 10C GPU | |
| Huawei MateBook X Pro 2021 | |
| Cinebench R23 / Single Core | |
| Lenovo Yoga 9i 14 2022 i7-1260P | |
| Dell XPS 13 Plus 9320 4K | |
| Average Intel Core i7-1260P (1155 - 1812, n=25) | |
| Huawei MateBook X Pro 2022 | |
| Average of class Subnotebook (598 - 1934, n=68, last 2 years) | |
| Apple MacBook Air M2 10C GPU | |
| Asus Zenbook S 13 OLED | |
| Huawei MateBook X Pro 2021 | |
| Cinebench R20 / CPU (Multi Core) | |
| Asus Zenbook S 13 OLED | |
| Lenovo Yoga 9i 14 2022 i7-1260P | |
| Average of class Subnotebook (810 - 6314, n=64, last 2 years) | |
| Dell XPS 13 Plus 9320 4K | |
| Huawei MateBook X Pro 2022 | |
| Average Intel Core i7-1260P (1234 - 4748, n=25) | |
| Apple MacBook Air M2 10C GPU | |
| Huawei MateBook X Pro 2021 | |
| Cinebench R20 / CPU (Single Core) | |
| Huawei MateBook X Pro 2022 | |
| Lenovo Yoga 9i 14 2022 i7-1260P | |
| Dell XPS 13 Plus 9320 4K | |
| Average Intel Core i7-1260P (448 - 698, n=25) | |
| Average of class Subnotebook (216 - 738, n=64, last 2 years) | |
| Asus Zenbook S 13 OLED | |
| Huawei MateBook X Pro 2021 | |
| Apple MacBook Air M2 10C GPU | |
| Cinebench R15 / CPU Multi 64Bit | |
| Huawei MateBook X Pro 2022 | |
| Huawei MateBook X Pro 2022 | |
| Lenovo Yoga 9i 14 2022 i7-1260P | |
| Average of class Subnotebook (514 - 2581, n=70, last 2 years) | |
| Asus Zenbook S 13 OLED | |
| Dell XPS 13 Plus 9320 4K | |
| Dell XPS 13 Plus 9320 4K | |
| Average Intel Core i7-1260P (549 - 2034, n=29) | |
| Apple MacBook Air M2 10C GPU | |
| Huawei MateBook X Pro 2021 | |
| Cinebench R15 / CPU Single 64Bit | |
| Huawei MateBook X Pro 2022 | |
| Lenovo Yoga 9i 14 2022 i7-1260P | |
| Dell XPS 13 Plus 9320 4K | |
| Asus Zenbook S 13 OLED | |
| Average of class Subnotebook (91.8 - 280, n=62, last 2 years) | |
| Average Intel Core i7-1260P (165.4 - 260, n=27) | |
| Apple MacBook Air M2 10C GPU | |
| Huawei MateBook X Pro 2021 | |
| Blender / v2.79 BMW27 CPU | |
| Huawei MateBook X Pro 2021 | |
| Apple MacBook Air M2 10C GPU | |
| Average of class Subnotebook (201 - 1600, n=66, last 2 years) | |
| Average Intel Core i7-1260P (264 - 906, n=26) | |
| Huawei MateBook X Pro 2022 | |
| Dell XPS 13 Plus 9320 4K | |
| Asus Zenbook S 13 OLED | |
| Lenovo Yoga 9i 14 2022 i7-1260P | |
| 7-Zip 18.03 / 7z b 4 | |
| Asus Zenbook S 13 OLED | |
| Lenovo Yoga 9i 14 2022 i7-1260P | |
| Average of class Subnotebook (16223 - 67444, n=57, last 2 years) | |
| Dell XPS 13 Plus 9320 4K | |
| Huawei MateBook X Pro 2022 | |
| Average Intel Core i7-1260P (16146 - 47064, n=25) | |
| Huawei MateBook X Pro 2021 | |
| 7-Zip 18.03 / 7z b 4 -mmt1 | |
| Asus Zenbook S 13 OLED | |
| Huawei MateBook X Pro 2022 | |
| Average of class Subnotebook (2197 - 6403, n=58, last 2 years) | |
| Dell XPS 13 Plus 9320 4K | |
| Average Intel Core i7-1260P (4064 - 5791, n=25) | |
| Lenovo Yoga 9i 14 2022 i7-1260P | |
| Huawei MateBook X Pro 2021 | |
| Geekbench 5.5 / Multi-Core | |
| Lenovo Yoga 9i 14 2022 i7-1260P | |
| Huawei MateBook X Pro 2022 | |
| Dell XPS 13 Plus 9320 4K | |
| Average of class Subnotebook (4274 - 12580, n=65, last 2 years) | |
| Apple MacBook Air M2 10C GPU | |
| Average Intel Core i7-1260P (3866 - 10570, n=25) | |
| Asus Zenbook S 13 OLED | |
| Huawei MateBook X Pro 2021 | |
| Geekbench 5.5 / Single-Core | |
| Apple MacBook Air M2 10C GPU | |
| Lenovo Yoga 9i 14 2022 i7-1260P | |
| Huawei MateBook X Pro 2022 | |
| Dell XPS 13 Plus 9320 4K | |
| Average of class Subnotebook (672 - 2350, n=65, last 2 years) | |
| Average Intel Core i7-1260P (1436 - 1786, n=25) | |
| Asus Zenbook S 13 OLED | |
| Huawei MateBook X Pro 2021 | |
| HWBOT x265 Benchmark v2.2 / 4k Preset | |
| Asus Zenbook S 13 OLED | |
| Lenovo Yoga 9i 14 2022 i7-1260P | |
| Average of class Subnotebook (1.5 - 19.4, n=56, last 2 years) | |
| Dell XPS 13 Plus 9320 4K | |
| Huawei MateBook X Pro 2022 | |
| Average Intel Core i7-1260P (3.45 - 13.6, n=26) | |
| Huawei MateBook X Pro 2021 | |
| LibreOffice / 20 Documents To PDF | |
| Asus Zenbook S 13 OLED | |
| Average of class Subnotebook (40.1 - 120.5, n=57, last 2 years) | |
| Average Intel Core i7-1260P (40.2 - 65.7, n=25) | |
| Lenovo Yoga 9i 14 2022 i7-1260P | |
| Huawei MateBook X Pro 2021 | |
| Dell XPS 13 Plus 9320 4K | |
| Huawei MateBook X Pro 2022 | |
| R Benchmark 2.5 / Overall mean | |
| Huawei MateBook X Pro 2021 | |
| Asus Zenbook S 13 OLED | |
| Average of class Subnotebook (0.4397 - 1.236, n=57, last 2 years) | |
| Average Intel Core i7-1260P (0.4559 - 0.727, n=25) | |
| Lenovo Yoga 9i 14 2022 i7-1260P | |
| Dell XPS 13 Plus 9320 4K | |
| Huawei MateBook X Pro 2022 | |
* ... smaller is better
AIDA64: FP32 Ray-Trace | FPU Julia | CPU SHA3 | CPU Queen | FPU SinJulia | FPU Mandel | CPU AES | CPU ZLib | FP64 Ray-Trace | CPU PhotoWorxx
| Performance Rating | |
| Asus Zenbook S 13 OLED | |
| Average of class Subnotebook | |
| Average Intel Core i7-1260P | |
| Huawei MateBook X Pro 2022 | |
| Dell XPS 13 Plus 9320 4K | |
| Huawei MateBook X Pro 2021 | |
| Lenovo Yoga 9i 14 2022 i7-1260P | |
| AIDA64 / FP32 Ray-Trace | |
| Asus Zenbook S 13 OLED | |
| Average of class Subnotebook (343 - 25961, n=57, last 2 years) | |
| Average Intel Core i7-1260P (2176 - 10898, n=26) | |
| Dell XPS 13 Plus 9320 4K | |
| Lenovo Yoga 9i 14 2022 i7-1260P | |
| Huawei MateBook X Pro 2021 | |
| Huawei MateBook X Pro 2022 | |
| AIDA64 / FPU Julia | |
| Asus Zenbook S 13 OLED | |
| Average of class Subnotebook (11867 - 111109, n=57, last 2 years) | |
| Average Intel Core i7-1260P (11015 - 56906, n=26) | |
| Dell XPS 13 Plus 9320 4K | |
| Huawei MateBook X Pro 2022 | |
| Lenovo Yoga 9i 14 2022 i7-1260P | |
| Huawei MateBook X Pro 2021 | |
| AIDA64 / CPU SHA3 | |
| Asus Zenbook S 13 OLED | |
| Average of class Subnotebook (453 - 4646, n=57, last 2 years) | |
| Lenovo Yoga 9i 14 2022 i7-1260P | |
| Average Intel Core i7-1260P (669 - 2709, n=26) | |
| Dell XPS 13 Plus 9320 4K | |
| Huawei MateBook X Pro 2022 | |
| Huawei MateBook X Pro 2021 | |
| AIDA64 / CPU Queen | |
| Asus Zenbook S 13 OLED | |
| Average of class Subnotebook (15447 - 115300, n=57, last 2 years) | |
| Huawei MateBook X Pro 2022 | |
| Dell XPS 13 Plus 9320 4K | |
| Average Intel Core i7-1260P (42571 - 82493, n=26) | |
| Huawei MateBook X Pro 2021 | |
| Lenovo Yoga 9i 14 2022 i7-1260P | |
| AIDA64 / FPU SinJulia | |
| Asus Zenbook S 13 OLED | |
| Average of class Subnotebook (1223 - 14944, n=57, last 2 years) | |
| Huawei MateBook X Pro 2022 | |
| Dell XPS 13 Plus 9320 4K | |
| Average Intel Core i7-1260P (2901 - 6975, n=26) | |
| Lenovo Yoga 9i 14 2022 i7-1260P | |
| Huawei MateBook X Pro 2021 | |
| AIDA64 / FPU Mandel | |
| Asus Zenbook S 13 OLED | |
| Average of class Subnotebook (6379 - 59053, n=57, last 2 years) | |
| Average Intel Core i7-1260P (5950 - 26376, n=26) | |
| Dell XPS 13 Plus 9320 4K | |
| Huawei MateBook X Pro 2022 | |
| Huawei MateBook X Pro 2021 | |
| Lenovo Yoga 9i 14 2022 i7-1260P | |
| AIDA64 / CPU AES | |
| Asus Zenbook S 13 OLED | |
| Huawei MateBook X Pro 2022 | |
| Average of class Subnotebook (638 - 161430, n=57, last 2 years) | |
| Huawei MateBook X Pro 2021 | |
| Average Intel Core i7-1260P (16041 - 92356, n=26) | |
| Dell XPS 13 Plus 9320 4K | |
| Lenovo Yoga 9i 14 2022 i7-1260P | |
| AIDA64 / CPU ZLib | |
| Average of class Subnotebook (270 - 1123, n=57, last 2 years) | |
| Lenovo Yoga 9i 14 2022 i7-1260P | |
| Dell XPS 13 Plus 9320 4K | |
| Huawei MateBook X Pro 2022 | |
| Asus Zenbook S 13 OLED | |
| Average Intel Core i7-1260P (259 - 771, n=26) | |
| Huawei MateBook X Pro 2021 | |
| AIDA64 / FP64 Ray-Trace | |
| Asus Zenbook S 13 OLED | |
| Average of class Subnotebook (204 - 14018, n=57, last 2 years) | |
| Average Intel Core i7-1260P (1237 - 5858, n=26) | |
| Dell XPS 13 Plus 9320 4K | |
| Lenovo Yoga 9i 14 2022 i7-1260P | |
| Huawei MateBook X Pro 2022 | |
| Huawei MateBook X Pro 2021 | |
| AIDA64 / CPU PhotoWorxx | |
| Huawei MateBook X Pro 2021 | |
| Dell XPS 13 Plus 9320 4K | |
| Huawei MateBook X Pro 2022 | |
| Average of class Subnotebook (7622 - 53954, n=57, last 2 years) | |
| Average Intel Core i7-1260P (13261 - 43652, n=26) | |
| Asus Zenbook S 13 OLED | |
| Lenovo Yoga 9i 14 2022 i7-1260P | |
System Performance
The subjective performance impression of the new MateBook X Pro is excellent and is confirmed by the good benchmark results. However, it should also be noted here that in practice, there are virtually no differences between the latest devices.
CrossMark: Overall | Productivity | Creativity | Responsiveness
| PCMark 10 / Score | |
| Asus Zenbook S 13 OLED | |
| Huawei MateBook X Pro 2022 | |
| Average of class Subnotebook (4384 - 7428, n=55, last 2 years) | |
| Lenovo Yoga 9i 14 2022 i7-1260P | |
| Dell XPS 13 Plus 9320 4K | |
| Average Intel Core i7-1260P, Intel Iris Xe Graphics G7 96EUs (4796 - 6068, n=17) | |
| Huawei MateBook X Pro 2021 | |
| PCMark 10 / Essentials | |
| Lenovo Yoga 9i 14 2022 i7-1260P | |
| Huawei MateBook X Pro 2022 | |
| Asus Zenbook S 13 OLED | |
| Dell XPS 13 Plus 9320 4K | |
| Average Intel Core i7-1260P, Intel Iris Xe Graphics G7 96EUs (9260 - 11251, n=17) | |
| Average of class Subnotebook (8890 - 11168, n=55, last 2 years) | |
| Huawei MateBook X Pro 2021 | |
| PCMark 10 / Productivity | |
| Asus Zenbook S 13 OLED | |
| Huawei MateBook X Pro 2022 | |
| Average of class Subnotebook (6213 - 10279, n=55, last 2 years) | |
| Lenovo Yoga 9i 14 2022 i7-1260P | |
| Average Intel Core i7-1260P, Intel Iris Xe Graphics G7 96EUs (6167 - 8629, n=17) | |
| Dell XPS 13 Plus 9320 4K | |
| Huawei MateBook X Pro 2021 | |
| PCMark 10 / Digital Content Creation | |
| Asus Zenbook S 13 OLED | |
| Average of class Subnotebook (4093 - 9749, n=55, last 2 years) | |
| Lenovo Yoga 9i 14 2022 i7-1260P | |
| Huawei MateBook X Pro 2022 | |
| Dell XPS 13 Plus 9320 4K | |
| Average Intel Core i7-1260P, Intel Iris Xe Graphics G7 96EUs (5231 - 6908, n=17) | |
| Huawei MateBook X Pro 2021 | |
| CrossMark / Overall | |
| Huawei MateBook X Pro 2022 | |
| Lenovo Yoga 9i 14 2022 i7-1260P | |
| Dell XPS 13 Plus 9320 4K | |
| Average Intel Core i7-1260P, Intel Iris Xe Graphics G7 96EUs (1484 - 1811, n=16) | |
| Average of class Subnotebook (718 - 1876, n=61, last 2 years) | |
| Apple MacBook Air M2 10C GPU | |
| Asus Zenbook S 13 OLED | |
| CrossMark / Productivity | |
| Huawei MateBook X Pro 2022 | |
| Lenovo Yoga 9i 14 2022 i7-1260P | |
| Average Intel Core i7-1260P, Intel Iris Xe Graphics G7 96EUs (1486 - 1755, n=16) | |
| Dell XPS 13 Plus 9320 4K | |
| Average of class Subnotebook (685 - 1829, n=61, last 2 years) | |
| Asus Zenbook S 13 OLED | |
| Apple MacBook Air M2 10C GPU | |
| CrossMark / Creativity | |
| Huawei MateBook X Pro 2022 | |
| Dell XPS 13 Plus 9320 4K | |
| Lenovo Yoga 9i 14 2022 i7-1260P | |
| Apple MacBook Air M2 10C GPU | |
| Average Intel Core i7-1260P, Intel Iris Xe Graphics G7 96EUs (1451 - 1872, n=16) | |
| Average of class Subnotebook (776 - 2210, n=61, last 2 years) | |
| Asus Zenbook S 13 OLED | |
| CrossMark / Responsiveness | |
| Huawei MateBook X Pro 2022 | |
| Lenovo Yoga 9i 14 2022 i7-1260P | |
| Average Intel Core i7-1260P, Intel Iris Xe Graphics G7 96EUs (1253 - 1807, n=16) | |
| Dell XPS 13 Plus 9320 4K | |
| Average of class Subnotebook (652 - 1899, n=61, last 2 years) | |
| Asus Zenbook S 13 OLED | |
| Apple MacBook Air M2 10C GPU | |
| PCMark 10 Score | 6068 points | |
Help | ||
| AIDA64 / Memory Copy | |
| Dell XPS 13 Plus 9320 4K | |
| Huawei MateBook X Pro 2021 | |
| Average of class Subnotebook (22781 - 95353, n=57, last 2 years) | |
| Huawei MateBook X Pro 2022 | |
| Average Intel Core i7-1260P (25125 - 71544, n=25) | |
| Asus Zenbook S 13 OLED | |
| AIDA64 / Memory Read | |
| Huawei MateBook X Pro 2022 | |
| Huawei MateBook X Pro 2021 | |
| Dell XPS 13 Plus 9320 4K | |
| Average of class Subnotebook (23831 - 86433, n=57, last 2 years) | |
| Average Intel Core i7-1260P (24983 - 72065, n=25) | |
| Asus Zenbook S 13 OLED | |
| AIDA64 / Memory Write | |
| Huawei MateBook X Pro 2021 | |
| Average of class Subnotebook (23474 - 93382, n=57, last 2 years) | |
| Dell XPS 13 Plus 9320 4K | |
| Huawei MateBook X Pro 2022 | |
| Average Intel Core i7-1260P (23512 - 66799, n=25) | |
| Asus Zenbook S 13 OLED | |
| AIDA64 / Memory Latency | |
| Asus Zenbook S 13 OLED | |
| Huawei MateBook X Pro 2022 | |
| Average of class Subnotebook (18.8 - 172, n=52, last 2 years) | |
| Huawei MateBook X Pro 2021 | |
| Average Intel Core i7-1260P (77.9 - 118.4, n=21) | |
* ... smaller is better
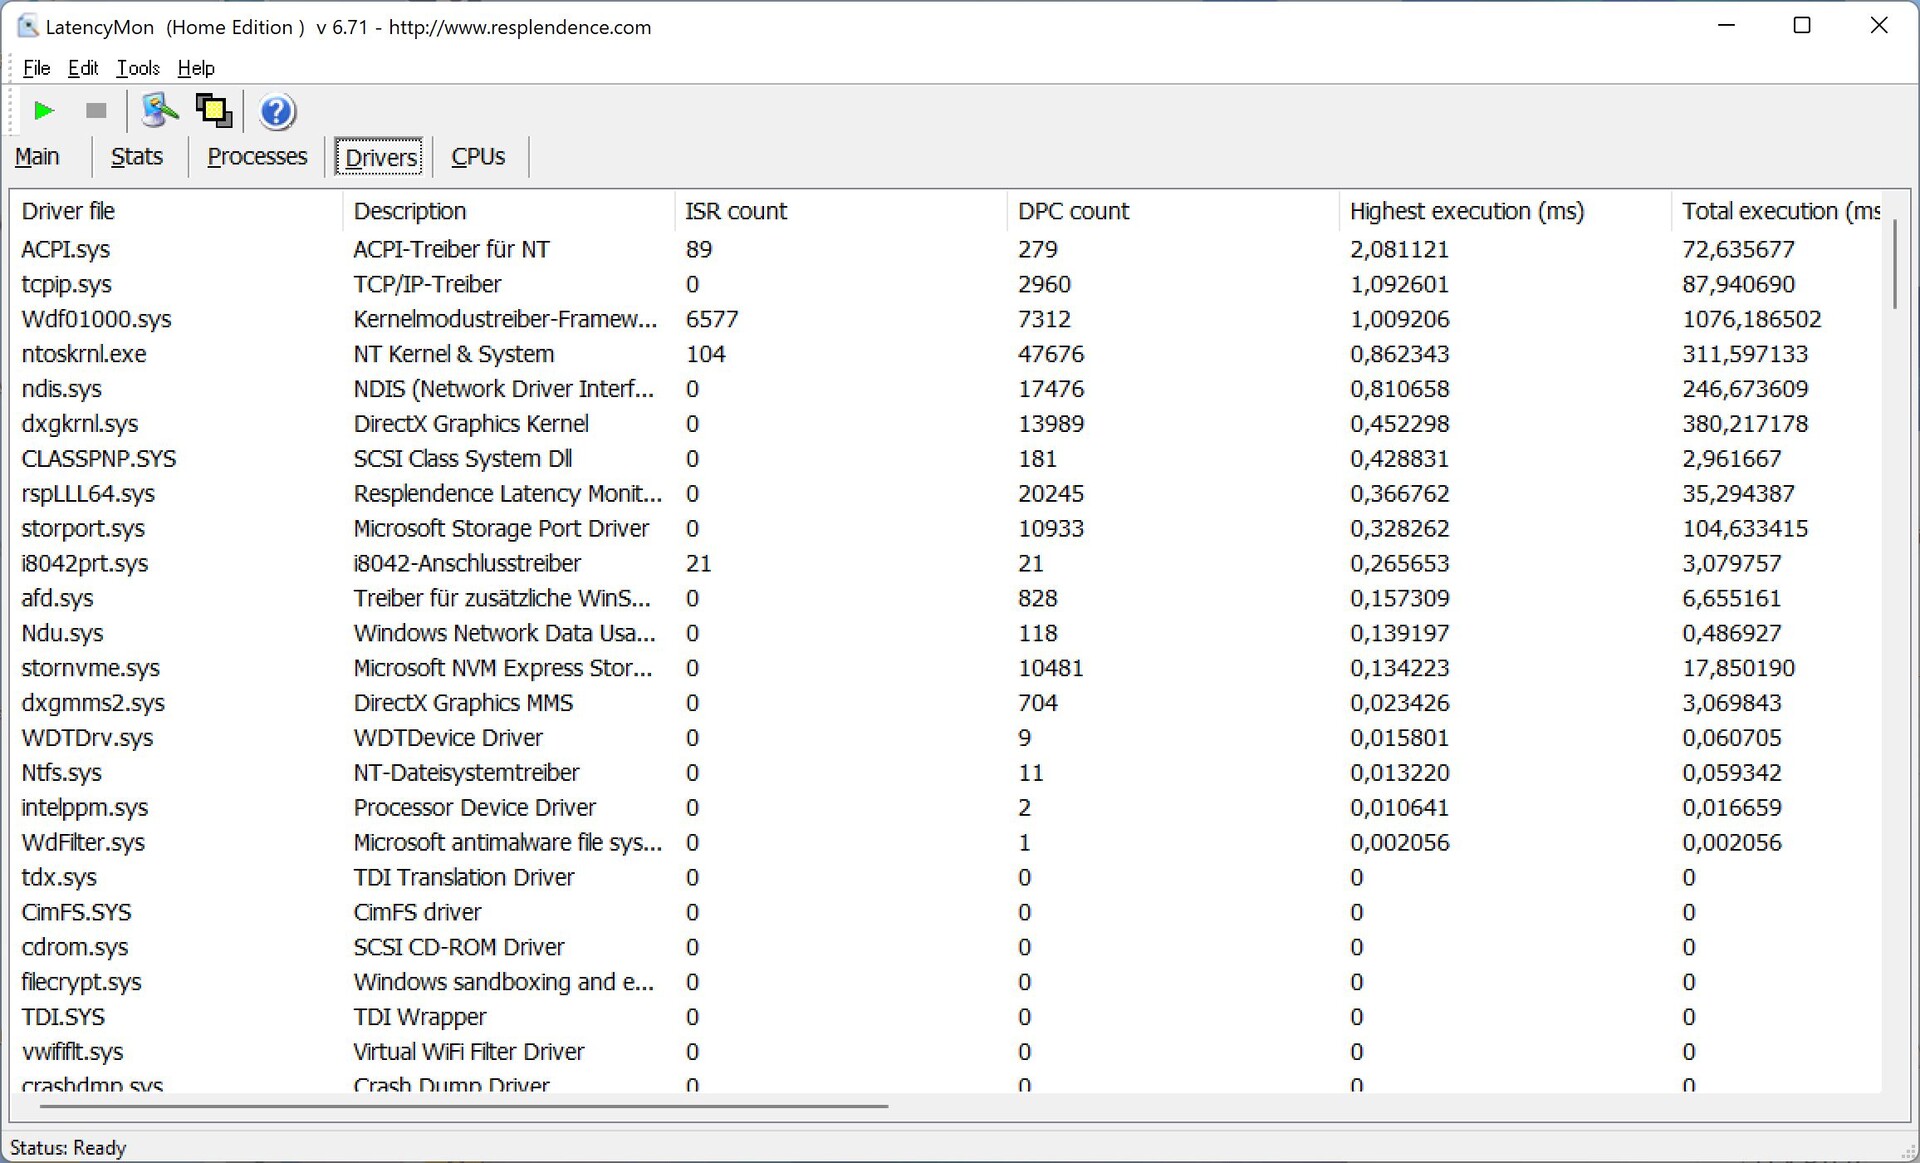
DPC Latency
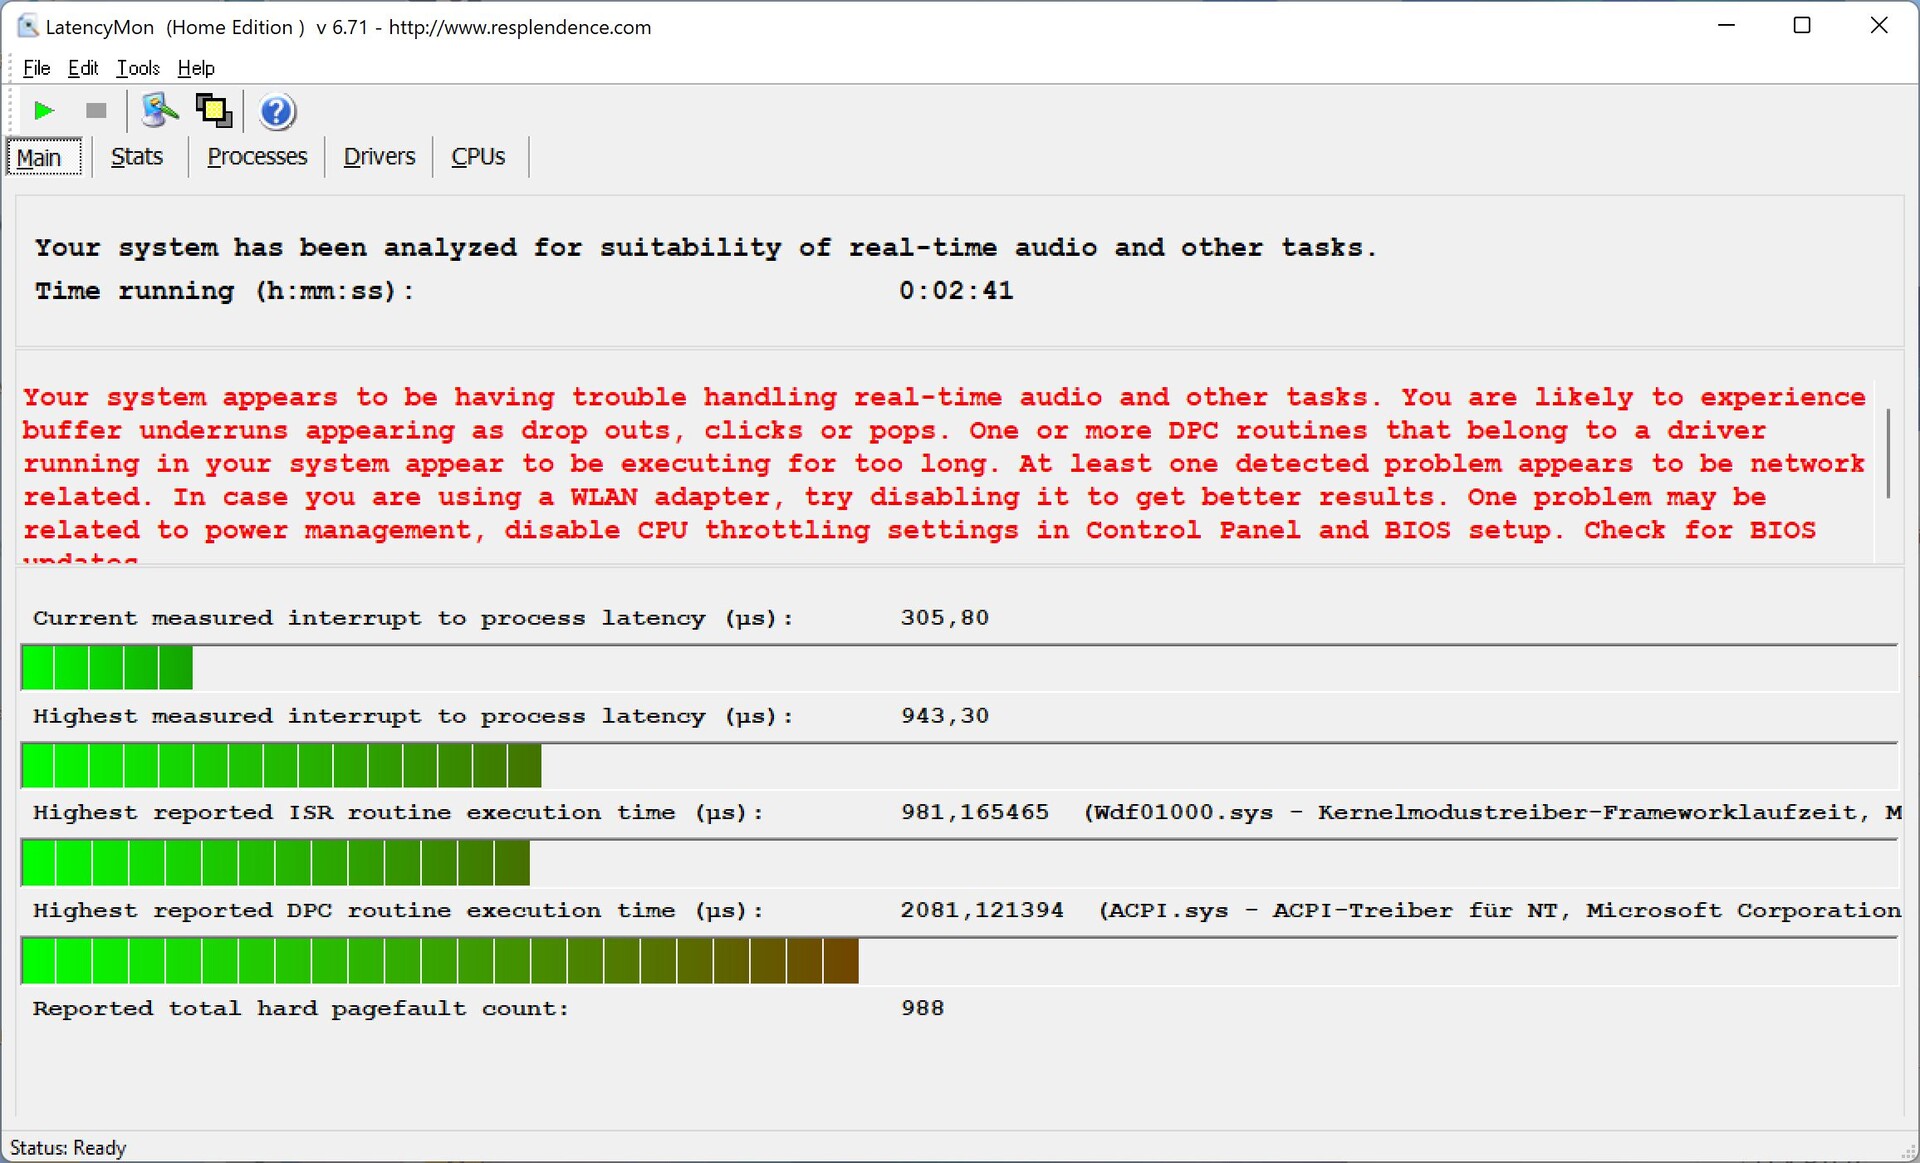
In our standardized latency test (web browsing, 4K YouTube playback, CPU load), our review device displayed slight limitations with the present BIOS version and is thus only conditionally suitable for the use of real-time audio applications.
| DPC Latencies / LatencyMon - interrupt to process latency (max), Web, Youtube, Prime95 | |
| Huawei MateBook X Pro 2021 | |
| Lenovo Yoga 9i 14 2022 i7-1260P | |
| Huawei MateBook X Pro 2022 | |
| Dell XPS 13 Plus 9320 4K | |
| Asus Zenbook S 13 OLED | |
* ... smaller is better
Storage Devices
Huawei uses a PCIe 3.0 x4 SSD with a storage capacity of 1 TB, of which around 885 GB is still available after the first startup. However, as in all other Huawei laptops, the SSD is partitioned ex-factory and the system drive is very small at ~120 GB. After subtracting the space occupied by Windows, just under 70 GB remains, which can quickly lead to capacity problems. The remaining 814 GB is available on the D drive.
There are also limitations on speed. Basically, the transfer rates of around 3 GB/s are completely sufficient (even if one should reasonably expect a PCIe 4.0 drive with higher transfer rates for the price), but the drive has temperature problems under sustained load (74 °C according to HWiNFO) and so performance periodically breaks down. A look at the cooling reveals that the drive is located directly on the CPU heat sink. On the other hand, the effects are negligible in everyday use and we did not register any restrictions in our normal test procedure. More SSD benchmarks are available here.

* ... smaller is better
Sustained Read Performance: DiskSpd Read Loop, Queue Depth 8
Graphics Card
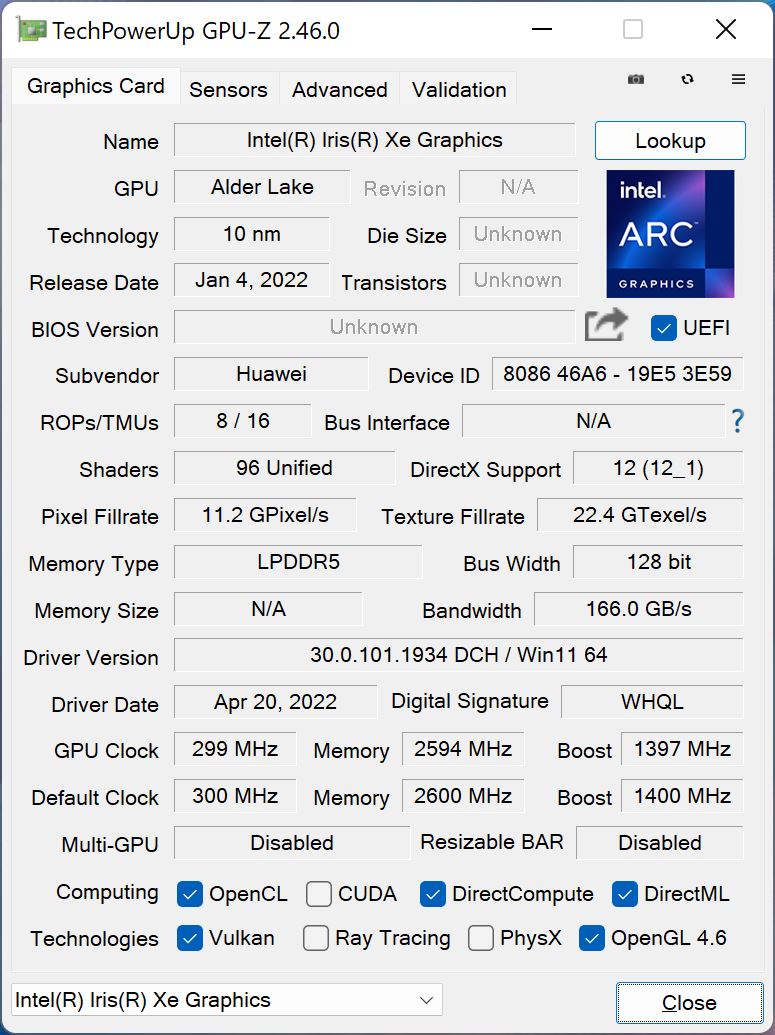
We can be quite brief about the graphics card, since the well-known Iris Xe Graphics G7 iGPU from Intel is used here in the faster version with 96 EUs. This offers sufficient performance for normal everyday use and can also handle high-resolution videos without any problems. In the synthetic benchmarks, it benefits from the dual-channel configuration of the working memory and is on the expected level, although this is significantly below the Radeon 680M iGPU and Apple M2 GPUs (with 8 or 10 cores). Compared to the predecessor (with the same iGPU), graphics performance has improved only marginally.
The MateBook X Pro is thus only partially suitable for gaming and users are often limited to low or medium details even in simple titles. At least performance remains stable during longer gaming sessions, as demonstrated by our Witcher 3 loop.
On battery power, performance is somewhat limited and you should expect a deficit of ~13%. More GPU benchmarks are available here.
| 3DMark 11 Performance | 7512 points | |
| 3DMark Cloud Gate Standard Score | 21739 points | |
| 3DMark Fire Strike Score | 5021 points | |
| 3DMark Time Spy Score | 1964 points | |
Help | ||
Witcher 3 FPS Chart
| low | med. | high | ultra | QHD | |
| GTA V (2015) | 115.4 | 102.4 | 23.9 | 10.2 | |
| The Witcher 3 (2015) | 95 | 60 | 33 | 14.2 | |
| Dota 2 Reborn (2015) | 113 | 87.5 | 65.3 | 59.1 | |
| Final Fantasy XV Benchmark (2018) | 44.7 | 25.1 | 18.5 | 13 | |
| X-Plane 11.11 (2018) | 32.8 | 31.1 | 29.8 | ||
| Far Cry 5 (2018) | 56 | 30 | 28 | 26 | 17 |
| Strange Brigade (2018) | 91.6 | 43.9 | 35.3 | 28.6 | |
| F1 2021 (2021) | 102.9 | 49.8 | 39.5 | 27.8 | |
| Farming Simulator 22 (2021) | 96 | 45 | 33 | 31 | 25 |
Emissions - MateBook with excellent speakers
Noise
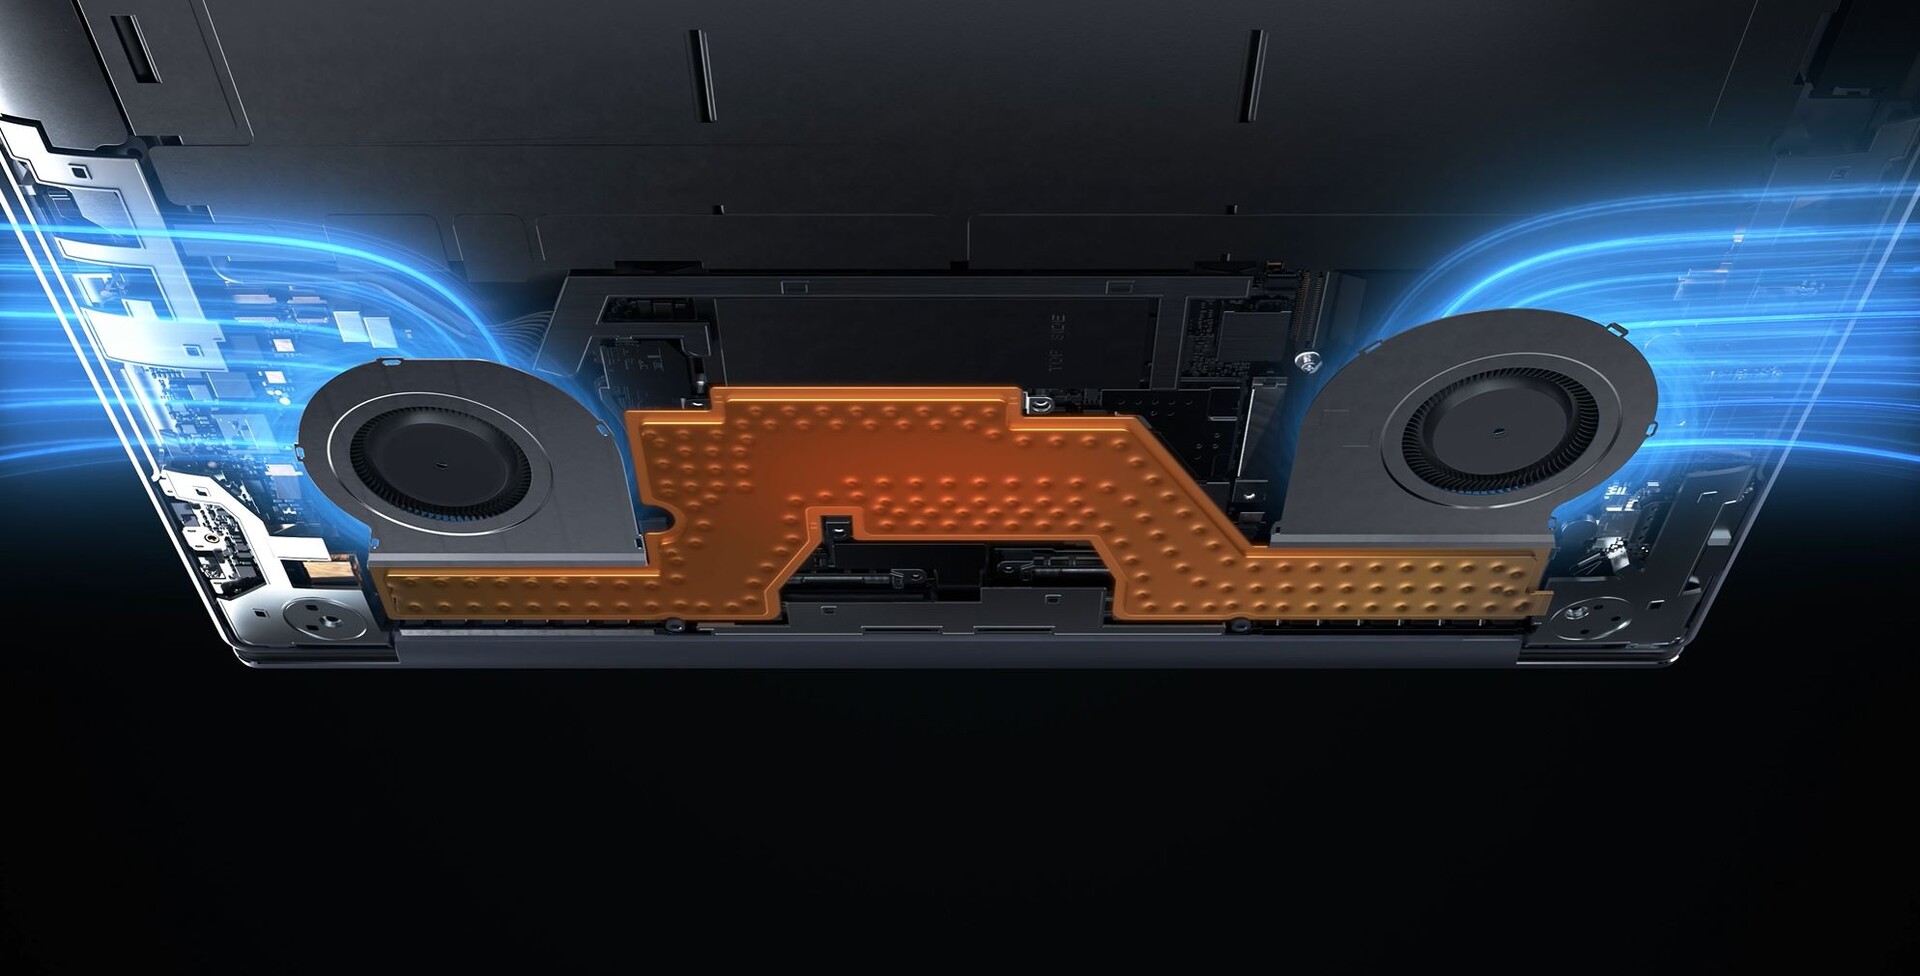
Fundamentally, the cooling system with its two fans and a vapor chamber provide good passive cooling, for it takes at least 20 seconds under load before the fans even kick in. There is a clear difference between the two performance profiles in relation to fan noise, even though the consumption difference here is only 5 watts. The maximum level of 40.6 dB(A) measured in the stress test quickly levels off at 38.2 dB(A) as soon as power consumption stabilizes at 30 watts. The fan noise is by no means unpleasant or high-pitched, only reaching a maximum of 33.4 dB(A) in Balanced mode, which is considerably quieter. We thus recommend using Balanced mode in everyday use.
No other electronic noises such as coil whine were detected.
| Modes | 3DMark 06 | Witcher 3 Ultra | Stress test |
|---|---|---|---|
| Balanced | 31,5 dB(A) | 31,5 dB(A) | 33,4 dB(A) |
| Performance | 33,8 dB(A) | 35,4 dB(A) | 40,6 -> 38,2 dB(A) |
Noise Level
| Idle |
| 23.5 / 23.5 / 25.9 dB(A) |
| Load |
| 33.8 / 40.6 dB(A) |
 | ||
30 dB silent 40 dB(A) audible 50 dB(A) loud |
||
min: | ||
| Huawei MateBook X Pro 2022 Iris Xe G7 96EUs, i7-1260P, Silicon Motion PCIe-8 SSD 1TB | Lenovo Yoga 9i 14 2022 i7-1260P Iris Xe G7 96EUs, i7-1260P, Samsung PM9A1 MZVL21T0HCLR | Asus Zenbook S 13 OLED Radeon 680M, R7 6800U, Samsung PM9A1 MZVL21T0HCLR | Dell XPS 13 Plus 9320 4K Iris Xe G7 96EUs, i7-1260P, Samsung PM9A1 MZVL21T0HCLR | Huawei MateBook X Pro 2021 Iris Xe G7 96EUs, i7-1165G7, Samsung PM981a MZVLB1T0HBLR | |
|---|---|---|---|---|---|
| Noise | -7% | -2% | -10% | 1% | |
| off / environment * | 23.5 | 24.1 -3% | 24 -2% | 24.4 -4% | 25.4 -8% |
| Idle Minimum * | 23.5 | 24.1 -3% | 24 -2% | 24.4 -4% | 25.6 -9% |
| Idle Average * | 23.5 | 24.1 -3% | 24 -2% | 24.4 -4% | 25.6 -9% |
| Idle Maximum * | 25.9 | 30 -16% | 24 7% | 25.5 2% | 25.6 1% |
| Load Average * | 33.8 | 39.4 -17% | 33.1 2% | 40.4 -20% | 28.7 15% |
| Witcher 3 ultra * | 35.4 | 39.4 -11% | 40.2 -14% | 45.5 -29% | 32 10% |
| Load Maximum * | 40.6 | 39.4 3% | 41.7 -3% | 45.5 -12% | 38.2 6% |
* ... smaller is better
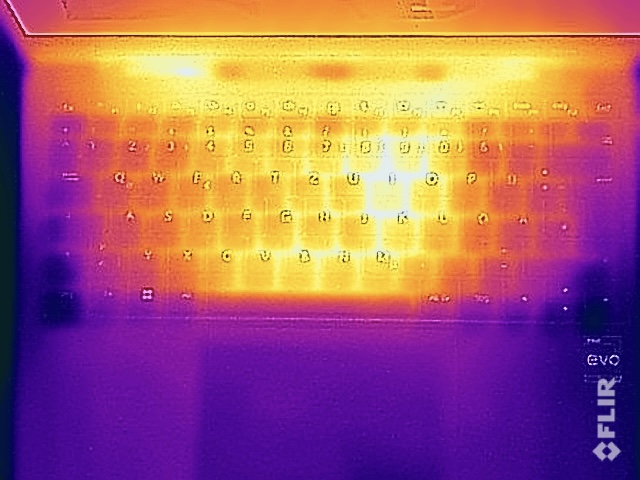
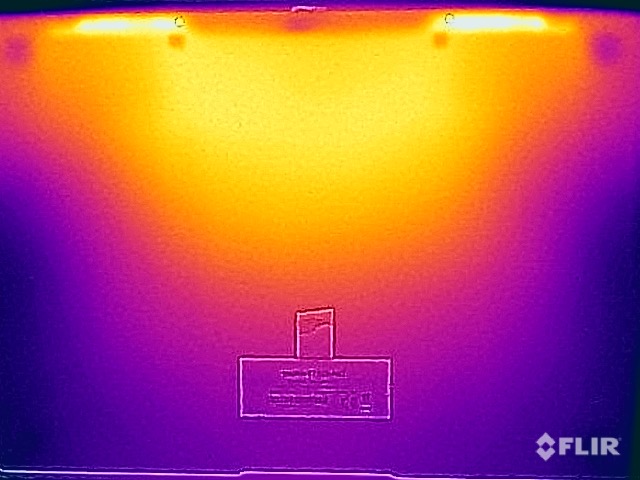
Temperature
Huawei has the surface temperatures well under control. The case does get a few degrees warmer than usual when idle and during light tasks, but this is not problematic. Under load, you can clearly see the position of the cooling system and the fans in the infrared images, since these areas (the center in particular) become hot. The upper side of the keyboard even gets a bit warmer than the underside and this is also noticeable when typing, but this does not prove to be limiting. The palm rest, on the other hand, remains pleasantly cool, even in the stress test. At a maximum of 42 °C on the underside, you can place the MateBook X Pro on your lap without hesitation, even under load.
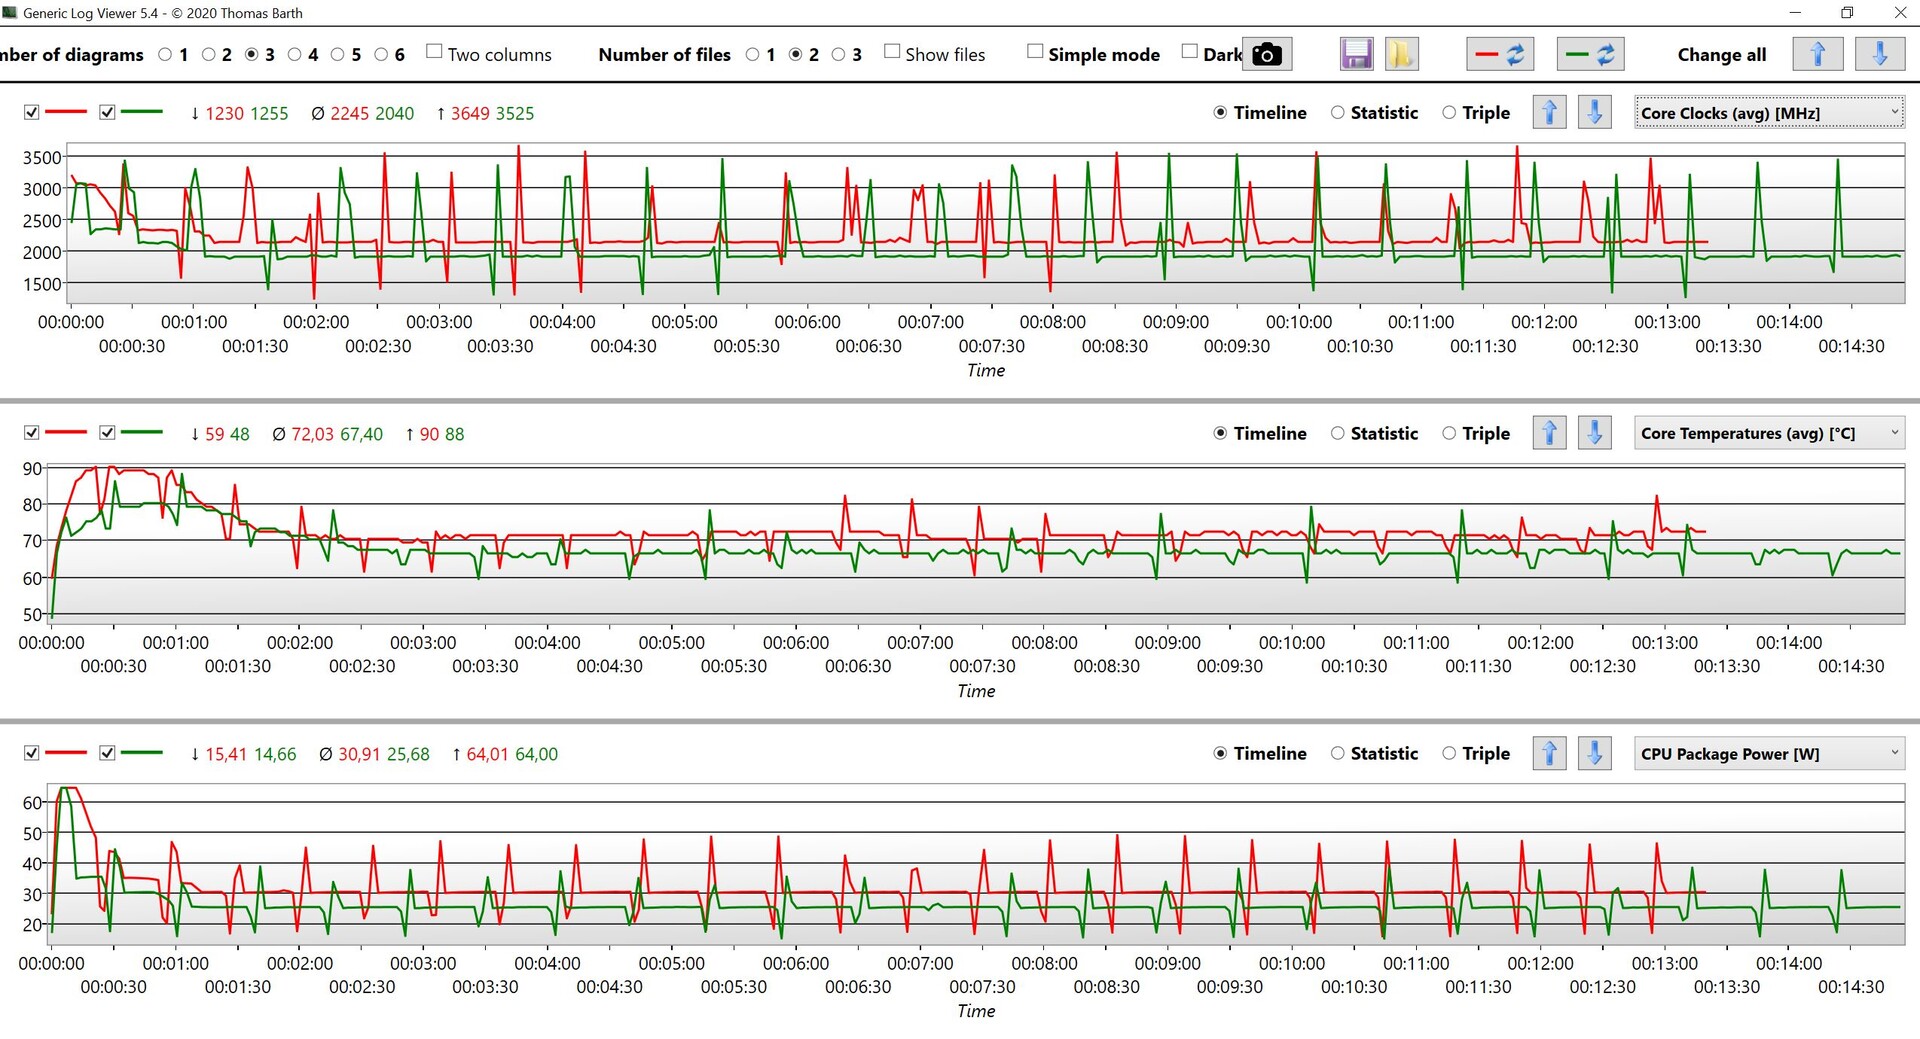
In the stress test, we observe the same behavior as in pure CPU load. After a brief consumption peak at 64 watts, the consumption quickly stabilizes at 30 watts. There are slight shifts in the CPU/iGPU clocks over the course of the test, but everything remains fairly stable overall.
(±) The maximum temperature on the upper side is 43.1 °C / 110 F, compared to the average of 35.9 °C / 97 F, ranging from 21.4 to 59 °C for the class Subnotebook.
(±) The bottom heats up to a maximum of 42 °C / 108 F, compared to the average of 39.4 °C / 103 F
(+) In idle usage, the average temperature for the upper side is 27 °C / 81 F, compared to the device average of 30.7 °C / 87 F.
(±) Playing The Witcher 3, the average temperature for the upper side is 36.2 °C / 97 F, compared to the device average of 30.7 °C / 87 F.
(+) The palmrests and touchpad are cooler than skin temperature with a maximum of 28.6 °C / 83.5 F and are therefore cool to the touch.
(±) The average temperature of the palmrest area of similar devices was 28.3 °C / 82.9 F (-0.3 °C / -0.6 F).
| Huawei MateBook X Pro 2022 Intel Core i7-1260P, Intel Iris Xe Graphics G7 96EUs | Apple MacBook Air M2 10C GPU Apple M2, Apple M2 10-Core GPU | Lenovo Yoga 9i 14 2022 i7-1260P Intel Core i7-1260P, Intel Iris Xe Graphics G7 96EUs | Asus Zenbook S 13 OLED AMD Ryzen 7 6800U, AMD Radeon 680M | Dell XPS 13 Plus 9320 4K Intel Core i7-1260P, Intel Iris Xe Graphics G7 96EUs | Huawei MateBook X Pro 2021 Intel Core i7-1165G7, Intel Iris Xe Graphics G7 96EUs | |
|---|---|---|---|---|---|---|
| Heat | 5% | -6% | -7% | -2% | -3% | |
| Maximum Upper Side * | 43.1 | 44.7 -4% | 47.5 -10% | 47.9 -11% | 41.1 5% | 42.2 2% |
| Maximum Bottom * | 42 | 44.6 -6% | 52.2 -24% | 56.1 -34% | 48.8 -16% | 40.4 4% |
| Idle Upper Side * | 29.4 | 25.1 15% | 27.1 8% | 26.8 9% | 28 5% | 31.2 -6% |
| Idle Bottom * | 29.4 | 25.3 14% | 28.5 3% | 27.3 7% | 29.3 -0% | 32.2 -10% |
* ... smaller is better
Speakers
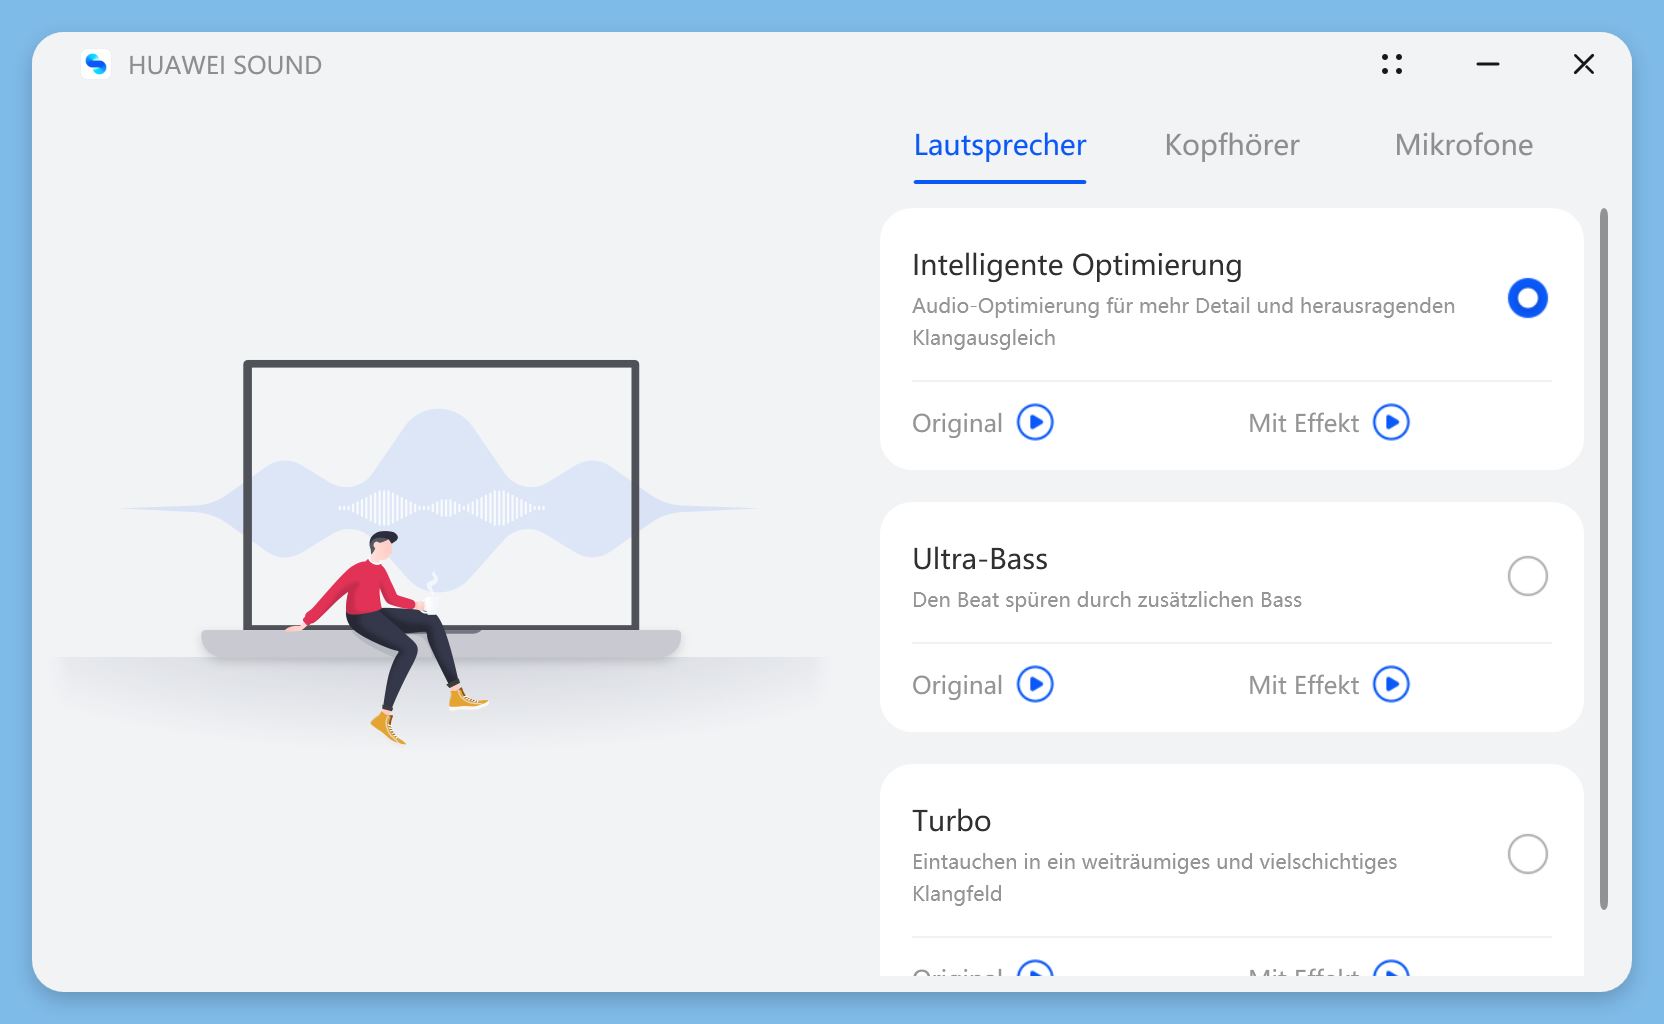
The MateBook X Pro offers a sound system with 6 speakers and the performance is excellent. The sound is very expansive, powerful and very loud. Moreover, the Huawei sound software offers some improvements, both for the speakers, connected headphones and the microphones. Alongside our subjective impression, the test result is very good and the MateBook X Pro is also just ahead of the current MacBook Air M2 and only very slightly behind the MacBook Pro 14, which offers a little more bass. External speakers are not necessary in most cases.
Huawei MateBook X Pro 2022 audio analysis
(+) | speakers can play relatively loud (85.5 dB)
Bass 100 - 315 Hz
(±) | reduced bass - on average 5% lower than median
(+) | bass is linear (5.3% delta to prev. frequency)
Mids 400 - 2000 Hz
(+) | balanced mids - only 1.5% away from median
(+) | mids are linear (2.5% delta to prev. frequency)
Highs 2 - 16 kHz
(+) | balanced highs - only 2.1% away from median
(+) | highs are linear (5.3% delta to prev. frequency)
Overall 100 - 16.000 Hz
(+) | overall sound is linear (5% difference to median)
Compared to same class
» 0% of all tested devices in this class were better, 0% similar, 100% worse
» The best had a delta of 5%, average was 19%, worst was 53%
Compared to all devices tested
» 0% of all tested devices were better, 0% similar, 100% worse
» The best had a delta of 4%, average was 25%, worst was 134%
Lenovo Yoga 9i 14 2022 i7-1260P audio analysis
(+) | speakers can play relatively loud (84 dB)
Bass 100 - 315 Hz
(±) | reduced bass - on average 7.4% lower than median
(±) | linearity of bass is average (7.2% delta to prev. frequency)
Mids 400 - 2000 Hz
(+) | balanced mids - only 1.1% away from median
(+) | mids are linear (3.4% delta to prev. frequency)
Highs 2 - 16 kHz
(+) | balanced highs - only 2.1% away from median
(+) | highs are linear (3.2% delta to prev. frequency)
Overall 100 - 16.000 Hz
(+) | overall sound is linear (6% difference to median)
Compared to same class
» 0% of all tested devices in this class were better, 0% similar, 100% worse
» The best had a delta of 6%, average was 21%, worst was 57%
Compared to all devices tested
» 0% of all tested devices were better, 0% similar, 100% worse
» The best had a delta of 4%, average was 25%, worst was 134%
Apple MacBook Pro 14 2021 M1 Pro Entry audio analysis
(+) | speakers can play relatively loud (84.9 dB)
Bass 100 - 315 Hz
(+) | good bass - only 4.3% away from median
(+) | bass is linear (5.9% delta to prev. frequency)
Mids 400 - 2000 Hz
(+) | balanced mids - only 1.1% away from median
(+) | mids are linear (1.9% delta to prev. frequency)
Highs 2 - 16 kHz
(+) | balanced highs - only 2.9% away from median
(+) | highs are linear (3% delta to prev. frequency)
Overall 100 - 16.000 Hz
(+) | overall sound is linear (5.6% difference to median)
Compared to same class
» 1% of all tested devices in this class were better, 1% similar, 98% worse
» The best had a delta of 5%, average was 18%, worst was 45%
Compared to all devices tested
» 0% of all tested devices were better, 0% similar, 100% worse
» The best had a delta of 4%, average was 25%, worst was 134%
Apple MacBook Air M2 Entry audio analysis
(+) | speakers can play relatively loud (82.7 dB)
Bass 100 - 315 Hz
(±) | reduced bass - on average 12.2% lower than median
(±) | linearity of bass is average (12.6% delta to prev. frequency)
Mids 400 - 2000 Hz
(+) | balanced mids - only 1.1% away from median
(+) | mids are linear (3.1% delta to prev. frequency)
Highs 2 - 16 kHz
(+) | balanced highs - only 2.4% away from median
(+) | highs are linear (1.9% delta to prev. frequency)
Overall 100 - 16.000 Hz
(+) | overall sound is linear (9.5% difference to median)
Compared to same class
» 3% of all tested devices in this class were better, 2% similar, 96% worse
» The best had a delta of 5%, average was 19%, worst was 53%
Compared to all devices tested
» 3% of all tested devices were better, 1% similar, 97% worse
» The best had a delta of 4%, average was 25%, worst was 134%
Energy Management - Bright display drains battery life
Power Consumption
The new MateBook X Pro is not a particularly economical notebook, which is primarily due to the very bright and also large display. We measured up to 14 watts in idle mode. Under load, power consumption jumps up to 91 watts due to the high power limits of the processor, but then levels off at just under 56 watts. We also checked with a stronger power supply whether the 90 watt power supply was limiting the laptop's maximum power consumption, but this was not the case. Overall, the 90 watt power supply is sufficient.
| Off / Standby | |
| Idle | |
| Load |
|
| Huawei MateBook X Pro 2022 i7-1260P, Iris Xe G7 96EUs, Silicon Motion PCIe-8 SSD 1TB, IPS, 3120x2080, 14.20 | Apple MacBook Air M2 10C GPU M2, M2 10-Core GPU, Apple SSD AP1024Z, IPS, 2560x1664, 13.60 | Lenovo Yoga 9i 14 2022 i7-1260P i7-1260P, Iris Xe G7 96EUs, Samsung PM9A1 MZVL21T0HCLR, OLED, 3840x2400, 14.00 | Asus Zenbook S 13 OLED R7 6800U, Radeon 680M, Samsung PM9A1 MZVL21T0HCLR, OLED, 2880x1800, 13.30 | Dell XPS 13 Plus 9320 4K i7-1260P, Iris Xe G7 96EUs, Samsung PM9A1 MZVL21T0HCLR, IPS, 3840x2400, 13.40 | Huawei MateBook X Pro 2021 i7-1165G7, Iris Xe G7 96EUs, Samsung PM981a MZVLB1T0HBLR, IPS, 3000x2000, 13.90 | Average Intel Iris Xe Graphics G7 96EUs | Average of class Subnotebook | |
|---|---|---|---|---|---|---|---|---|
| Power Consumption | 49% | 9% | 32% | 14% | 28% | 28% | 30% | |
| Idle Minimum * | 6.5 | 1.9 71% | 7.1 -9% | 4.8 26% | 7 -8% | 6.7 -3% | 5.26 ? 19% | 4.9 ? 25% |
| Idle Average * | 13.7 | 9.6 30% | 10 27% | 8.7 36% | 11 20% | 10 27% | 8.46 ? 38% | 8.36 ? 39% |
| Idle Maximum * | 14.4 | 9.7 33% | 10.8 25% | 10.1 30% | 11.4 21% | 10.3 28% | 10.6 ? 26% | 10.4 ? 28% |
| Load Average * | 64.6 | 32.4 50% | 64 1% | 45.6 29% | 59.7 8% | 35.7 45% | 44.8 ? 31% | 45.9 ? 29% |
| Witcher 3 ultra * | 57.2 | 30.8 46% | 47.7 17% | 42.4 26% | 49.4 14% | 32.7 43% | ||
| Load Maximum * | 90.9 | 35.7 61% | 97 -7% | 49.5 46% | 63 31% | 67.6 26% | 66.6 ? 27% | 66 ? 27% |
* ... smaller is better
Power consumption Witcher 3 / Stress test
Power consumption with an external monitor
Battery Life
The combination of the 60 Wh battery and the high consumption rates does not allow for particularly long battery runtimes. The display is simply a power guzzler and even at a brightness of 150 cd/m² (corresponding to 56% of the maximum brightness in our review device), we only managed ~7.5 hours in both our video and WLAN tests. The WLAN test even stops after less than 5 hours at full display brightness. The competition simply offers more stamina; a whole working day without a power outlet is very unlikely with the MateBook X Pro.
At least the device is recharged relatively quickly because a full charge (with the laptop turned on) takes around 80 minutes, whereby 50% is available after 34 minutes and 80% after 52 minutes.
| Huawei MateBook X Pro 2022 i7-1260P, Iris Xe G7 96EUs, 60 Wh | Apple MacBook Air M2 10C GPU M2, M2 10-Core GPU, 52.6 Wh | Lenovo Yoga 9i 14 2022 i7-1260P i7-1260P, Iris Xe G7 96EUs, 75 Wh | Asus Zenbook S 13 OLED R7 6800U, Radeon 680M, 67 Wh | Dell XPS 13 Plus 9320 4K i7-1260P, Iris Xe G7 96EUs, 55 Wh | Huawei MateBook X Pro 2021 i7-1165G7, Iris Xe G7 96EUs, 56 Wh | Average of class Subnotebook | |
|---|---|---|---|---|---|---|---|
| Battery Runtime | 102% | 27% | 56% | 4% | 61% | 43% | |
| H.264 | 455 | 946 108% | 758 67% | 912 100% | 657 44% | 794 ? 75% | |
| WiFi v1.3 | 451 | 884 96% | 517 15% | 550 22% | 414 -8% | 629 39% | 629 ? 39% |
| Load | 100 | 98 -2% | 146 46% | 76 -24% | 182 82% | 115.4 ? 15% |
Pros
Cons
Verdict: MateBook X Pro with only a few weaknesses
Huawei is aiming to be the top dog in ultrabooks with its new MateBook X Pro of 2022, which is also reflected in the confident price of 2,199 Euros. Upon concluding the review process, our impression was a very positive one: For a high price, users get a very fine-tuned package overall that has only a few weak points. The 720p camera is certainly one of them, but at least it has been enhanced by several new software features. The lack of maintenance options and difficult access to the components are also points of criticism. Lastly, we weren't too pleased with the fluctuating SSD performance and the comparatively short battery runtimes.
In return, you get a compact and high-quality 14.2-inch device with an extremely good IPS display that offers a brightness level of almost 600 cd/m². Furthermore, color accuracy is very good and you can switch between the P3 and sRGB color spaces via software, which not many workstations can do. No PWM is present and the 3:2 form factor is well suited for working.
The Alder Lake Core i7-1260P and reasonable power levels allow for excellent system performance, but there are faster competitors in terms of pure CPU performance. In practice, balanced mode is completely sufficient, especially since you benefit from much quieter fans; at a maximum of ~33 dB(A) in balanced mode, the MateBook X Pro is one of the quietest models. Only the passively cooled MacBook Air M2 has the edge here. Huawei wastes some potential in the SSD, since there is no PCIe 4.0 drive and the positioning on the heat sink causes performance drops after some time. Nonetheless, this should not be an issue for the vast majority of users in everyday life.
A high-quality case, very good system performance, great speakers and a top display: The new Huawei MateBook X Pro 2022 is an extremely good package overall. If you can live with the lack of maintenance options and mediocre battery runtimes, you'll have the best Windows ultrabook on your hands as well as the best alternative to Apple's MacBook Air currently.
Huawei has upgraded the equipment and now offers two full-fledged Thunderbolt 4 ports for the first time. There is also a modern Wi-Fi 6E module from Intel and owners of other Huawei devices (such as smartphones or tablets) can be pleased about the efficient networking between individual devices. Huawei has also upgraded the input devices: The keyboard now offers more key travel and is thus more comfortable to type on, but the large touchpad also offers real added value with the additional gestures. The speakers were not spared either, for our review sample can easily compete with the current MacBook Air M2.
Speaking of the MacBook Air M2, it is undoubtedly one of the biggest rivals to the MateBook X Pro. It is far more efficient with its M2 chip and always silent thanks to passive cooling. However, the MacBook Air M2 does have its disadvantages, especially in terms of features, since you have to do without fast Wi-Fi 6E (or Wi-Fi 6 with 160 MHz) as well as Thunderbolt 4. The Lenovo Yoga 9i 14 is also an extremely good device and an interesting choice if you can make use of the convertible format. The Asus ZenBook S 13, on the other hand, is a little more compact with its 13.3-inch display, but offers even more performance with the AMD processor, especially thanks to the fast iGPU. The Dell XPS 13 Plus 9320 also impresses with its compact case, but does not offer such a good package overall.
Price and Availability
The newly released MateBook X Pro 2022 is yet to arrive in all regions worldwide, so availability may be sparse. Users are advised to check directly via Huawei's online shop here. First select your location, then type in MateBook X Pro 2022 in the search bar.
We found, for example, that the device is already available in France (2199.99€), the UK (£1799.99), Romania (9.999,00 Lei), Singapore ($2,798.00), South Africa (R 35,999.00), Saudi Arabia and UAE.
This list is not exhaustive. Prices are as of 09.09.2022 and subject to change.
Huawei MateBook X Pro 2022
-
09/08/2022 v7
Andreas Osthoff
More articles related to this device
Huawei MateBook X Pro 2022 (MateBook X Pro Series)Related Articles

Pricecompare

