 Deutsch
 English
 Español
 Français
 Italiano
 Nederlands
 Polski
 Português
 Русский
 Türkçe
 Svenska
 Chinese
 Magyar
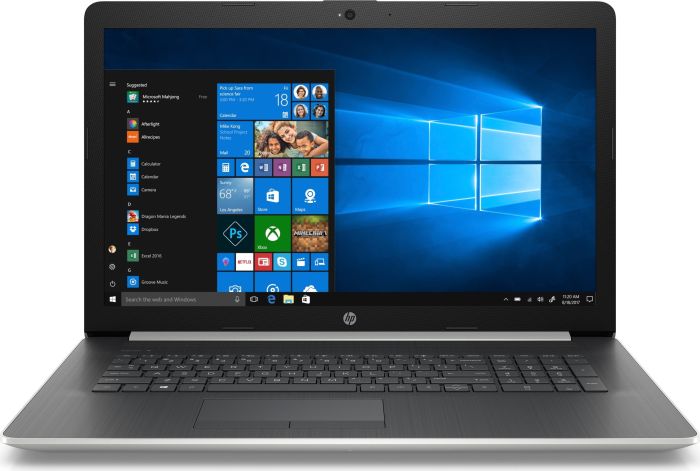
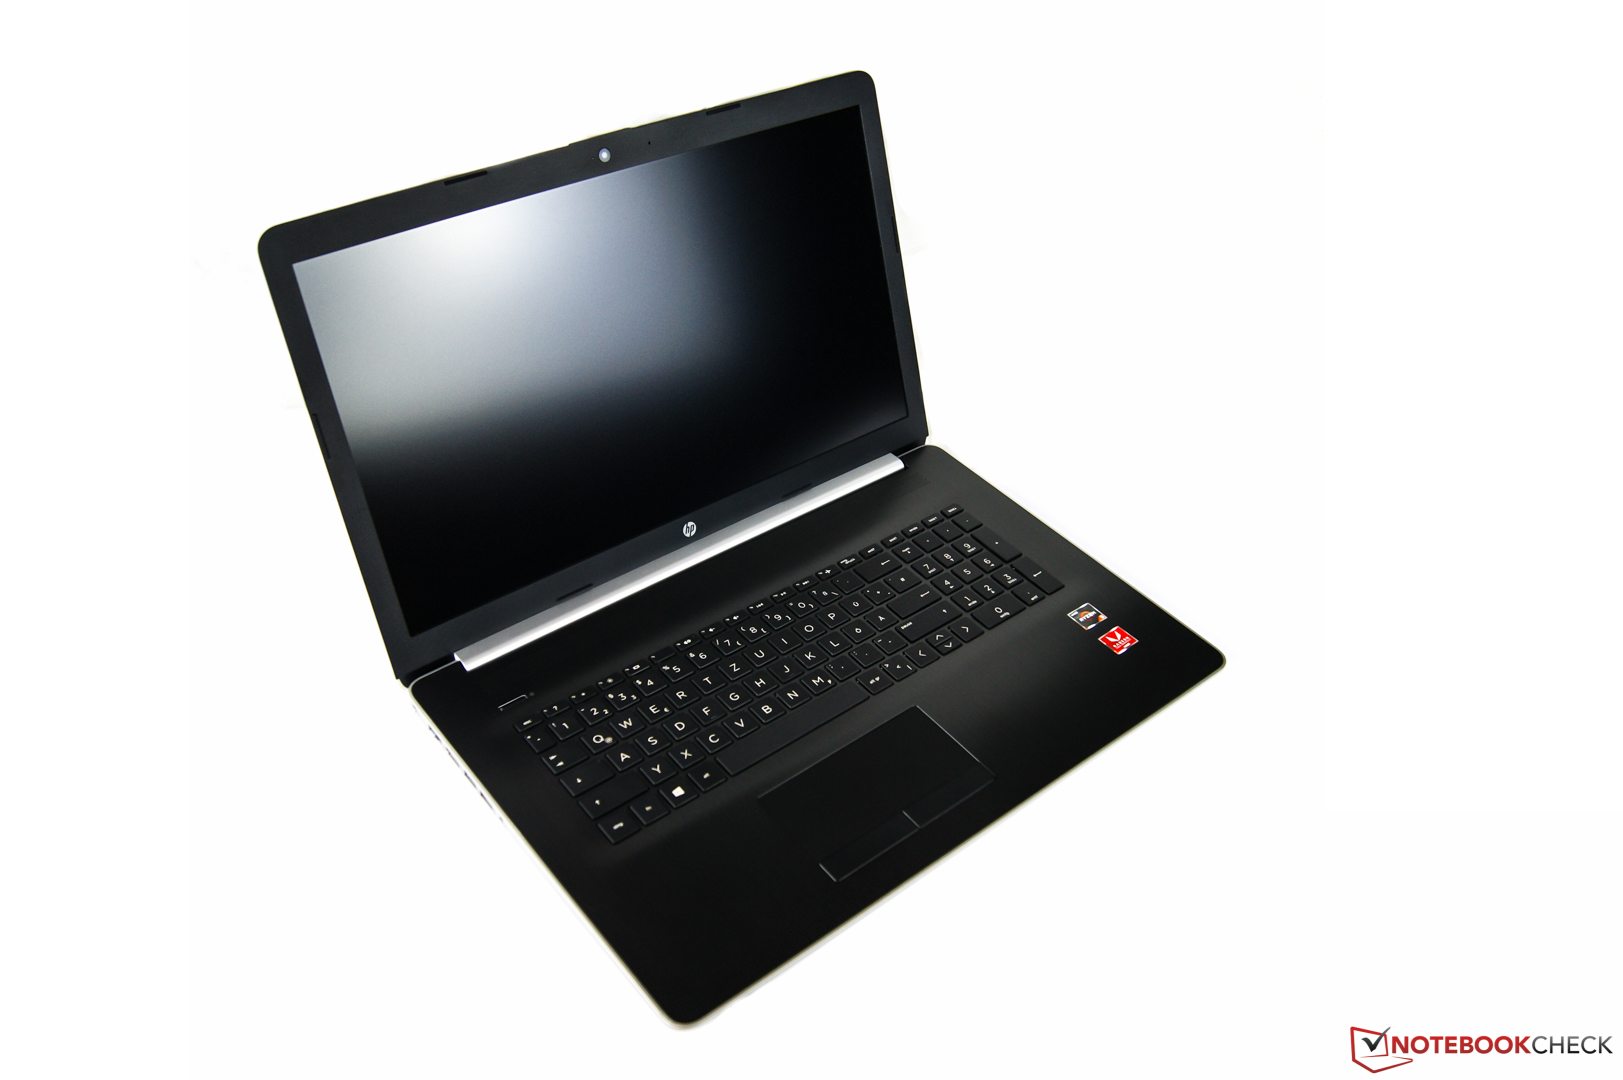
HP 17 (Ryzen 5 2500U, FHD, IPS, Vega 8) Review

We have already had HP’s 17-inch notebook in review. The last model, reviewed in 2017, was equipped with an Intel Core i5 CPU and an AMD Radeon 530 GPU. Its biggest weakness was the poor TN panel. Today’s review unit features a high-quality IPS panel, a much more powerful AMD Ryzen 2500U CPU, an AMD Vega 8 GPU, a 256 GB large SSD, and a 1 TB large HDD. Compared to last year’s model, we expect a substantial performance boost due to its much faster components. The price has remained the same, and our particular review unit sold for 700 Euros (~$794) at the time of writing.
Given that the case has remained practically unchanged from last year’s model we would like to refer you to our previous review for further details.
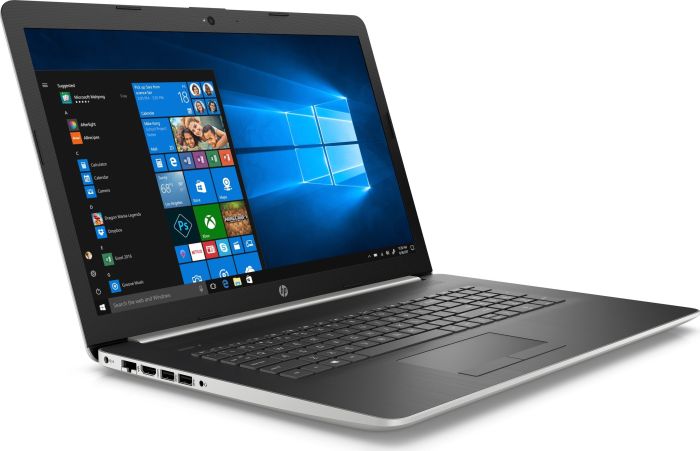
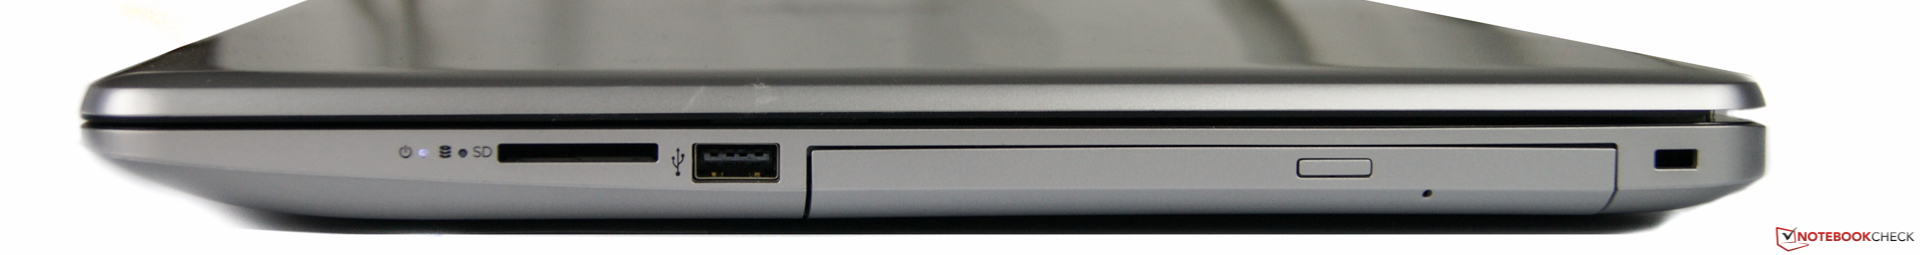
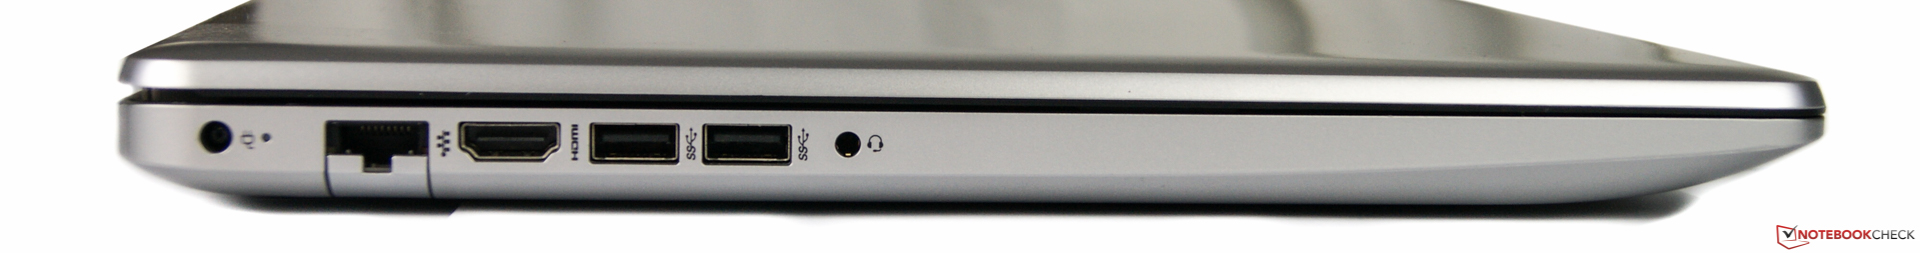
The one thing that has changed is the port placement: all left-hand side ports have been relocated towards the rear, and the fan no longer vents to the left side.
The SD card reader performed better than last year. In our JPEG copy test, conducted with our 64 GB Toshiba Exceria Pro SDXC UHS-II reference card, it managed 34 MB/s compared to last year’s 23 MB/s. However, despite its improved performance the card reader still remained below average for its class. Wi-Fi performance has also been improved somewhat and is now at around 200 Mbps out of a possible maximum of 433 Mbps.
| SD Card Reader | |
| average JPG Copy Test (av. of 3 runs) | |
| Average of class Multimedia (17.6 - 205, n=66, last 2 years) | |
| HP 17-ca0013ng (Toshiba Exceria Pro SDXC 64 GB UHS-II) | |
| Lenovo Ideapad 320-17AST-80XW0013GE (Toshiba Exceria Pro SDXC 64 GB UHS-II) | |
| Dell Inspiron 17-5770-0357 (Toshiba Exceria Pro SDXC 64 GB UHS-II) | |
| HP 17-bs103ng (Toshiba Exceria Pro SDXC 64 GB UHS-II) | |
| maximum AS SSD Seq Read Test (1GB) | |
| Average of class Multimedia (16.8 - 266, n=62, last 2 years) | |
| HP 17-ca0013ng (Toshiba Exceria Pro SDXC 64 GB UHS-II) | |
| Lenovo Ideapad 320-17AST-80XW0013GE (Toshiba Exceria Pro SDXC 64 GB UHS-II) | |
| HP 17-bs103ng (Toshiba Exceria Pro SDXC 64 GB UHS-II) | |
| Dell Inspiron 17-5770-0357 (Toshiba Exceria Pro SDXC 64 GB UHS-II) | |
| Networking | |
| iperf3 transmit AX12 | |
| Average of class Multimedia (285 - 998, n=2, last 2 years) | |
| Lenovo Ideapad 320-17AST-80XW0013GE | |
| Dell Inspiron 17-5770-0357 | |
| HP 17-ca0013ng | |
| HP 17-bs103ng | |
| iperf3 receive AX12 | |
| Average of class Multimedia (1017 - 1675, n=2, last 2 years) | |
| Dell Inspiron 17-5770-0357 | |
| Lenovo Ideapad 320-17AST-80XW0013GE | |
| HP 17-ca0013ng | |
| HP 17-bs103ng | |
Display
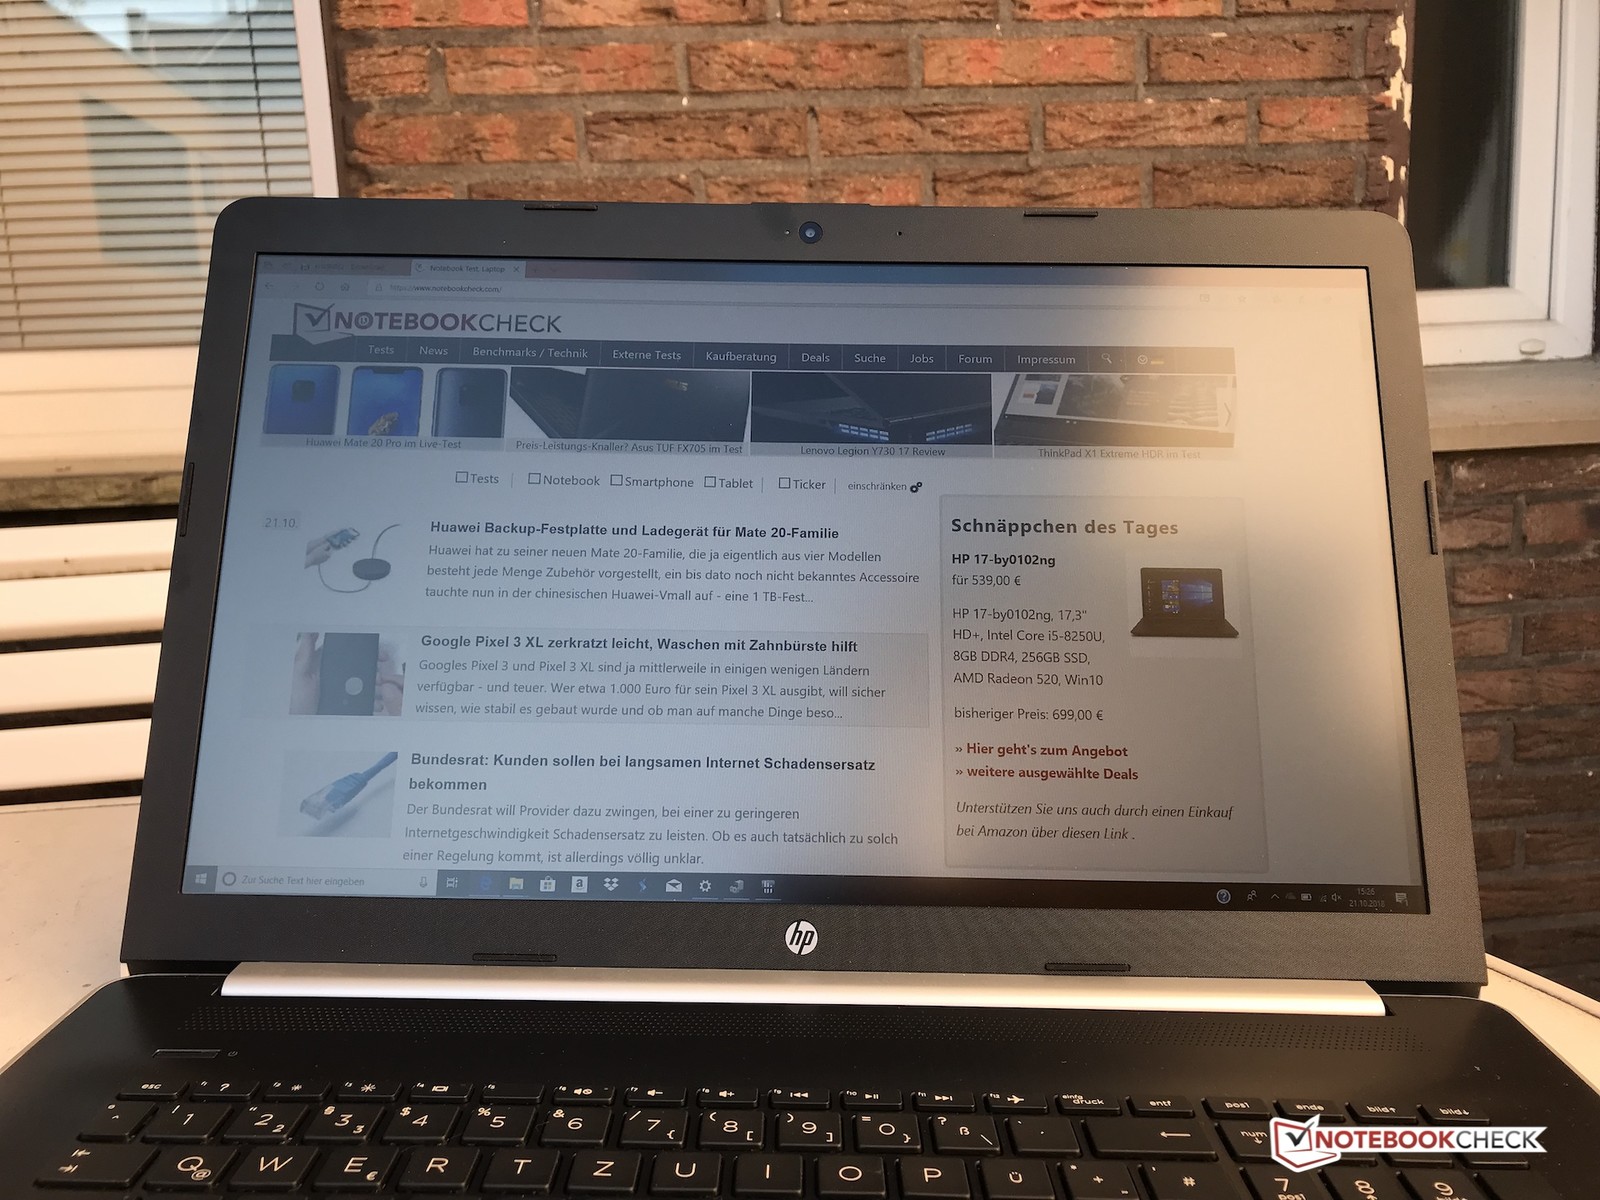
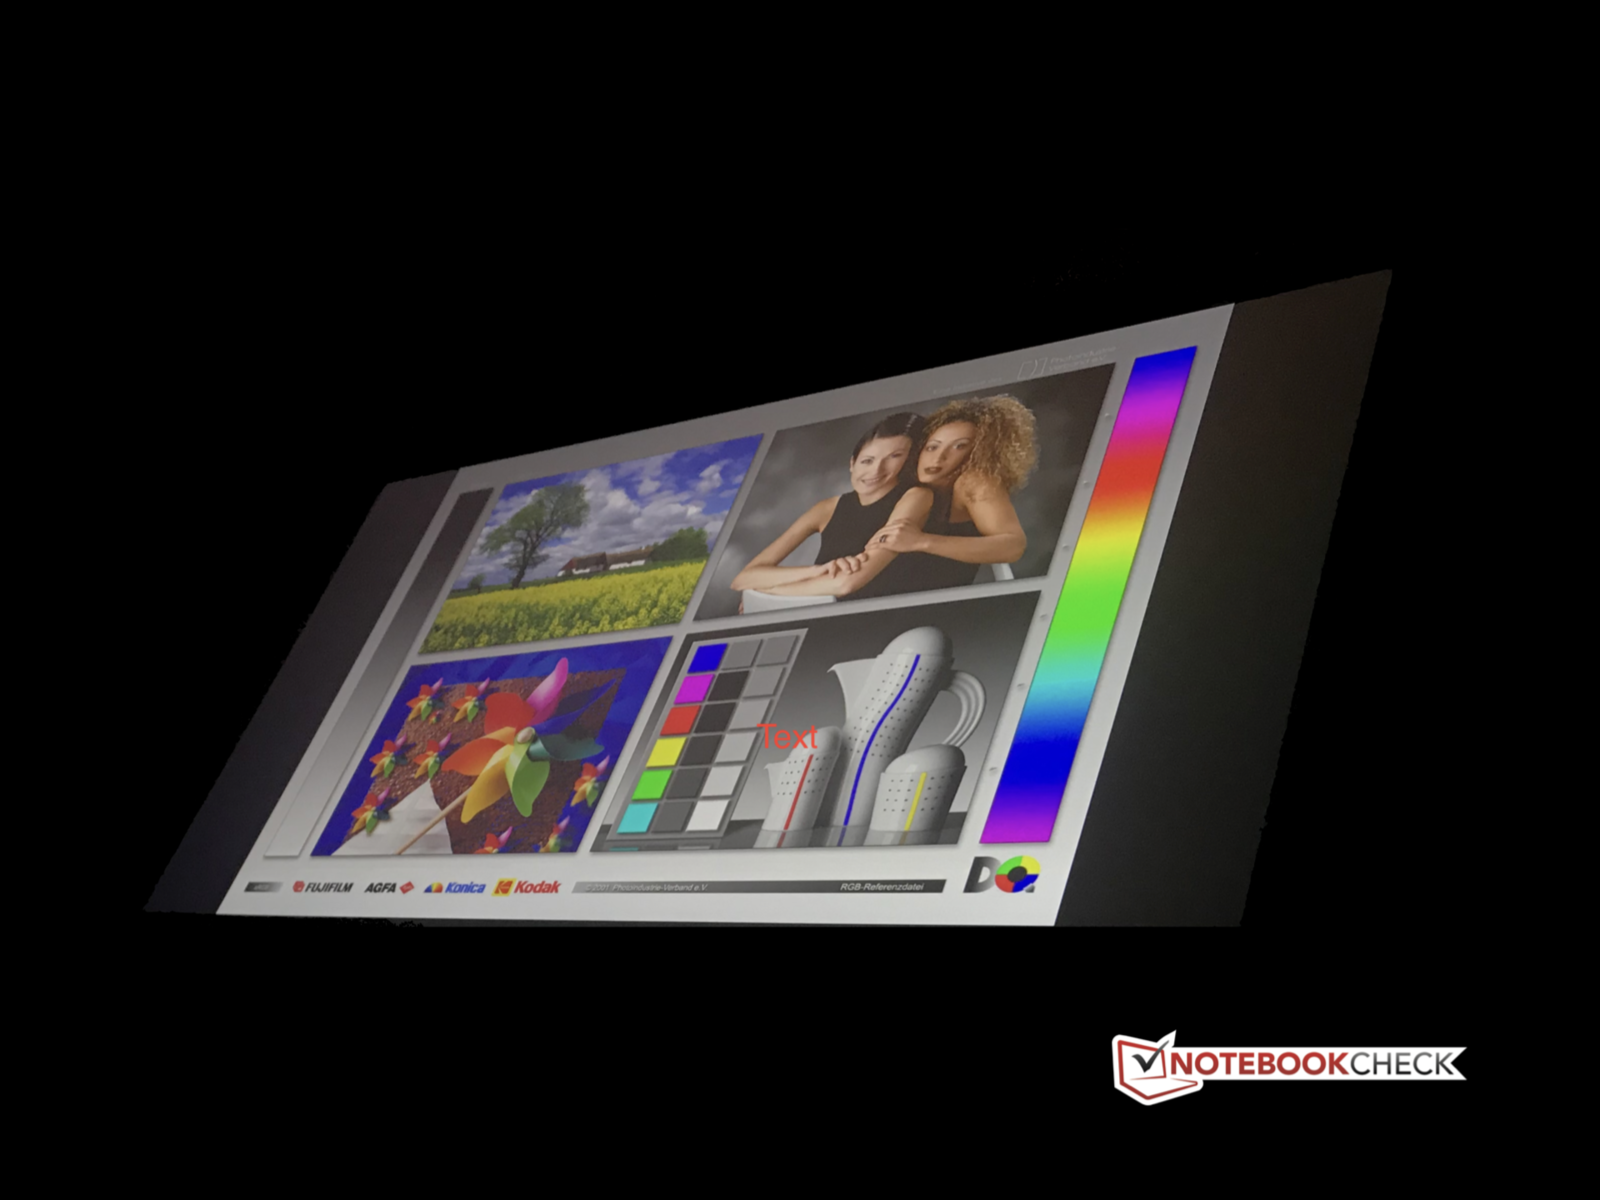
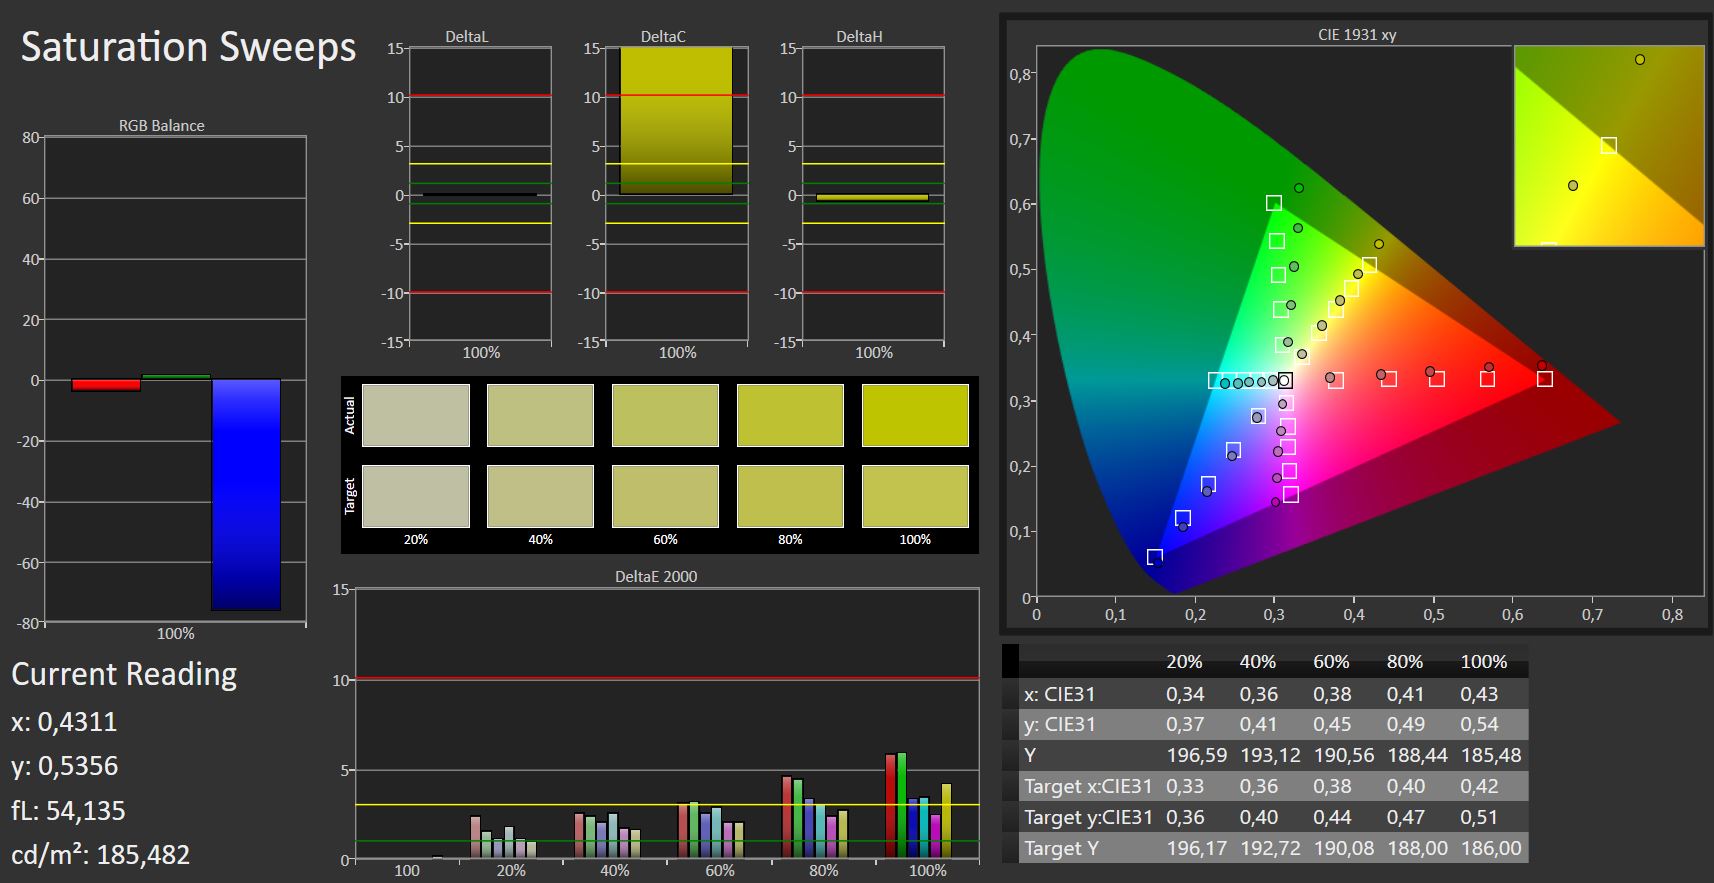
Today’s review unit features an FHD IPS panel with wide viewing angles. Last year’s TN panel turned out to be very dark and very poor overall, and this year’s IPS panel is a massive improvement. Its average brightness of 350 nits means that it can be easily used even in brightly lit environments, and its contrast ratio of 1,100:1 is more than just competitive.

| |||||||||||||||||||||||||
Brightness Distribution: 83 %
Center on Battery: 394 cd/m²
Contrast: 1126:1 (Black: 0.35 cd/m²)
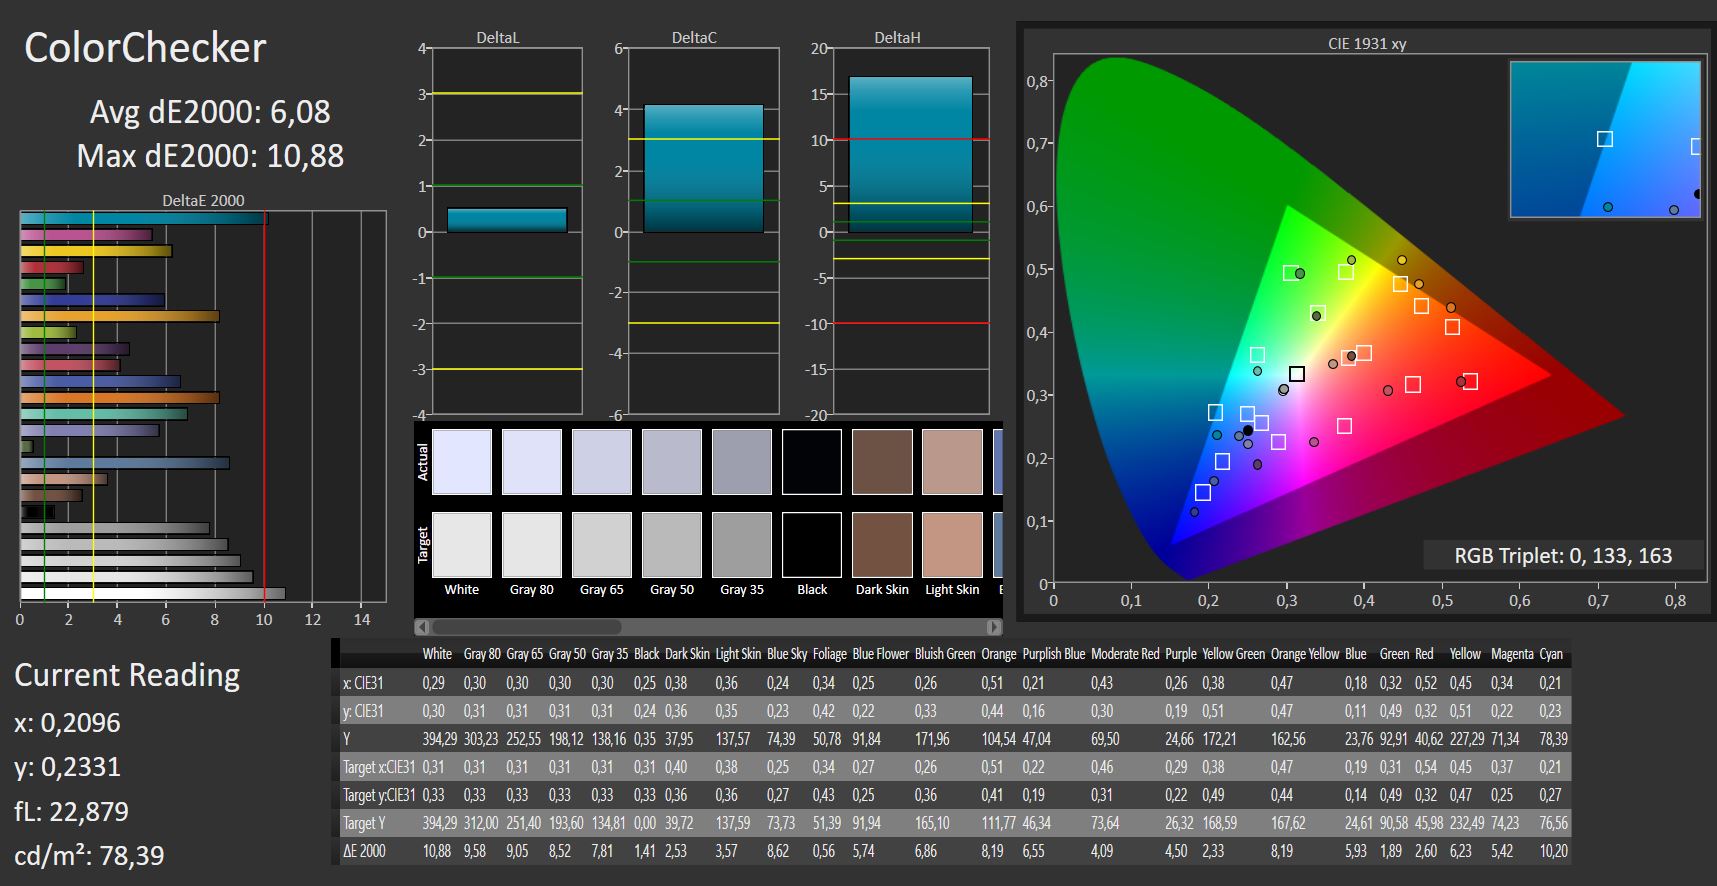
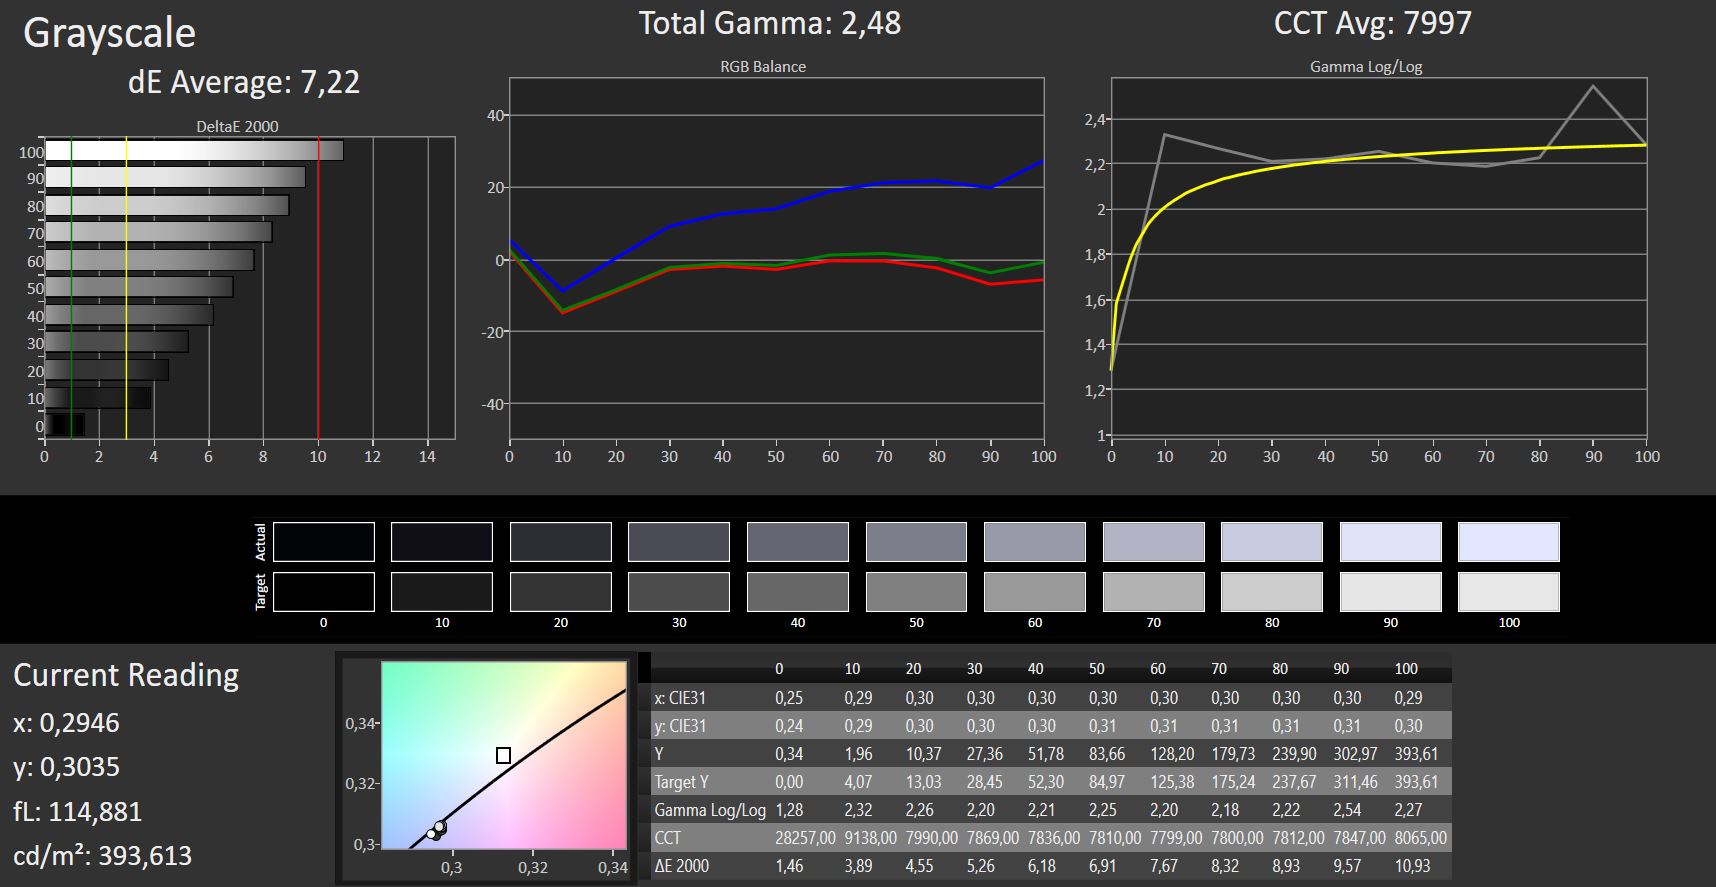
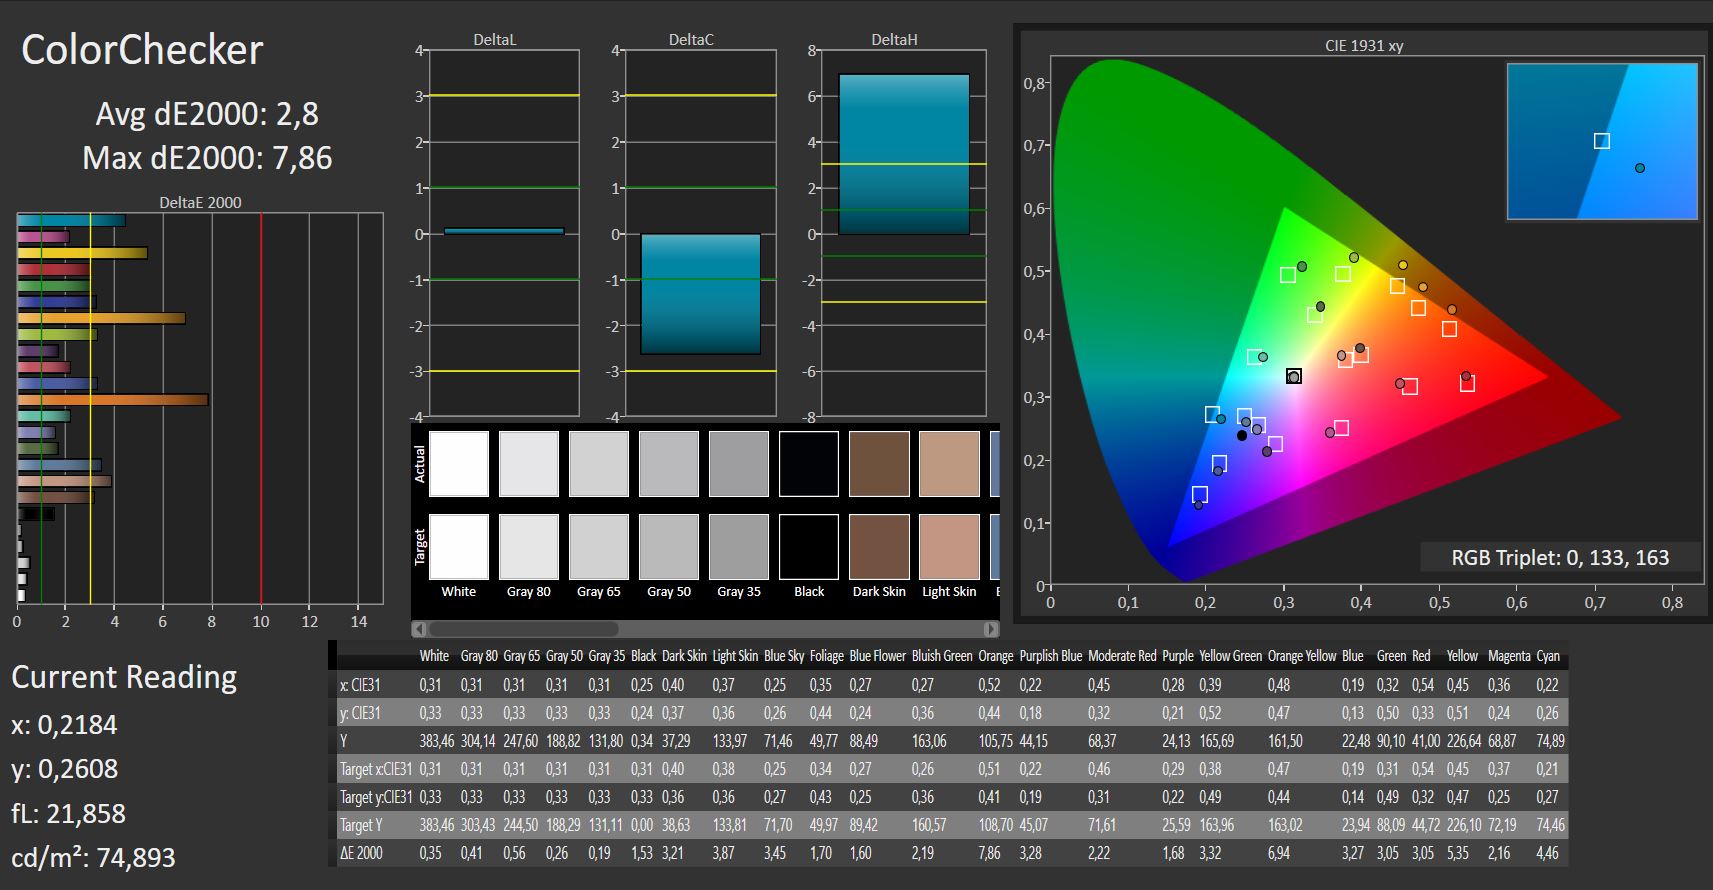
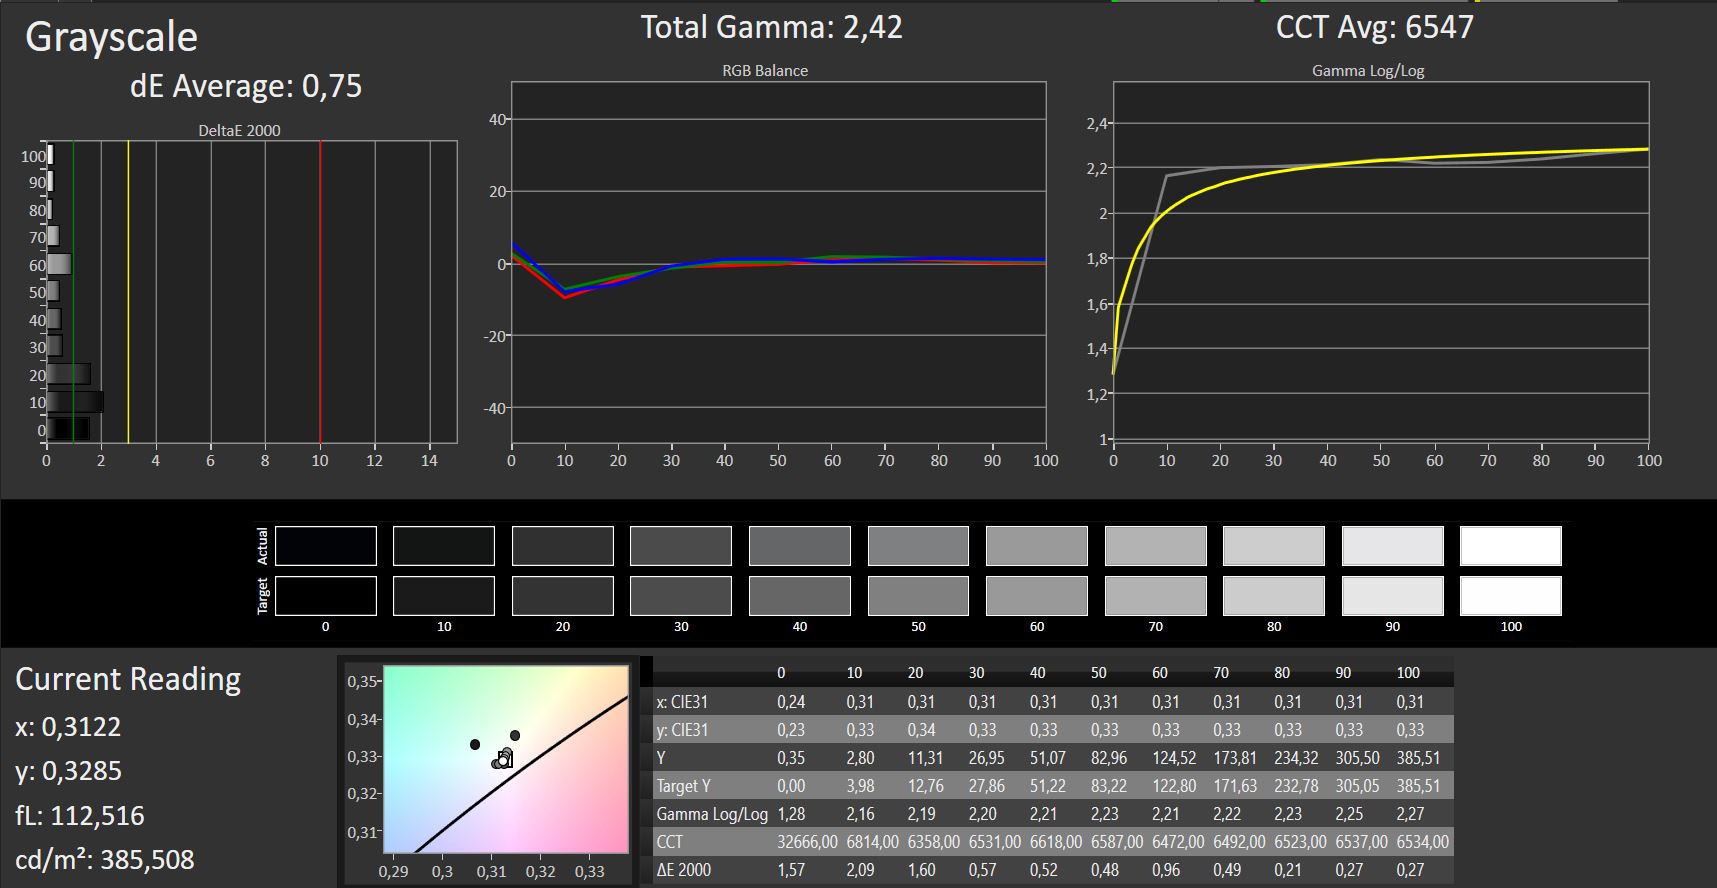
ΔE Color 6.08 | 0.5-29.43 Ø5, calibrated: 2.8
ΔE Greyscale 7.22 | 0.57-98 Ø5.3
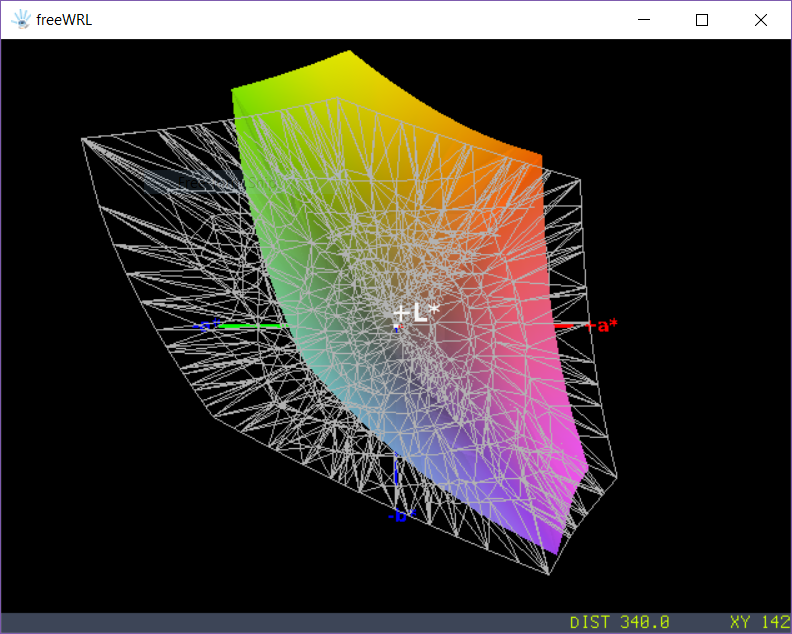
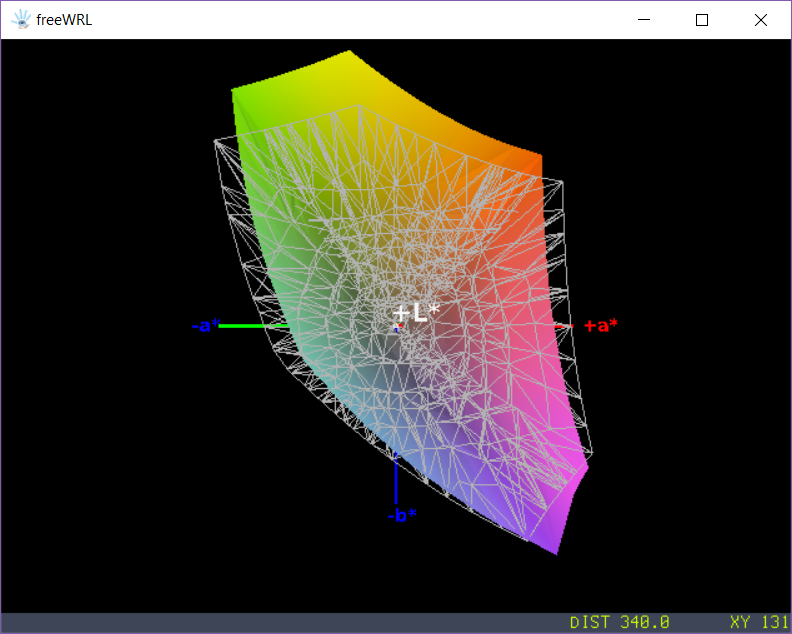
86% sRGB (Argyll 1.6.3 3D)
57% AdobeRGB 1998 (Argyll 1.6.3 3D)
63.2% AdobeRGB 1998 (Argyll 2.2.0 3D)
86.4% sRGB (Argyll 2.2.0 3D)
67% Display P3 (Argyll 2.2.0 3D)
Gamma: 2.48
| HP 17-ca0013ng LG Philips LGD059E, IPS, 1920x1080, 17.30 | HP 17-bs103ng AU Optronics B173RTN02.1, TN LED, 1600x900, 17.30 | Dell Inspiron 17-5770-0357 AUO109D (AU Optronics), IPS, 1920x1080, 17.30 | Lenovo Ideapad 320-17AST-80XW0013GE AU Optronics B173RTN02.1, TN LED, 1600x900, 17.30 | Average of class Multimedia | |
|---|---|---|---|---|---|
| Screen | -39% | 19% | -51% | 25% | |
| Brightness middle | 394 | 234 -41% | 279 -29% | 205 -48% | 414 ? 5% |
| Brightness | 352 | 202 -43% | 262 -26% | 209 -41% | |
| Brightness Distribution | 83 | 74 -11% | 85 2% | 81 -2% | |
| Black Level * | 0.35 | 0.48 -37% | 0.18 49% | 0.55 -57% | 0.1693 ? 52% |
| Contrast | 1126 | 488 -57% | 1550 38% | 373 -67% | |
| Colorchecker dE 2000 * | 6.08 | 10.28 -69% | 3.58 41% | 11.26 -85% | 2.53 ? 58% |
| Colorchecker dE 2000 max. * | 10.88 | 18.5 -70% | 5.98 45% | 19.86 -83% | 5.34 ? 51% |
| Colorchecker dE 2000 calibrated * | 2.8 | 1.593 ? 43% | |||
| Greyscale dE 2000 * | 7.22 | 12.78 -77% | 2.75 62% | 13.85 -92% | 2.93 ? 59% |
| Gamma | 2.48 89% | 2.5 88% | 2.57 86% | 2.48 89% | 2.25 98% ? |
| CCT | 7997 81% | 13604 48% | 6836 95% | 15307 42% | 6676 97% ? |
| Color Space (Percent of AdobeRGB 1998) | 57 | 59 4% | 58 2% | 47 -18% | 2.43 ? -96% |
| Color Space (Percent of sRGB) | 86 | 92 7% | 88 2% | 73 -15% |
* ... smaller is better
Display Response Times
| ↔ Response Time Black to White | ||
|---|---|---|
| 24 ms ... rise ↗ and fall ↘ combined | ↗ 14 ms rise | 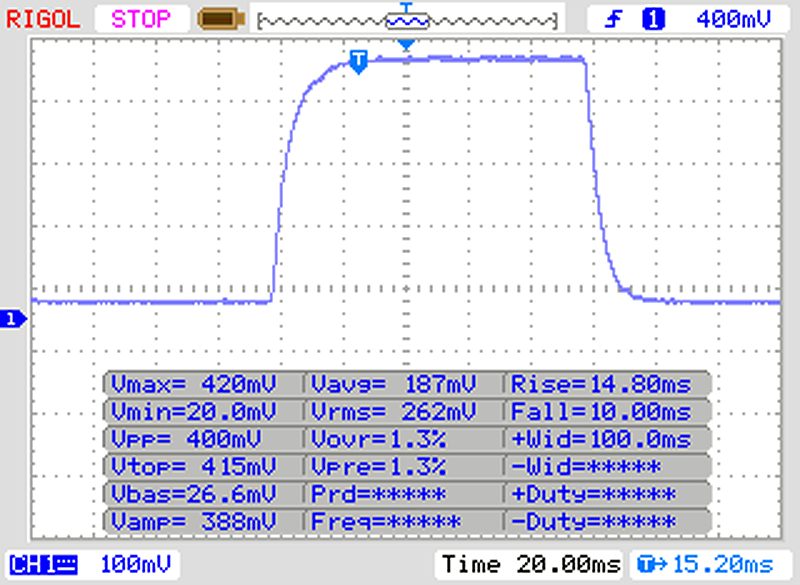 |
| ↘ 10 ms fall | ||
| The screen shows good response rates in our tests, but may be too slow for competitive gamers. In comparison, all tested devices range from 0.1 (minimum) to 240 (maximum) ms. » 48 % of all devices are better. This means that the measured response time is worse than the average of all tested devices (21.5 ms). | ||
| ↔ Response Time 50% Grey to 80% Grey | ||
| 33 ms ... rise ↗ and fall ↘ combined | ↗ 16 ms rise | 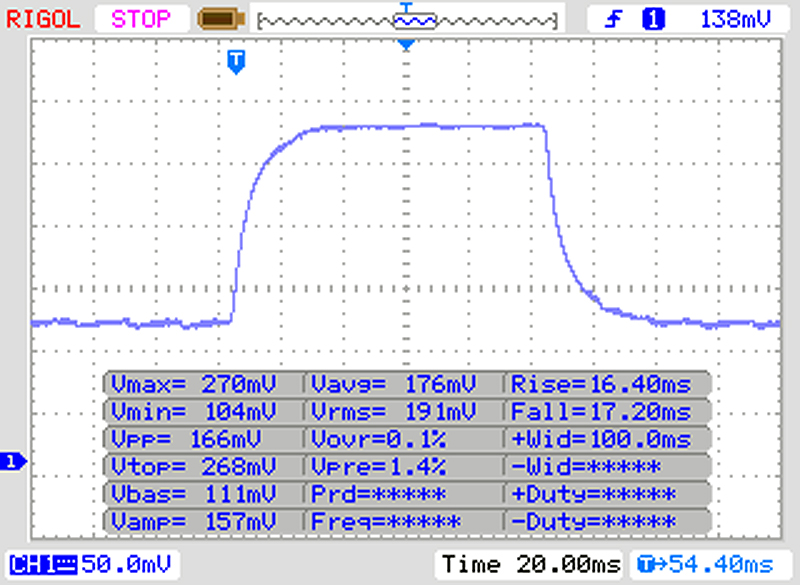 |
| ↘ 17 ms fall | ||
| The screen shows slow response rates in our tests and will be unsatisfactory for gamers. In comparison, all tested devices range from 0.2 (minimum) to 636 (maximum) ms. » 38 % of all devices are better. This means that the measured response time is similar to the average of all tested devices (33.7 ms). | ||
Screen Flickering / PWM (Pulse-Width Modulation)
| Screen flickering / PWM not detected | 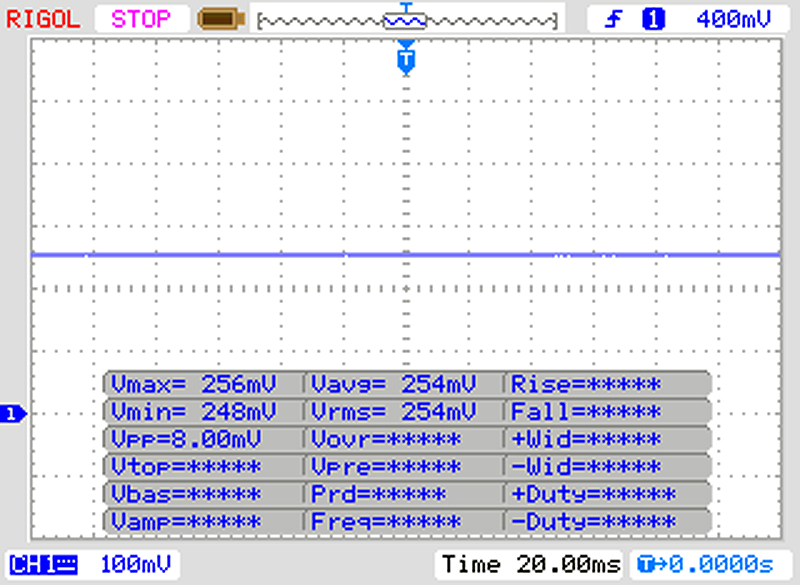 | ||
In comparison: 53 % of all tested devices do not use PWM to dim the display. If PWM was detected, an average of 17900 (minimum: 5 - maximum: 3846000) Hz was measured. | |||
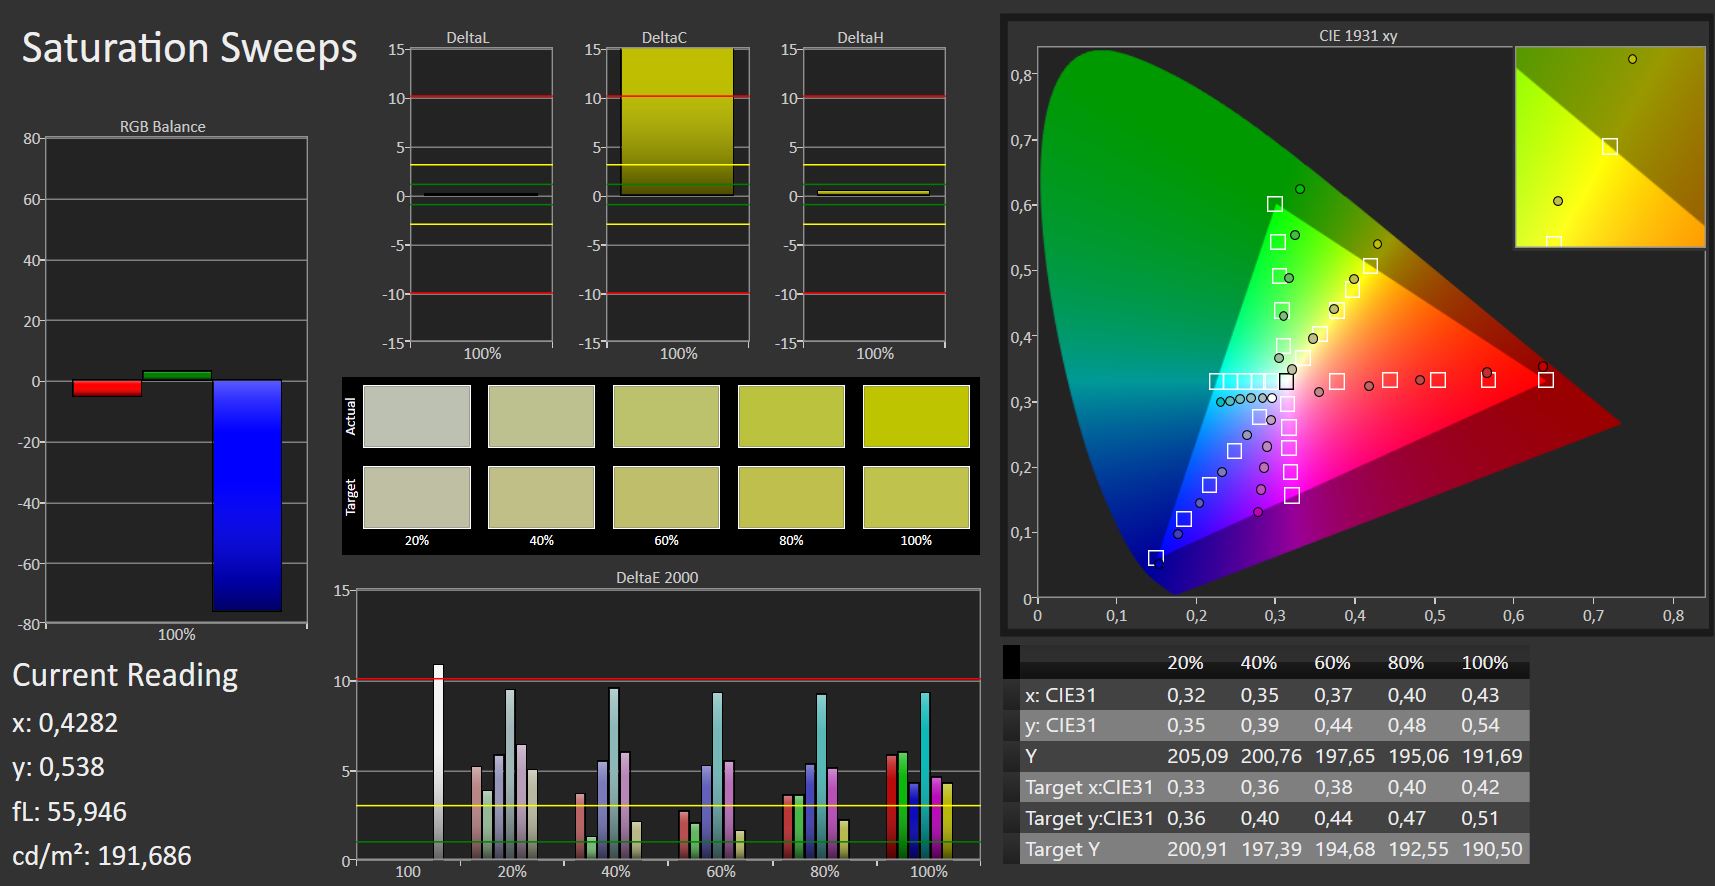
Out of the box, grayscale and color deviations were comparatively high for an IPS panel, and we also noticed a slight blue tint. We were able to improve upon DeltaE deviations through calibration.
Performance
HP’s latest 17-inch laptop is a true AMD-only device. At its core, it features a Ryzen quad-core CPU accompanied by a mid-range Vega RX GPU, two 4 GB DDR4 memory modules in dual-channel mode, and a combined SSD/HDD storage solution. The system is aimed primarily at multimedia users with occasional gaming ambitions. At the time of writing our review unit sold for 700 Euros (~$794).
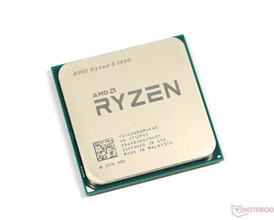
Processor
Four cores running at clock speeds of between 2 and 3.6 GHz should be a worthy replacement for Intel’s Core i5-8250U that last year’s model was equipped with. At least on paper AMD's Ryzen 5 2500U should be more or less on a par with Intel’s Core i5-8250U.
It managed to outperform its Intel competitor in Cinebench R15. However, it scored similarly in our sustained load scenario, and both systems yielded around 510 points.
More information on this and other CPUs can be found in our benchmark charts.
System Performance
System performance is the sum of all components. A fast SSD, a powerful GPU, and a decent CPU should make for a smooth and enjoyable office application and web browsing performance. Accordingly, the HP 17 scored almost 3,500 points in PCMark 8.
| PCMark 8 Home Score Accelerated v2 | 3449 points | |
Help | ||
Storage Devices
The HP 17 features two storage devices. A 256 GB large PCIe SSD with read speeds of up to 1,000 MB/s and write speeds of up to 800 MB/s, and a conventional 1 TB large HDD for additional storage. The operating system is installed on the SSD resulting in snappy and quasi instantaneous handling.
| HP 17-ca0013ng Vega 8, R5 2500U, Toshiba KBG30ZMV256G | HP 17-bs103ng Radeon 530, i5-8250U, Seagate Mobile HDD 1TB ST1000LM035 | Dell Inspiron 17-5770-0357 UHD Graphics 620, i5-8250U, SK hynix SC311 M.2 | Lenovo Ideapad 320-17AST-80XW0013GE Radeon R2 (Stoney Ridge), E2-9000, Seagate Mobile HDD 1TB ST1000LM035 | Average Toshiba KBG30ZMV256G | |
|---|---|---|---|---|---|
| CrystalDiskMark 3.0 | -96% | -43% | -95% | 3% | |
| Read Seq | 1003 | 73 -93% | 481.4 -52% | 98.6 -90% | 947 ? -6% |
| Write Seq | 834 | 80.1 -90% | 170.3 -80% | 87 -90% | 728 ? -13% |
| Read 512 | 569 | 29.93 -95% | 349.1 -39% | 30.3 -95% | 680 ? 20% |
| Write 512 | 750 | 72.3 -90% | 139.3 -81% | 92.2 -88% | 607 ? -19% |
| Read 4k | 40.66 | 0.399 -99% | 27.33 -33% | 0.448 -99% | 42.9 ? 6% |
| Write 4k | 82.3 | 0.502 -99% | 76.4 -7% | 0.316 -100% | 90.2 ? 10% |
| Read 4k QD32 | 266 | 0.707 -100% | 170.1 -36% | 1.088 -100% | 291 ? 9% |
| Write 4k QD32 | 169.9 | 0.704 -100% | 144.9 -15% | 0.154 -100% | 204 ? 20% |

GPU Performance
All things graphics are handled by the integrated AMD Radeon RX Vega 8 GPU. This mid-range GPU has replaced last year’s Radeon 530, which it managed to outperform by more than 50 % in 3DMark 11.
Gaming is certainly possible with the Vega 8, although more demanding modern games might require a reduced resolution and/or reduced details.
More information and additional benchmarks can be found in our benchmark charts.
GPU Performance
| 3DMark 11 Performance | 3628 points | |
Help | ||
Gaming Performance
Older games, such as “BioShock Infinite” or “Rise of the Tomb Raider”, ran very smoothly even on medium settings. Please note that our review unit did not allow us to select a resolution of 1366x768. Accordingly, we were not able to run our entire benchmark suite.
| BioShock Infinite | |
| 1280x720 Very Low Preset 1366x768 Medium Preset 1366x768 High Preset 1920x1080 Ultra Preset, DX11 (DDOF) | |
| HP 17-ca0013ng | |
| HP 17-bs103ng | |
| Lenovo IdeaPad 330-15ARR 81D2005CUS | |
| Rise of the Tomb Raider | |
| 1024x768 Lowest Preset 1920x1080 High Preset AA:FX AF:4x | |
| HP 17-ca0013ng | |
Emissions and Energy
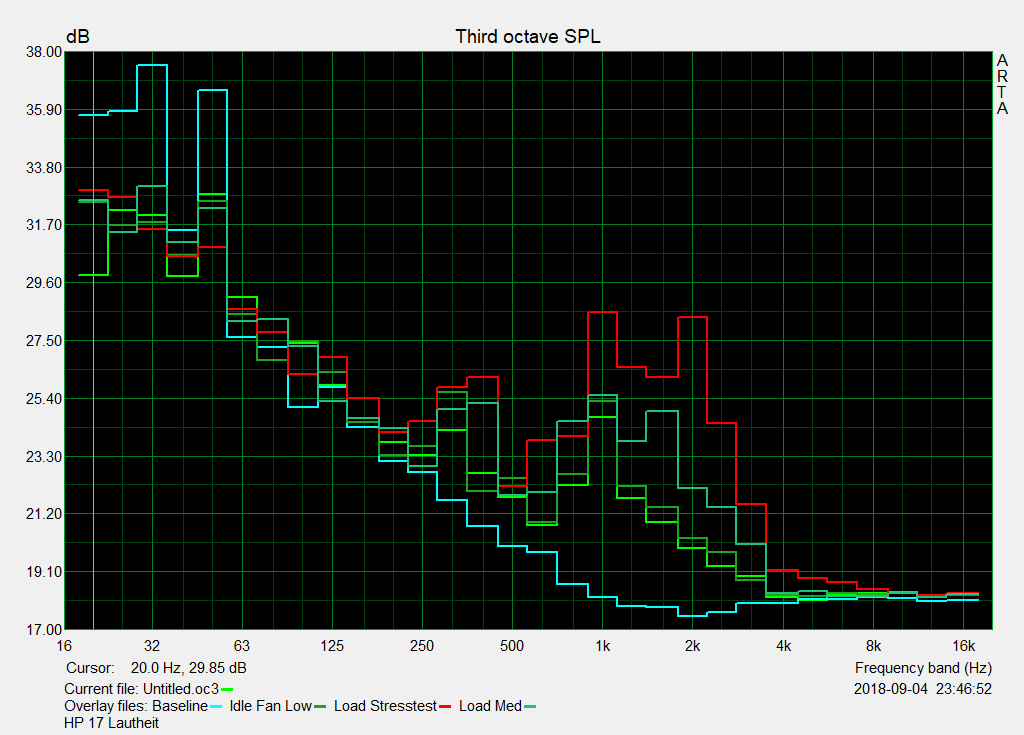
System Noise
Noise Level
| Idle |
| 32.8 / 32.8 / 32.8 dB(A) |
| DVD |
| 36.6 / dB(A) |
| Load |
| 34.2 / 36.4 dB(A) |
 | ||
30 dB silent 40 dB(A) audible 50 dB(A) loud |
||
min: | ||
As with the previous model the single fan was always on, and it still behaved rather squirrelly. Just by launching an application you could already hear the fan speed increase. Fortunately, it remained largely unobtrusive and reached a maximum sound pressure level of just 36 dB(A).
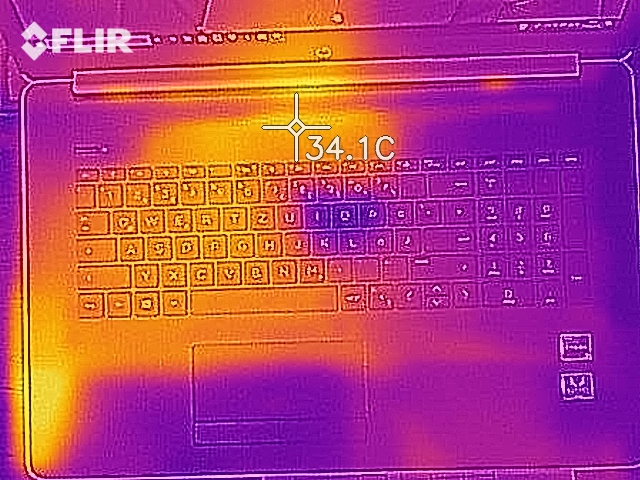
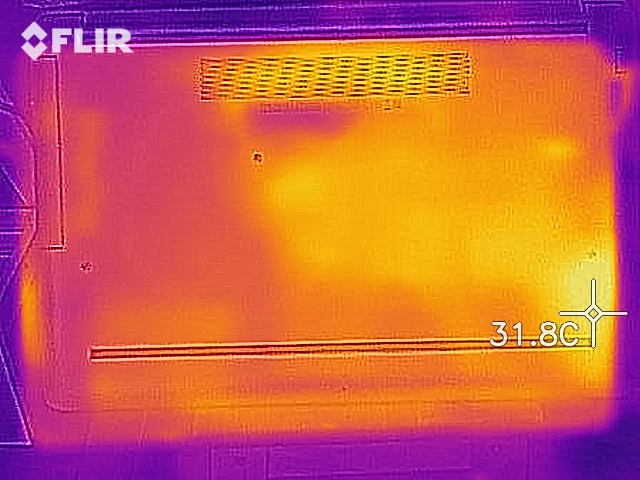
Temperature
(+) The maximum temperature on the upper side is 37 °C / 99 F, compared to the average of 36.9 °C / 98 F, ranging from 21.1 to 71 °C for the class Multimedia.
(+) The bottom heats up to a maximum of 33.8 °C / 93 F, compared to the average of 39.1 °C / 102 F
(+) In idle usage, the average temperature for the upper side is 25.4 °C / 78 F, compared to the device average of 31.2 °C / 88 F.
(+) The palmrests and touchpad are cooler than skin temperature with a maximum of 27.5 °C / 81.5 F and are therefore cool to the touch.
(±) The average temperature of the palmrest area of similar devices was 28.8 °C / 83.8 F (+1.3 °C / 2.3 F).
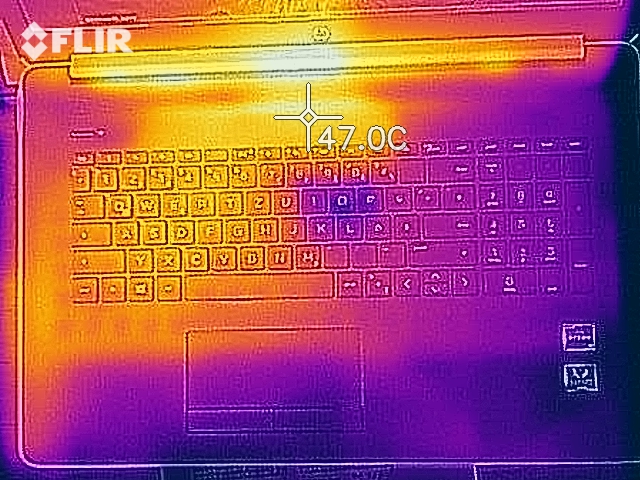
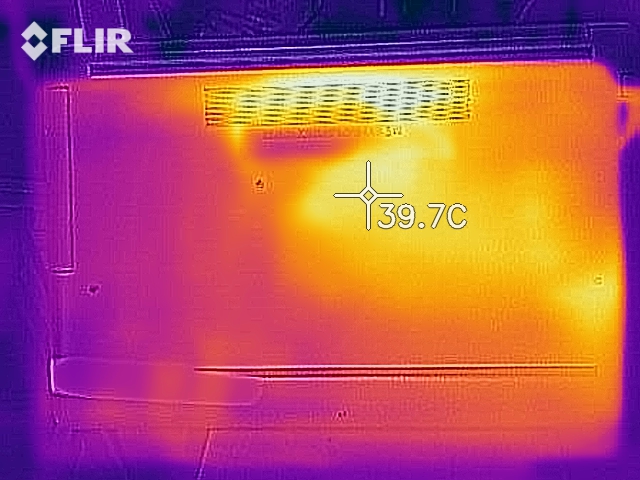
More performance equals higher temperatures, and accordingly our review unit’s keyboard surface heated up to a maximum of 37 °C (~99 °F) under load.
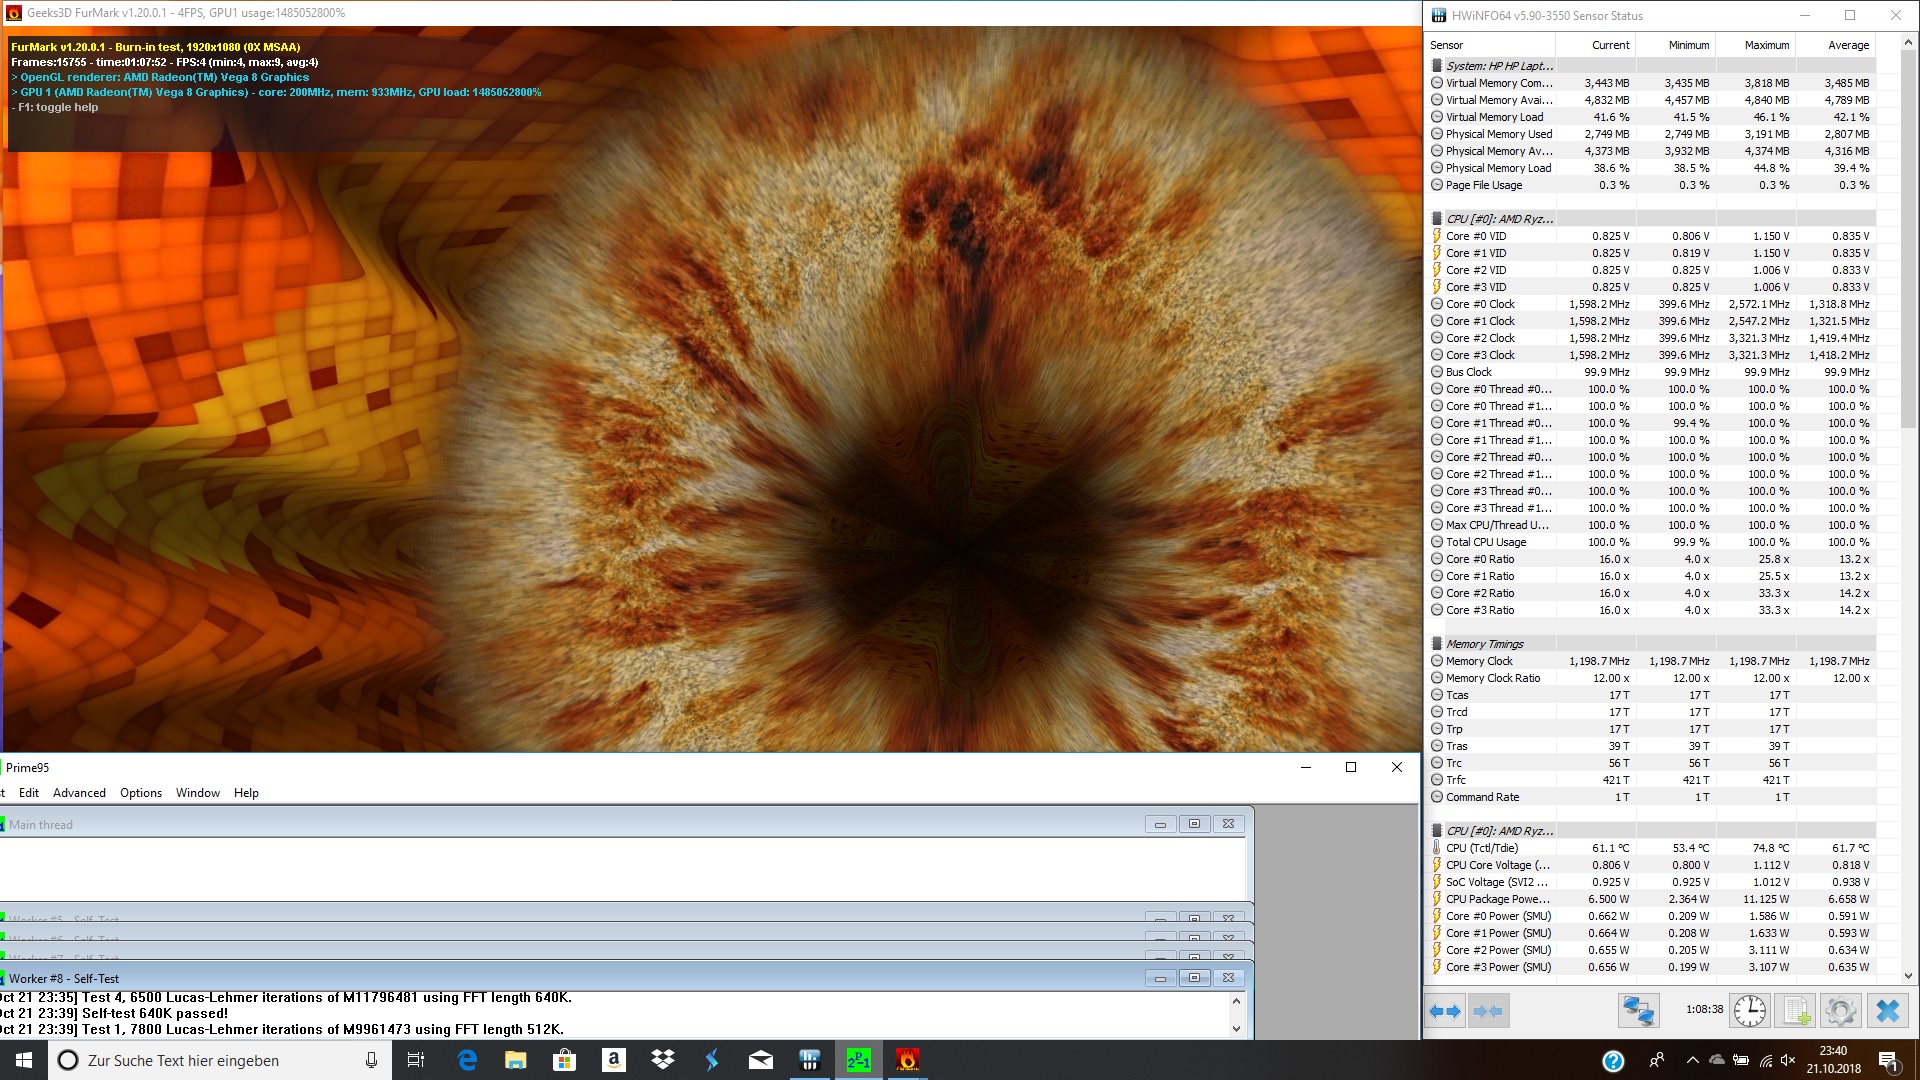
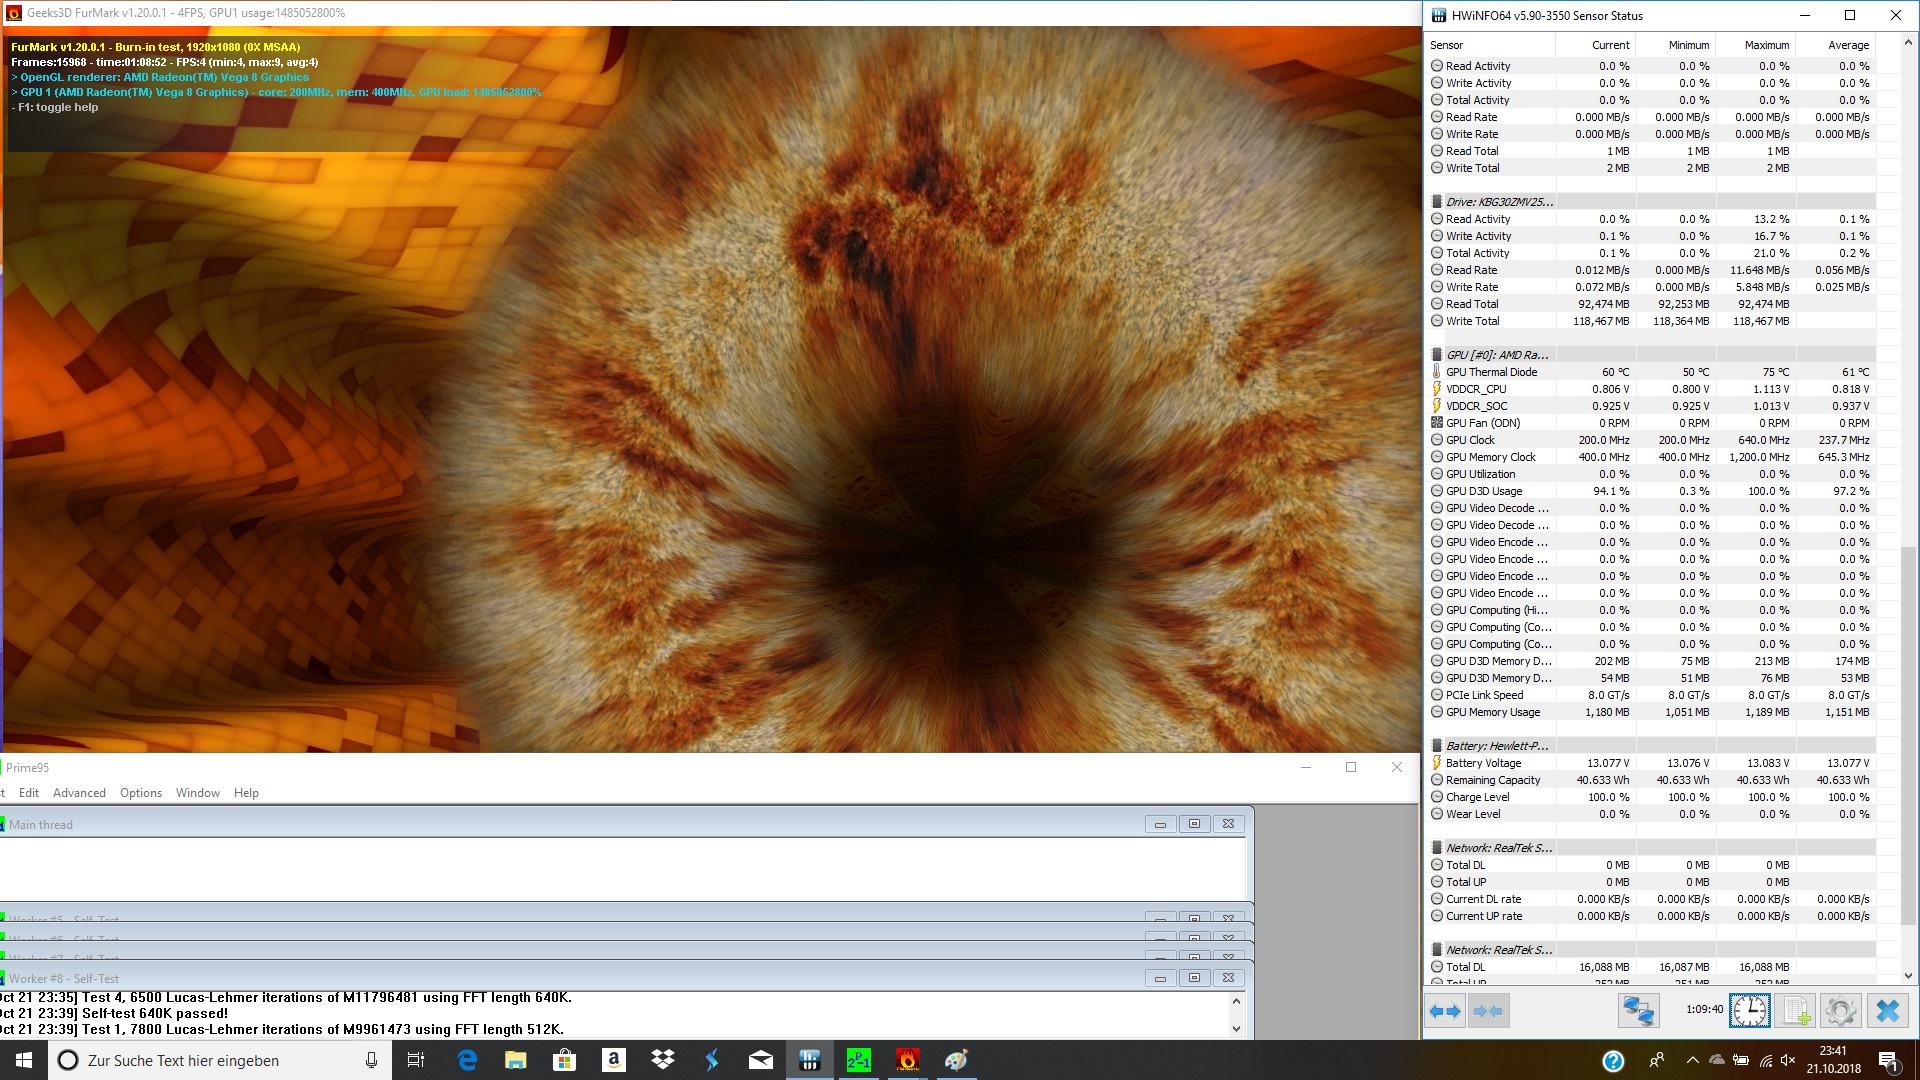
While surface temperatures were comparatively low, overall internal temperatures were much higher. When running Prime95, the CPU started to throttle pretty much immediately and occasionally reduced its clock speed to just 400 MHz. On average, clock speeds settled at between 1.3 and 1.4 GHz after a full hour. We were surprised by the fact that a 17-inch notebook was incapable of dissipating the heat appropriately.
Running our benchmarks immediately following the stress test yielded scores of around 10% less than before. The fans slowed down almost instantly, but 3DMark 11 failed to match its previous scores.
Speaker
HP 17-ca0013ng audio analysis
(±) | speaker loudness is average but good (74.3 dB)
Bass 100 - 315 Hz
(-) | nearly no bass - on average 26.8% lower than median
(±) | linearity of bass is average (11.3% delta to prev. frequency)
Mids 400 - 2000 Hz
(+) | balanced mids - only 3.5% away from median
(±) | linearity of mids is average (7.8% delta to prev. frequency)
Highs 2 - 16 kHz
(+) | balanced highs - only 2.8% away from median
(+) | highs are linear (4.9% delta to prev. frequency)
Overall 100 - 16.000 Hz
(±) | linearity of overall sound is average (23.3% difference to median)
Compared to same class
» 80% of all tested devices in this class were better, 6% similar, 15% worse
» The best had a delta of 5%, average was 18%, worst was 45%
Compared to all devices tested
» 65% of all tested devices were better, 6% similar, 29% worse
» The best had a delta of 4%, average was 25%, worst was 134%
HP 17-bs103ng audio analysis
(-) | not very loud speakers (69.5 dB)
Bass 100 - 315 Hz
(-) | nearly no bass - on average 19.8% lower than median
(±) | linearity of bass is average (13.8% delta to prev. frequency)
Mids 400 - 2000 Hz
(+) | balanced mids - only 2.6% away from median
(±) | linearity of mids is average (7.3% delta to prev. frequency)
Highs 2 - 16 kHz
(+) | balanced highs - only 2.3% away from median
(+) | highs are linear (6.6% delta to prev. frequency)
Overall 100 - 16.000 Hz
(±) | linearity of overall sound is average (17.6% difference to median)
Compared to same class
» 23% of all tested devices in this class were better, 6% similar, 71% worse
» The best had a delta of 7%, average was 22%, worst was 53%
Compared to all devices tested
» 29% of all tested devices were better, 8% similar, 63% worse
» The best had a delta of 4%, average was 25%, worst was 134%
Dell Inspiron 17-5770-0357 audio analysis
(-) | not very loud speakers (66.3 dB)
Bass 100 - 315 Hz
(-) | nearly no bass - on average 15.9% lower than median
(+) | bass is linear (5.4% delta to prev. frequency)
Mids 400 - 2000 Hz
(+) | balanced mids - only 3.4% away from median
(+) | mids are linear (6.8% delta to prev. frequency)
Highs 2 - 16 kHz
(+) | balanced highs - only 2.1% away from median
(+) | highs are linear (6.7% delta to prev. frequency)
Overall 100 - 16.000 Hz
(±) | linearity of overall sound is average (16.8% difference to median)
Compared to same class
» 38% of all tested devices in this class were better, 9% similar, 53% worse
» The best had a delta of 5%, average was 18%, worst was 45%
Compared to all devices tested
» 24% of all tested devices were better, 7% similar, 68% worse
» The best had a delta of 4%, average was 25%, worst was 134%
Power Consumption
Not only did our review unit get warmer than its predecessor, its power consumption also increased. When idle, the power meter read a surprisingly high 13.7 W. Under load, this peaked at a maximum of 57 W. Given that the CPU throttled under load, power consumption oscillated wildly between 29 and 57 W.
Power Consumption
| Off / Standby | |
| Idle | |
| Load |
|
Battery Life
Given its more powerful components, its increased power consumption, and its identically dimensioned battery, it came as no surprise to us that battery life suffered as a consequence. The HP 17 lasted for just 3:45 hours in our Wi-Fi test, and was outperformed by its predecessor by a whopping two hours.
| Battery Runtime - WiFi Websurfing | |
| Dell Inspiron 17-5770-0357 | |
| HP 17-bs103ng | |
| Acer Aspire E5-774G-78NA | |
| HP 17-ca0013ng | |
| Lenovo Ideapad 320-17AST-80XW0013GE | |
Pros
Cons
Verdict
Overall, the new HP 17 is a step in the right direction. In most aspects the 17-inch large multimedia notebook has improved upon its predecessor. A USB-C port is still missing, however the slightly improved case left a good impression. We liked the new display in particular - this is the display that last year’s model should have already been equipped with: a panel that fits today’s requirements in terms of brightness and viewing angles. However, it did require calibration with a spectrophotometer, and the resulting ICC profile can be found for download in the box above. CPU and GPU performance have increased significantly, and so did overall system performance and versatility thanks to its fast SSD and large HDD. All this extra oomph comes at a price, and emissions and battery life have suffered accordingly. The CPU throttled under high load and the battery life was very poor.
The HP 17 is a decent multimedia notebook, aimed primarily at users looking for a large and mostly stationary desktop replacement.
Alternatives include the Acer Aspire E5-774G. Further details can also be found in last year's HP 17 review.
HP 17-ca0013ng
-
10/22/2018 v6(old)
Nino Richizzi


Pricecompare

