 Deutsch
 English
 Español
 Français
 Italiano
 Nederlands
 Polski
 Português
 Русский
 Türkçe
 Svenska
 Chinese
 Magyar
Core i7-1260U debut: Dell Latitude 13 9330 2-in-1 convertible review
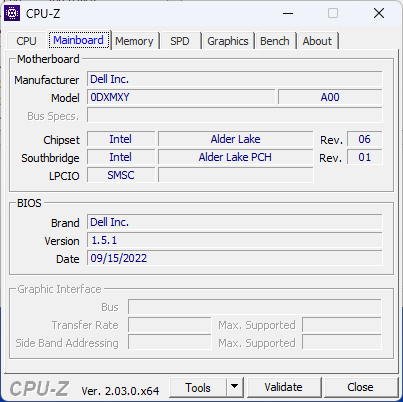
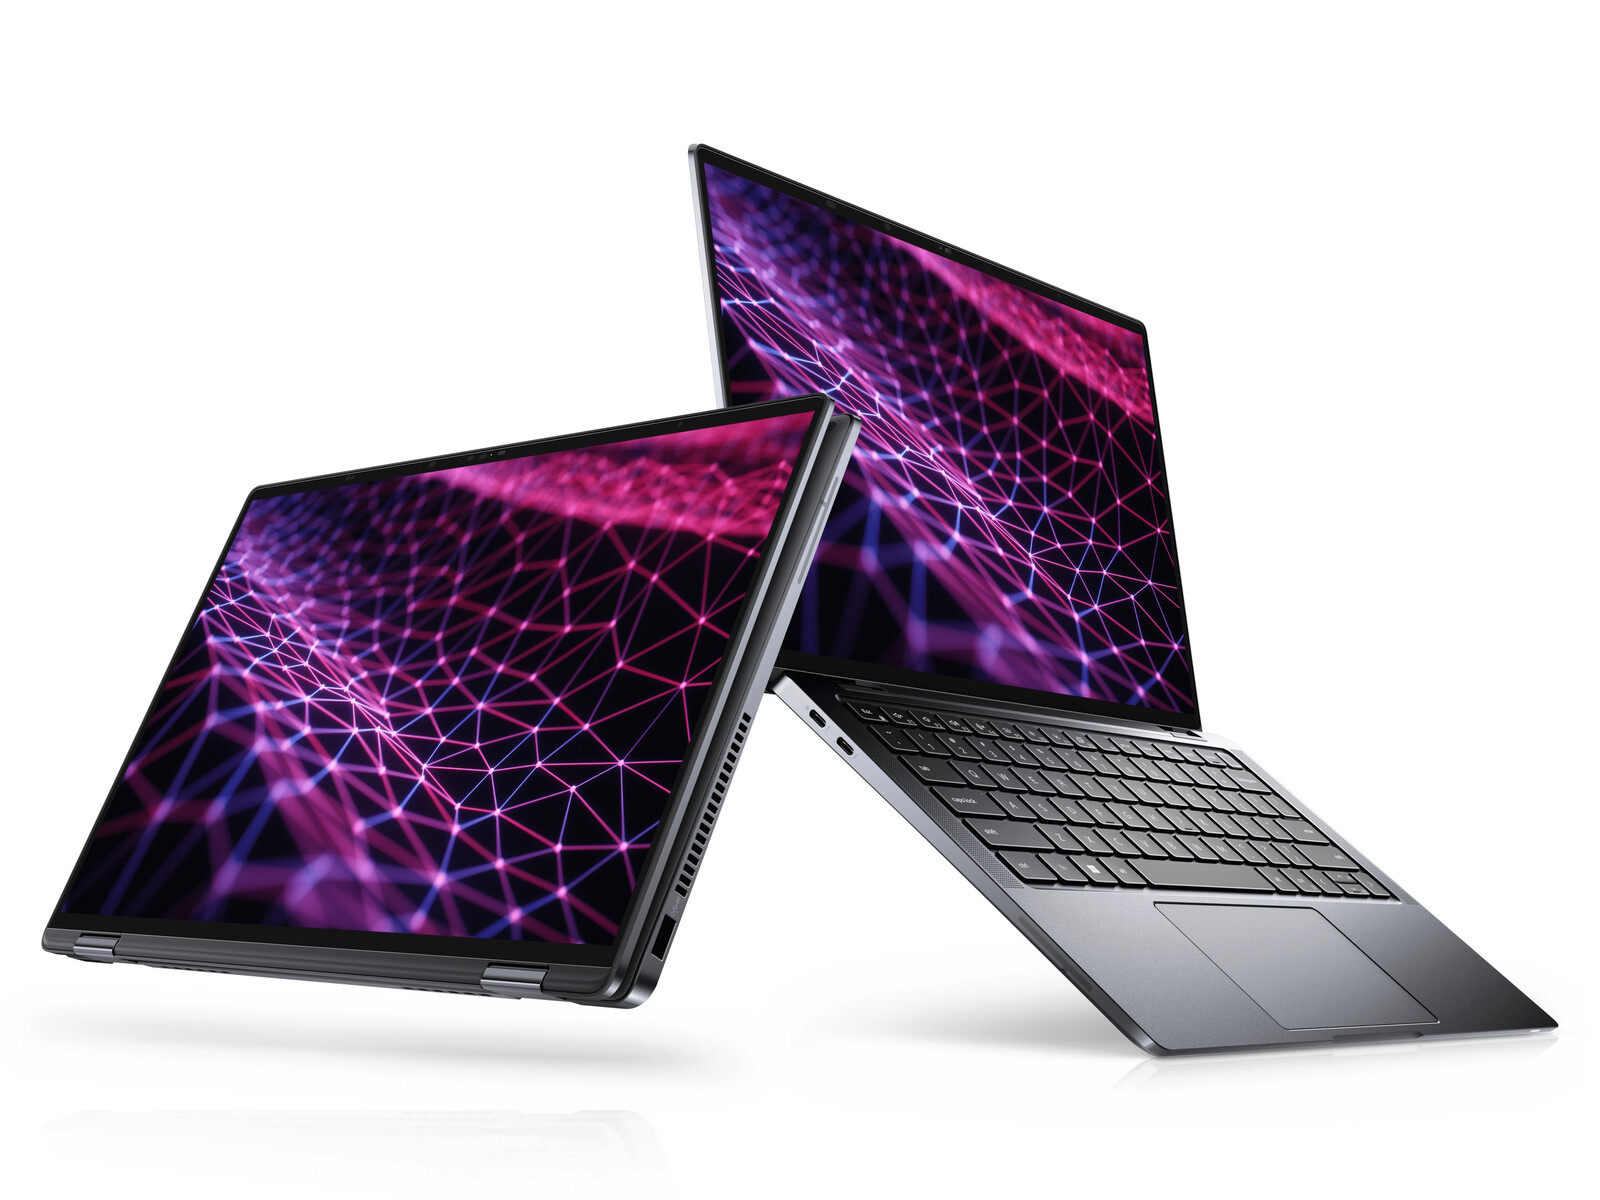
The Latitude 9000 series is home to Dell's flagship business laptops to contrast the upper midrange Latitude 7000 series, midrange Latitude 5000 series, and low-end Latitude 3000 series. Our model in review is the Latitude 9330 which is the first 13.3-inch convertible in the Latitude 9000 family.
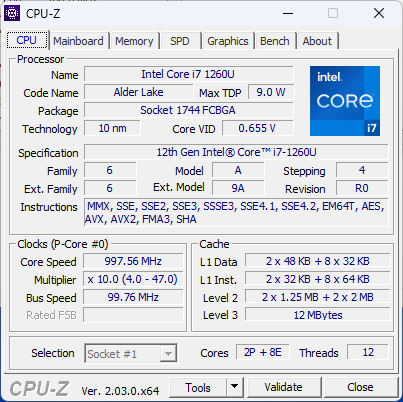
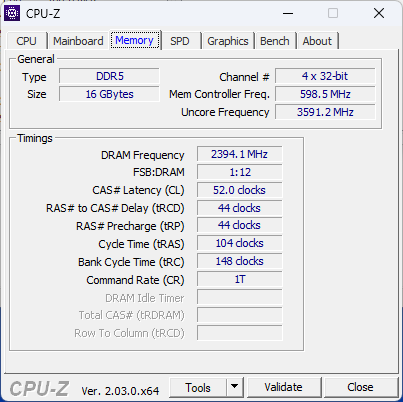
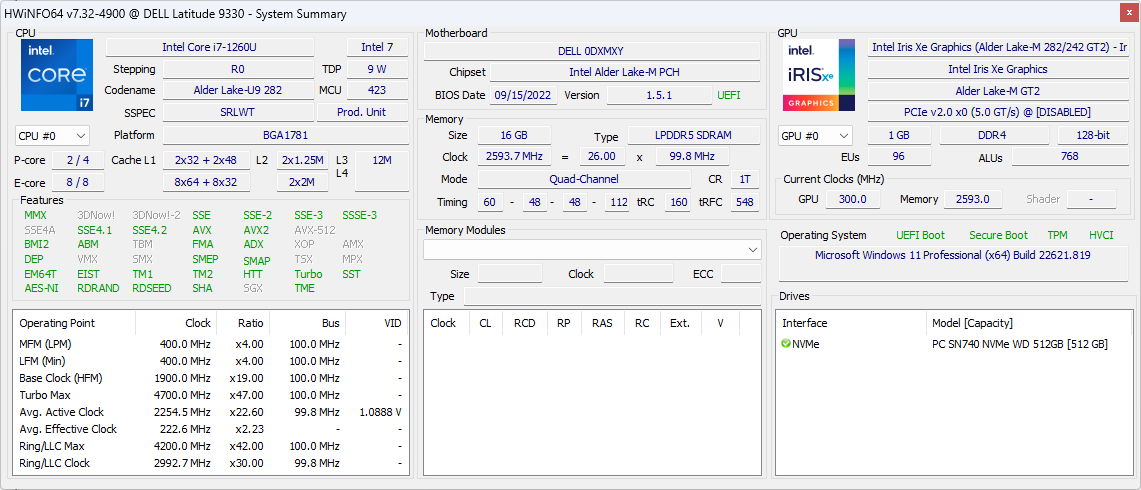
Our specific configuration is the highest-end SKU with the 12th gen Core i7-1260U CPU, 32 GB LPDDR5 RAM, and 512 GB NVMe SSD for approximately $2700 USD. Other SKUs with the slower Core i5-1240U CPU and half the RAM and storage are also available starting at $2000 USD, but all options otherwise come with integrated graphics only and the same 2560 x 1600 resolution IPS touchscreen.
Competitors to the Latitude 9330 include other high-end 13-inch business-centric convertibles like the Lenovo ThinkPad X1 Yoga G1, MSI Summit E13 Flip, or HP Elite Dragonfly Max.
More Dell reviews:
Potential Competitors in Comparison
Rating | Date | Model | Weight | Height | Size | Resolution | Best Price |
|---|---|---|---|---|---|---|---|
| 89 % | 11/2022 | Dell Latitude 9330 i7-1260U, Iris Xe G7 96EUs | 1.2 kg | 14.1 mm | 13.30" | 2560x1600 | |
| 88.5 % | 03/2022 | Lenovo ThinkPad X1 Titanium Yoga G1 20QB0016GE i5-1140G7, Iris Xe G7 80EUs | 1.2 kg | 11.5 mm | 13.50" | 2256x1504 | |
| 86.9 % | 04/2021 | MSI Summit E13 Flip Evo A11MT i7-1185G7, Iris Xe G7 96EUs | 1.4 kg | 14.9 mm | 13.40" | 1920x1200 | |
| 90 % | 11/2020 | HP EliteBook x360 1030 G7 i7-10810U, UHD Graphics 620 | 1.2 kg | 16 mm | 13.30" | 1920x1080 | |
| 90.8 % | 06/2021 | HP Elite Dragonfly Max i7-1185G7, Iris Xe G7 96EUs | 1.2 kg | 16 mm | 13.30" | 1920x1080 | |
| 87.2 % | 12/2020 | Dell Latitude 5310-23VP6 i5-10310U, UHD Graphics 620 | 1.3 kg | 19.7 mm | 13.30" | 1920x1080 |
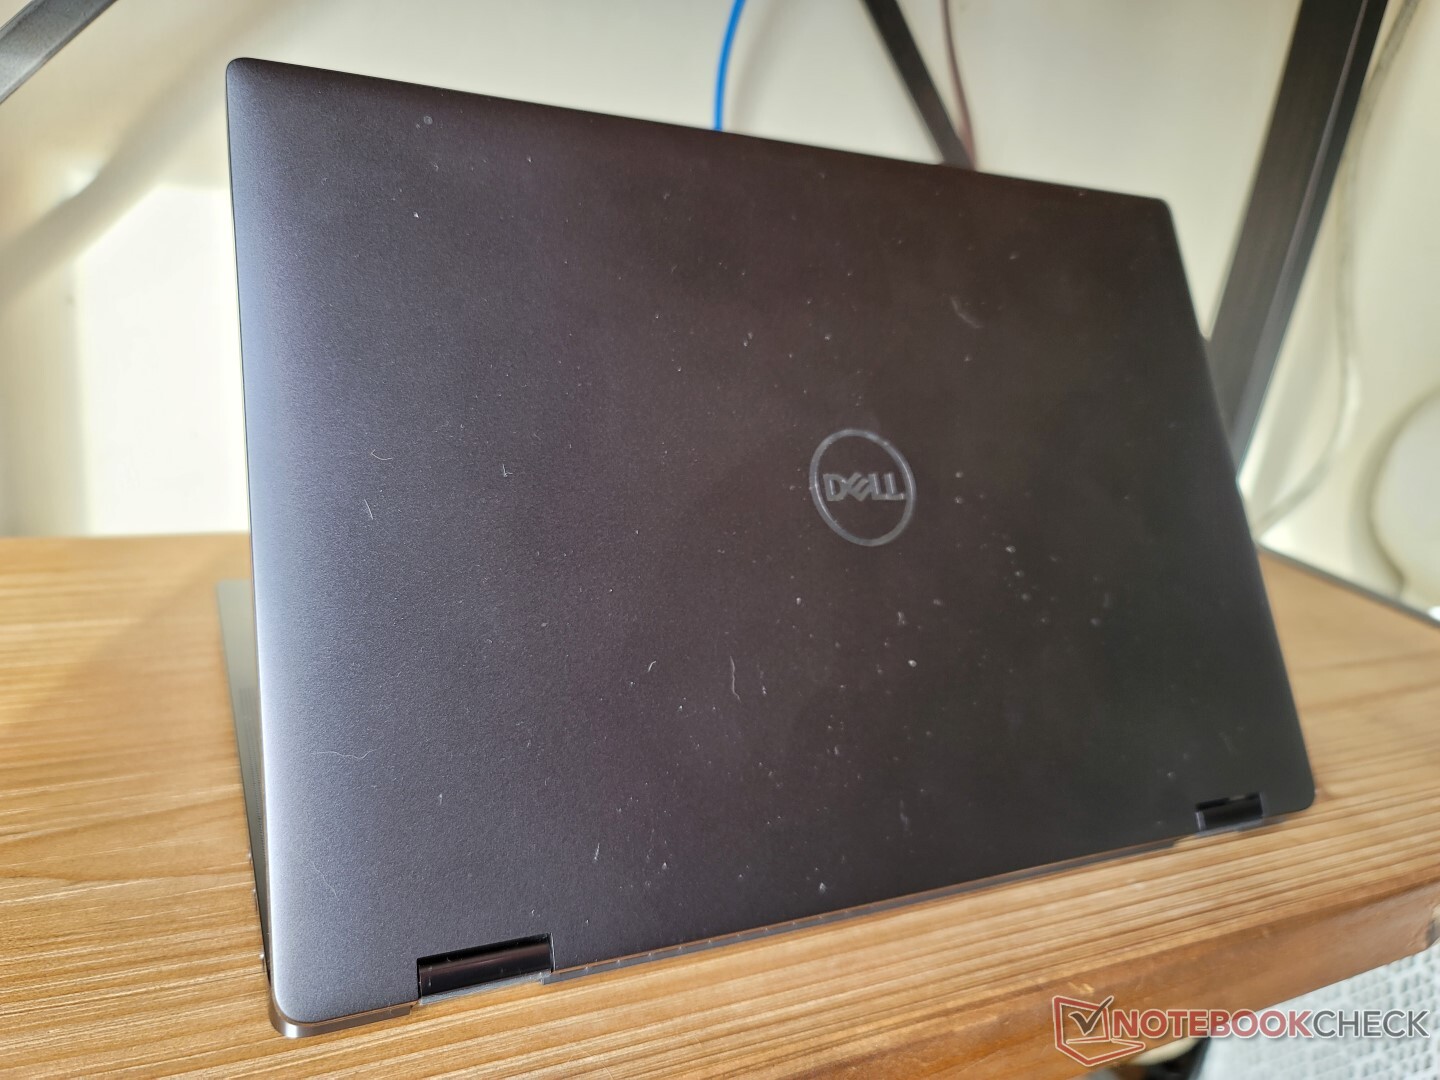
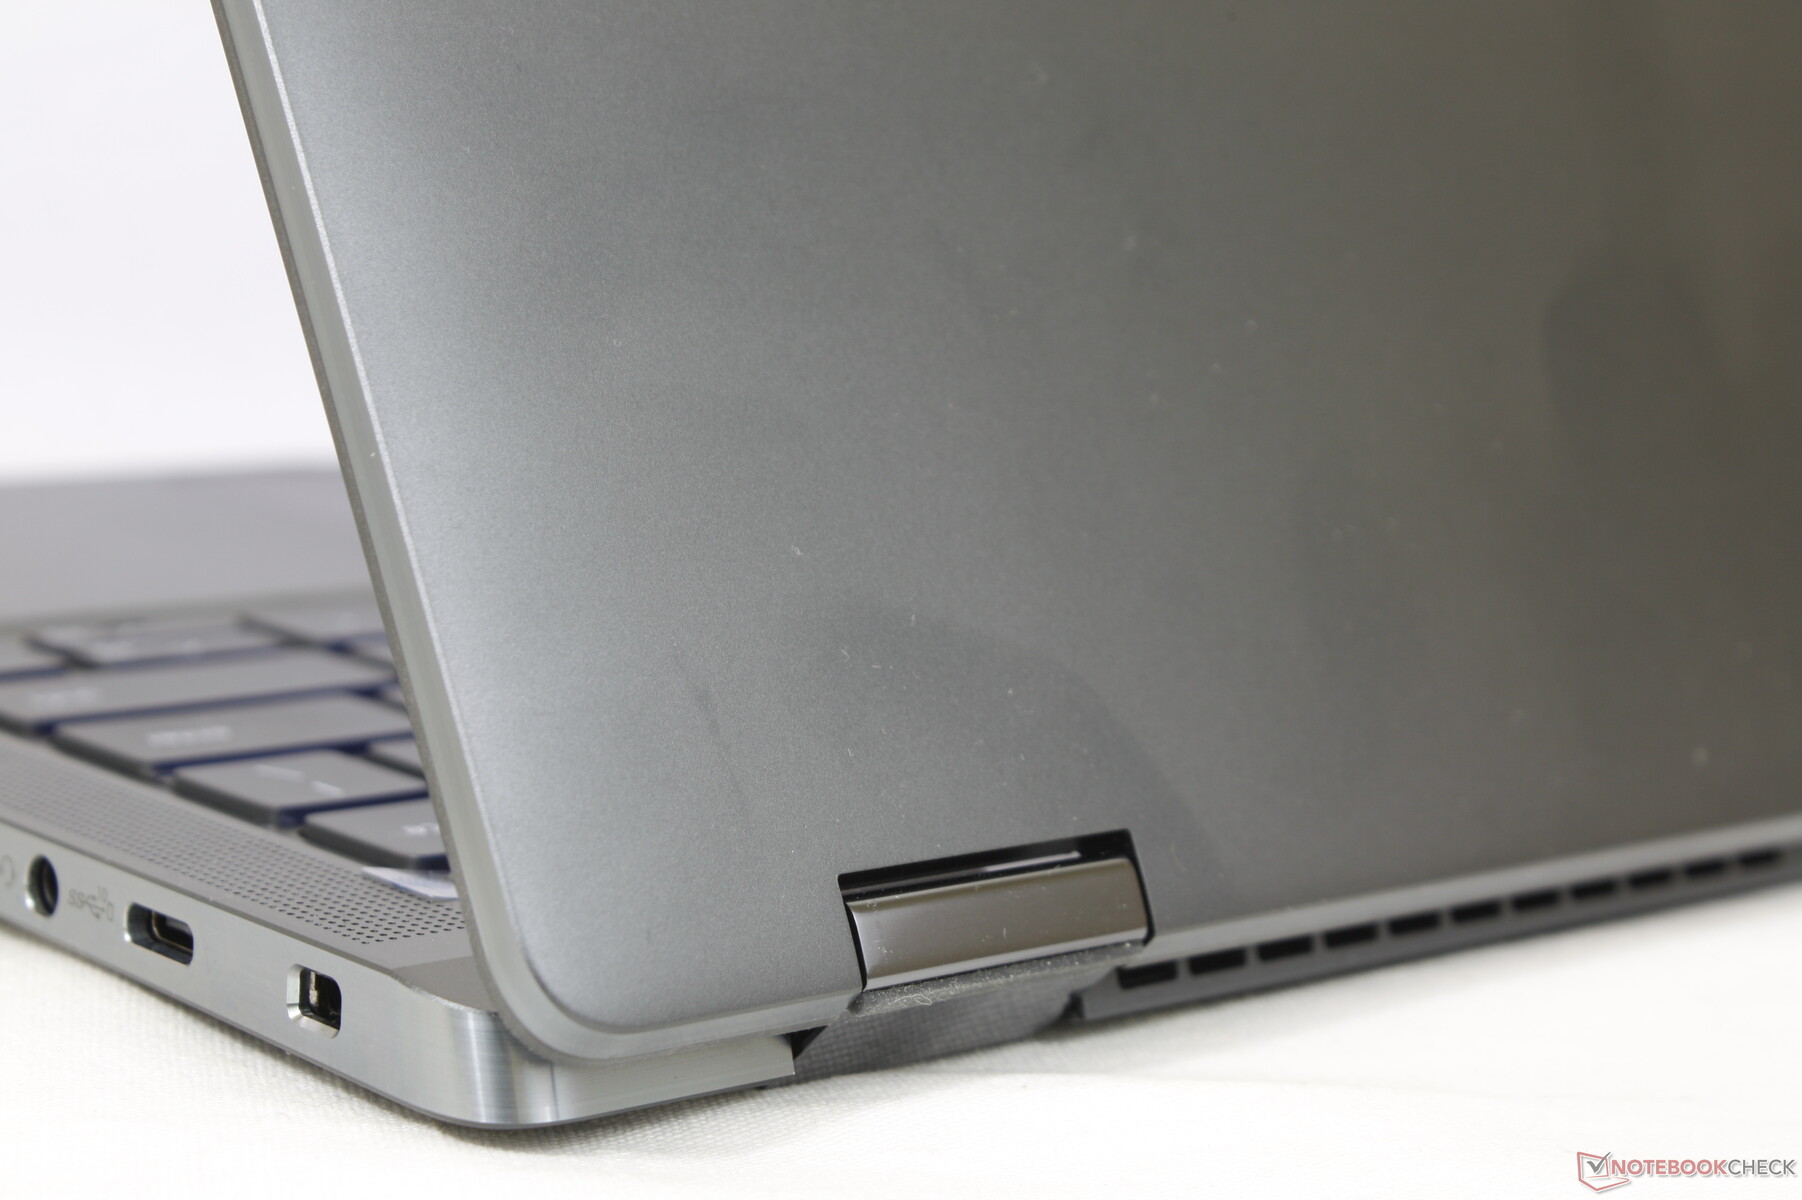
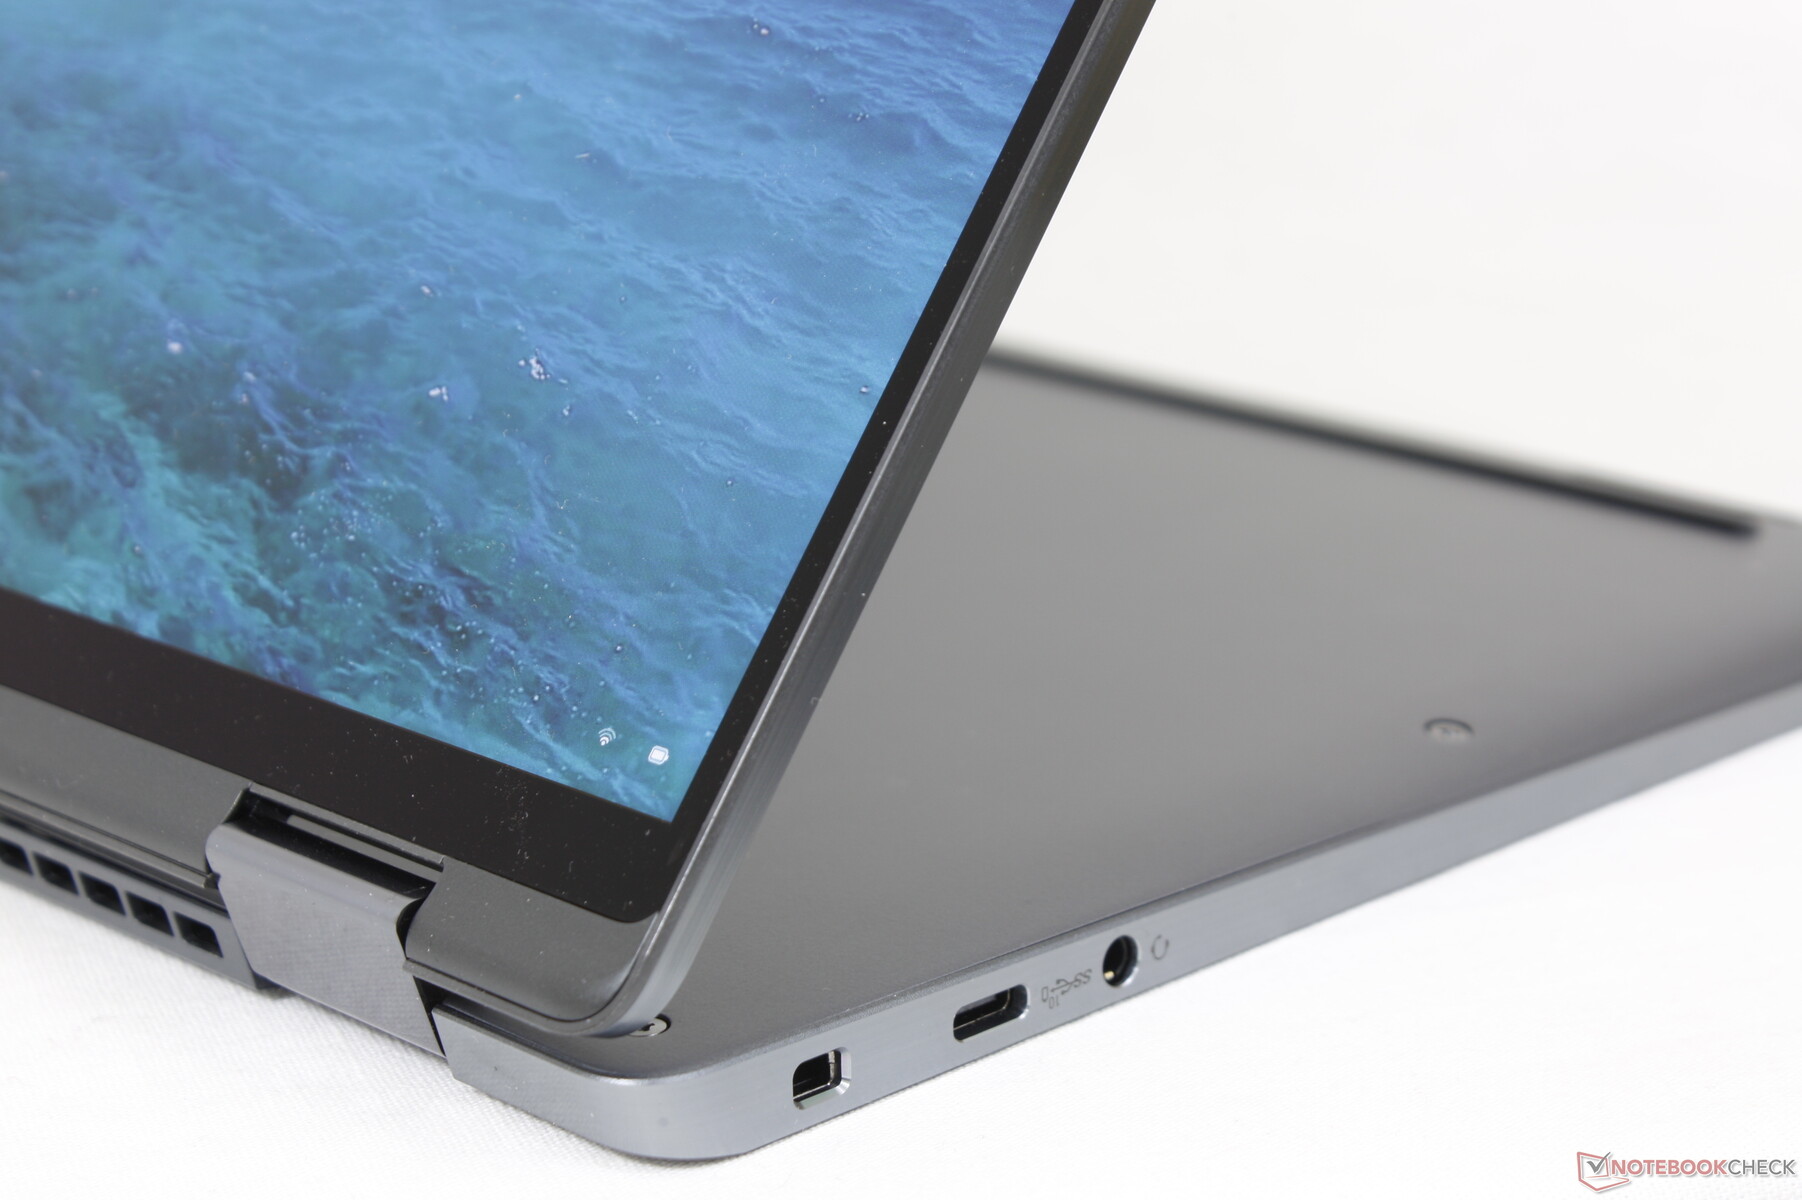
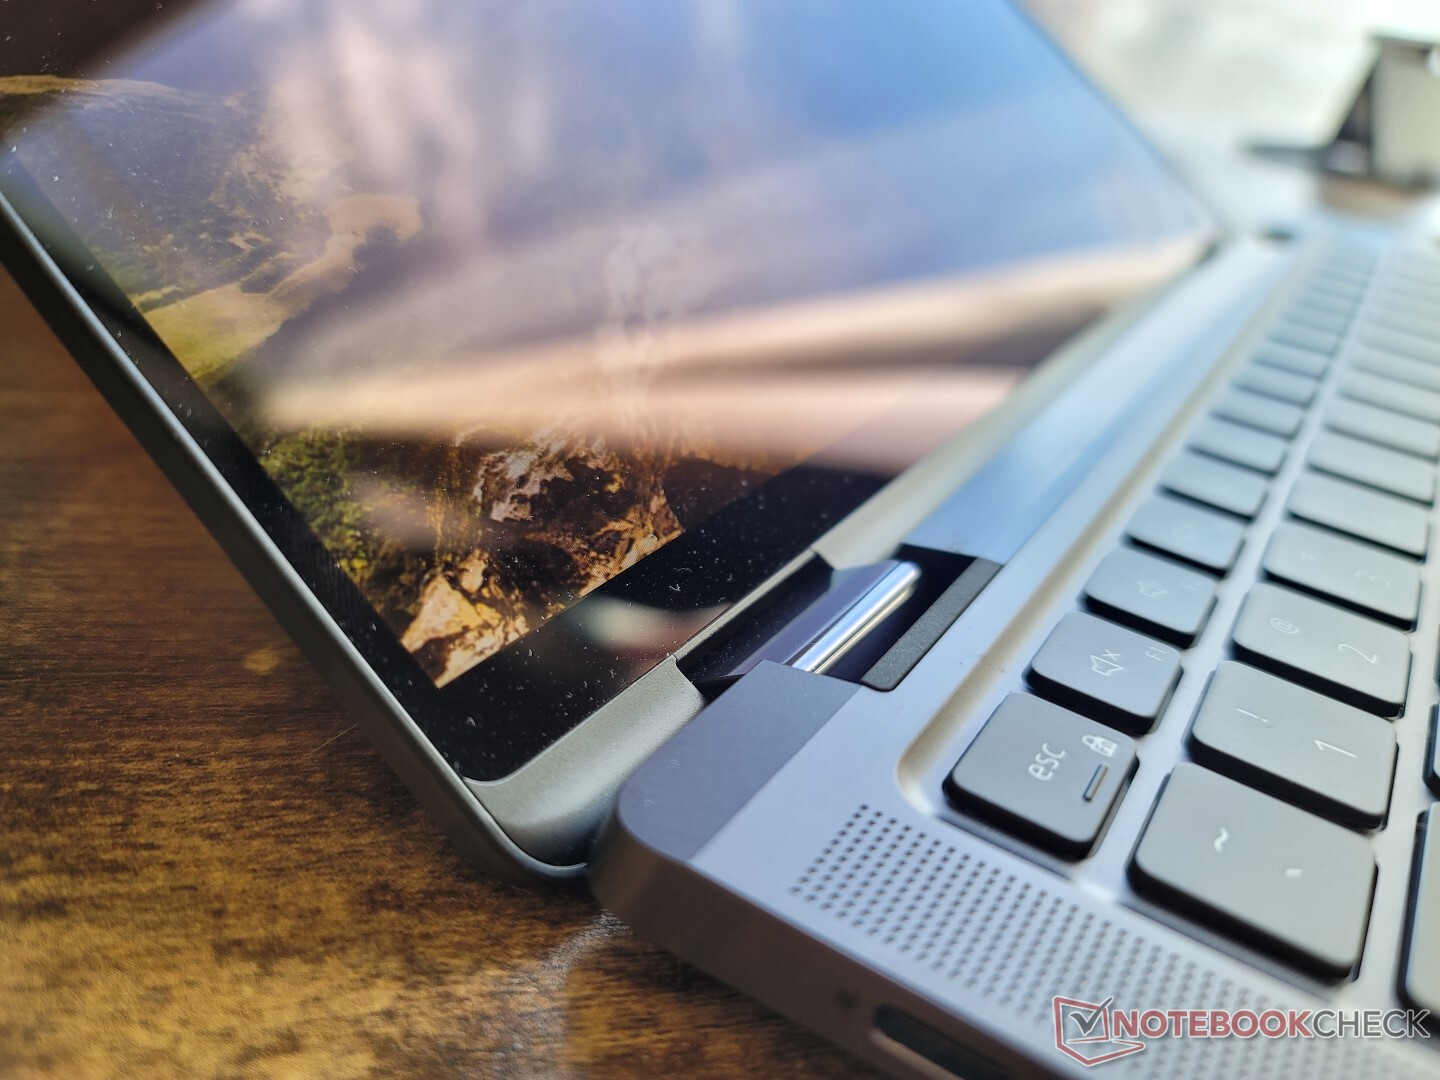
Case — Boring Looks, Strong Design
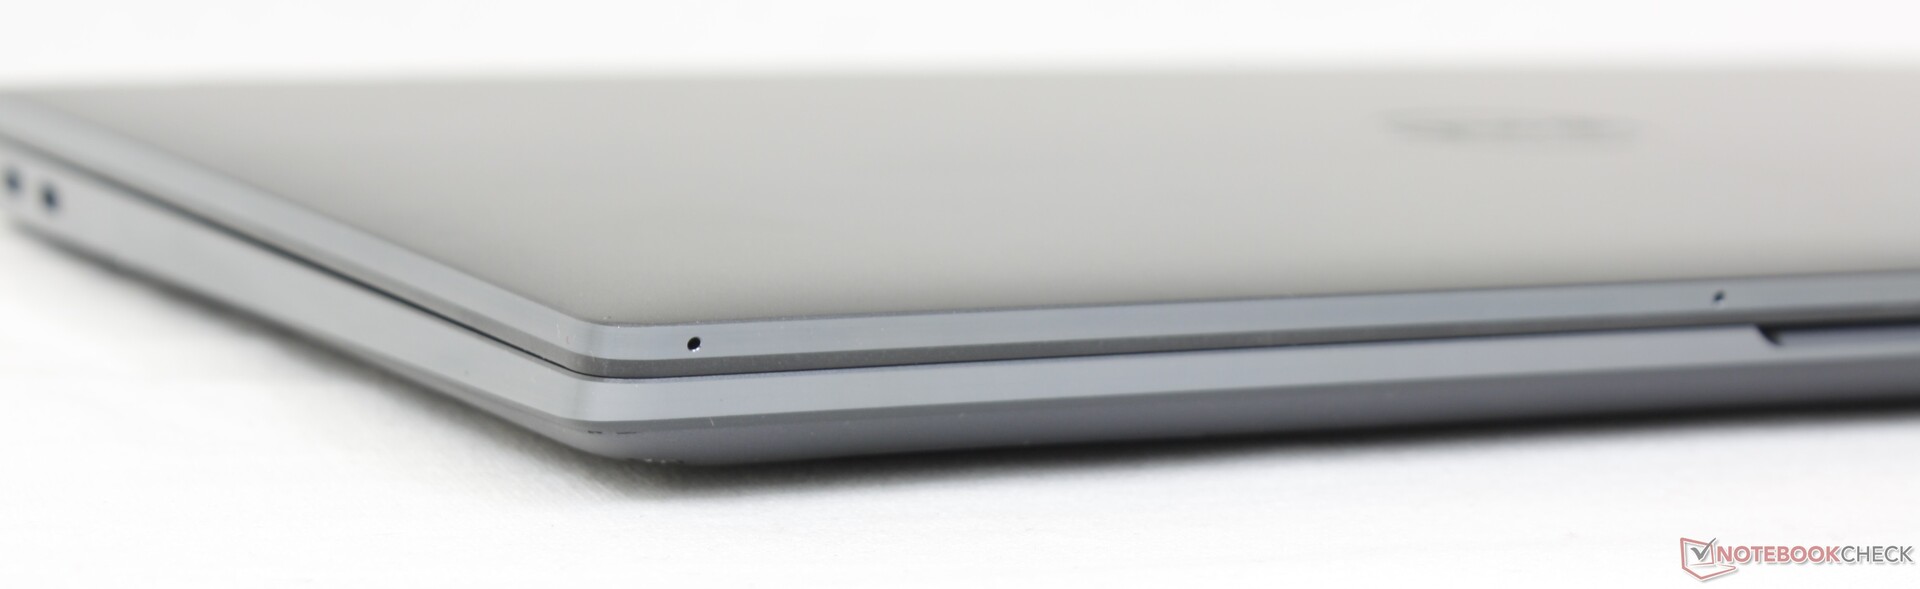
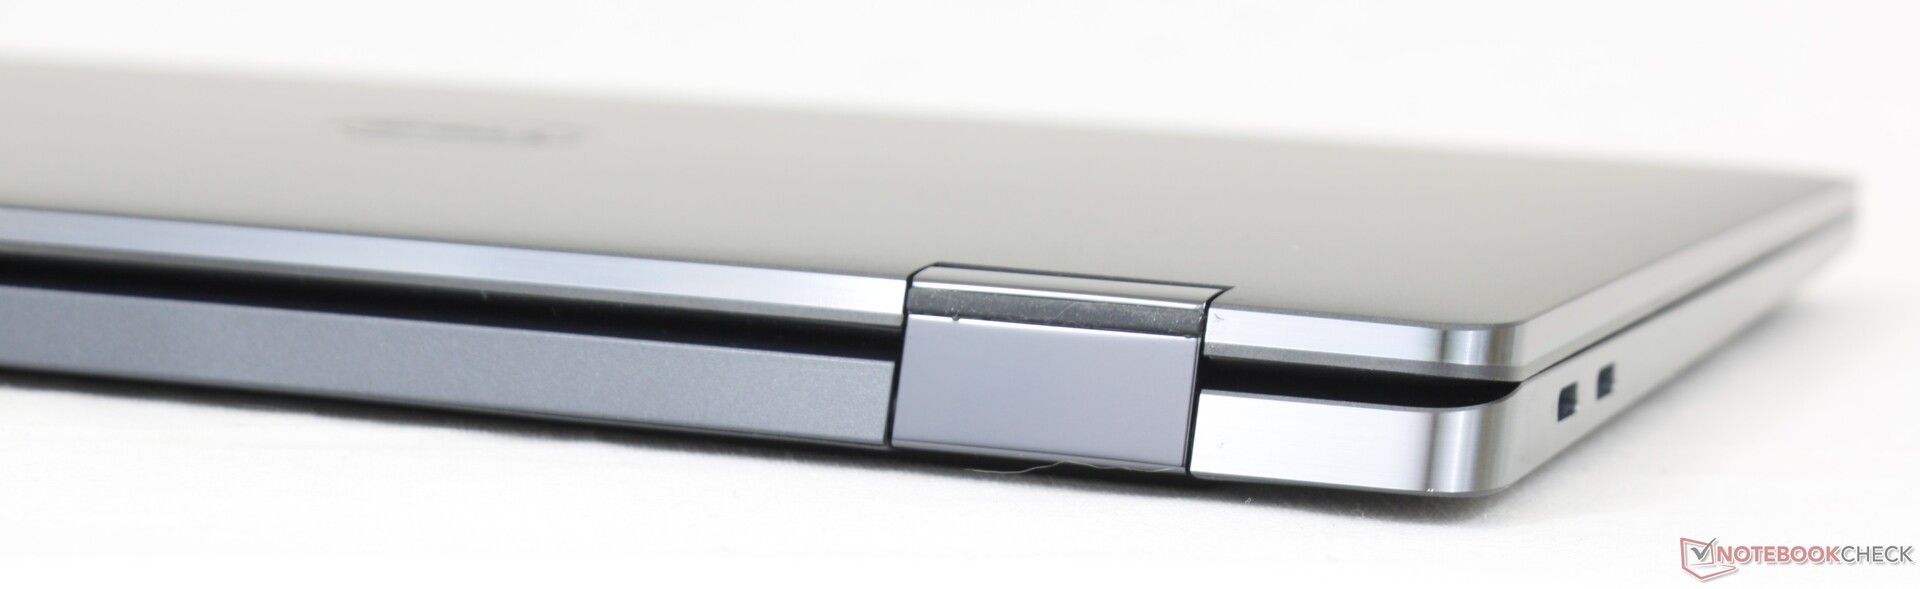
The gray metal skeleton may not look like much especially when compared to the flashy golden designs of the MSI Summit E13 Flip or HP Spectre series, but it is just as strong if not more so. Attempting to twist the base from its sides or down the keyboard center would result in just minimal warping for excellent first impressions. Even the display is resistant to twisting or bending. Overall rigidity is one of the best we've seen on any ultrathin subnotebook convertible.
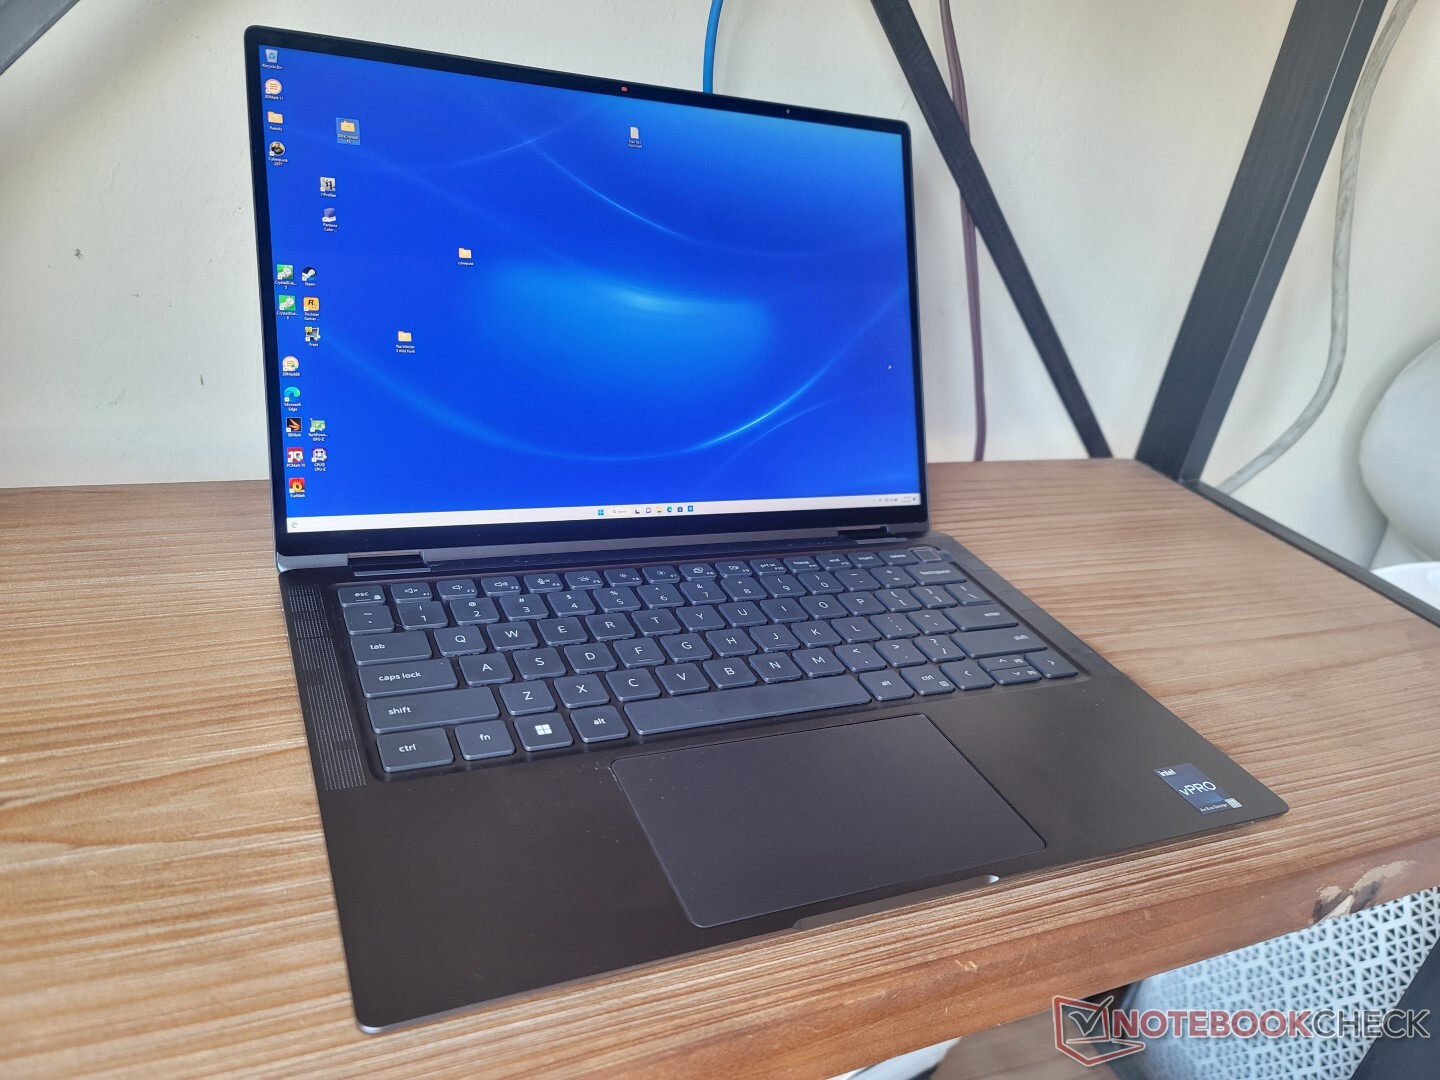
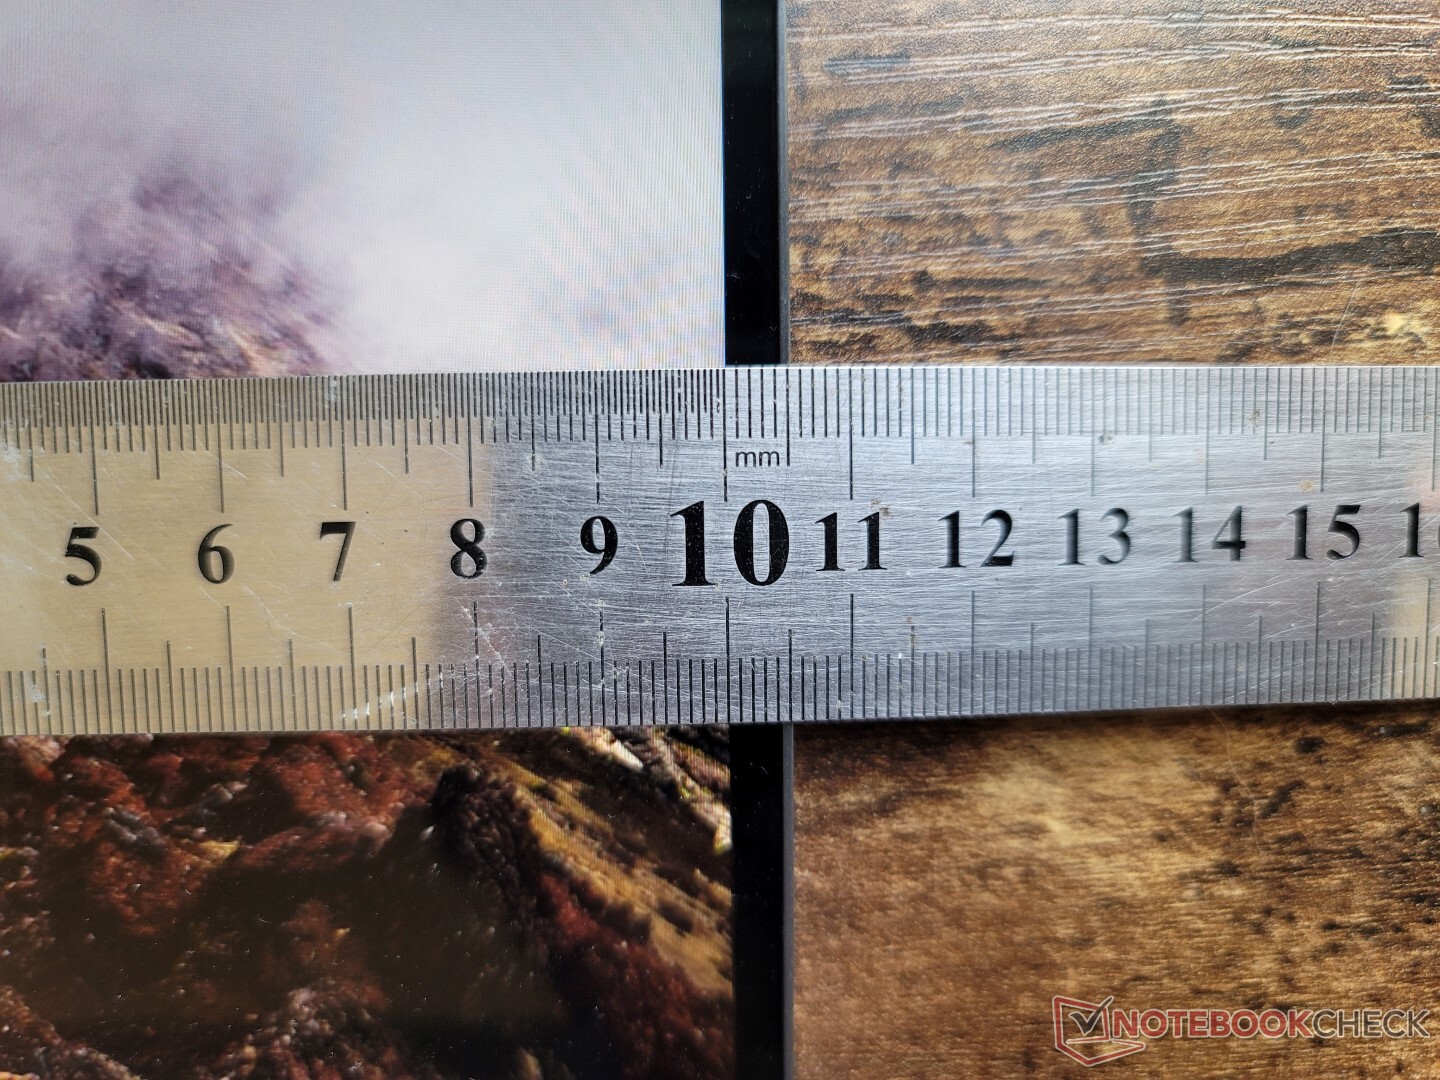
Dimensions and weight are close to the Elite Dragonfly Max. The Dell model is slightly longer due its taller 16:10 aspect ratio vs. the 16:9 HP, but the Dell design makes up for it with narrower side bezels and a thinner profile. Meanwhile, the Summit E13 Flip is an even bigger and heavier 13-inch convertible.
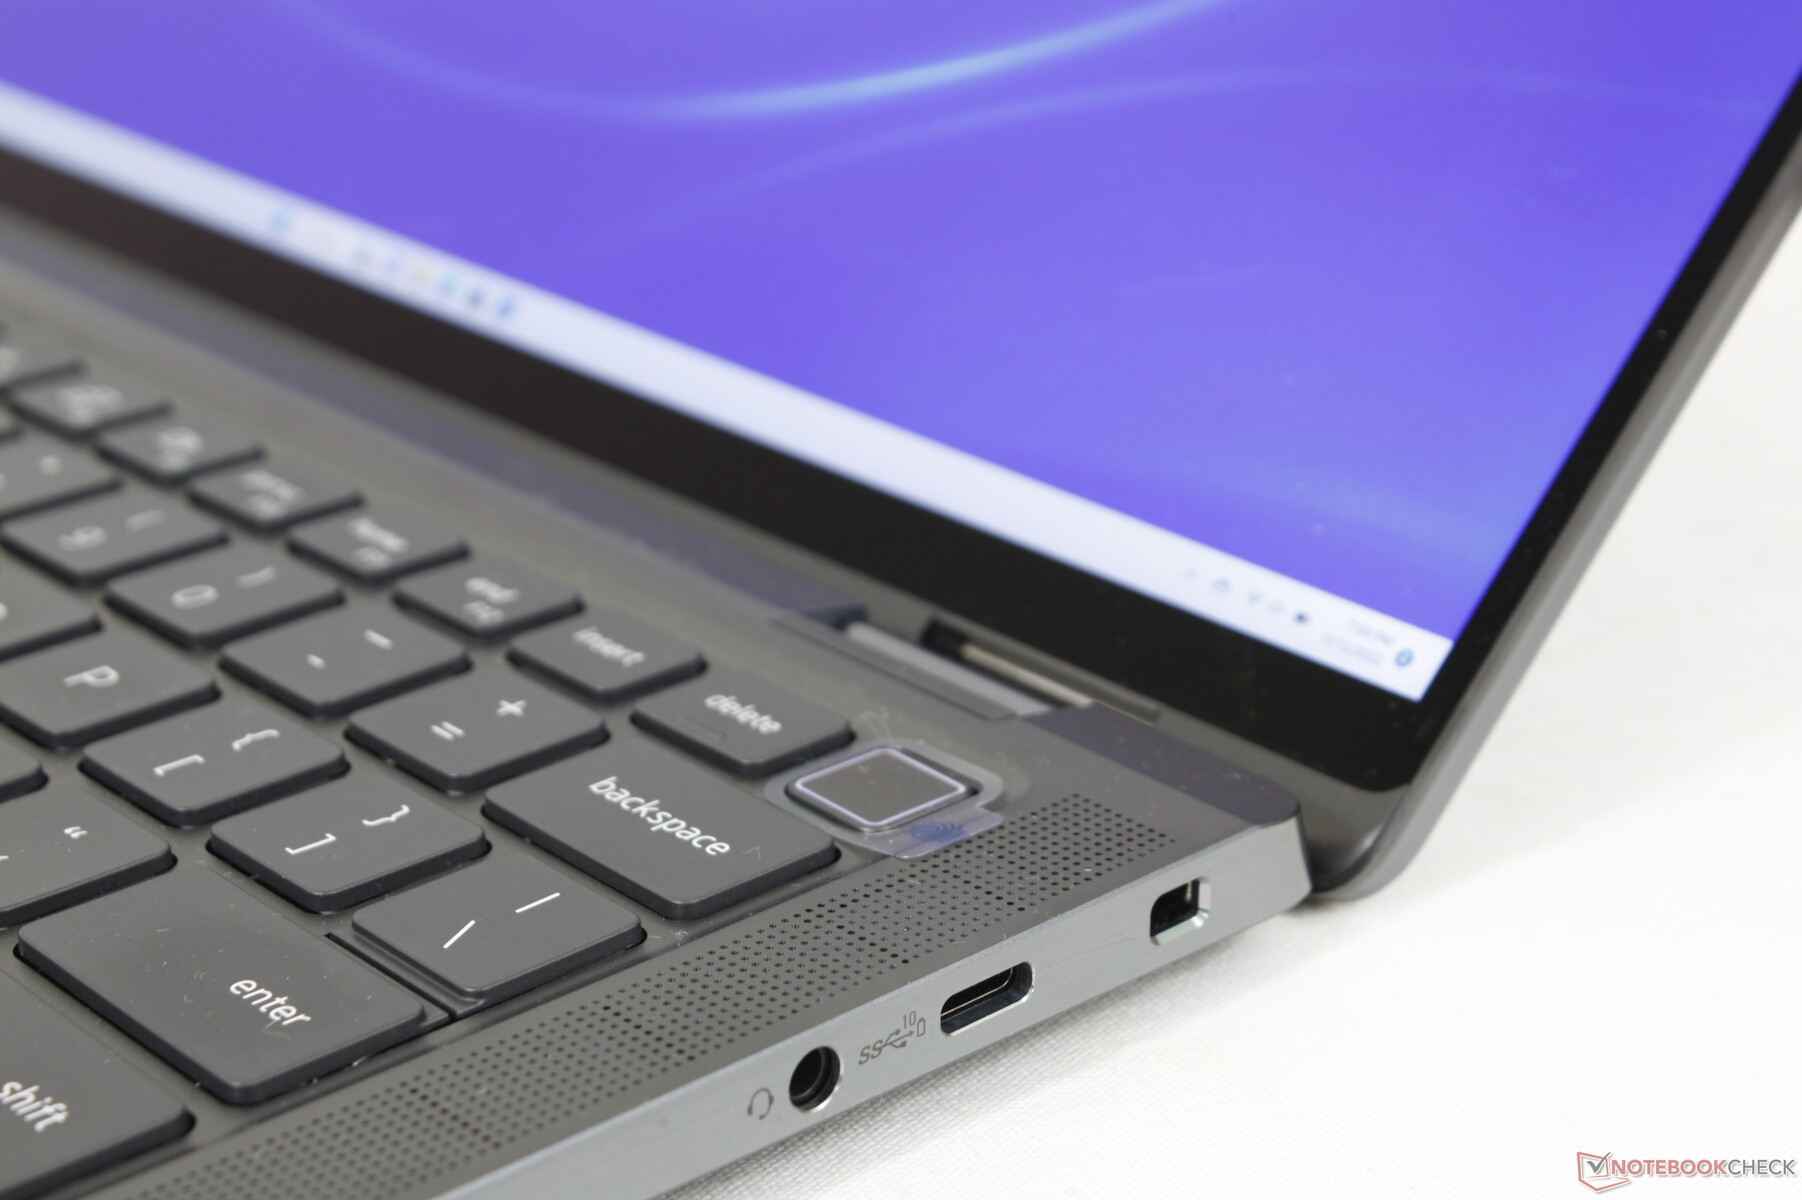
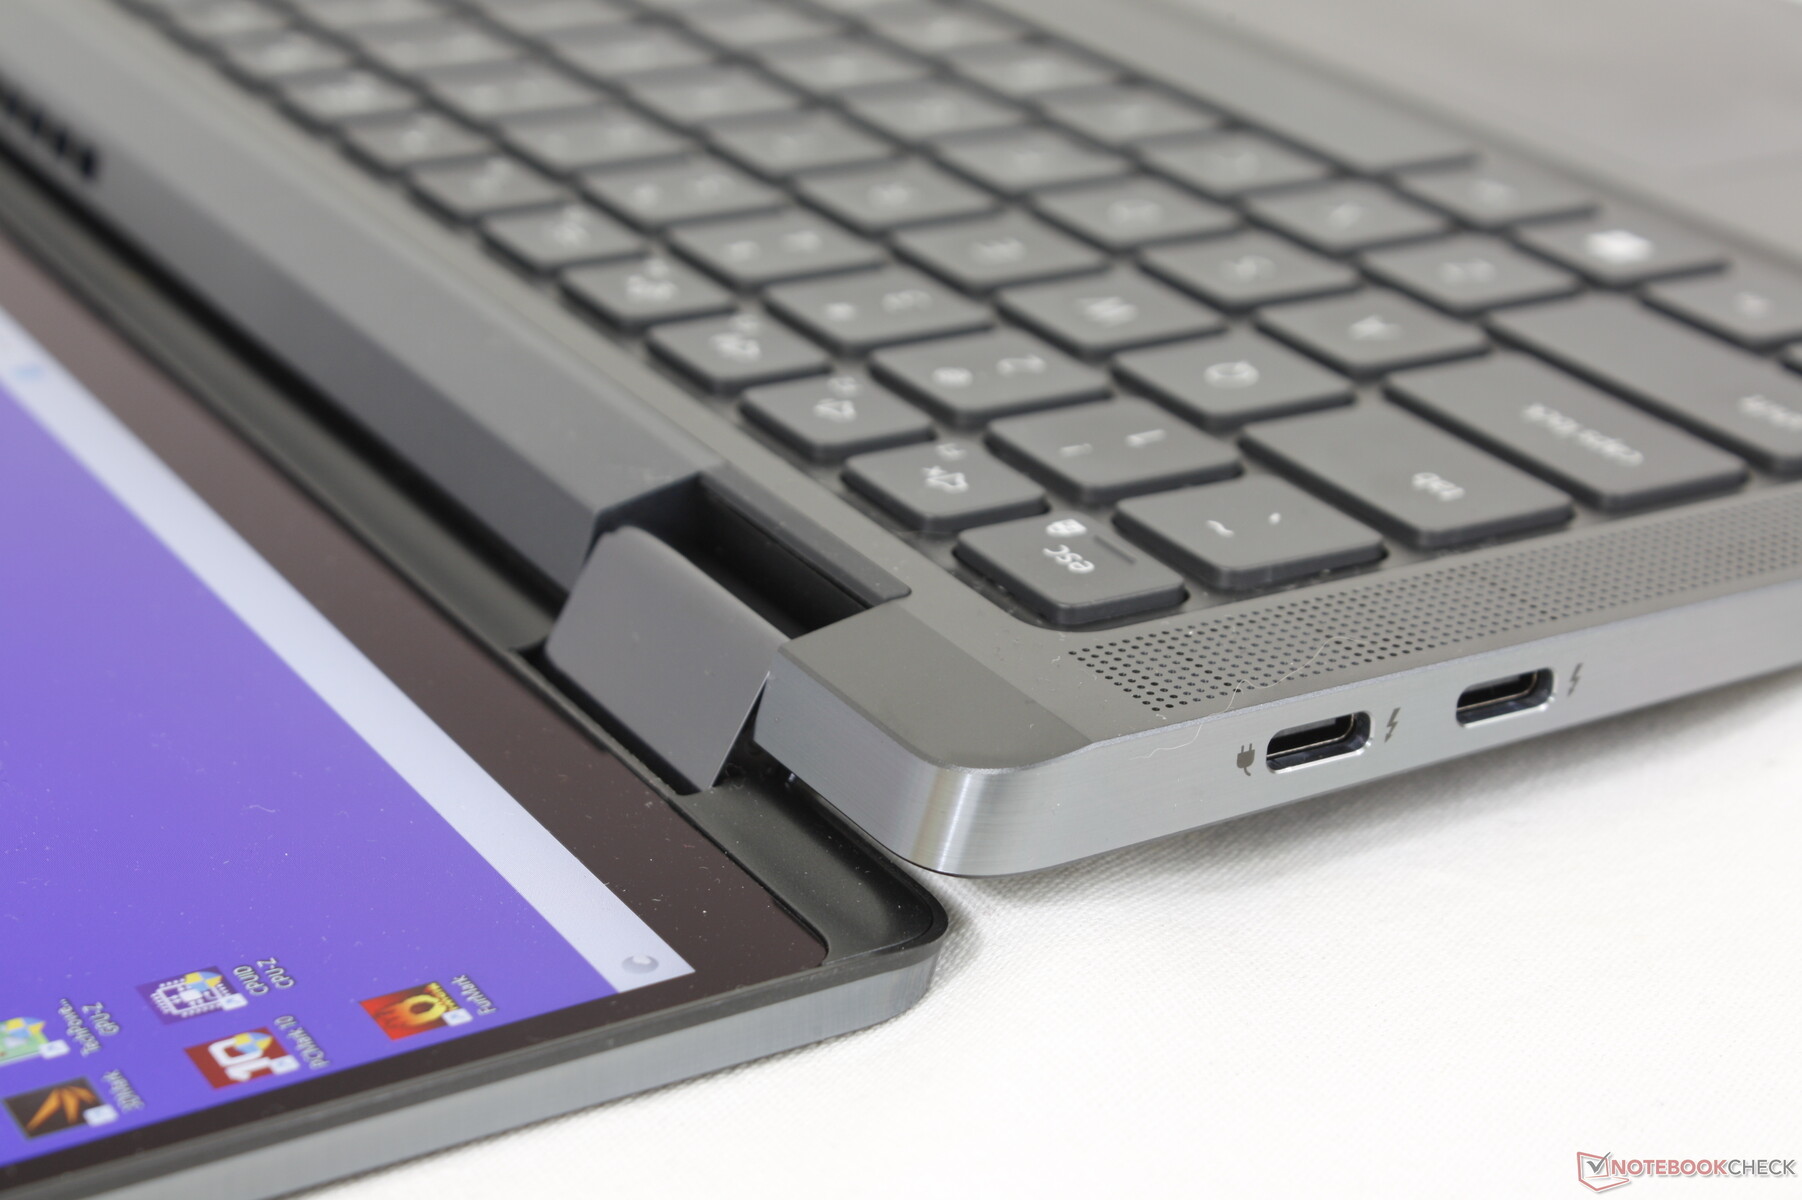
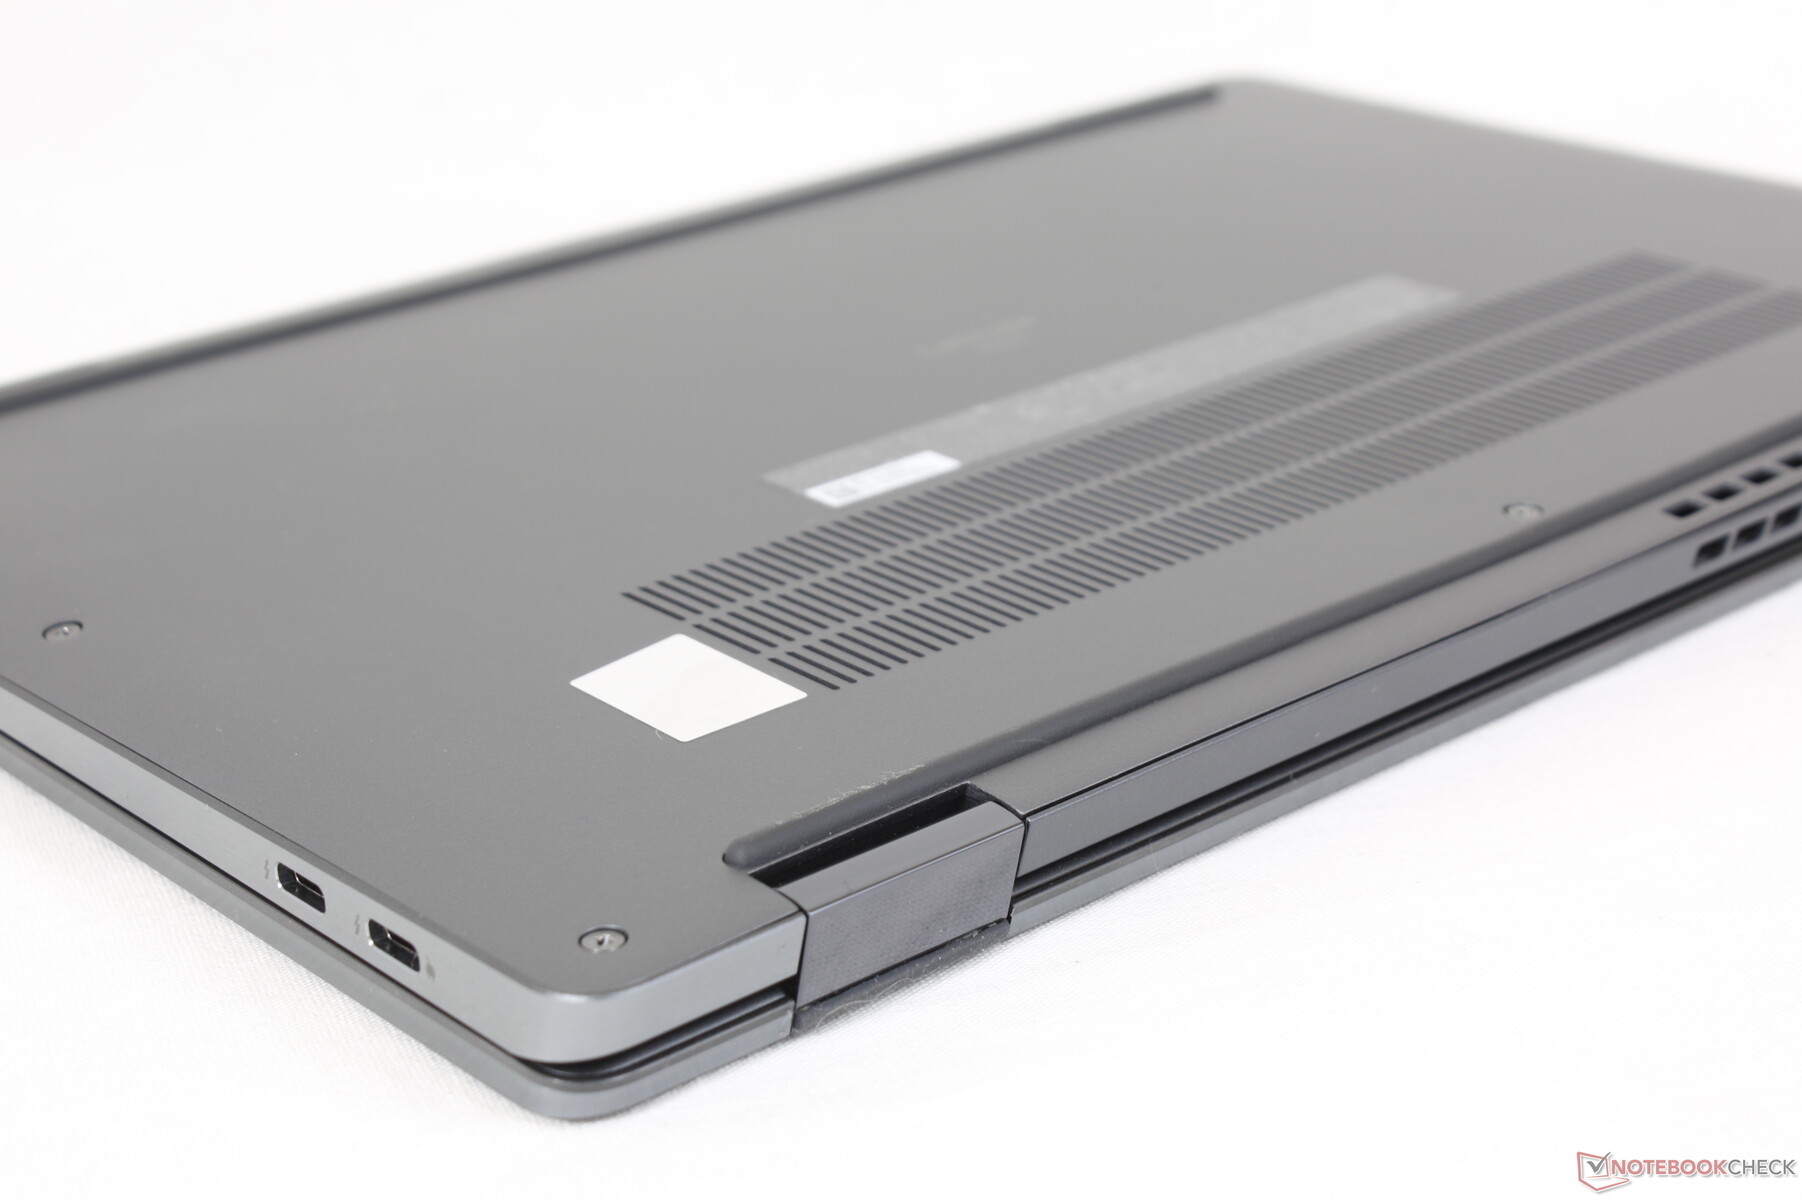
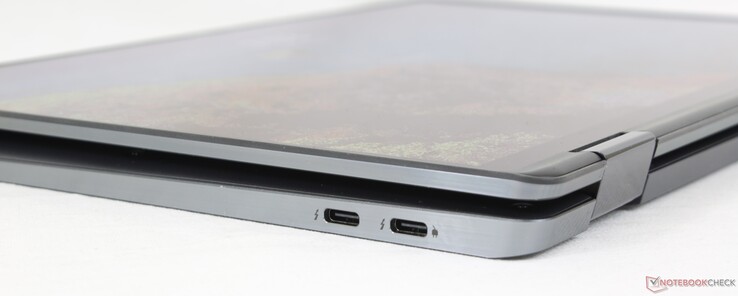
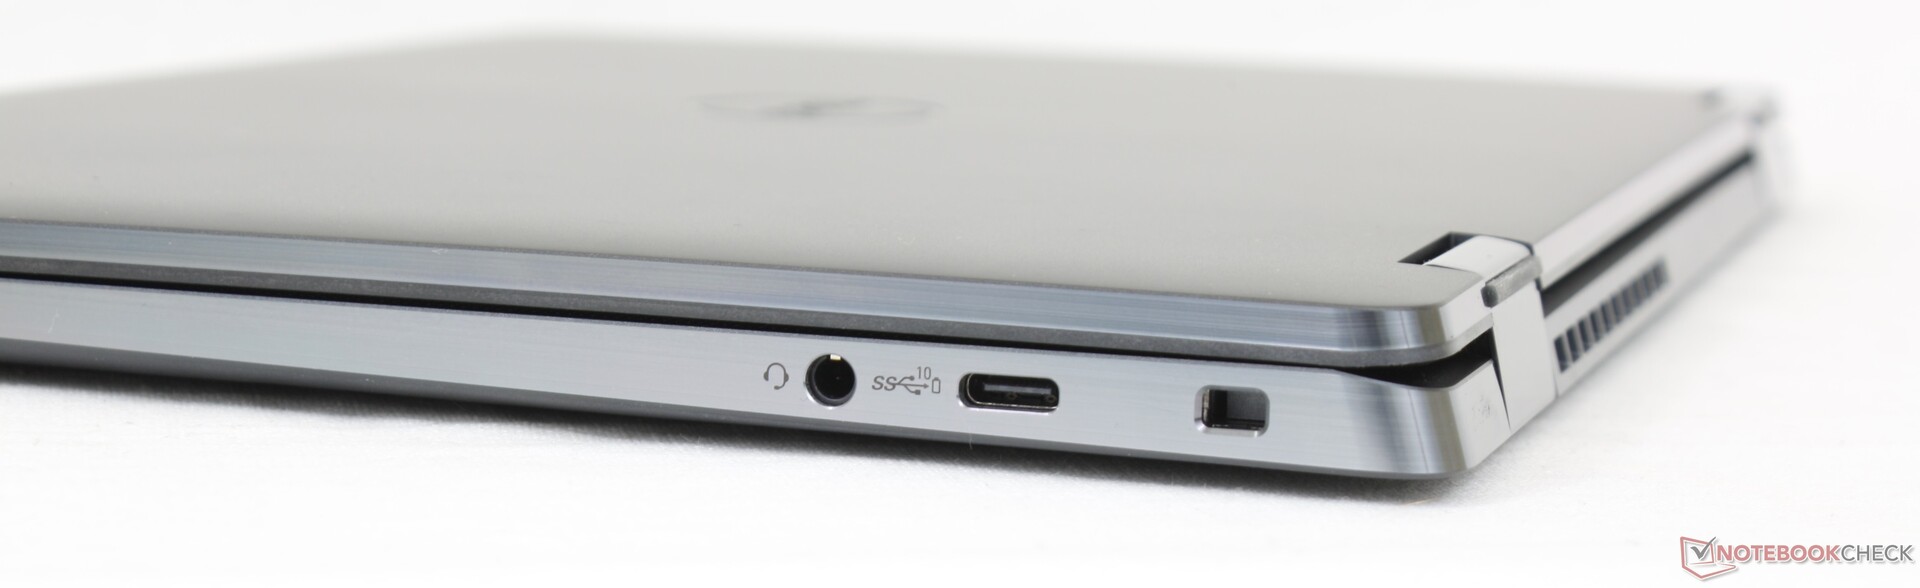
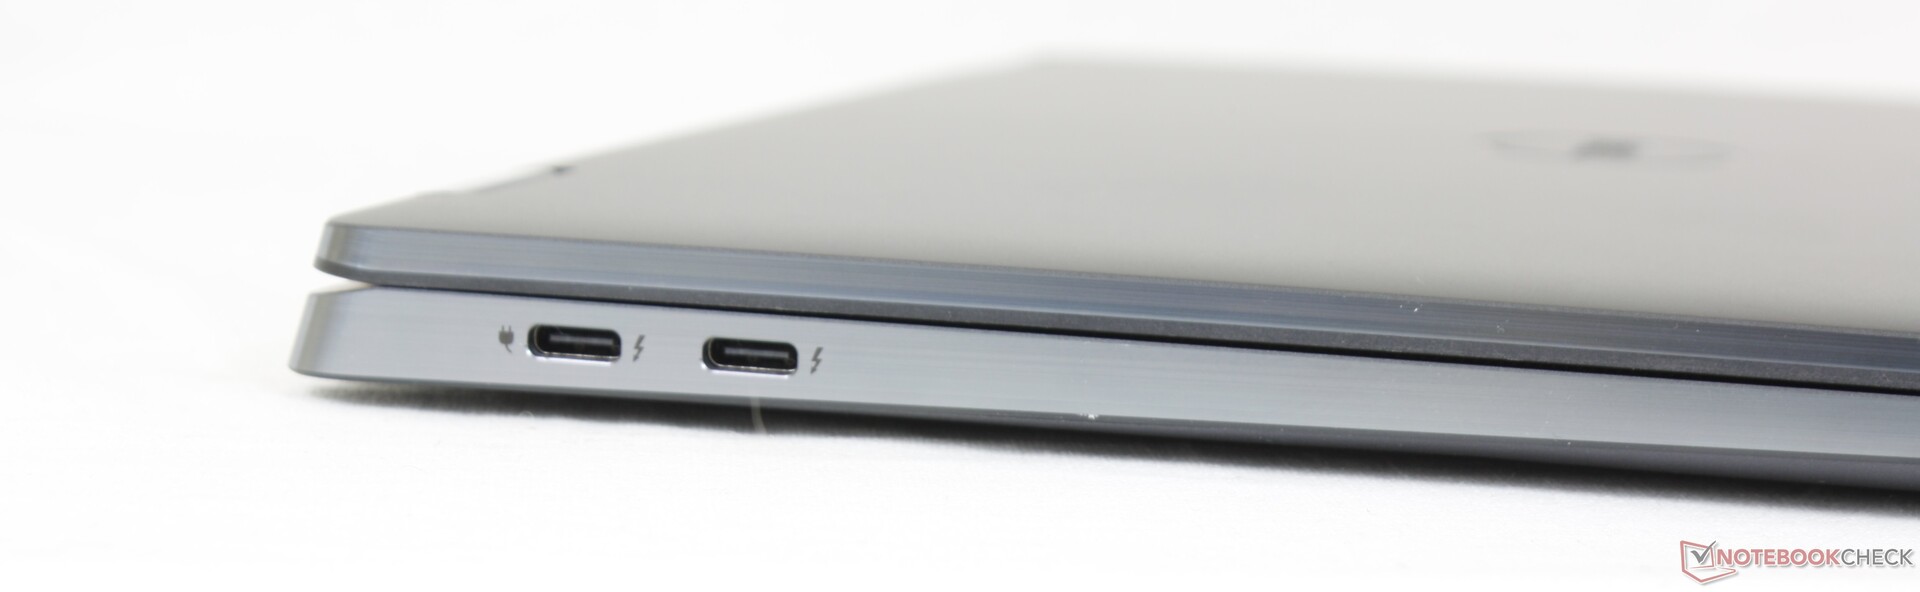
Connectivity — USB-C Only
Be prepared to carry USB-C adapters everywhere you go as the model integrates no USB-A or HDMI ports. If such ports are necessary, then you may want to consider the Dragonfly Max instead or even the Summit E13 Flip.
Keep in mind that only the left two USB-C ports support Thunderbolt 4 devices. Any of the three USB-C ports can otherwise be used for external monitors and charging purposes.
It's a little disappointing that the model integrates no SD card reader considering that the cheaper Latitude 5310 2-in-1 includes one.
Communication
An Intel AX211 comes standard for Wi-Fi 6E and Bluetooth 5.2 connectivity. Transfer rates are slightly faster on 6 GHz when compared to 5 GHz, but the difference is not as wide as many would expect.
The Snapdragon X20 LTE-A or Intel 5000 5G are optional for uSIM WWAN connectivity. Unfortunately, you cannot purchase a non-WAN SKU only to add a WAN module later as the antenna are not included in the non-WAN configurations.
| Networking | |
| iperf3 transmit AX12 | |
| Dell Latitude 5310-23VP6 | |
| HP Elite Dragonfly Max | |
| HP EliteBook x360 1030 G7 | |
| MSI Summit E13 Flip Evo A11MT | |
| iperf3 receive AX12 | |
| HP EliteBook x360 1030 G7 | |
| HP Elite Dragonfly Max | |
| MSI Summit E13 Flip Evo A11MT | |
| Dell Latitude 5310-23VP6 | |
| iperf3 receive AXE11000 6GHz | |
| Dell Latitude 9330 | |
| iperf3 receive AXE11000 | |
| Dell Latitude 9330 | |
| iperf3 transmit AXE11000 | |
| Dell Latitude 9330 | |
| iperf3 transmit AXE11000 6GHz | |
| Dell Latitude 9330 | |
Webcam
The 2 MP webcam with IR come standard for Windows Hello support. In comparison, HP Elite and Spectre laptops ship with 5 MP sensors for sharper image quality. All Dell Latitude and Lenovo ThinkPad laptop webcams thus far continue to be limited to 2 MP only.


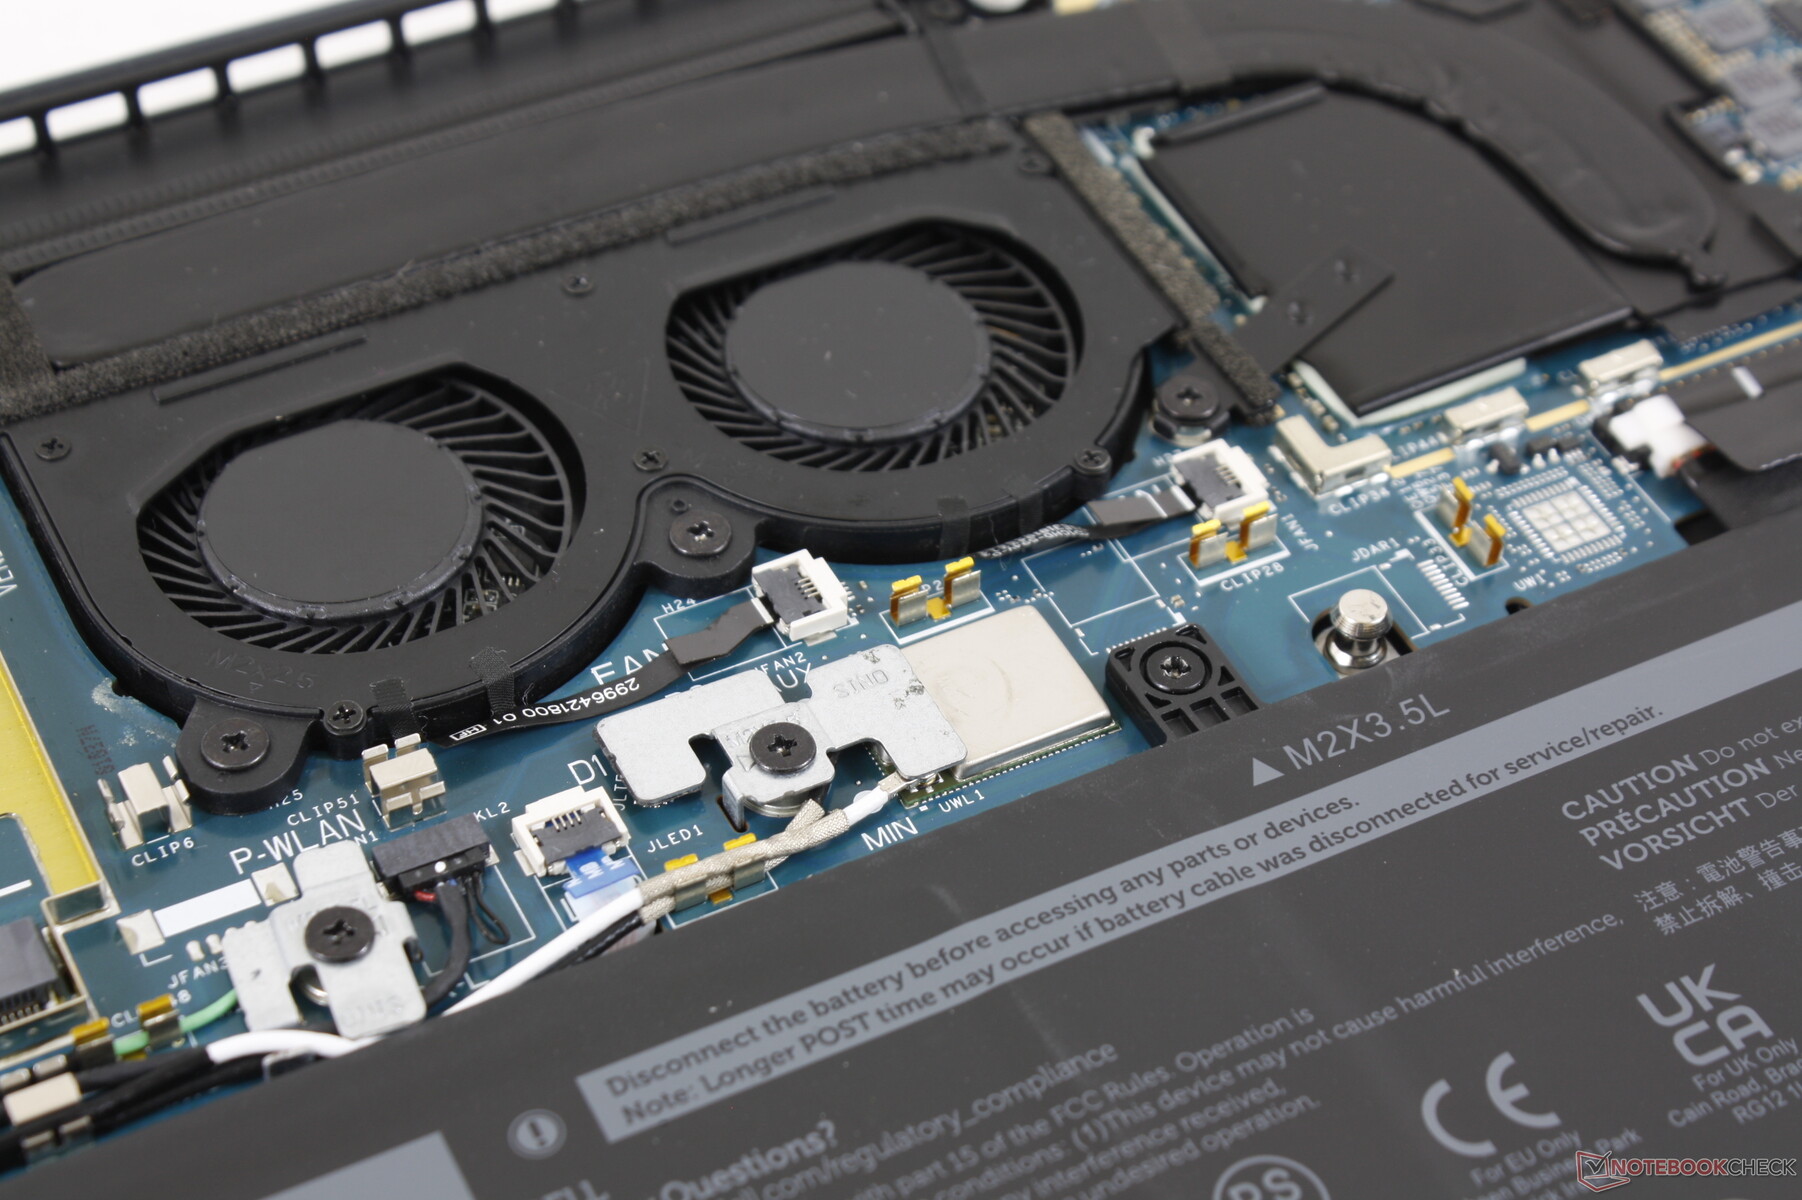
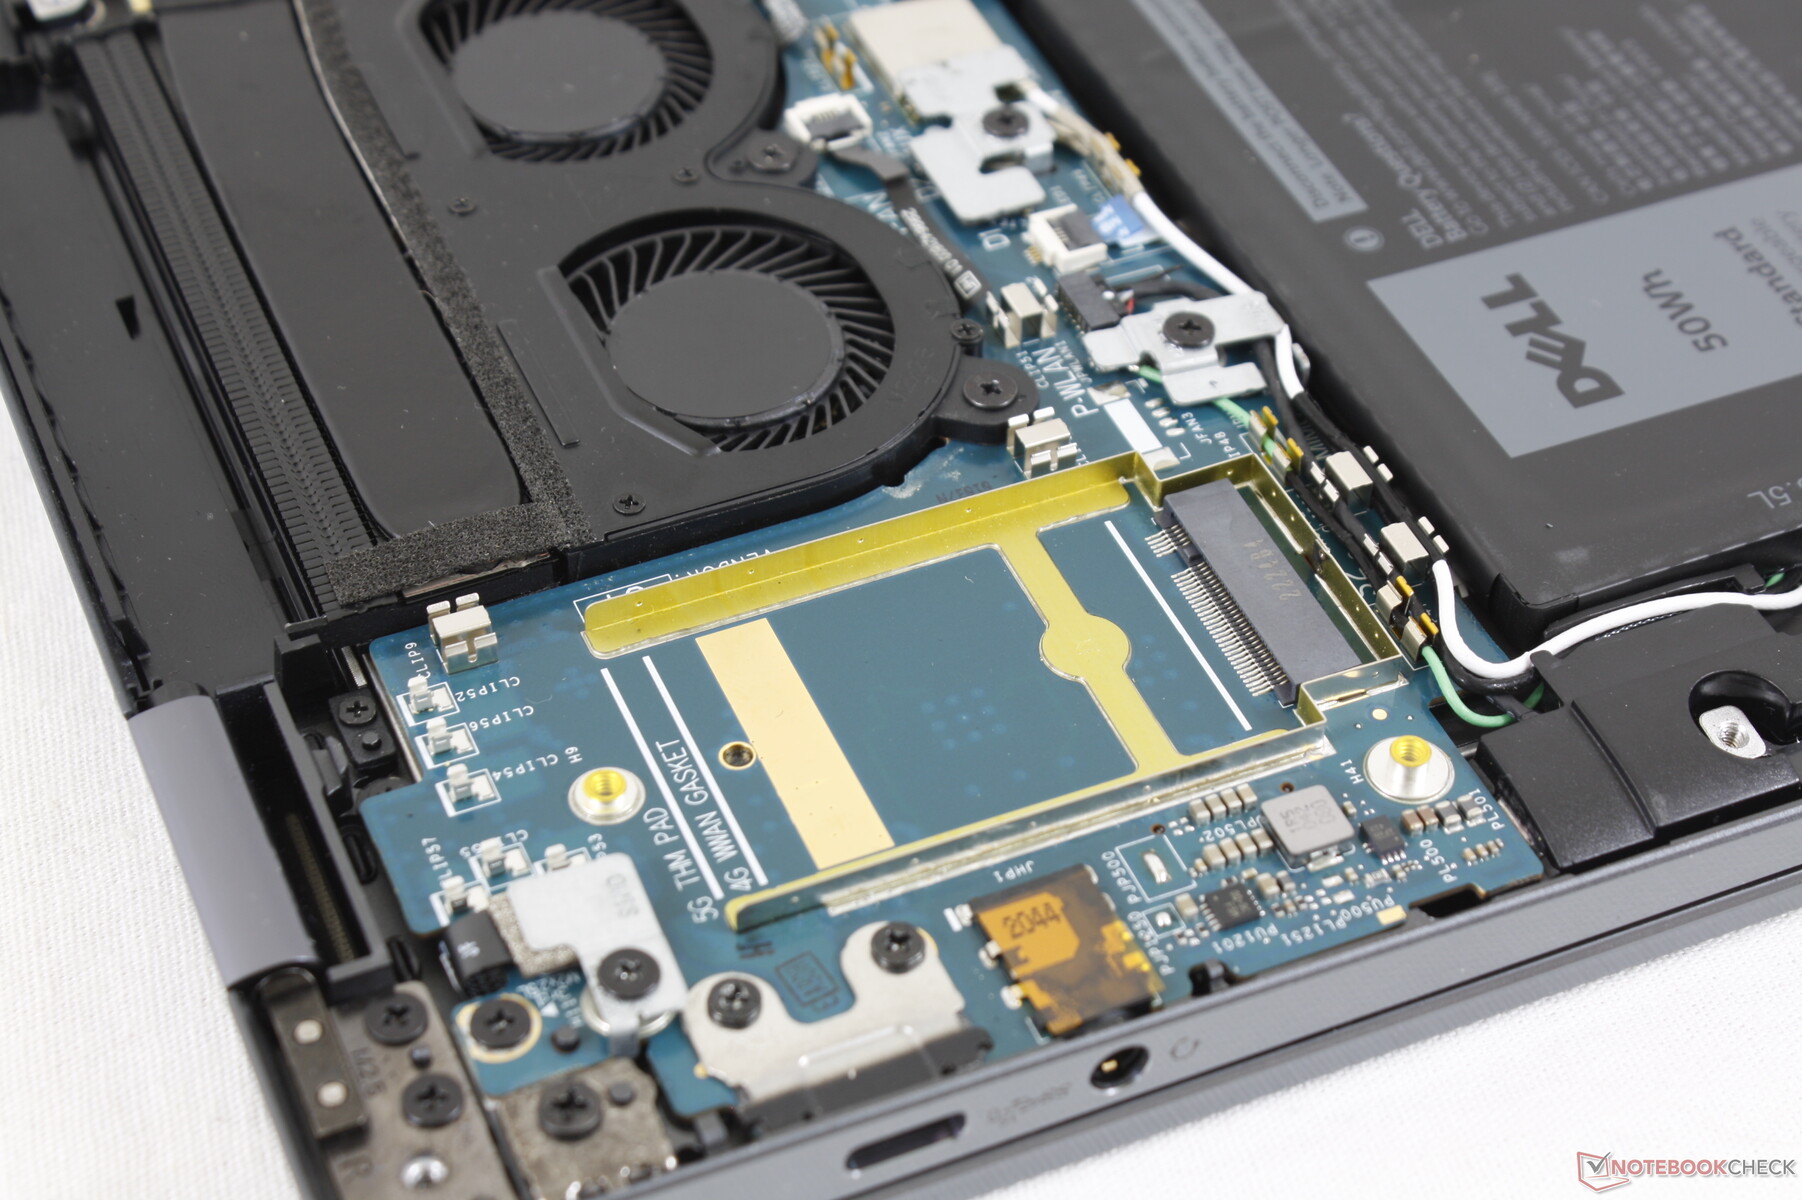
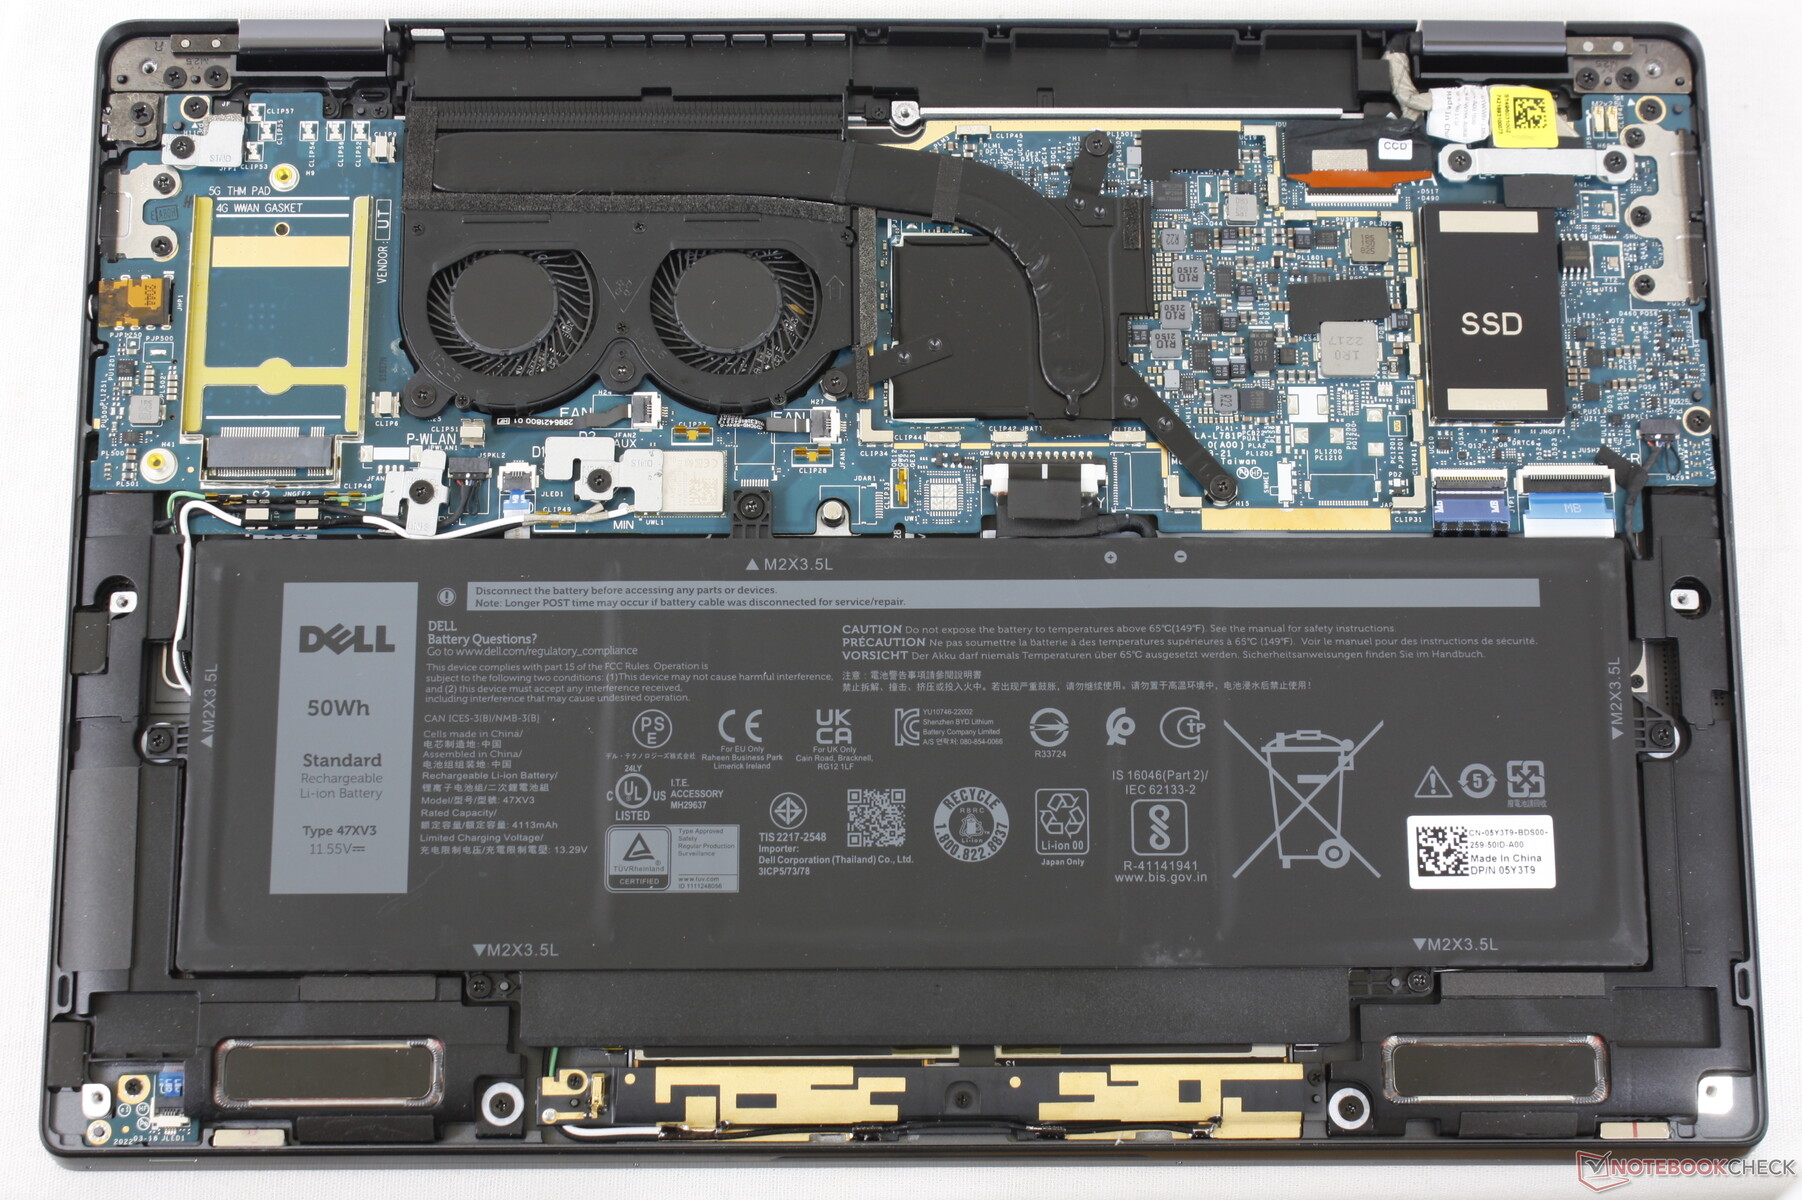
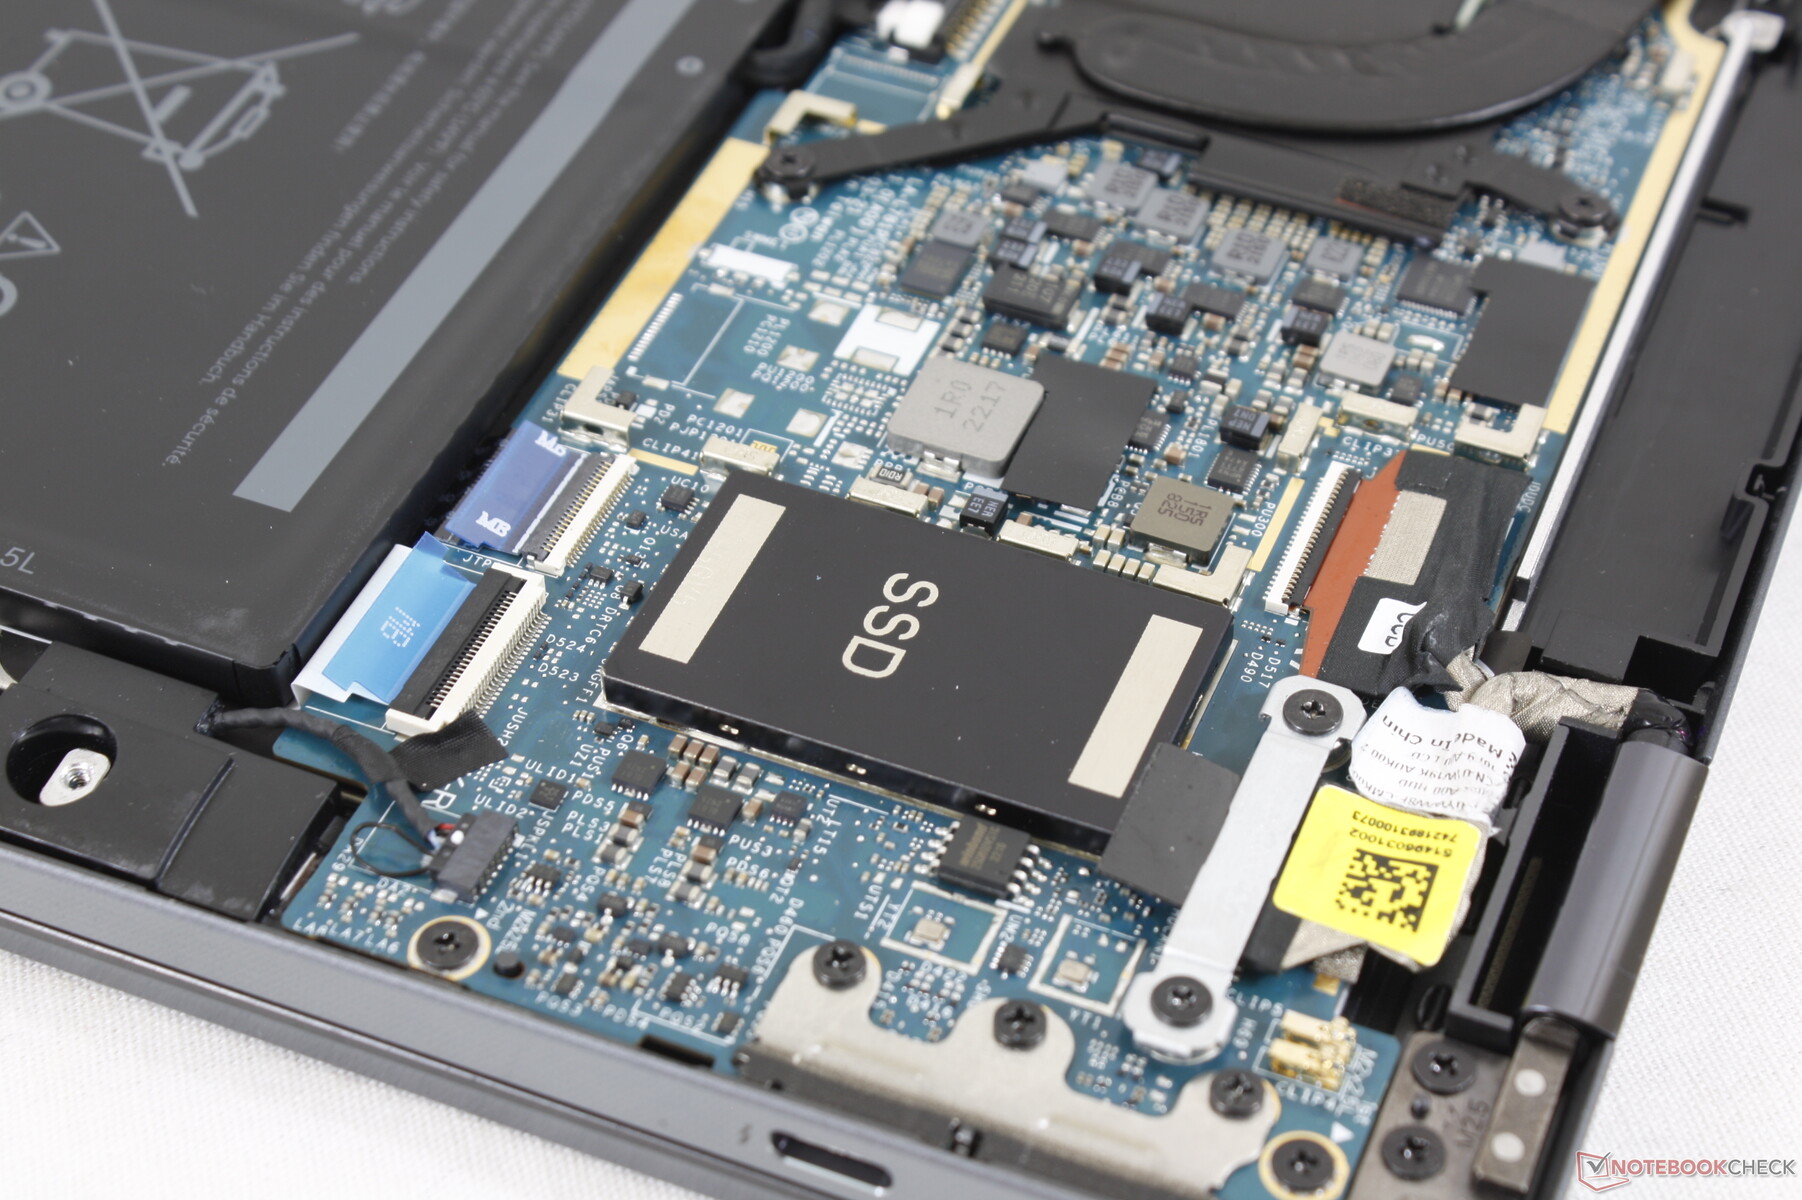
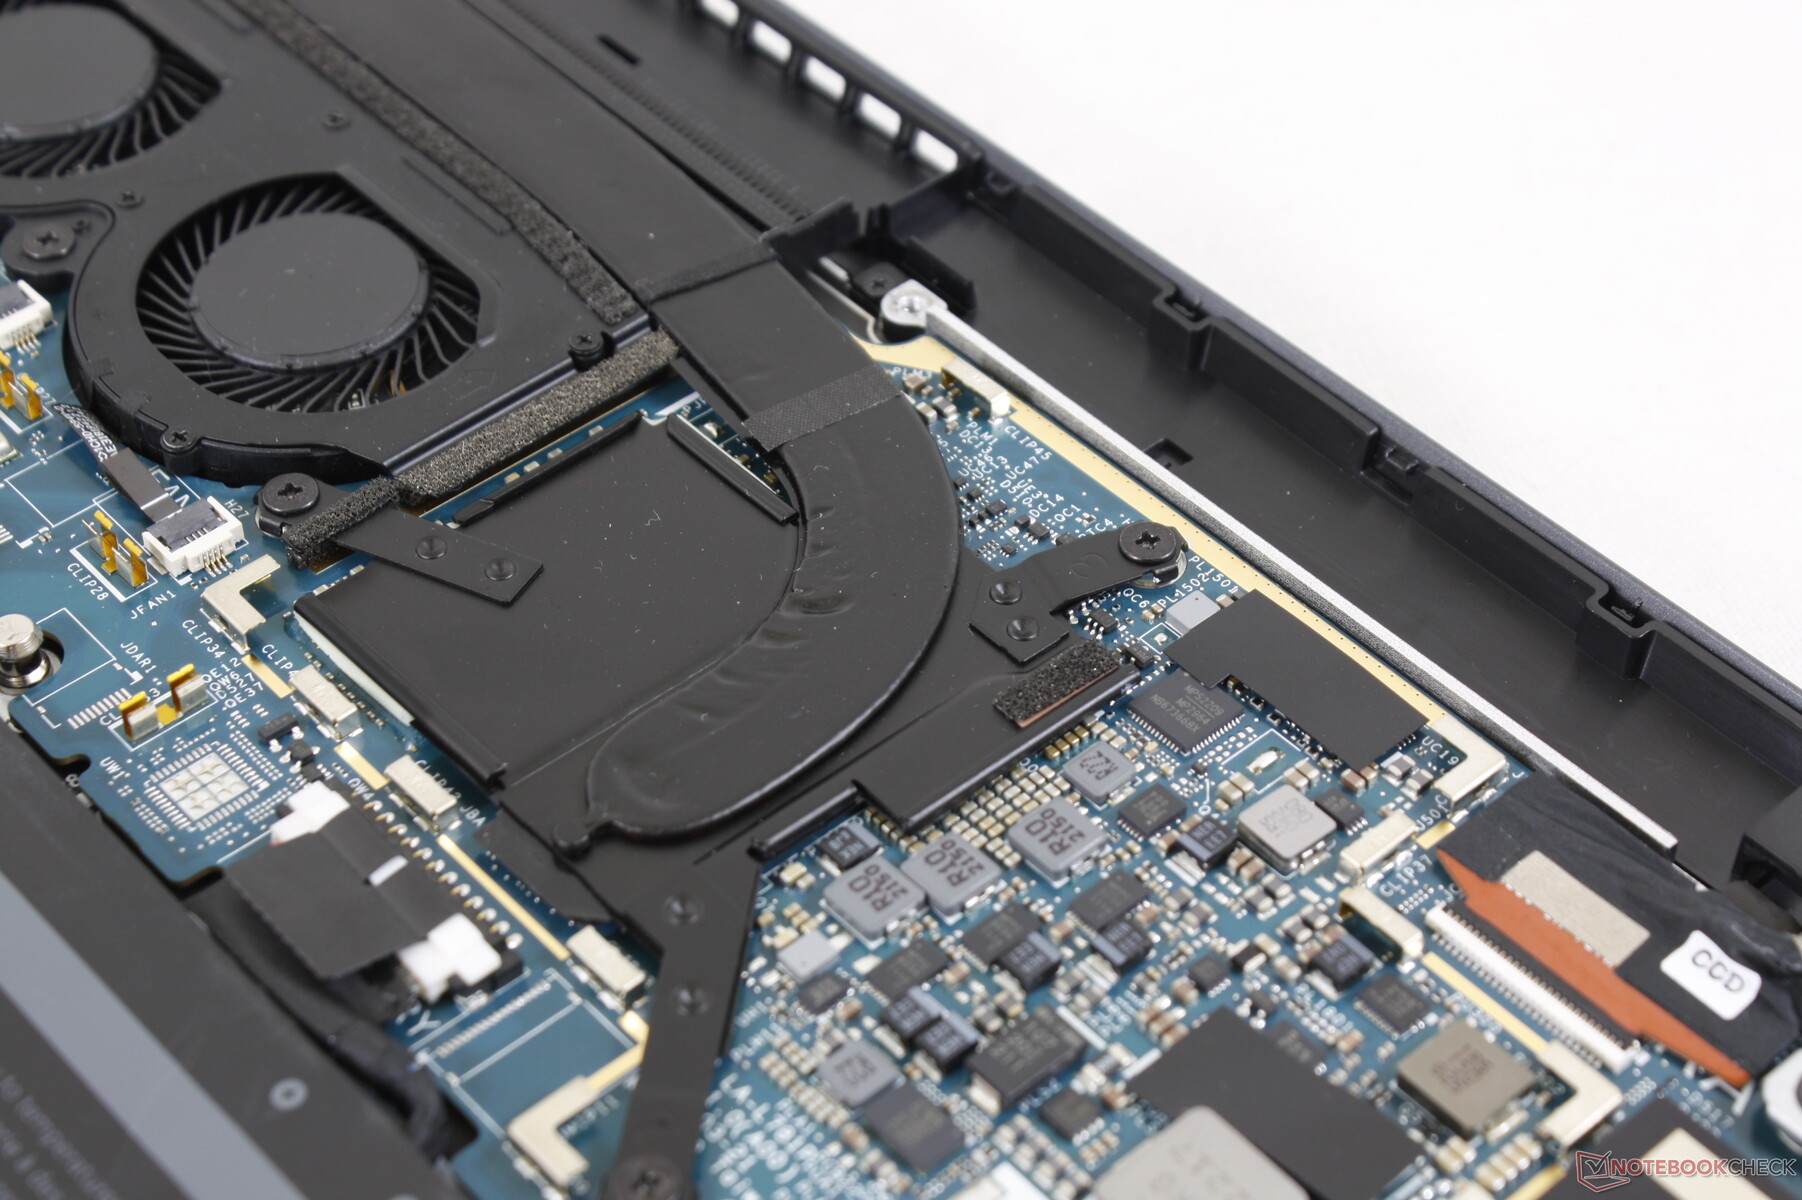
Maintenance
The bottom panel is secured by just 6 Philips screws for easy servicing. Users can remove the battery, WAN, and SSD modules while the WLAN and RAM modules are soldered. Non-upgradeable WLAN and RAM are common on 13-inch subnotebooks.
Accessories and Warranty
The retail box includes a USB-C to USB-A adapter to mitigate the fact that the Latitude 9330 integrates no USB-A ports. A three-year limited manufacturer warranty comes standard which is common practice for high-end business PCs from Dell or HP.
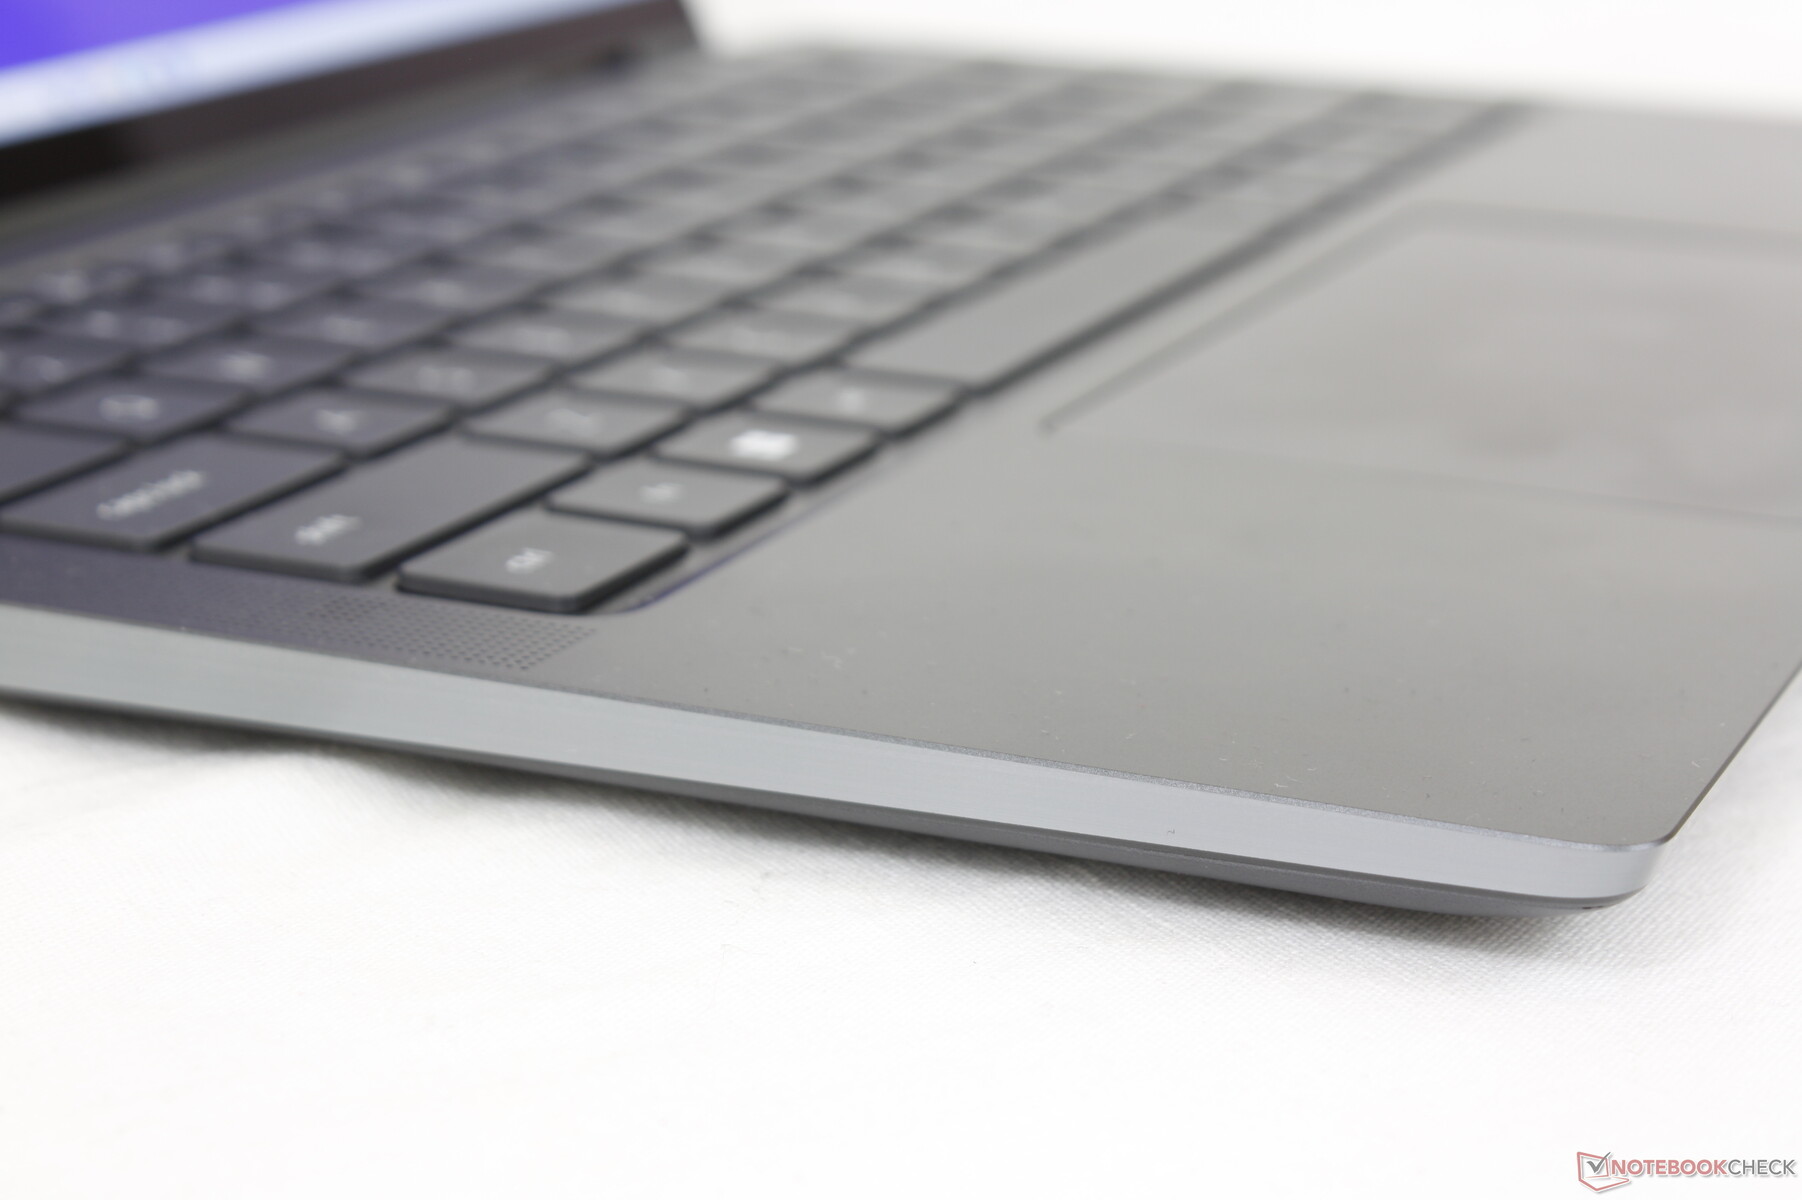
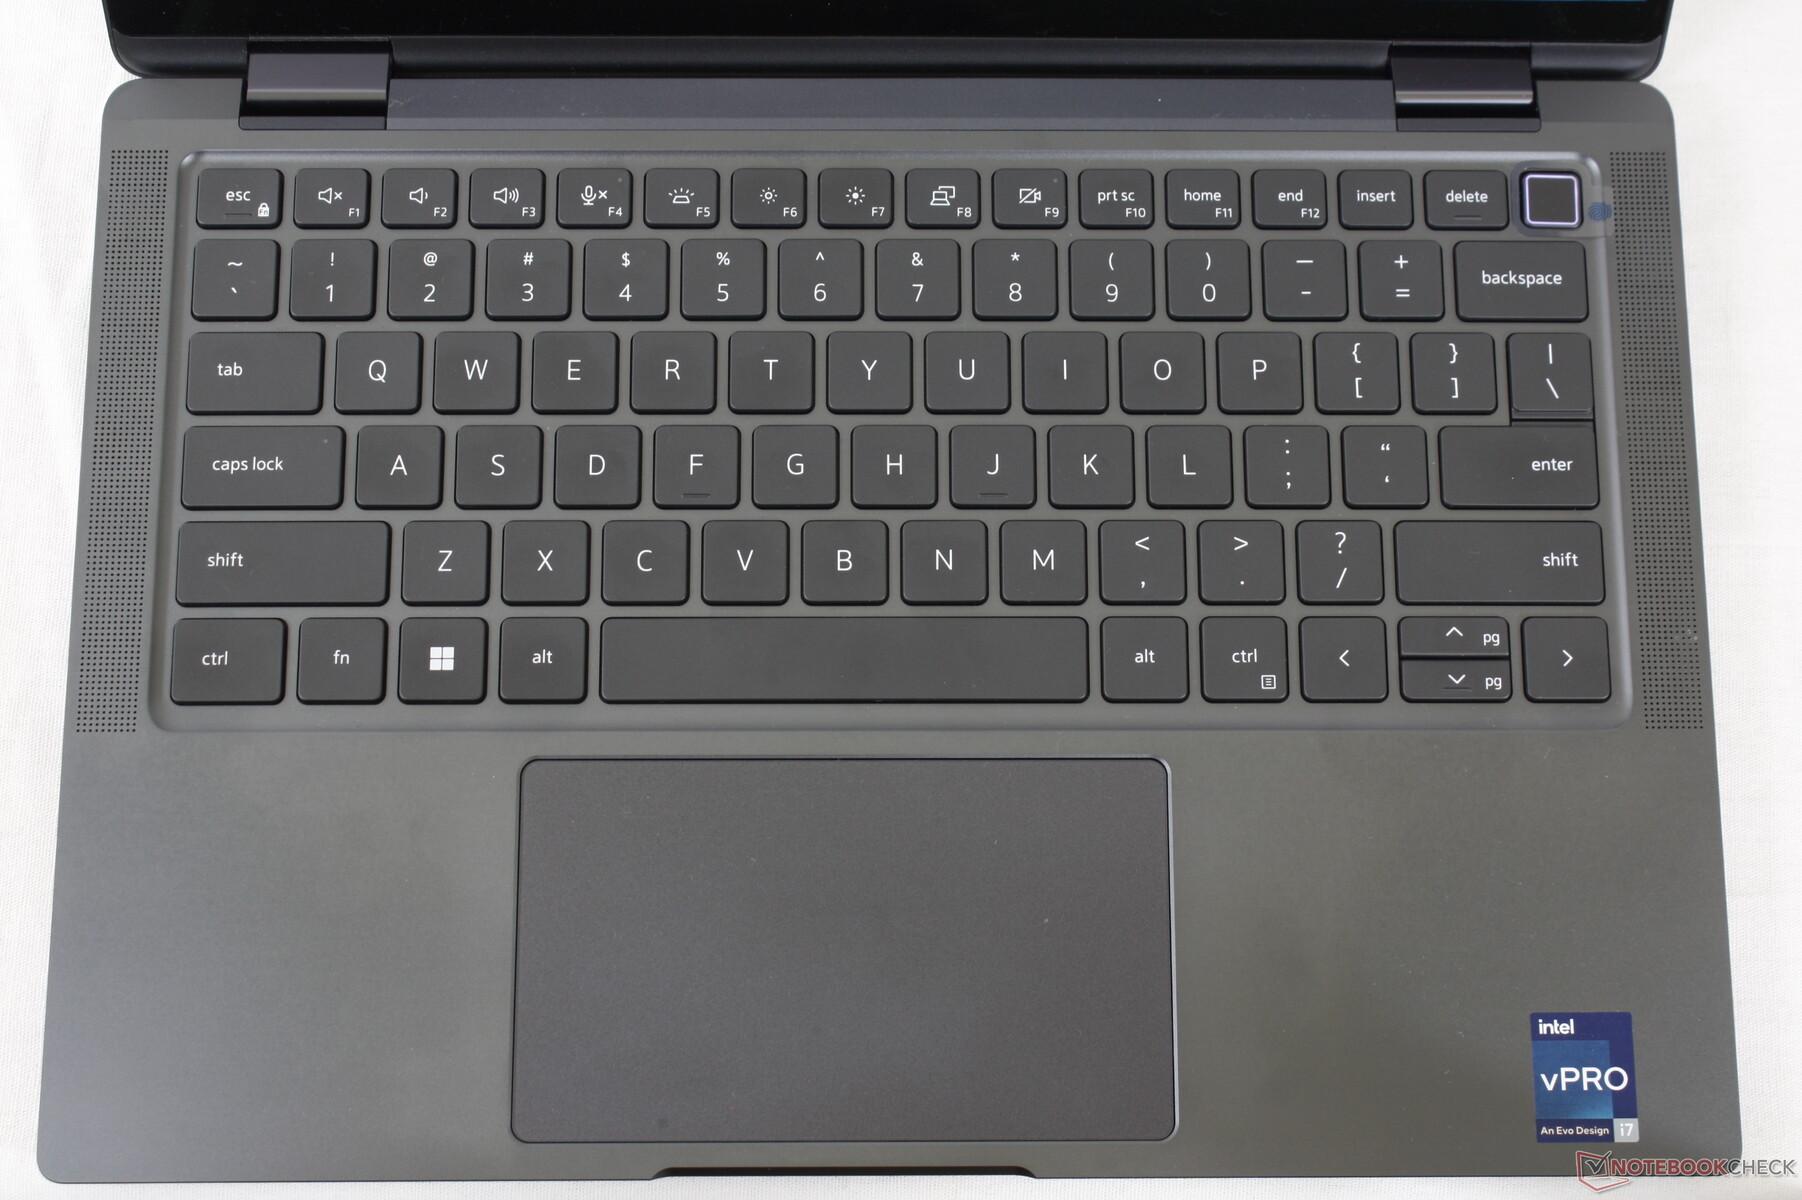
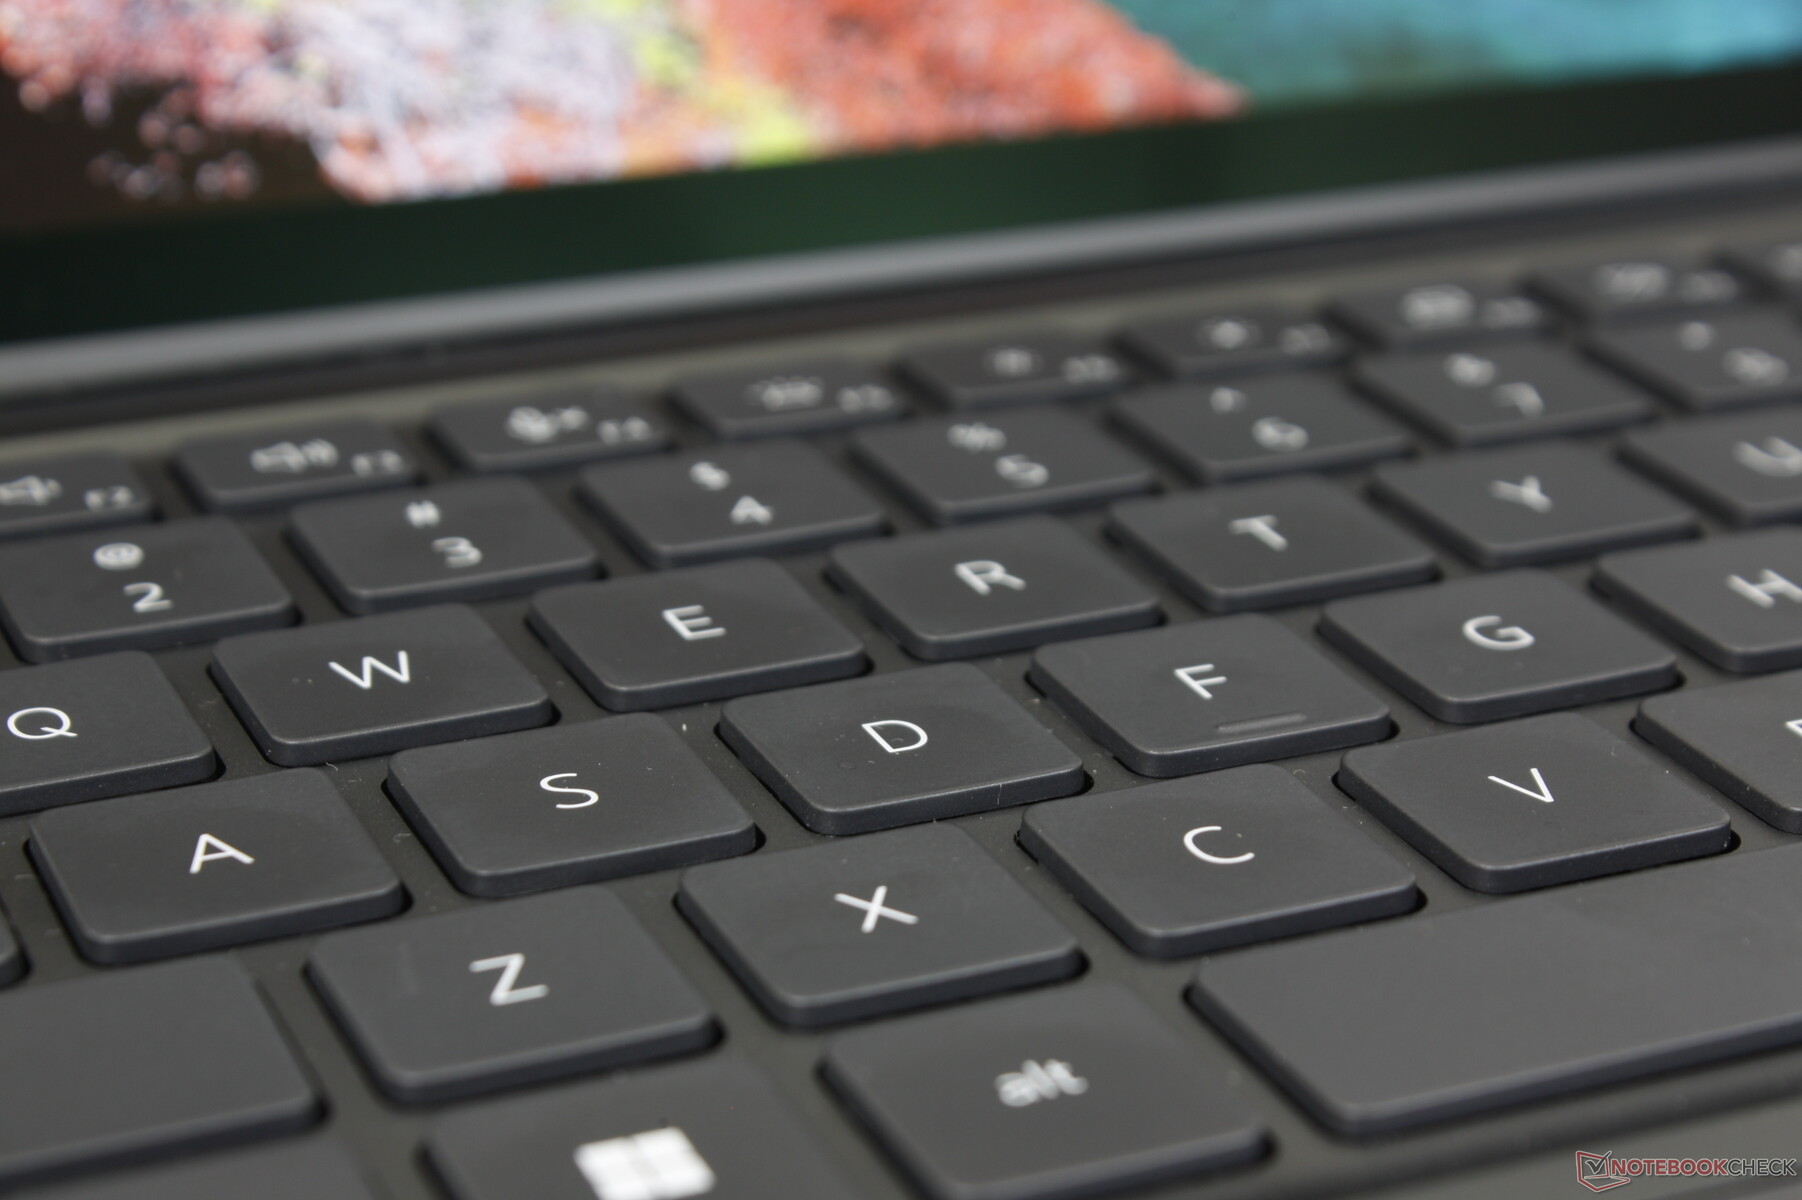
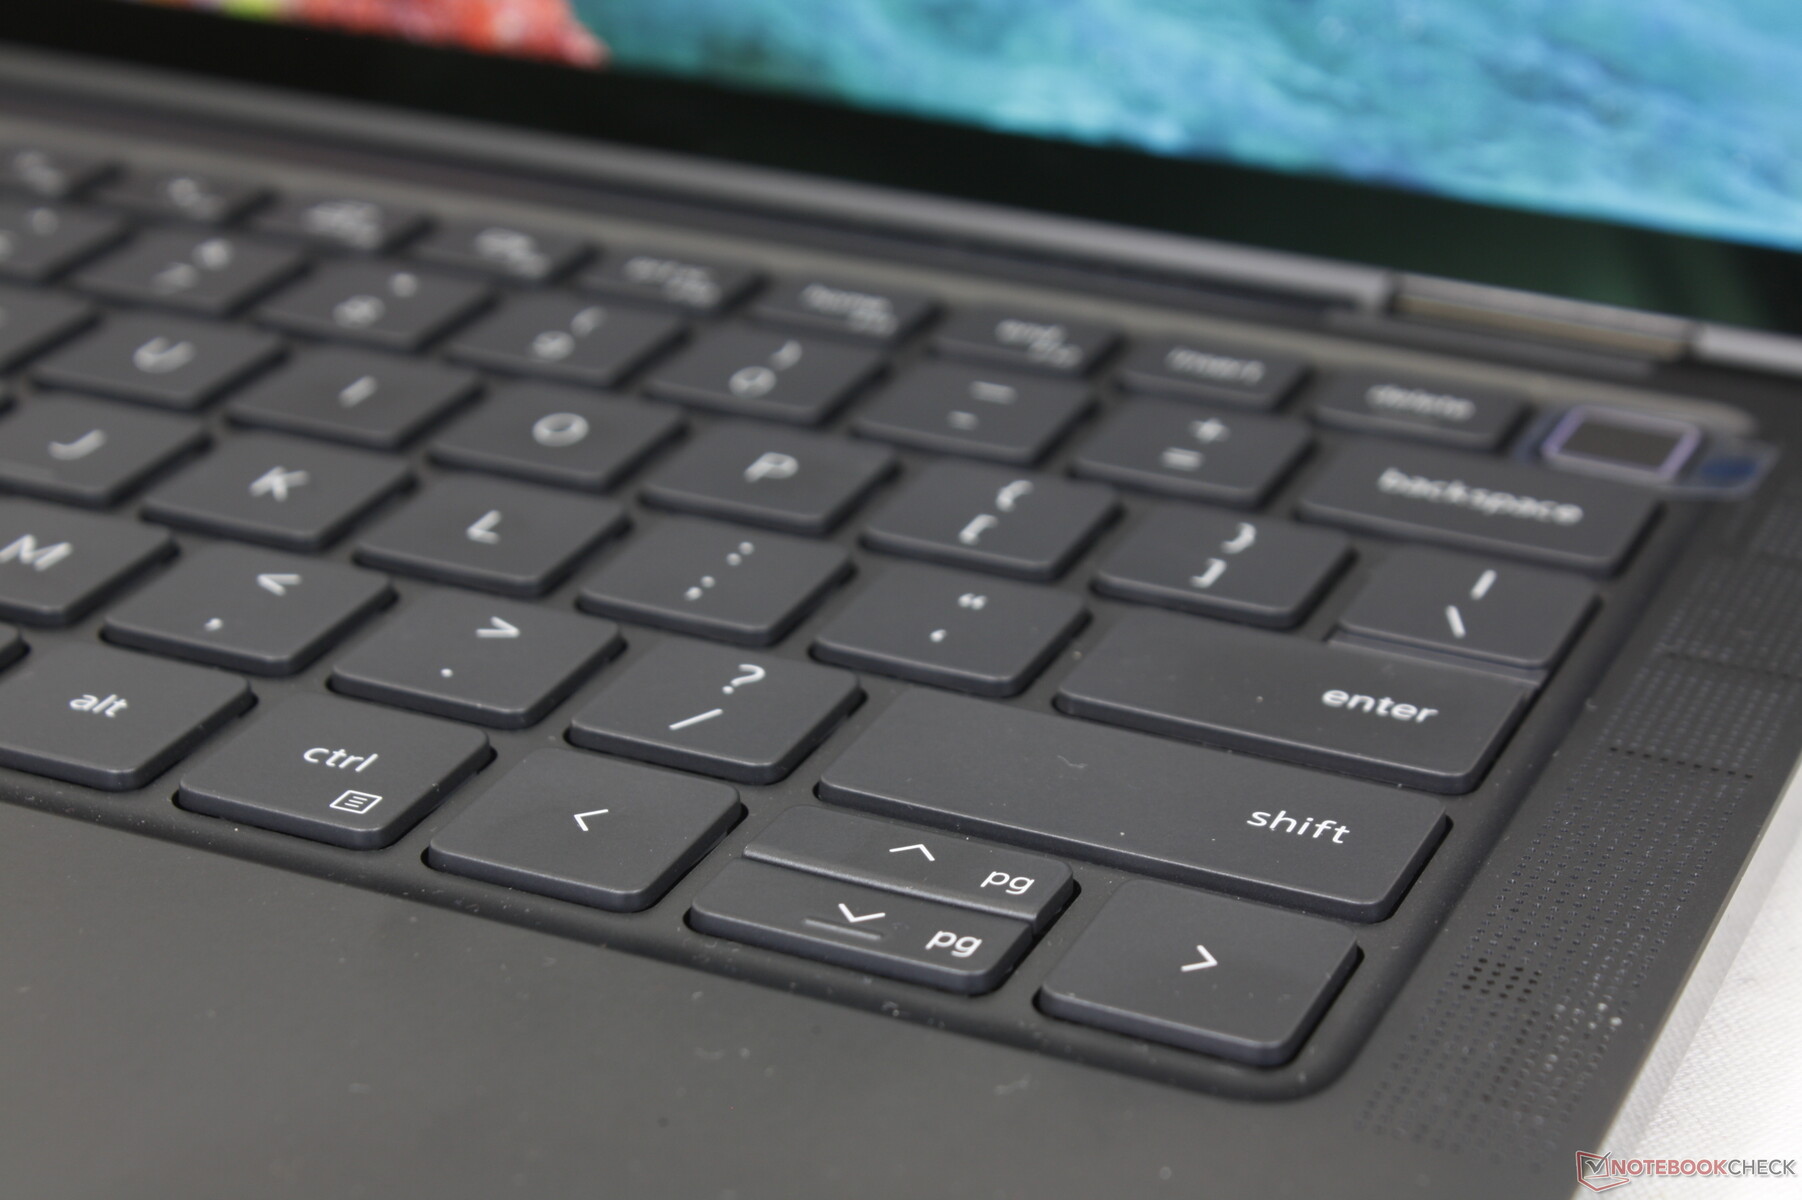
Input Devices — Comfortable Keyboard And A Spongy Clickpad
Keyboard
The keys on the Latitude 9330 are firmer and with stronger feedback than the keys on the XPS 13 9315 series for a more comfortable typing experience. They are more comparable to the keys on the Spectre or EliteBook series as opposed to the keys on cheaper consumer-based subnotebooks. Clatter is moderately loud, however, which is a consequence of the sharper feedback.
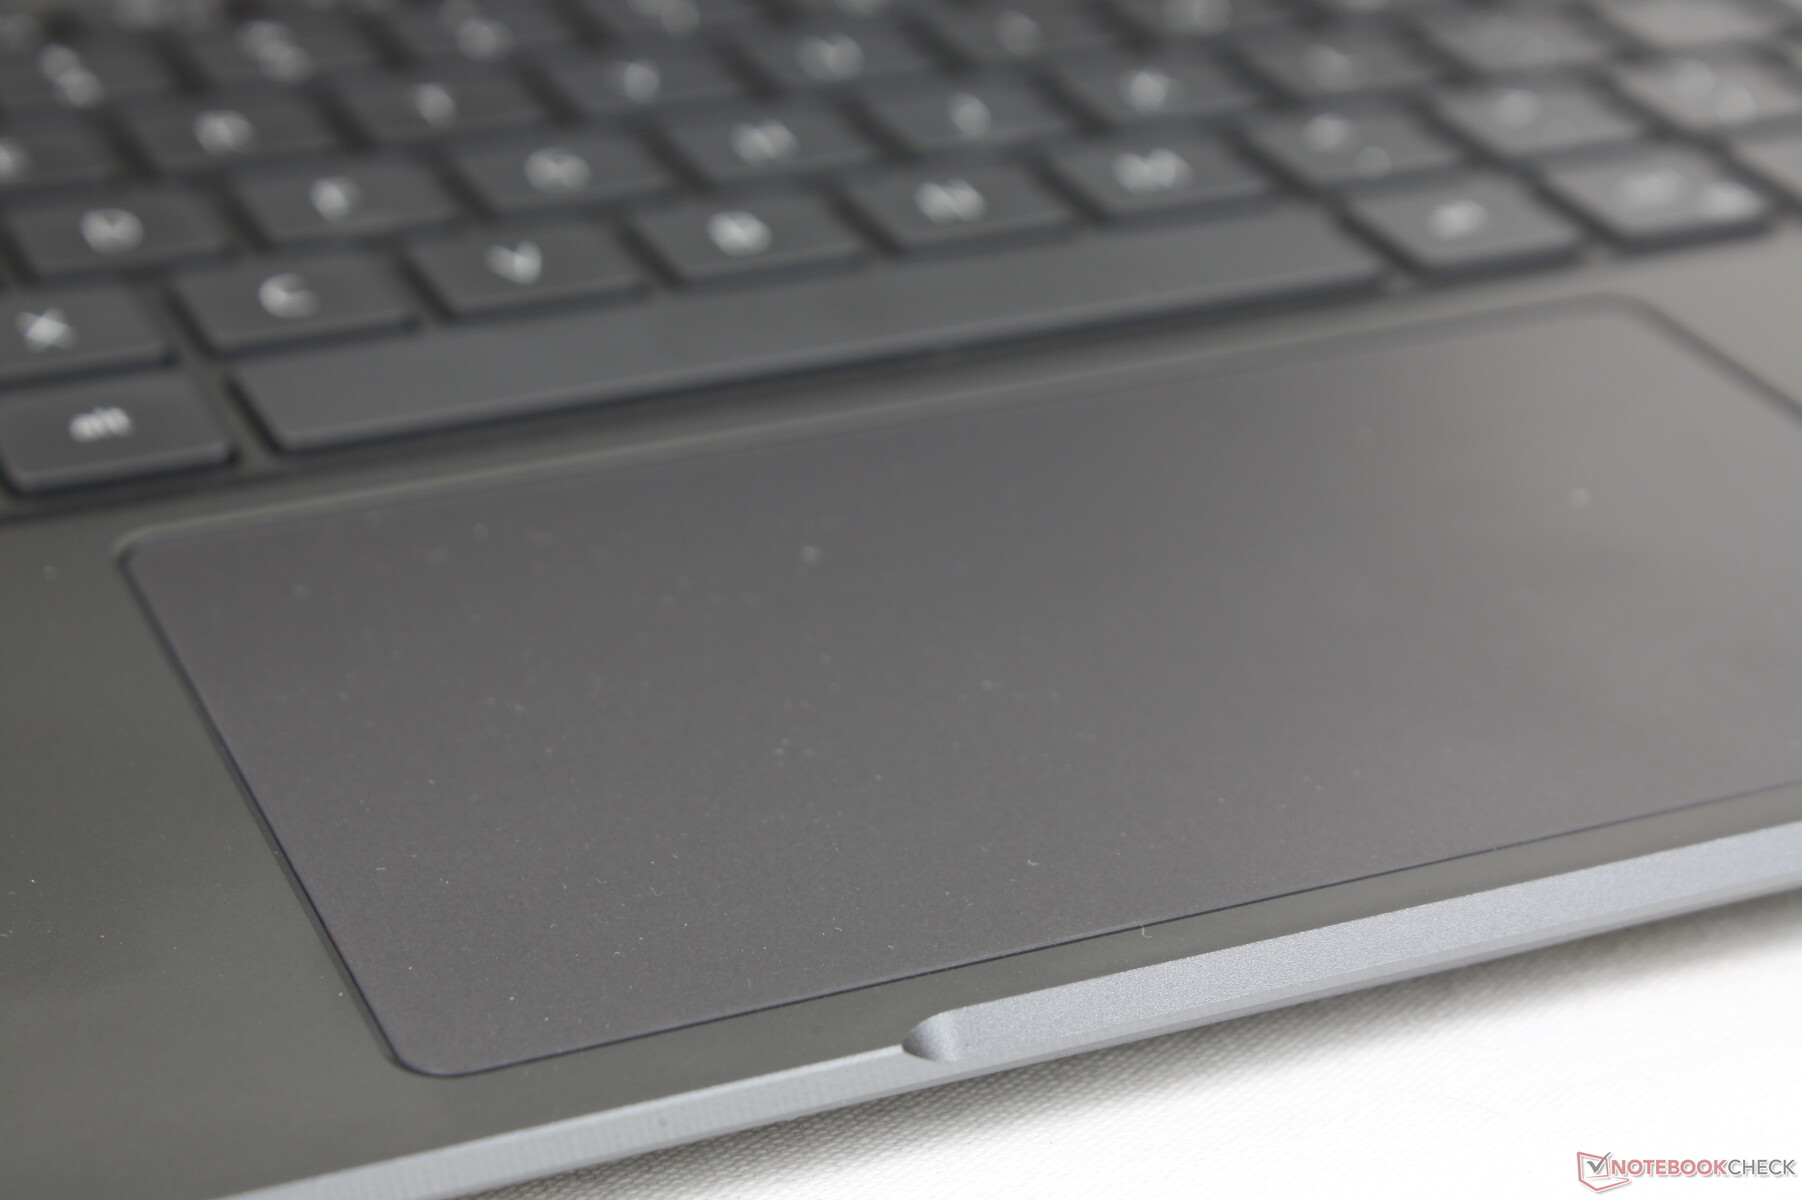
Touchpad
The clickpad is larger than the one on the ThinkPad X1 Titanium Yoga (11.5 x 6.8 cm vs. 9 x 6.5 cm) to make multi-touch inputs easier despite the small 13-inch form factor. On the flip side, there are no dedicated mouse buttons and so drag-and-drop actions are more difficult to perform. Its surface is completely smooth with only a bit of sticking at slower speeds for more accurate clicks.
Feedback when clicking on the clickpad is softer and quieter than on most other laptops. While some may appreciate the absence of a loud "click" when pressed, the spongy feedback isn't very satisfying.
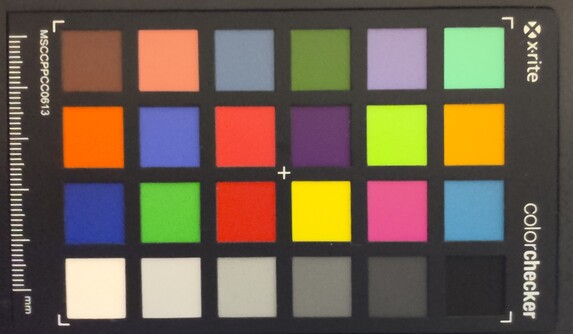
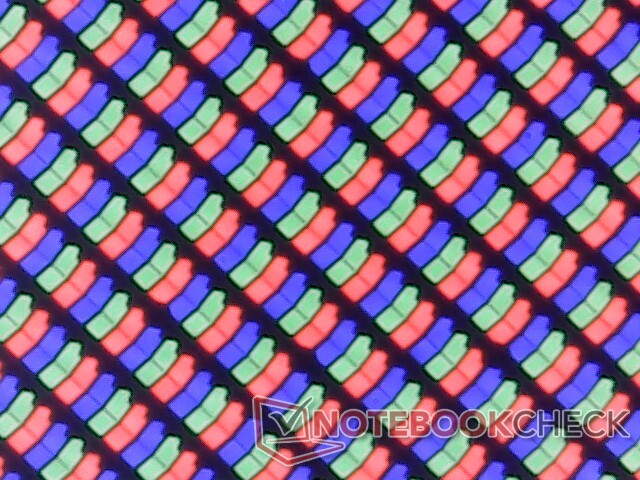
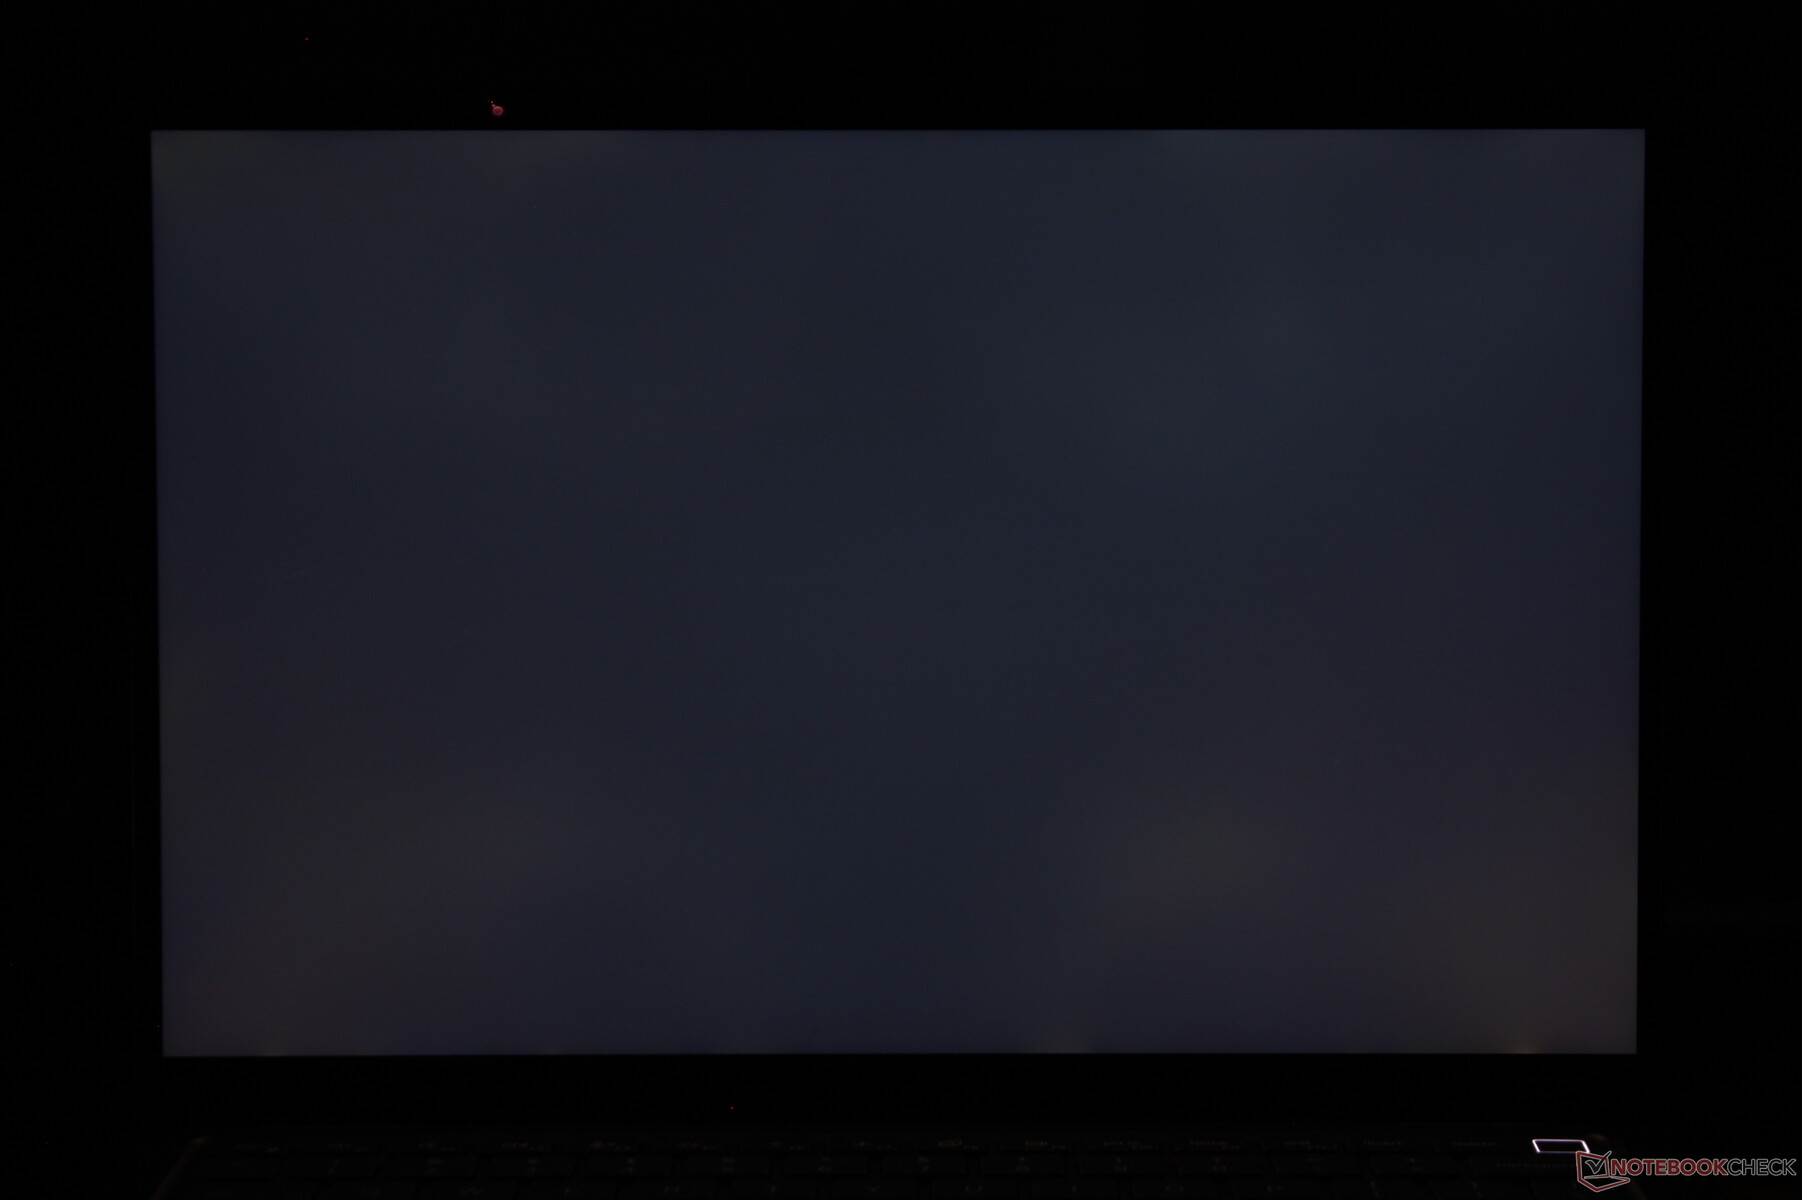
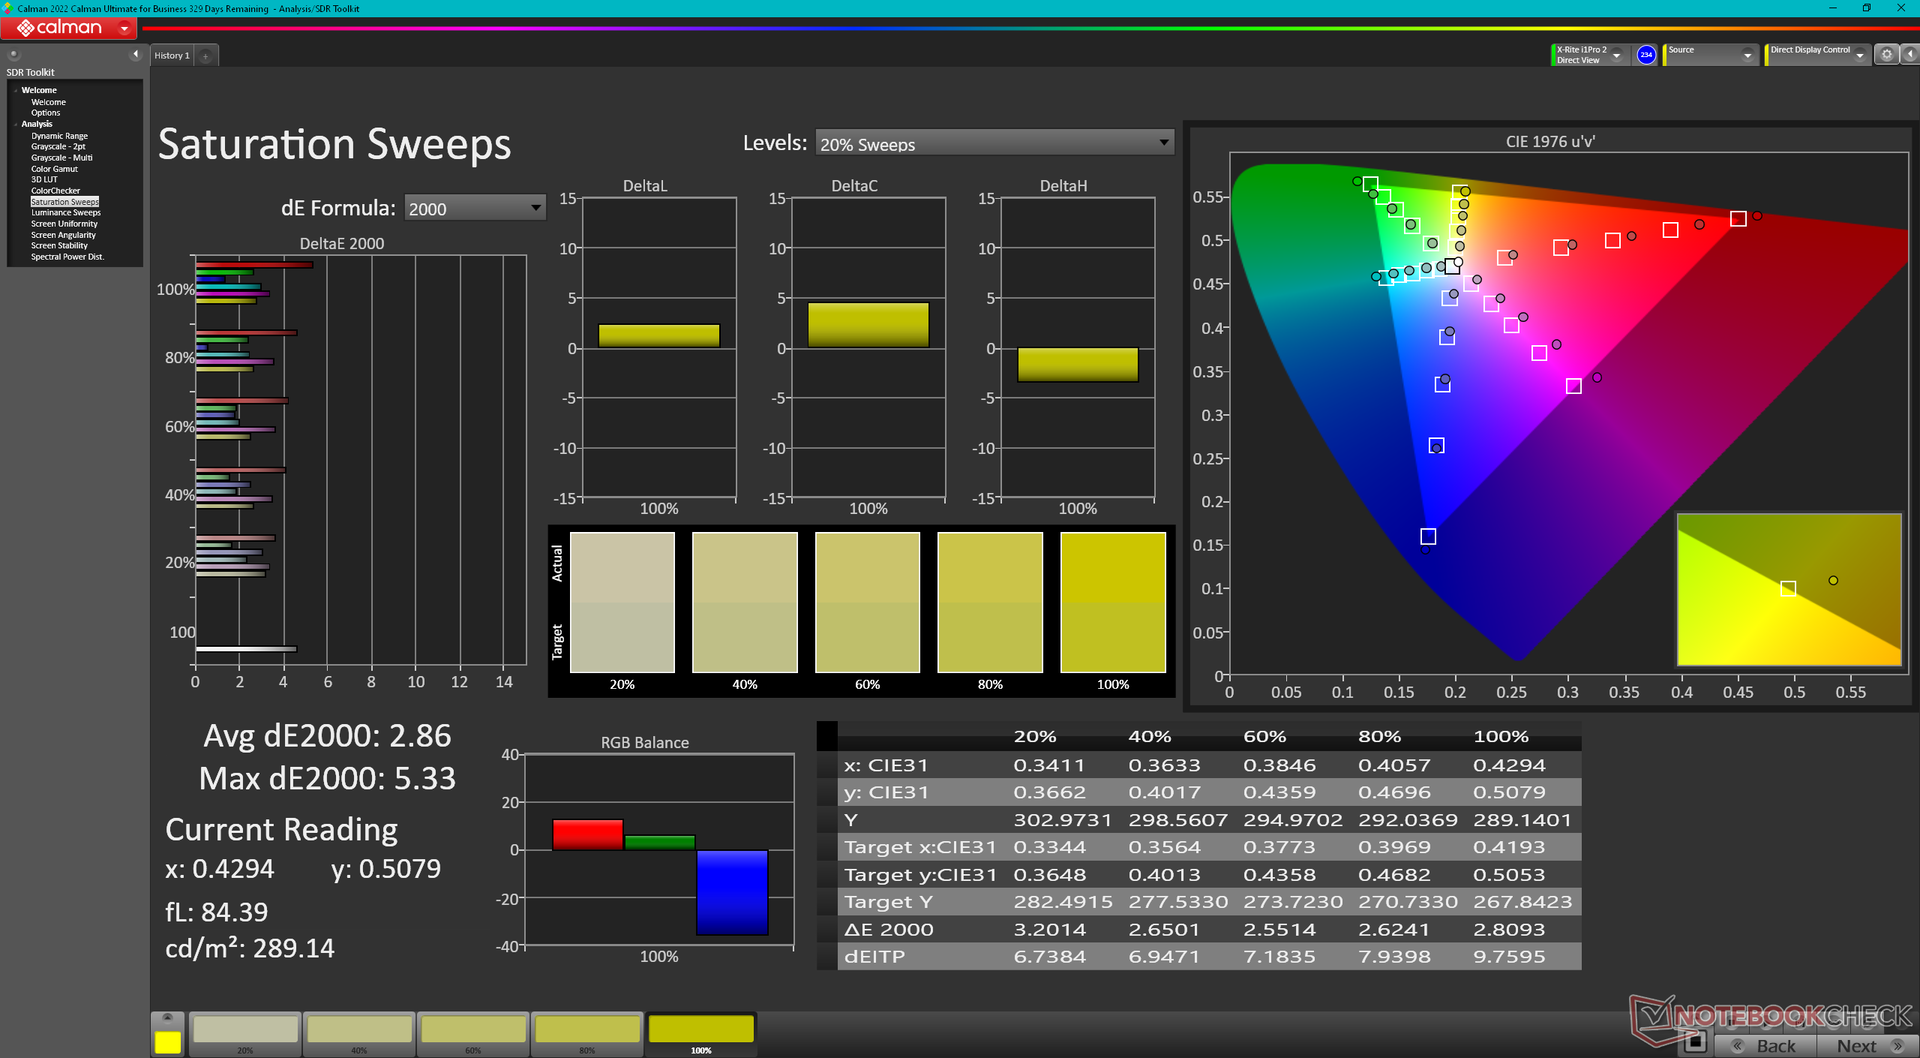
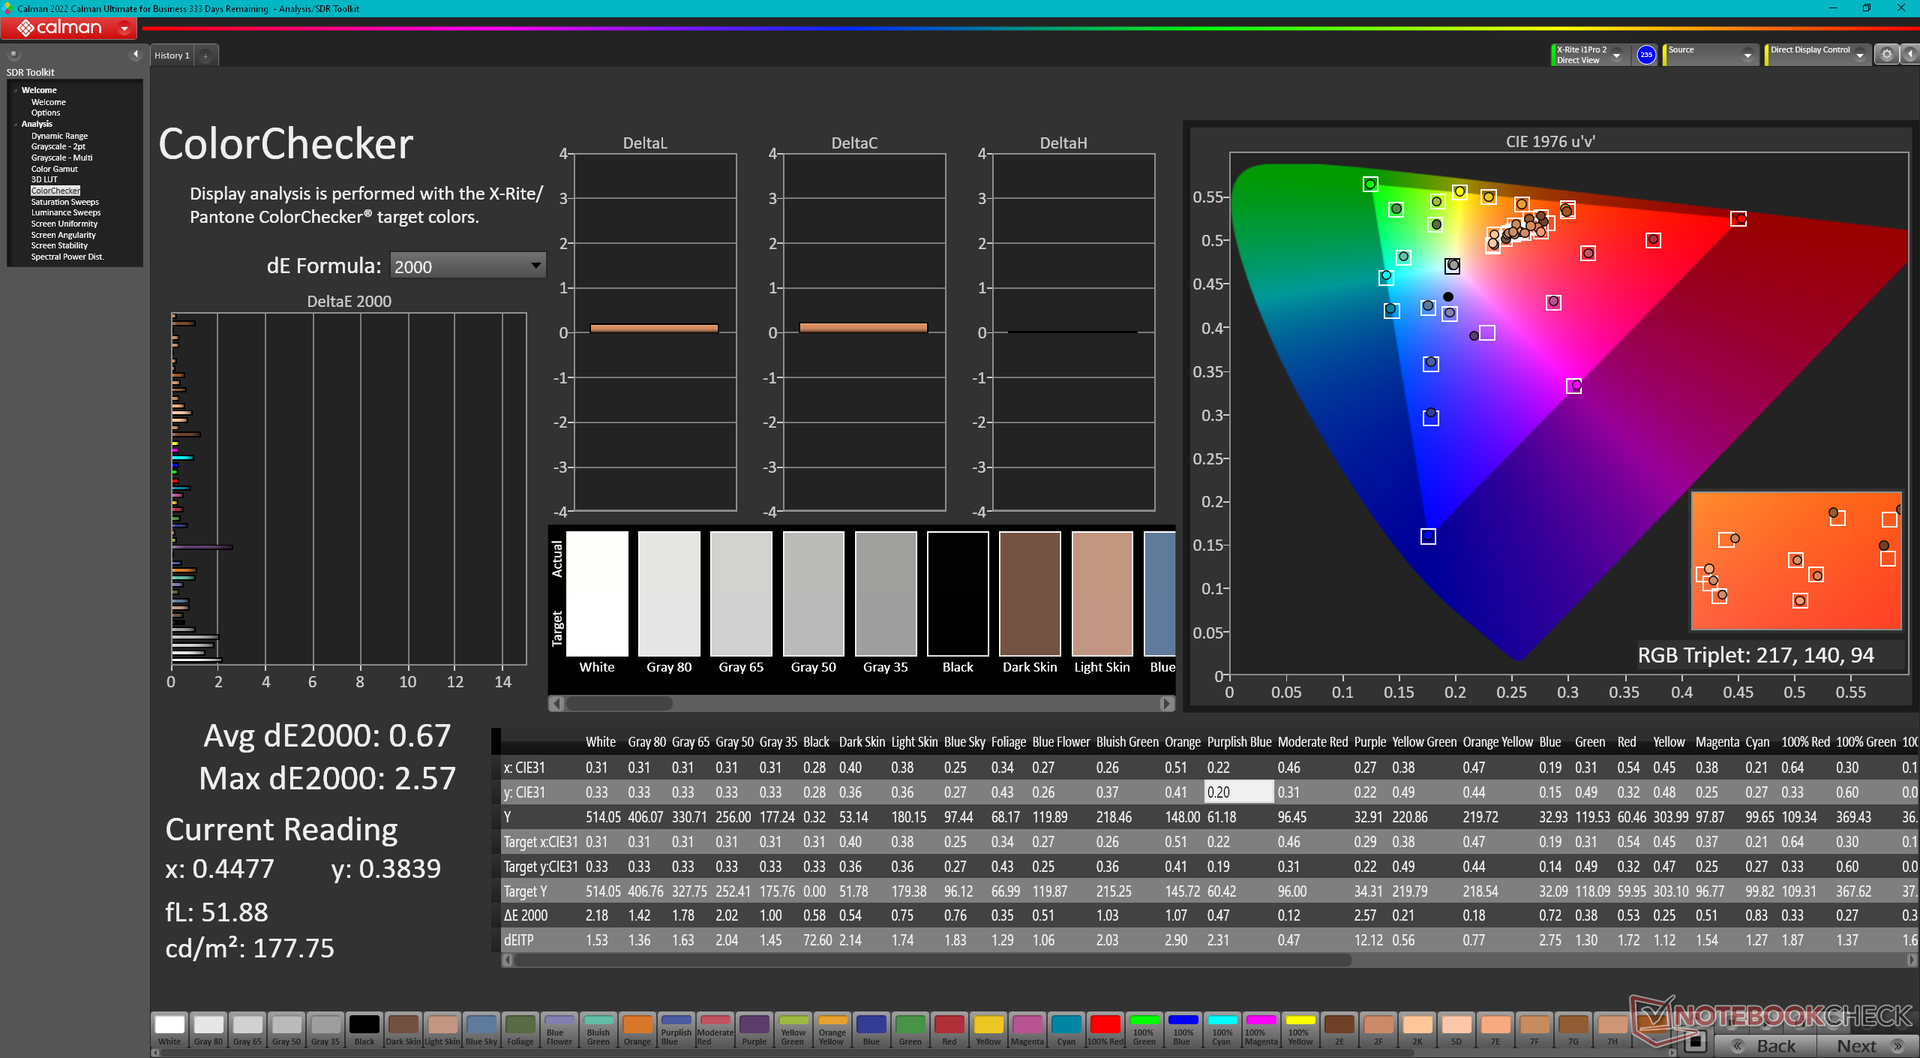
Display — 100% sRGB, 500-nit IPS Touchscreen
Dell advertises a 500-nit touchscreen with full sRGB coverage which we can confirm with our independent measurements. This is a high-end display with similar brightness and contrast levels as the display on the MSI Summit E13 Flip.
The two biggest drawbacks to the display are the very slow black-white response times and limited 60 Hz refresh rate. Though this isn't a gaming machine, the ghosting is hard to overlook even when web browsing while the 60 Hz refresh rate is starting to show its age. A higher refresh rate would have improved touchscreen responsiveness as well.
There are no options for anything brighter or with wider P3 colors since all Latitude 9330 SKUs come with the exact same AU Optronics panel at the moment.
| |||||||||||||||||||||||||
Brightness Distribution: 85 %
Center on Battery: 542.3 cd/m²
Contrast: 1427:1 (Black: 0.38 cd/m²)
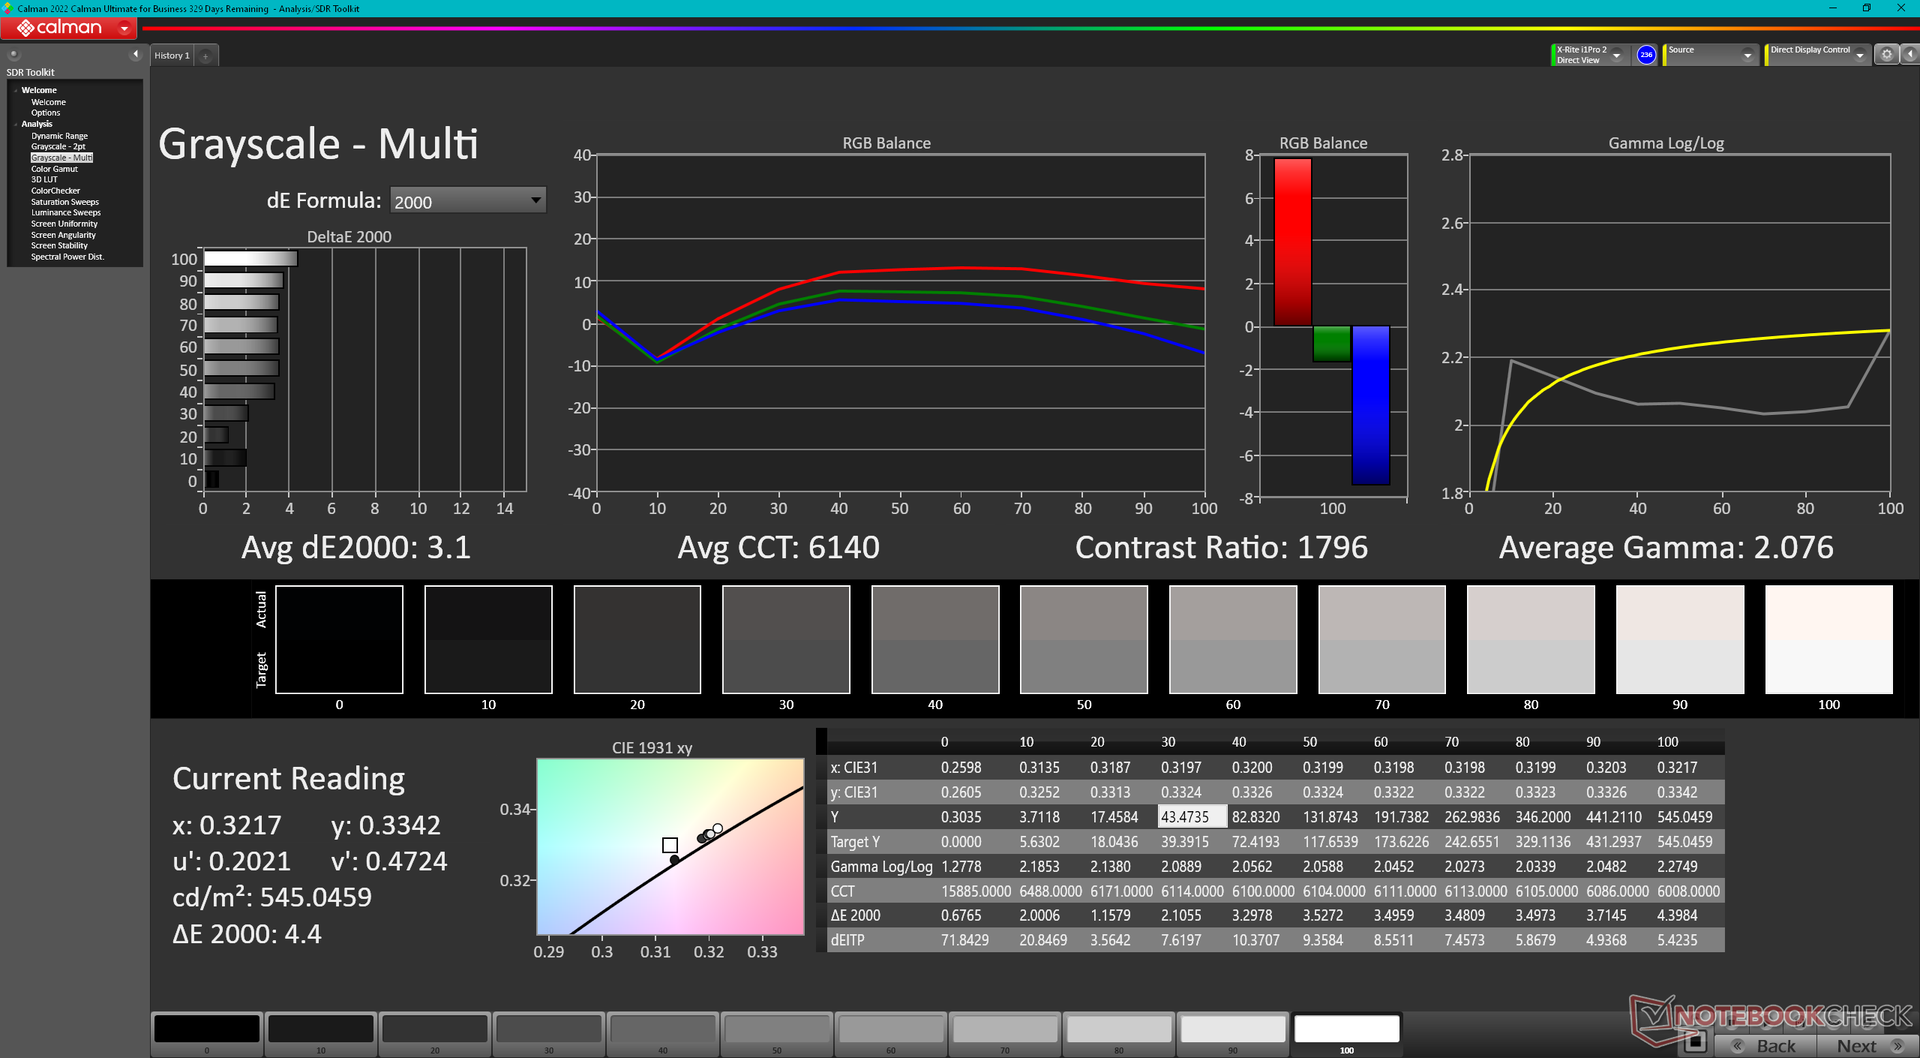
ΔE Color 3.18 | 0.5-29.43 Ø5, calibrated: 0.67
ΔE Greyscale 3.1 | 0.57-98 Ø5.3
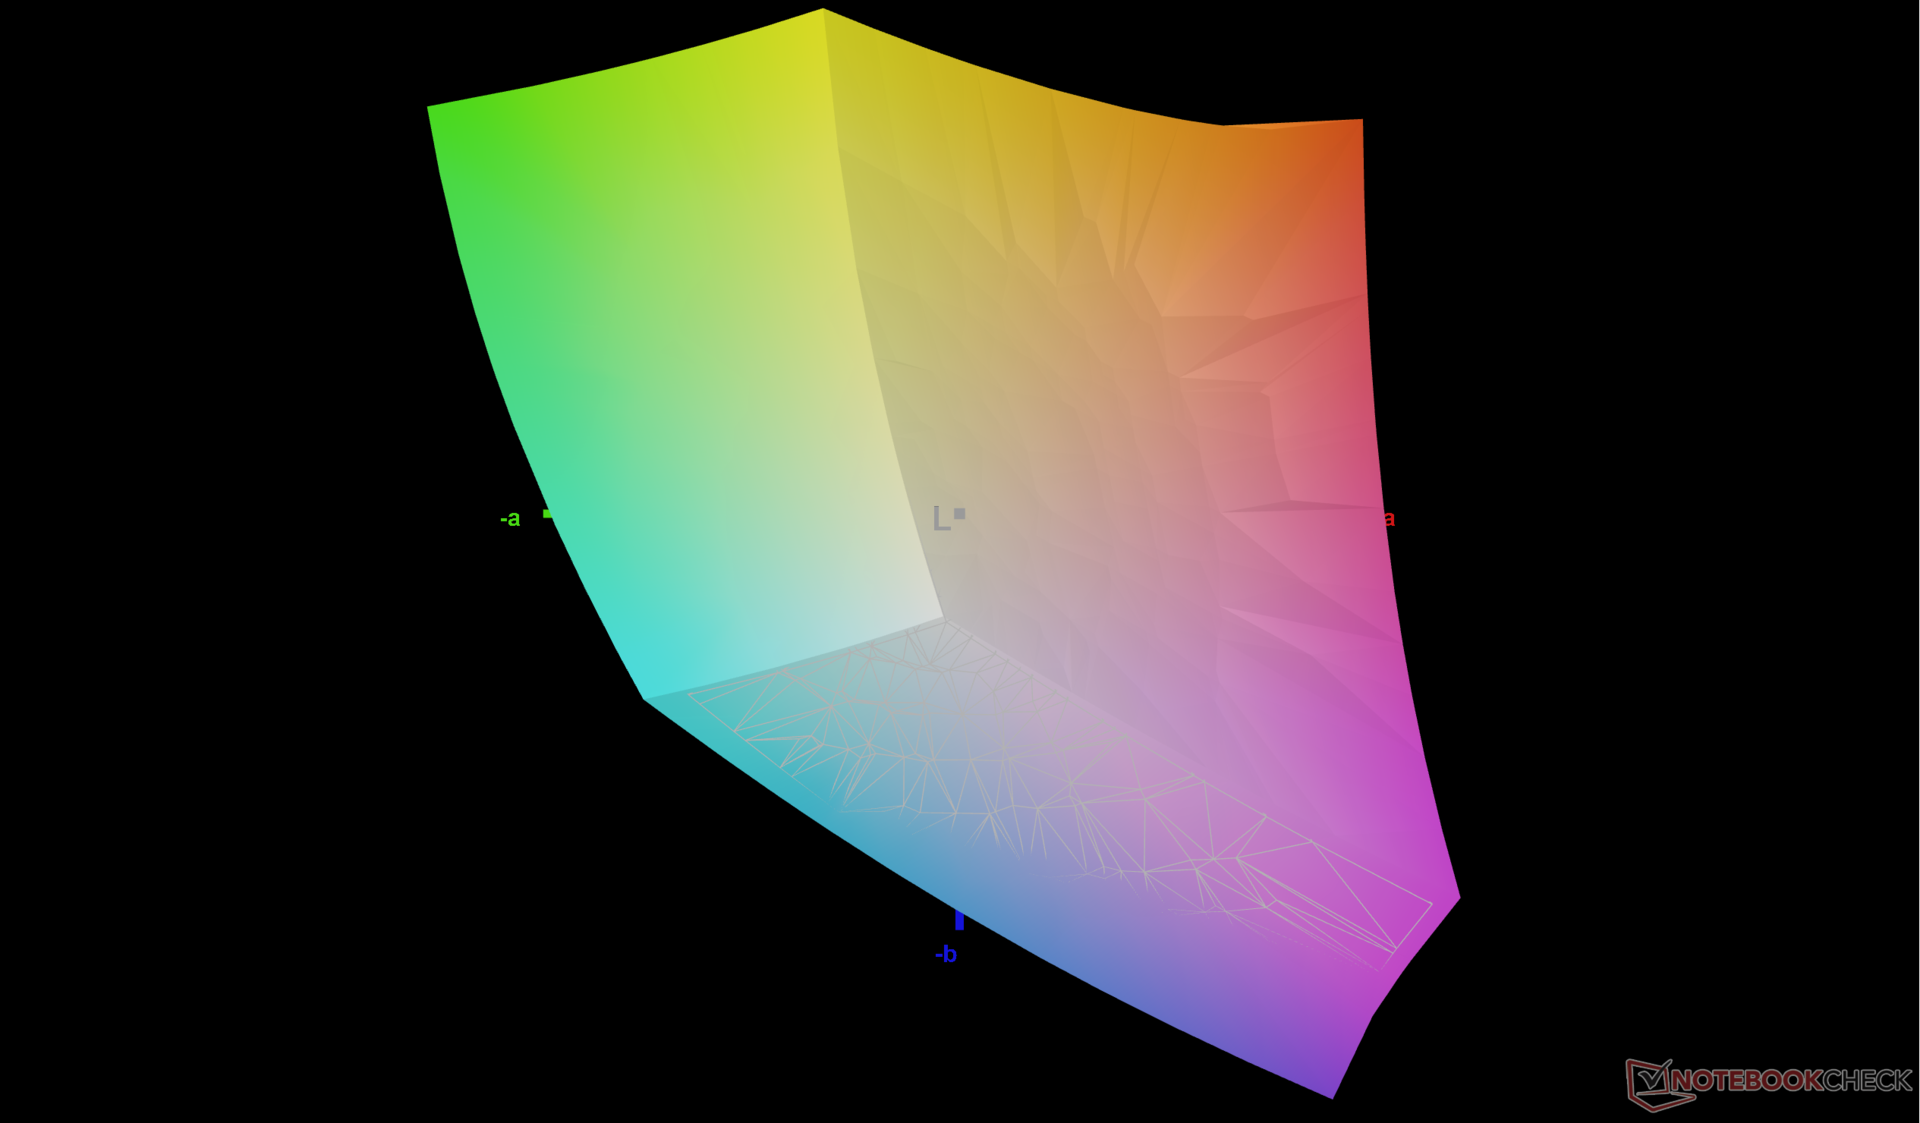
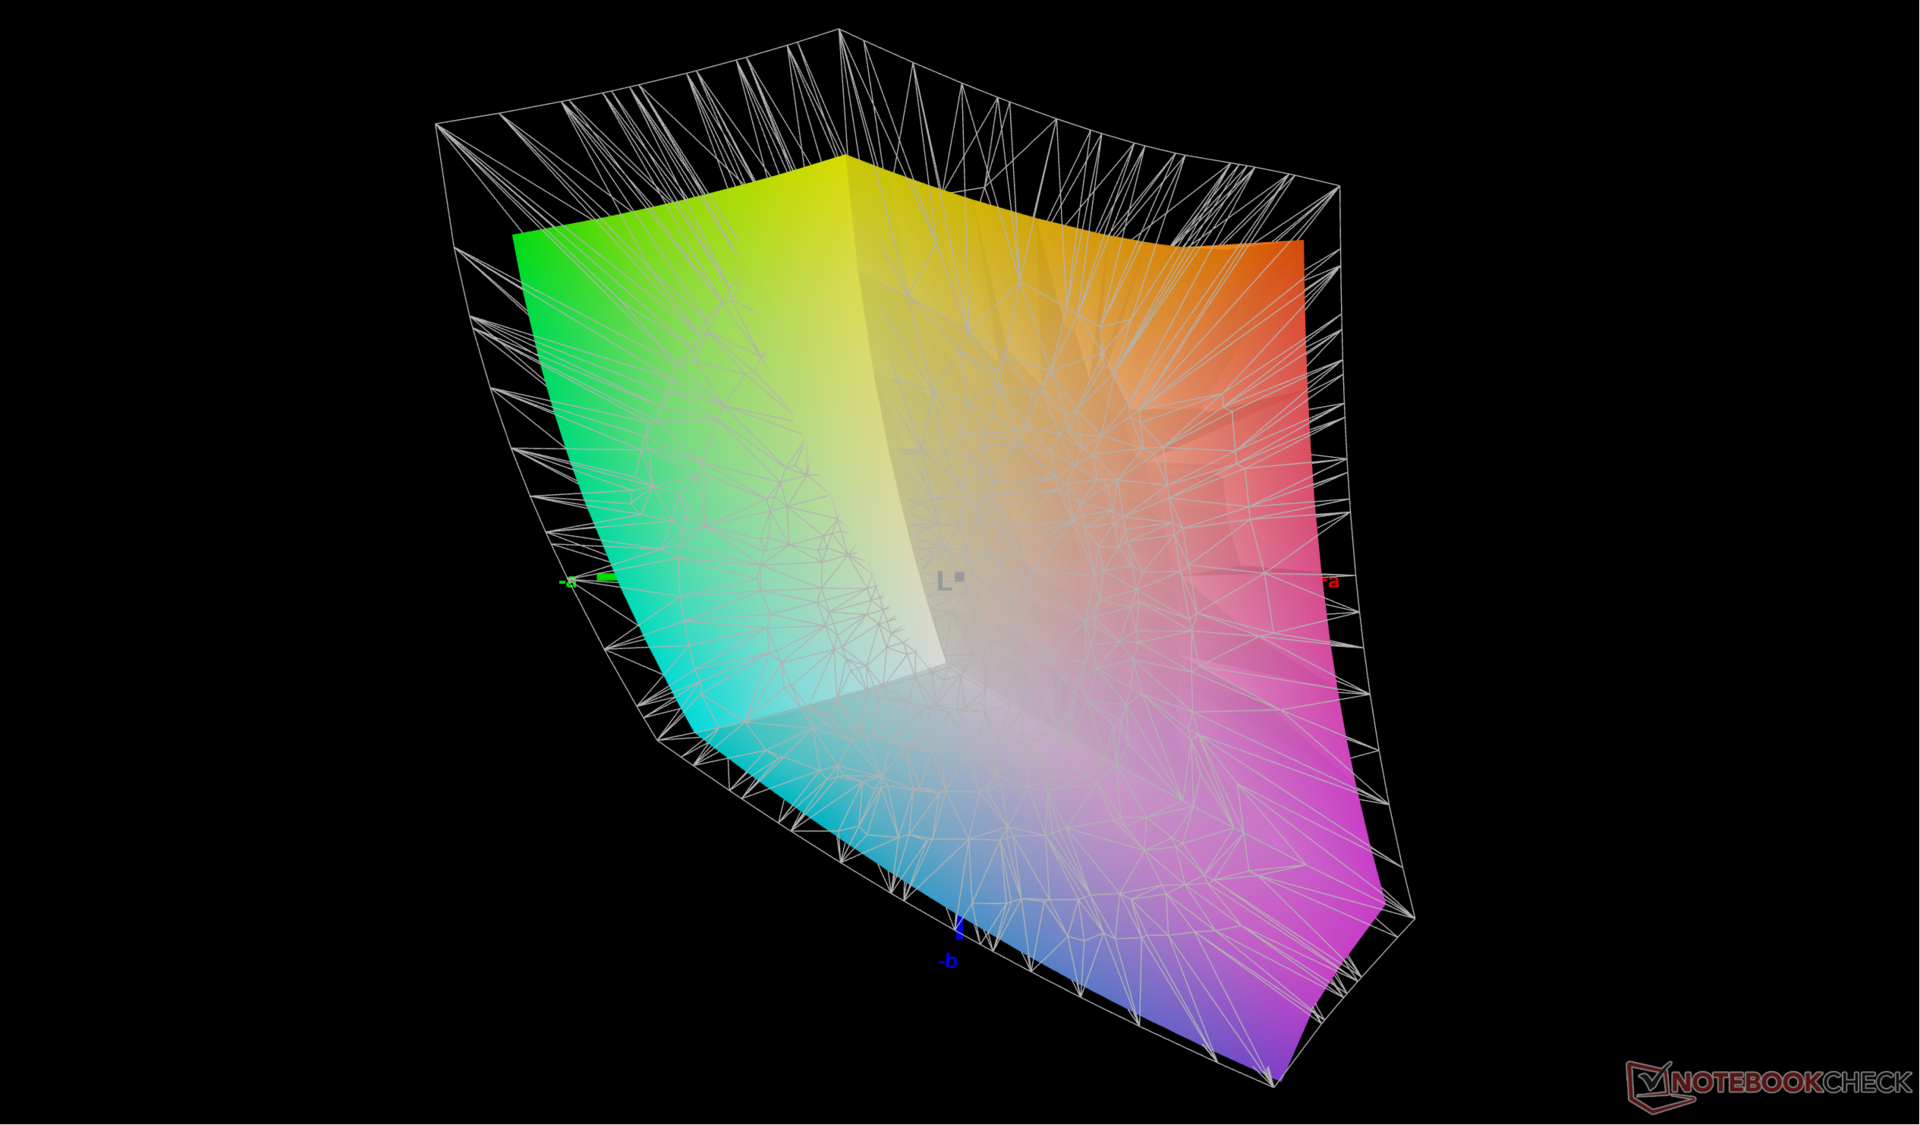
77.5% AdobeRGB 1998 (Argyll 2.2.0 3D)
99.9% sRGB (Argyll 2.2.0 3D)
77.8% Display P3 (Argyll 2.2.0 3D)
Gamma: 2.08
| Dell Latitude 9330 AU Optronics B133QAA, IPS, 2560x1600, 13.30 | Lenovo ThinkPad X1 Titanium Yoga G1 20QB0016GE LPM135M467, IPS LED, 2256x1504, 13.50 | MSI Summit E13 Flip Evo A11MT Sharp LQ134N1JW53, IPS, 1920x1200, 13.40 | HP EliteBook x360 1030 G7 Chi Mei CMN13A9, IPS, 1920x1080, 13.30 | HP Elite Dragonfly Max InfoVision X133NVFL R0, IPS, 1920x1080, 13.30 | Dell Latitude 5310-23VP6 Chi Mei CMN1382, IPS, 1920x1080, 13.30 | |
|---|---|---|---|---|---|---|
| Display | -9% | -7% | -10% | -8% | ||
| Display P3 Coverage | 77.8 | 66.8 -14% | 69.8 -10% | 66.1 -15% | 67.5 -13% | |
| sRGB Coverage | 99.9 | 98 -2% | 98.8 -1% | 97 -3% | 99 -1% | |
| AdobeRGB 1998 Coverage | 77.5 | 68.6 -11% | 70.6 -9% | 67.7 -13% | 69.2 -11% | |
| Response Times | 9% | 9% | 25% | 36% | 50% | |
| Response Time Grey 50% / Grey 80% * | 67.6 ? | 64 ? 5% | 64 ? 5% | 56.4 ? 17% | 44.8 ? 34% | 36 ? 47% |
| Response Time Black / White * | 50.4 ? | 44 ? 13% | 44 ? 13% | 34.4 ? 32% | 32 ? 37% | 24 ? 52% |
| PWM Frequency | 26040 ? | 2500 ? | ||||
| Screen | 9% | 3% | -25% | 10% | 2% | |
| Brightness middle | 542.3 | 465 -14% | 551.3 2% | 425.4 -22% | 777.5 43% | 383 -29% |
| Brightness | 516 | 451 -13% | 517 0% | 407 -21% | 727 41% | 364 -29% |
| Brightness Distribution | 85 | 92 8% | 91 7% | 89 5% | 75 -12% | 84 -1% |
| Black Level * | 0.38 | 0.28 26% | 0.37 3% | 0.28 26% | 0.44 -16% | 0.34 11% |
| Contrast | 1427 | 1661 16% | 1490 4% | 1519 6% | 1767 24% | 1126 -21% |
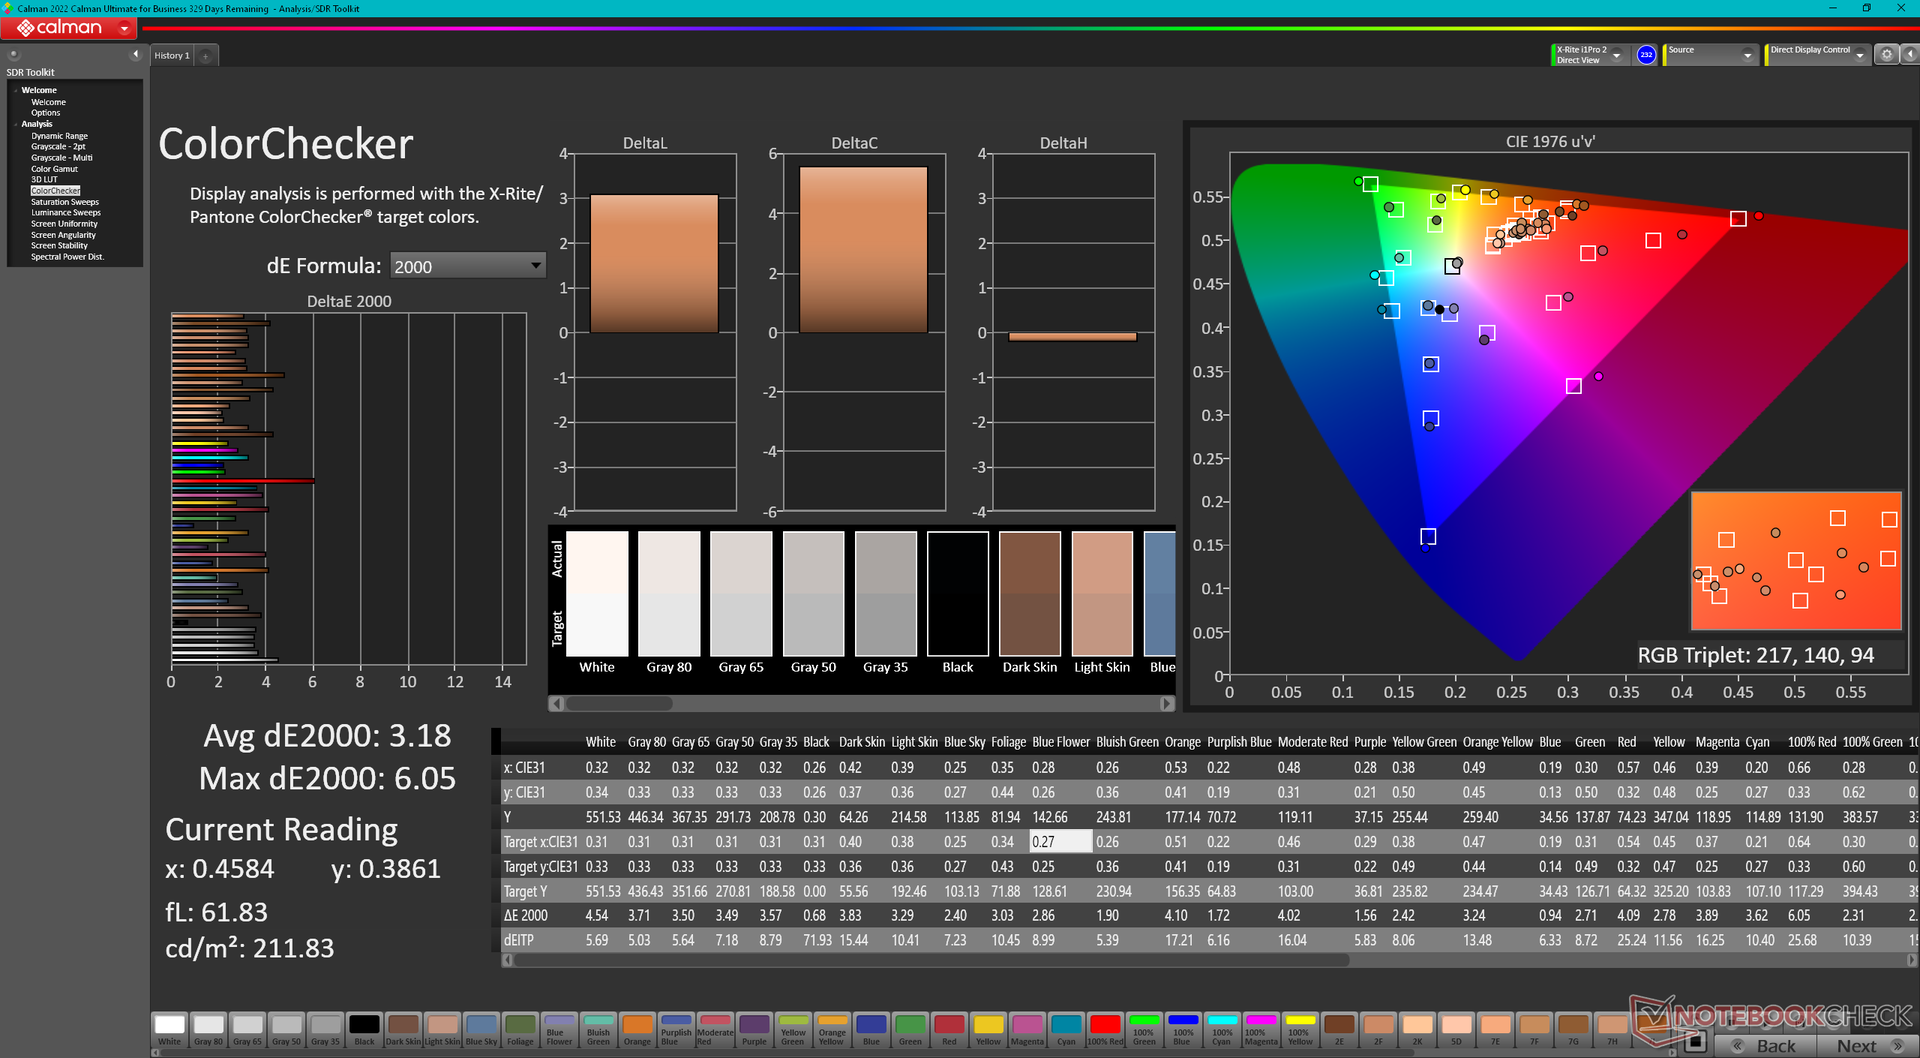
| Colorchecker dE 2000 * | 3.18 | 2 37% | 1.45 54% | 4.39 -38% | 1.62 49% | 2.24 30% |
| Colorchecker dE 2000 max. * | 6.05 | 4.7 22% | 2.86 53% | 6.73 -11% | 5.26 13% | 3.32 45% |
| Colorchecker dE 2000 calibrated * | 0.67 | 0.7 -4% | 1.7 -154% | 1.65 -146% | 1.32 -97% | 0.72 -7% |
| Greyscale dE 2000 * | 3.1 | 2.9 6% | 1.3 58% | 3.9 -26% | 1.6 48% | 2.42 22% |
| Gamma | 2.08 106% | 2.09 105% | 2.14 103% | 1.87 118% | 2.2 100% | 2.65 83% |
| CCT | 6140 106% | 6181 105% | 6580 99% | 6758 96% | 6538 99% | 6776 96% |
| Color Space (Percent of AdobeRGB 1998) | 65 | 61.7 | 72.3 | 56 | ||
| Color Space (Percent of sRGB) | 99 | 96.6 | 94.8 | 99 | ||
| Total Average (Program / Settings) | 3% /
5% | 2% /
2% | -3% /
-15% | 23% /
15% | 15% /
7% |
* ... smaller is better
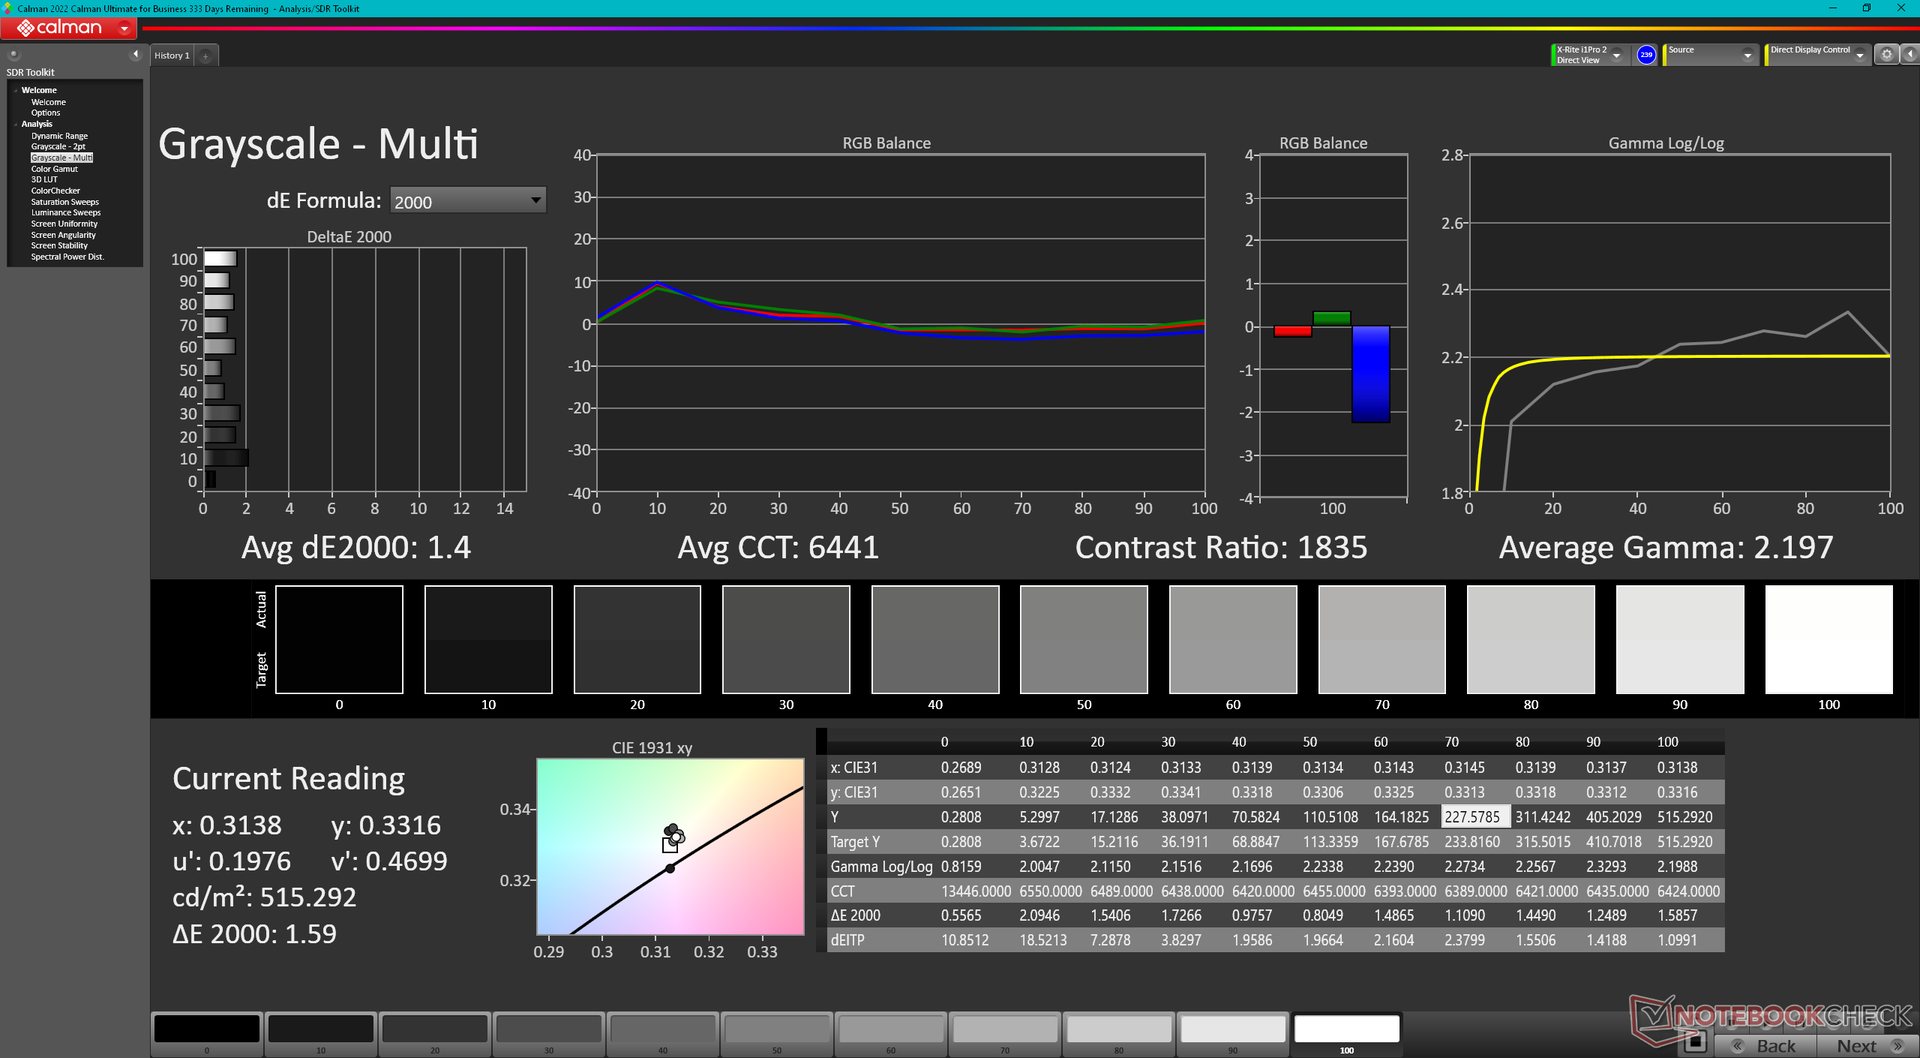
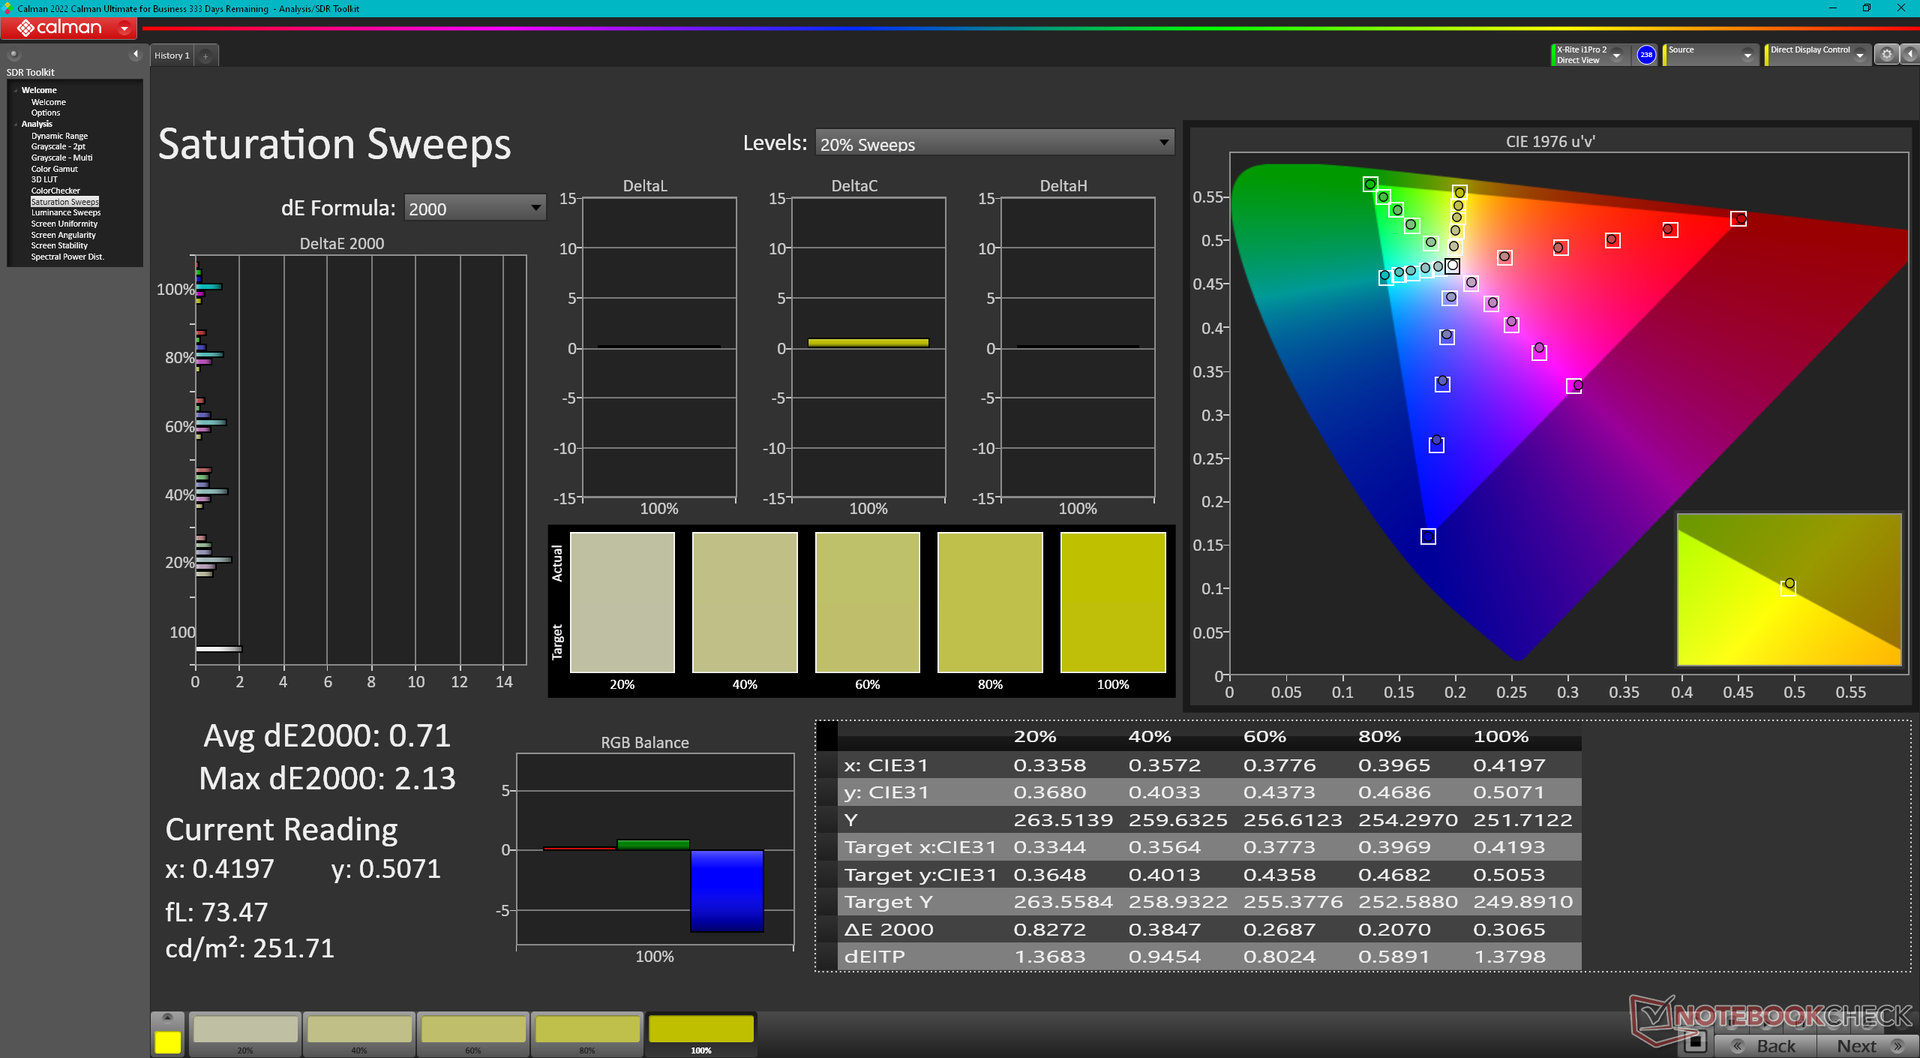
The display does not come pre-calibrated which is disappointing for a laptop retailing well over $2000 USD. Calibrating the panel ourselves with an X-Rite colorimeter would improve average grayscale and color DeltaE values from 3.1 and 3.18 to just 1.4 and 0.67, respectively. Users can apply our ICM profile above to better exploit the full sRGB colors of the display.
Display Response Times
| ↔ Response Time Black to White | ||
|---|---|---|
| 50.4 ms ... rise ↗ and fall ↘ combined | ↗ 26.8 ms rise | 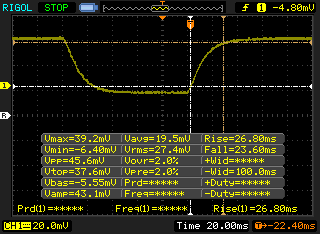 |
| ↘ 23.6 ms fall | ||
| The screen shows slow response rates in our tests and will be unsatisfactory for gamers. In comparison, all tested devices range from 0.1 (minimum) to 240 (maximum) ms. » 99 % of all devices are better. This means that the measured response time is worse than the average of all tested devices (21.5 ms). | ||
| ↔ Response Time 50% Grey to 80% Grey | ||
| 67.6 ms ... rise ↗ and fall ↘ combined | ↗ 34.8 ms rise | 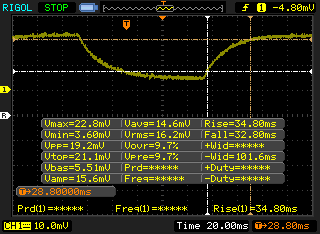 |
| ↘ 32.8 ms fall | ||
| The screen shows slow response rates in our tests and will be unsatisfactory for gamers. In comparison, all tested devices range from 0.2 (minimum) to 636 (maximum) ms. » 98 % of all devices are better. This means that the measured response time is worse than the average of all tested devices (33.7 ms). | ||
Screen Flickering / PWM (Pulse-Width Modulation)
| Screen flickering / PWM not detected | 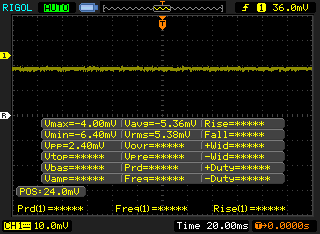 | ||
In comparison: 53 % of all tested devices do not use PWM to dim the display. If PWM was detected, an average of 17900 (minimum: 5 - maximum: 3846000) Hz was measured. | |||
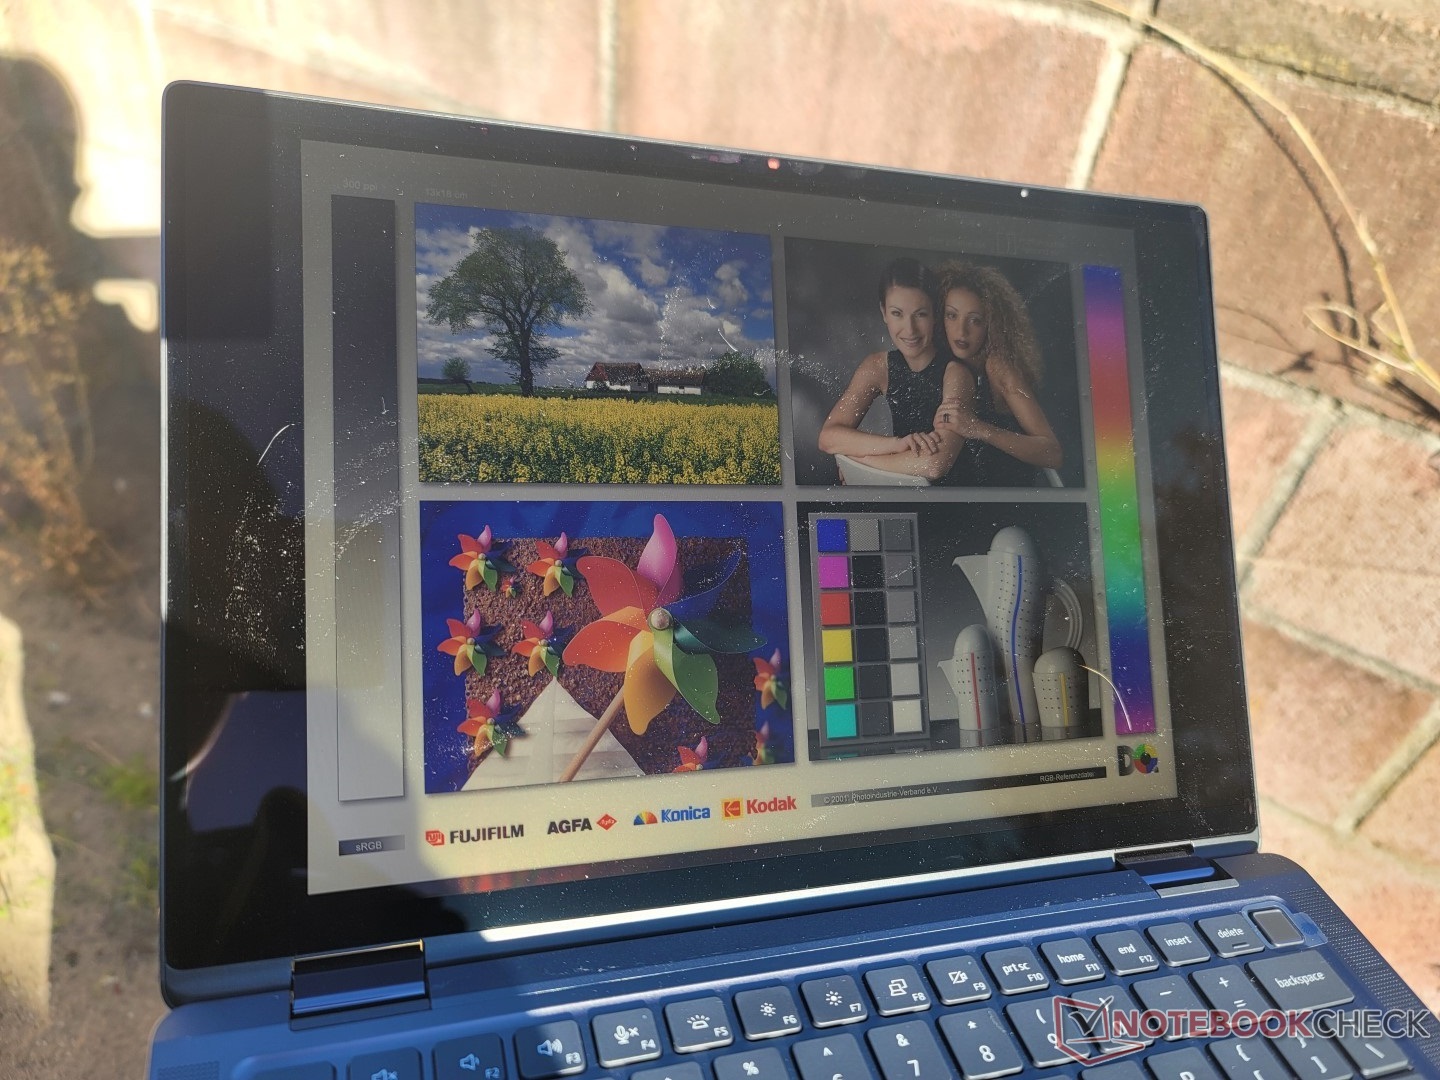
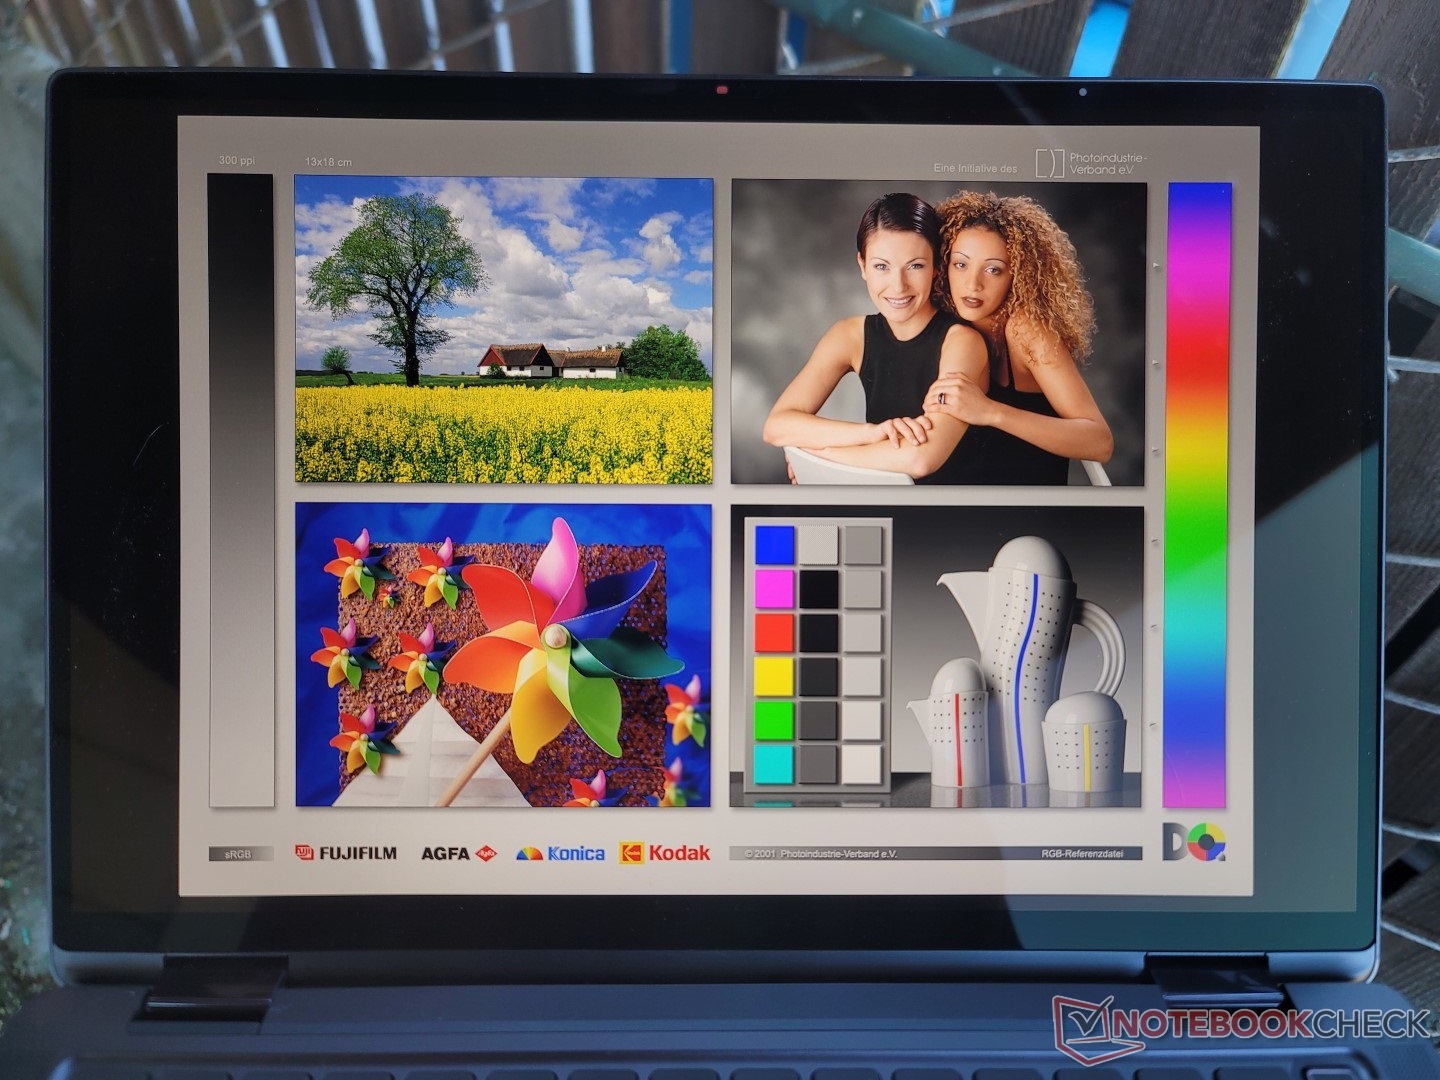
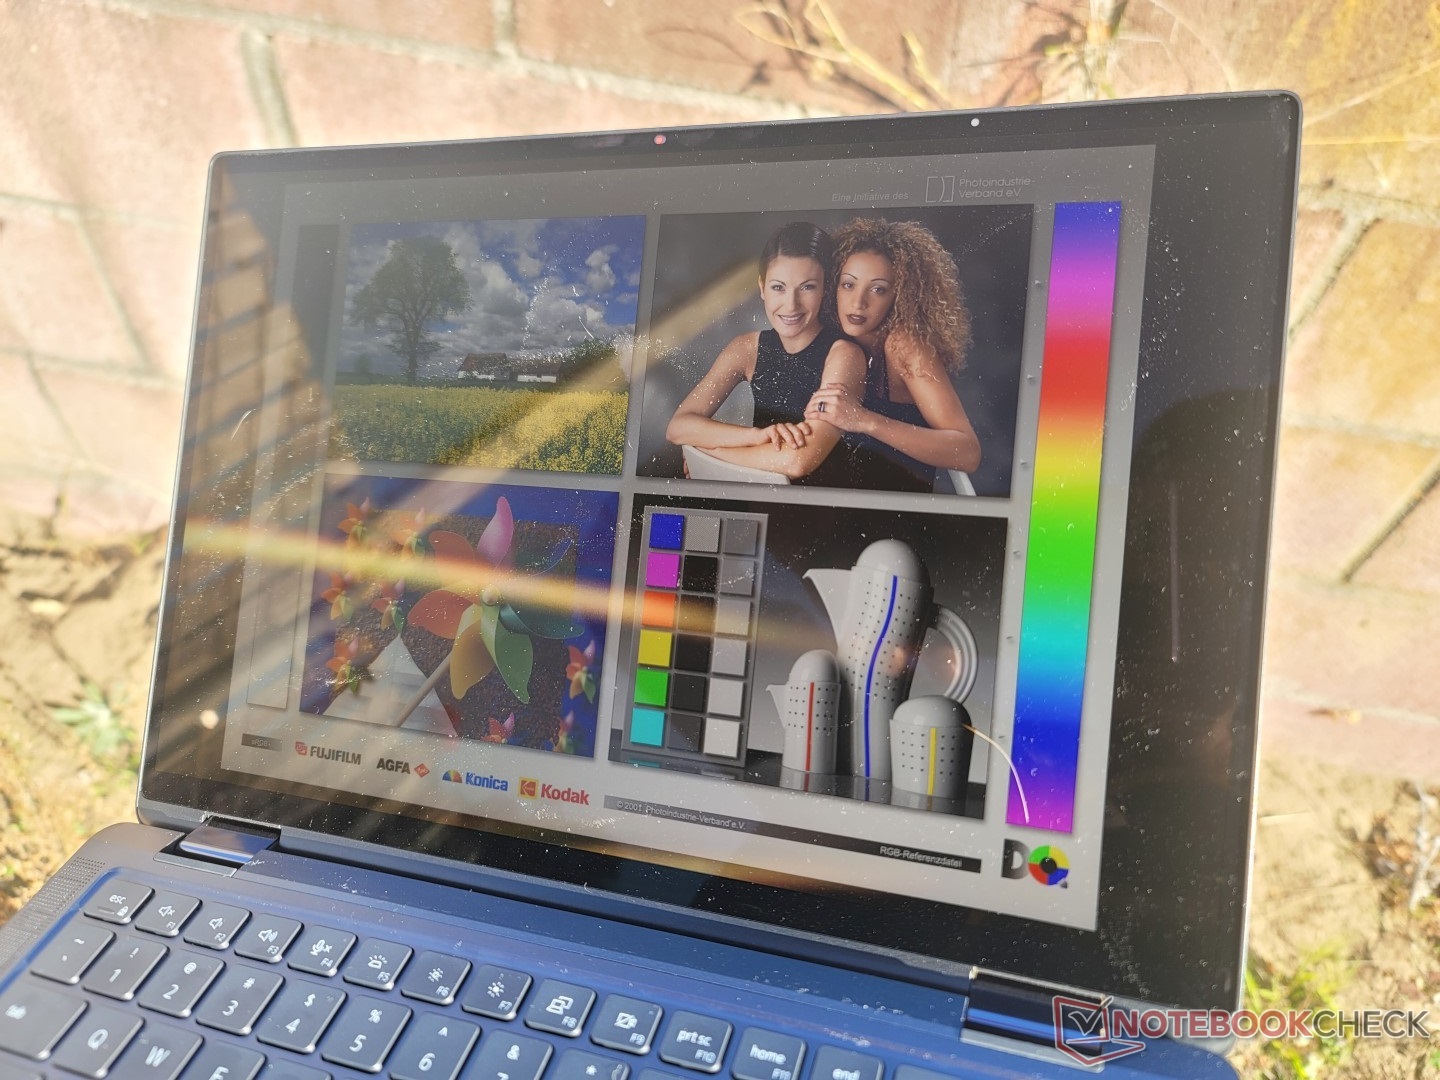
Outdoor visibility is good when under shade as the display is bright enough to overcome minor to moderate glare. Even so, direct sunlight should still be avoided whenever possible to optimize the viewing experience. The competing Dragonfly Max offers even brighter display options than the Latitude 9330 for more comfortable outdoor viewing.
Performance — 12th Gen Alder Lake-U
Testing Conditions
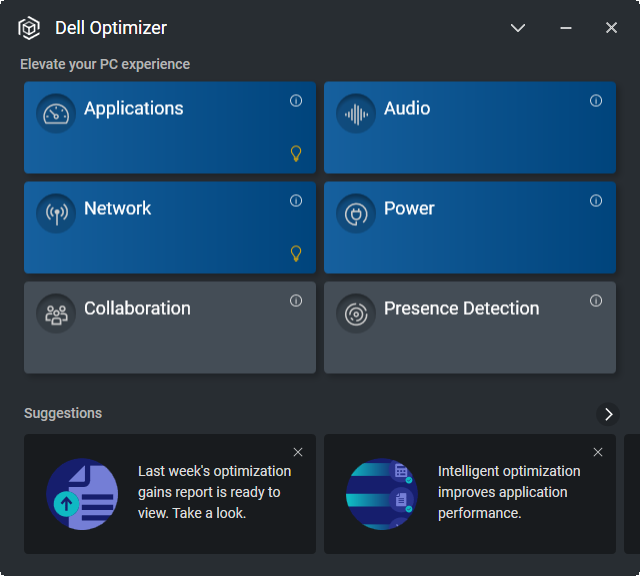
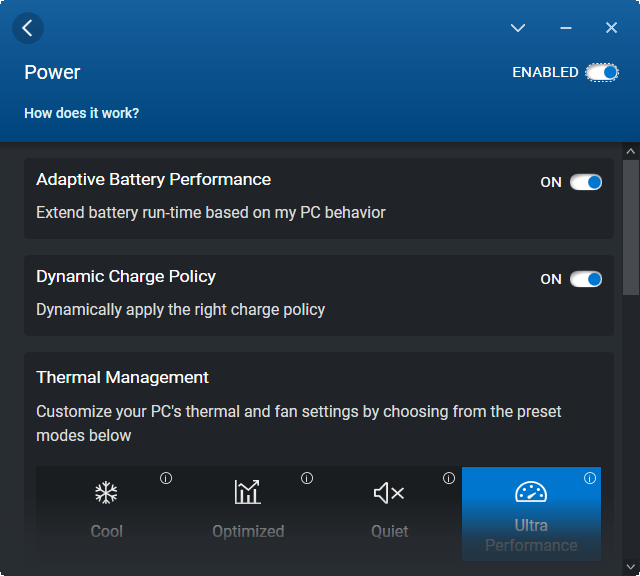
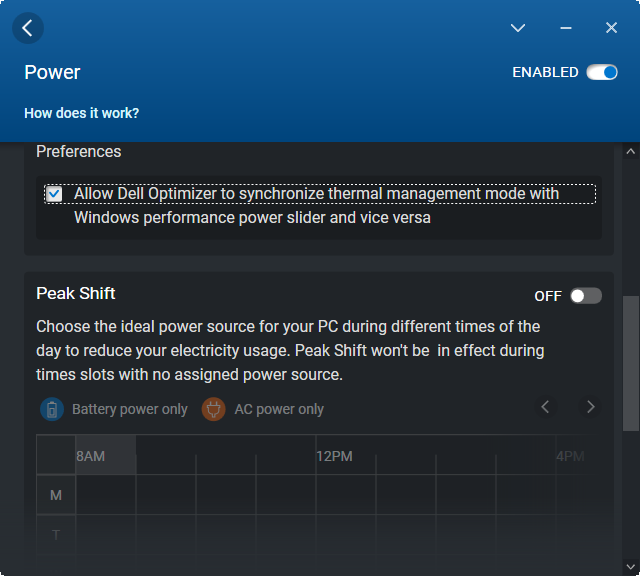
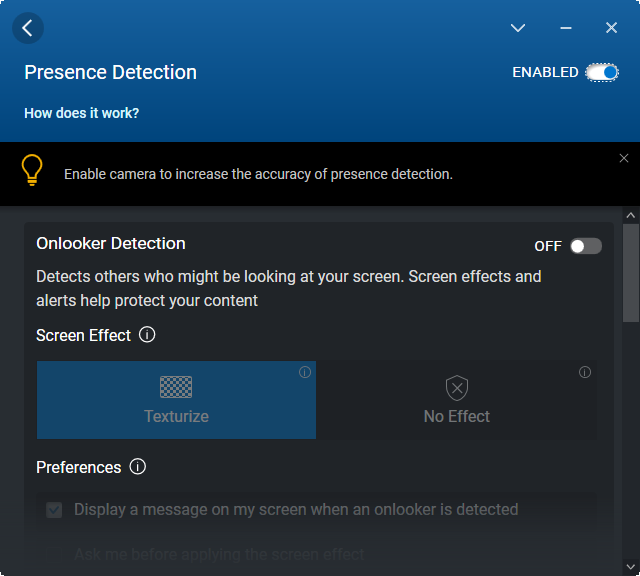
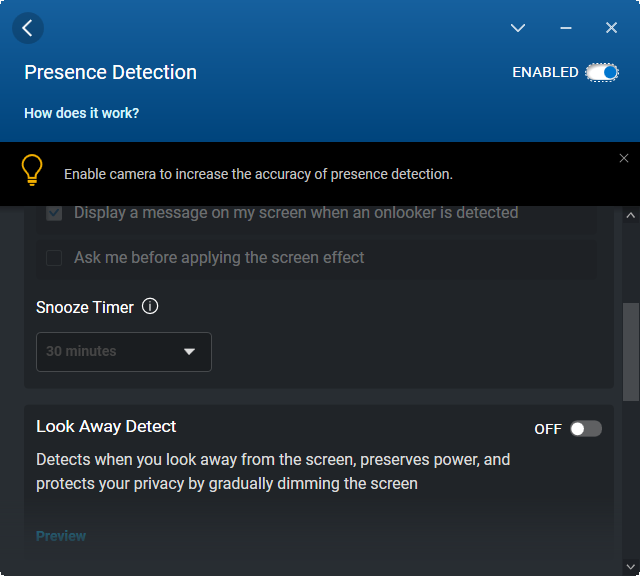
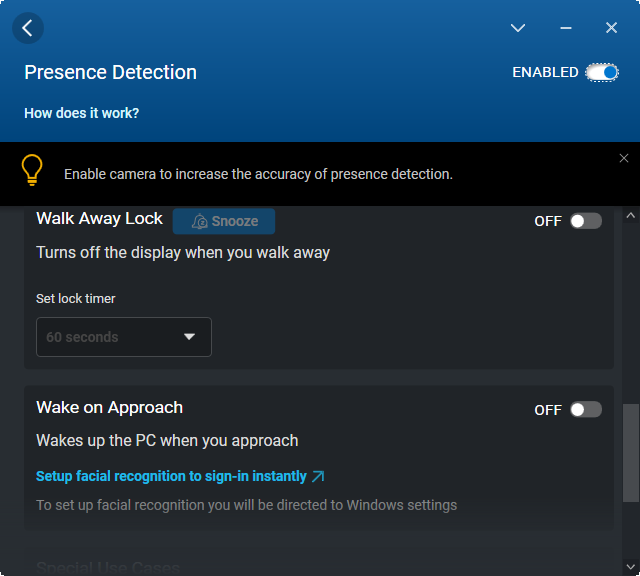
Our unit was set to Ultra Performance mode via both Windows and the Dell Optimizer software. It's highly recommended that owners become familiar with Optimizer as it is the hub for toggling Latitude-specific features like Presence Detection for hands-free login or enabling additional clickpad touch-sensitive buttons. Performance profiles are also found through the software as shown by the screenshots below.
Processor
CPU performance is excellent overall, but it doesn't do enough to differentiate itself from the Core i5-1235U. For example, benchmark results are all within 5 to 10 percent of the cheaper Core i5-1235U in the IdeaPad Flex 5i. Meanwhile, the Core i7-1255U is faster by about 10 to 15 percent due to its higher TDP targets over our Core i7-1260U. The multi-thread performance advantage over the outgoing 11th gen Core i7-1165G7 is still significant at about 35 percent despite the smaller differences between the 12th gen i5-1235U and i7-1255U.
Performance sustainability is good and much better than what we observed on the competing ThinkPad X1 Nano Gen 2 as shown by the comparison graph below. The Dell system is able to achieve this through very high core temperatures which our Stress Test section will illustrate.
Cinebench R15 Multi Loop
Cinebench R23: Multi Core | Single Core
Cinebench R15: CPU Multi 64Bit | CPU Single 64Bit
Blender: v2.79 BMW27 CPU
7-Zip 18.03: 7z b 4 | 7z b 4 -mmt1
Geekbench 5.5: Multi-Core | Single-Core
HWBOT x265 Benchmark v2.2: 4k Preset
LibreOffice : 20 Documents To PDF
R Benchmark 2.5: Overall mean
Cinebench R23: Multi Core | Single Core
Cinebench R15: CPU Multi 64Bit | CPU Single 64Bit
Blender: v2.79 BMW27 CPU
7-Zip 18.03: 7z b 4 | 7z b 4 -mmt1
Geekbench 5.5: Multi-Core | Single-Core
HWBOT x265 Benchmark v2.2: 4k Preset
LibreOffice : 20 Documents To PDF
R Benchmark 2.5: Overall mean
* ... smaller is better
AIDA64: FP32 Ray-Trace | FPU Julia | CPU SHA3 | CPU Queen | FPU SinJulia | FPU Mandel | CPU AES | CPU ZLib | FP64 Ray-Trace | CPU PhotoWorxx
| Performance Rating | |
| MSI Summit E13 Flip Evo A11MT | |
| Dell Latitude 9330 | |
| Average Intel Core i7-1260U | |
| HP Elite Dragonfly Max | |
| Lenovo ThinkPad X1 Titanium Yoga G1 20QB0016GE | |
| Dell Latitude 5310-23VP6 | |
| AIDA64 / FP32 Ray-Trace | |
| MSI Summit E13 Flip Evo A11MT | |
| Dell Latitude 9330 | |
| Average Intel Core i7-1260U () | |
| HP Elite Dragonfly Max | |
| Dell Latitude 5310-23VP6 | |
| Lenovo ThinkPad X1 Titanium Yoga G1 20QB0016GE | |
| AIDA64 / FPU Julia | |
| Dell Latitude 9330 | |
| Average Intel Core i7-1260U () | |
| MSI Summit E13 Flip Evo A11MT | |
| Dell Latitude 5310-23VP6 | |
| HP Elite Dragonfly Max | |
| Lenovo ThinkPad X1 Titanium Yoga G1 20QB0016GE | |
| AIDA64 / CPU SHA3 | |
| MSI Summit E13 Flip Evo A11MT | |
| Dell Latitude 9330 | |
| Average Intel Core i7-1260U () | |
| HP Elite Dragonfly Max | |
| Lenovo ThinkPad X1 Titanium Yoga G1 20QB0016GE | |
| Dell Latitude 5310-23VP6 | |
| AIDA64 / CPU Queen | |
| MSI Summit E13 Flip Evo A11MT | |
| Dell Latitude 9330 | |
| Average Intel Core i7-1260U () | |
| HP Elite Dragonfly Max | |
| Dell Latitude 5310-23VP6 | |
| Lenovo ThinkPad X1 Titanium Yoga G1 20QB0016GE | |
| AIDA64 / FPU SinJulia | |
| MSI Summit E13 Flip Evo A11MT | |
| Dell Latitude 5310-23VP6 | |
| Dell Latitude 9330 | |
| Average Intel Core i7-1260U () | |
| HP Elite Dragonfly Max | |
| Lenovo ThinkPad X1 Titanium Yoga G1 20QB0016GE | |
| AIDA64 / FPU Mandel | |
| MSI Summit E13 Flip Evo A11MT | |
| Dell Latitude 9330 | |
| Average Intel Core i7-1260U () | |
| HP Elite Dragonfly Max | |
| Dell Latitude 5310-23VP6 | |
| Lenovo ThinkPad X1 Titanium Yoga G1 20QB0016GE | |
| AIDA64 / CPU AES | |
| MSI Summit E13 Flip Evo A11MT | |
| HP Elite Dragonfly Max | |
| Lenovo ThinkPad X1 Titanium Yoga G1 20QB0016GE | |
| Dell Latitude 9330 | |
| Average Intel Core i7-1260U () | |
| Dell Latitude 5310-23VP6 | |
| AIDA64 / CPU ZLib | |
| Dell Latitude 9330 | |
| Average Intel Core i7-1260U () | |
| MSI Summit E13 Flip Evo A11MT | |
| Dell Latitude 5310-23VP6 | |
| HP Elite Dragonfly Max | |
| Lenovo ThinkPad X1 Titanium Yoga G1 20QB0016GE | |
| AIDA64 / FP64 Ray-Trace | |
| MSI Summit E13 Flip Evo A11MT | |
| Dell Latitude 9330 | |
| Average Intel Core i7-1260U () | |
| HP Elite Dragonfly Max | |
| Dell Latitude 5310-23VP6 | |
| Lenovo ThinkPad X1 Titanium Yoga G1 20QB0016GE | |
| AIDA64 / CPU PhotoWorxx | |
| MSI Summit E13 Flip Evo A11MT | |
| HP Elite Dragonfly Max | |
| Dell Latitude 9330 | |
| Average Intel Core i7-1260U () | |
| Lenovo ThinkPad X1 Titanium Yoga G1 20QB0016GE | |
| Dell Latitude 5310-23VP6 | |
System Performance
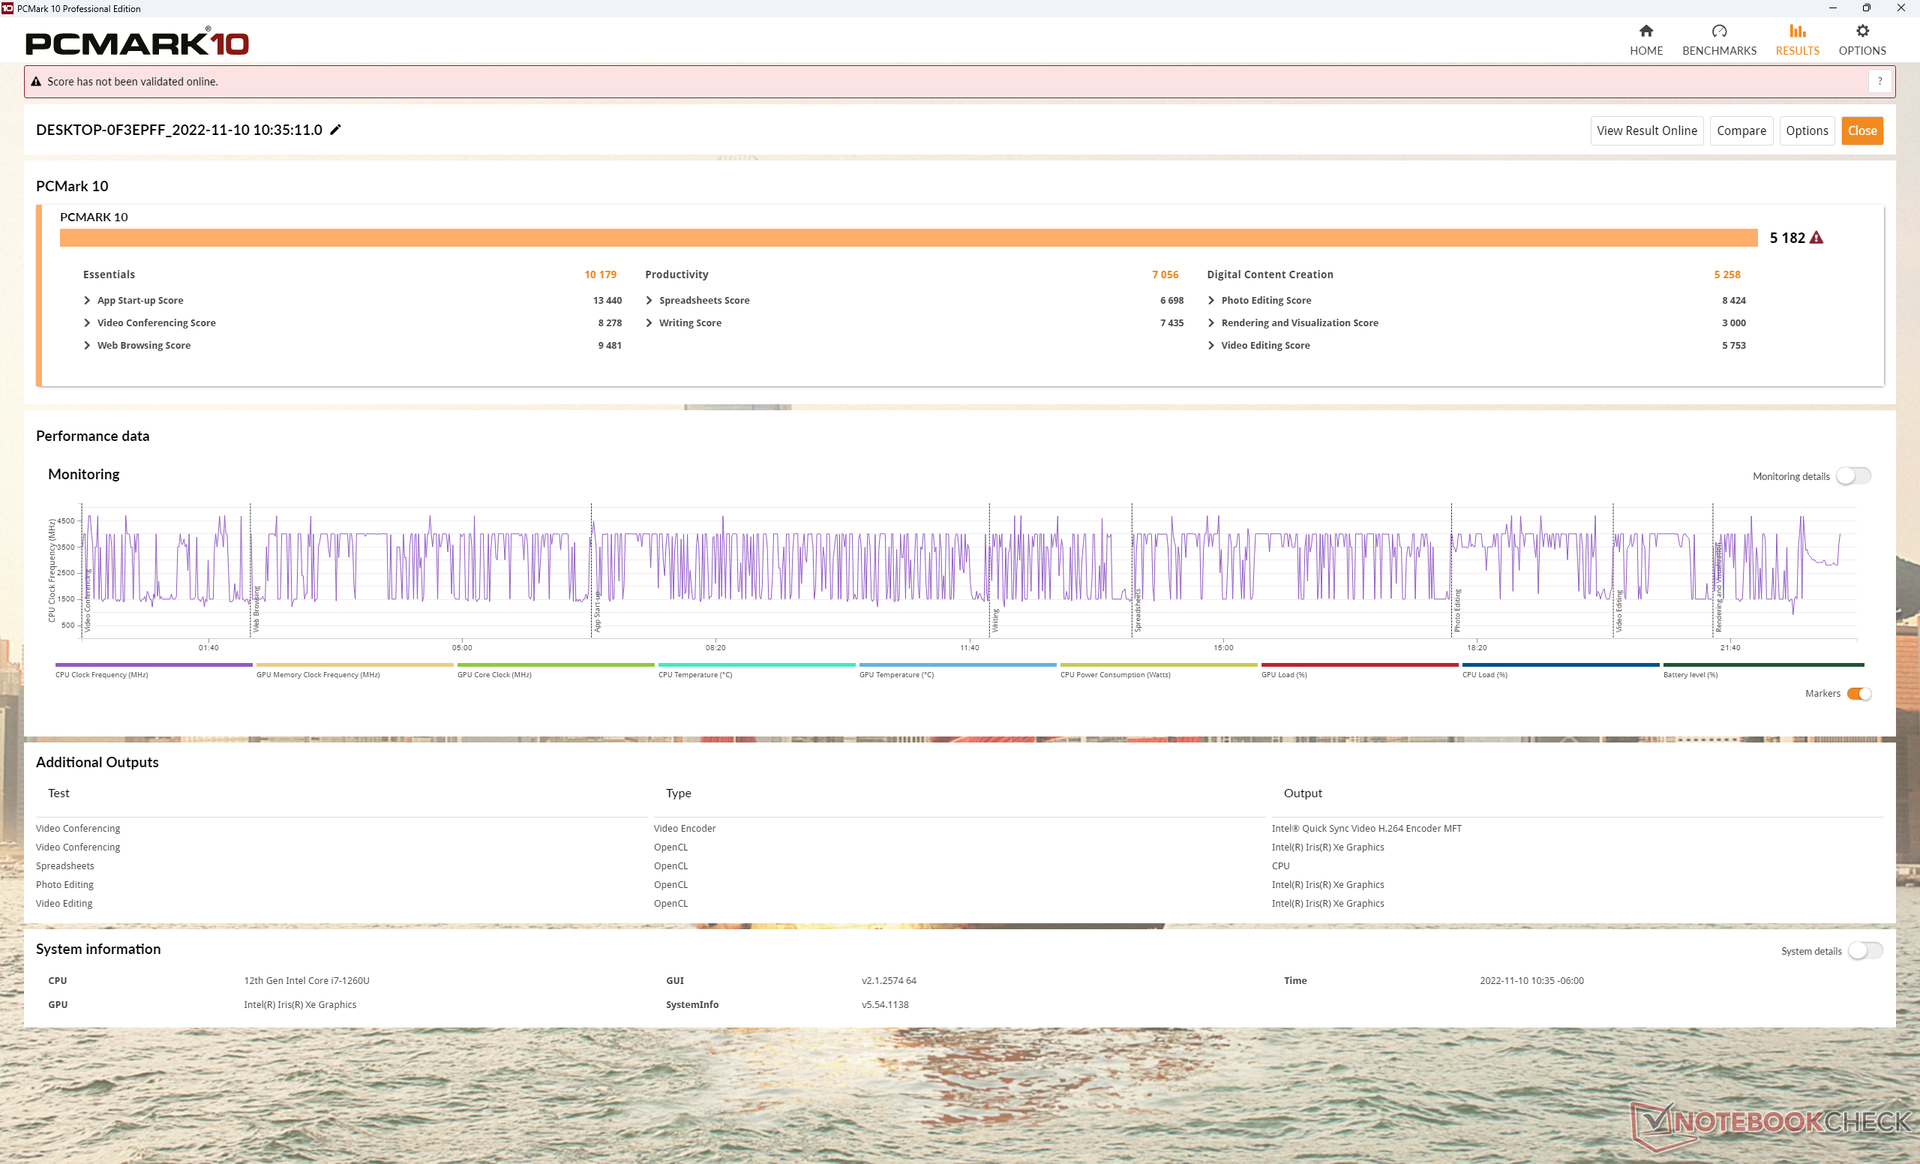
PCMark 10 results are higher than on most other 13-inch subnotebooks to be one of the fastest in the category. Many models in this size class tend to run on CPUs with lower TDP targets such as the ThinkPad X1 Yoga G1 for ultimately slower performance.
| PCMark 10 / Score | |
| Dell Latitude 9330 | |
| Average Intel Core i7-1260U, Intel Iris Xe Graphics G7 96EUs () | |
| HP Elite Dragonfly Max | |
| MSI Summit E13 Flip Evo A11MT | |
| Lenovo ThinkPad X1 Titanium Yoga G1 20QB0016GE | |
| HP EliteBook x360 1030 G7 | |
| Dell Latitude 5310-23VP6 | |
| PCMark 10 / Essentials | |
| HP Elite Dragonfly Max | |
| Dell Latitude 9330 | |
| Average Intel Core i7-1260U, Intel Iris Xe Graphics G7 96EUs () | |
| Lenovo ThinkPad X1 Titanium Yoga G1 20QB0016GE | |
| HP EliteBook x360 1030 G7 | |
| Dell Latitude 5310-23VP6 | |
| MSI Summit E13 Flip Evo A11MT | |
| PCMark 10 / Productivity | |
| Dell Latitude 9330 | |
| Average Intel Core i7-1260U, Intel Iris Xe Graphics G7 96EUs () | |
| MSI Summit E13 Flip Evo A11MT | |
| HP Elite Dragonfly Max | |
| Dell Latitude 5310-23VP6 | |
| HP EliteBook x360 1030 G7 | |
| Lenovo ThinkPad X1 Titanium Yoga G1 20QB0016GE | |
| PCMark 10 / Digital Content Creation | |
| Dell Latitude 9330 | |
| Average Intel Core i7-1260U, Intel Iris Xe Graphics G7 96EUs () | |
| MSI Summit E13 Flip Evo A11MT | |
| HP Elite Dragonfly Max | |
| Lenovo ThinkPad X1 Titanium Yoga G1 20QB0016GE | |
| HP EliteBook x360 1030 G7 | |
| Dell Latitude 5310-23VP6 | |
| PCMark 10 Score | 5182 points | |
Help | ||
| AIDA64 / Memory Copy | |
| Dell Latitude 9330 | |
| Average Intel Core i7-1260U () | |
| HP Elite Dragonfly Max | |
| MSI Summit E13 Flip Evo A11MT | |
| Lenovo ThinkPad X1 Titanium Yoga G1 20QB0016GE | |
| Dell Latitude 5310-23VP6 | |
| AIDA64 / Memory Read | |
| HP Elite Dragonfly Max | |
| Dell Latitude 9330 | |
| Average Intel Core i7-1260U () | |
| MSI Summit E13 Flip Evo A11MT | |
| Lenovo ThinkPad X1 Titanium Yoga G1 20QB0016GE | |
| Dell Latitude 5310-23VP6 | |
| AIDA64 / Memory Write | |
| HP Elite Dragonfly Max | |
| Dell Latitude 9330 | |
| Average Intel Core i7-1260U () | |
| Lenovo ThinkPad X1 Titanium Yoga G1 20QB0016GE | |
| MSI Summit E13 Flip Evo A11MT | |
| Dell Latitude 5310-23VP6 | |
| AIDA64 / Memory Latency | |
| Dell Latitude 9330 | |
| Average Intel Core i7-1260U () | |
| HP Elite Dragonfly Max | |
| Dell Latitude 5310-23VP6 | |
| MSI Summit E13 Flip Evo A11MT | |
| Lenovo ThinkPad X1 Titanium Yoga G1 20QB0016GE | |
* ... smaller is better
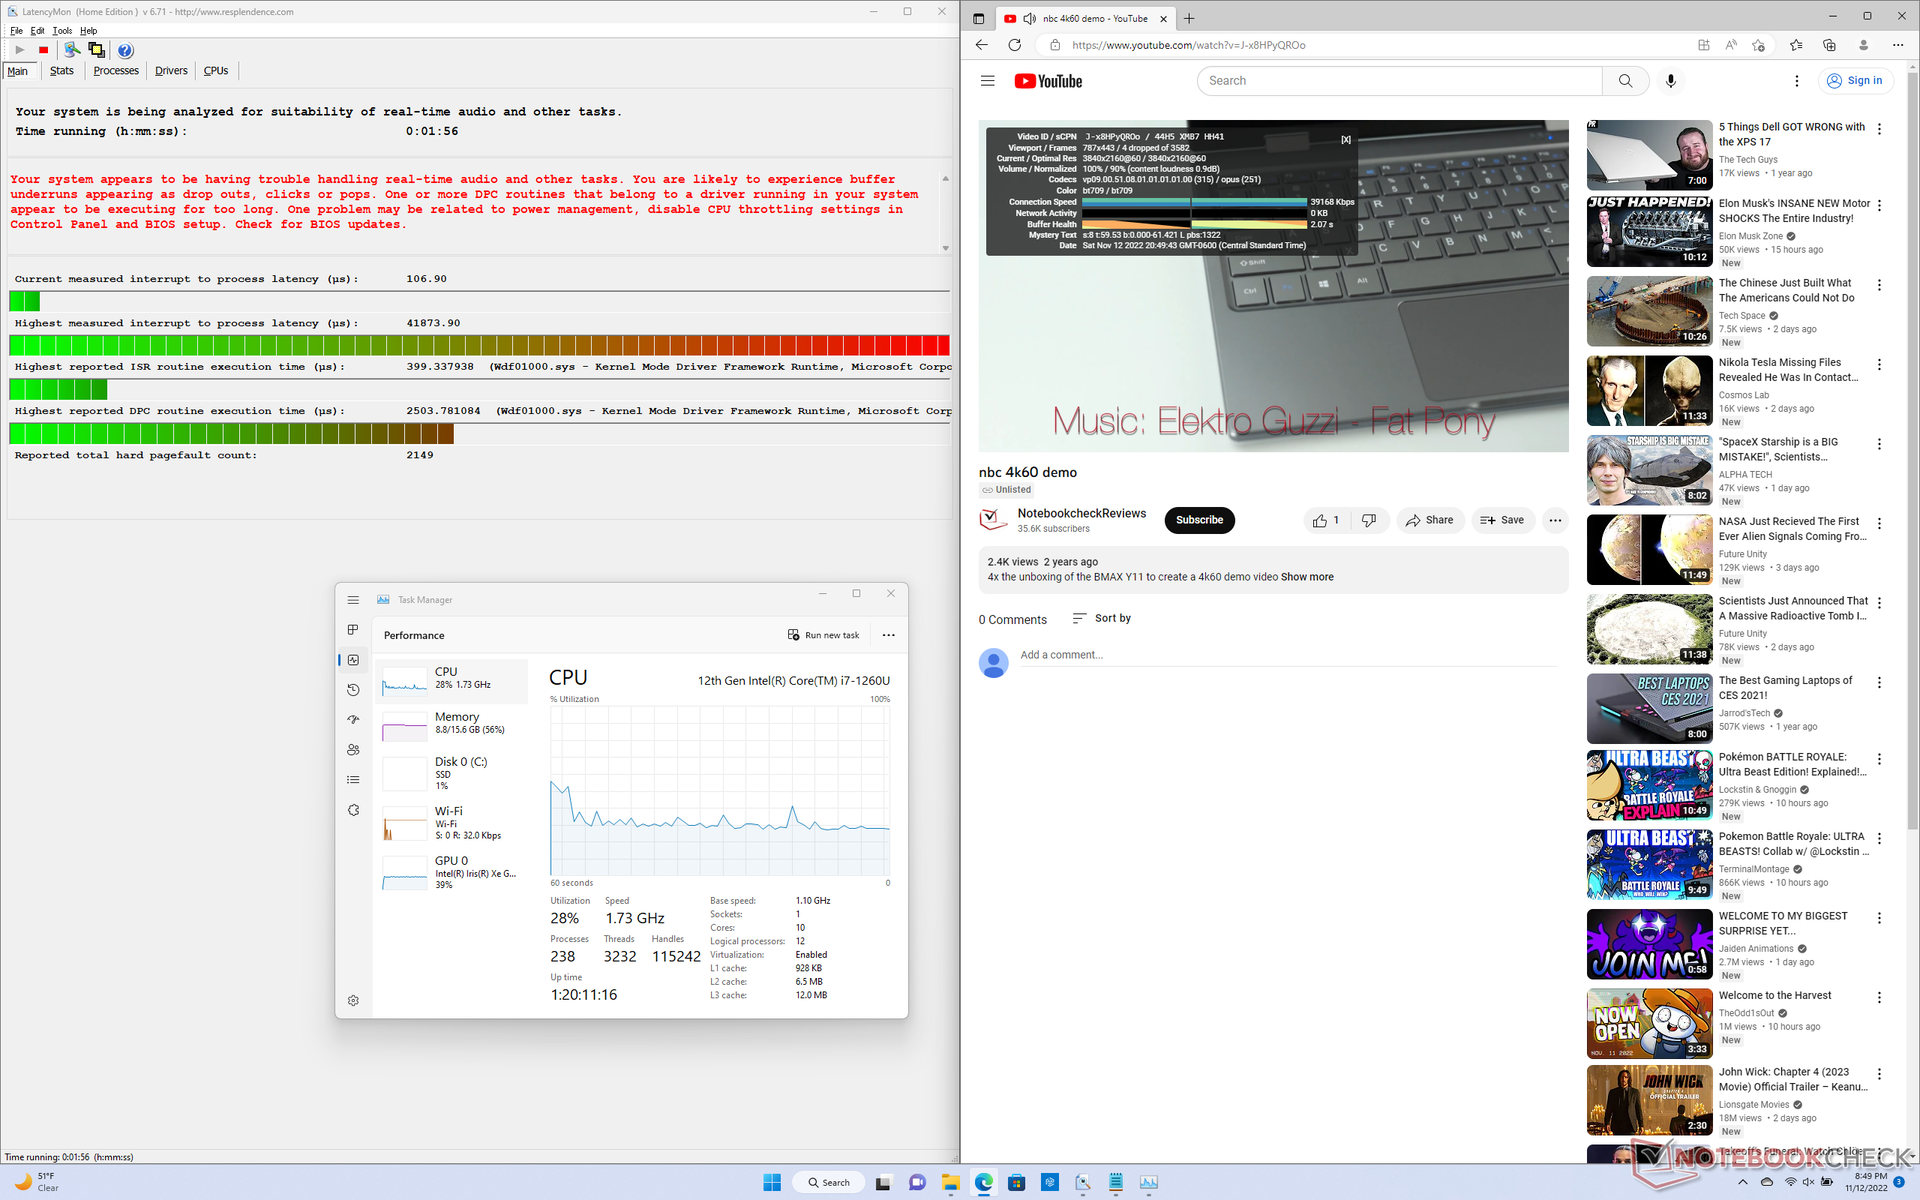
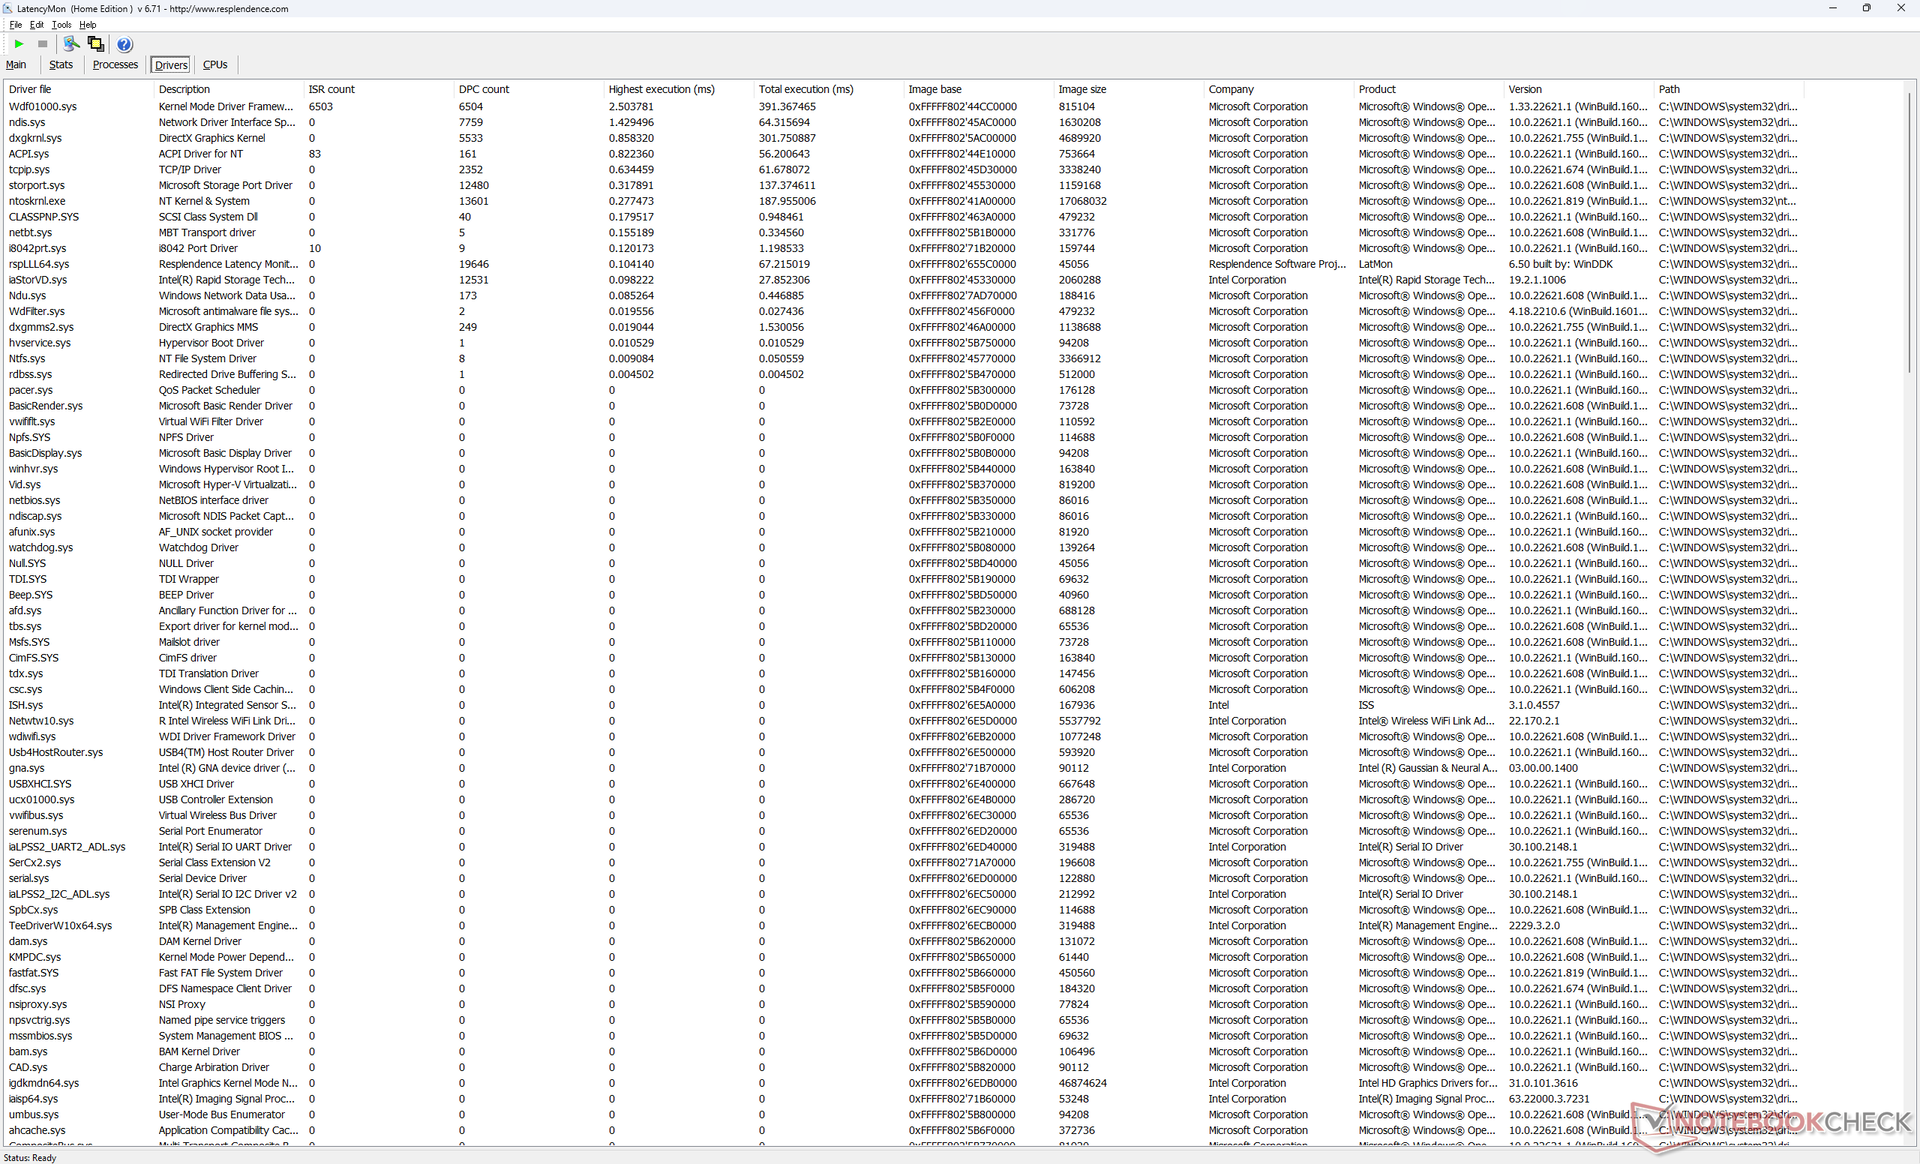
DPC Latency
Our unit would exhibit major DPC issues when opening multiple browser tabs of our homepage even after multiple retests. 4K video playback at 60 FPS is also imperfect with 4 dropped frames during the minute-long test video. The results are disappointing to see from a high-end business laptop where consistent performance is important.
| DPC Latencies / LatencyMon - interrupt to process latency (max), Web, Youtube, Prime95 | |
| Dell Latitude 9330 | |
| HP EliteBook x360 1030 G7 | |
| HP Elite Dragonfly Max | |
| MSI Summit E13 Flip Evo A11MT | |
| Lenovo ThinkPad X1 Titanium Yoga G1 20QB0016GE | |
| Dell Latitude 5310-23VP6 | |
* ... smaller is better
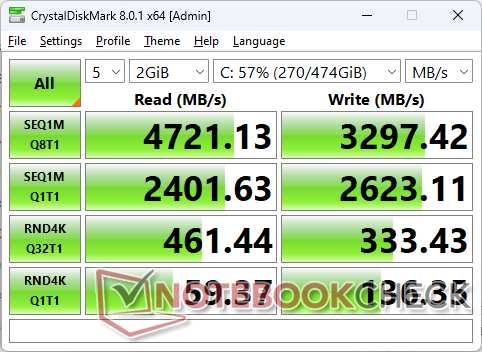
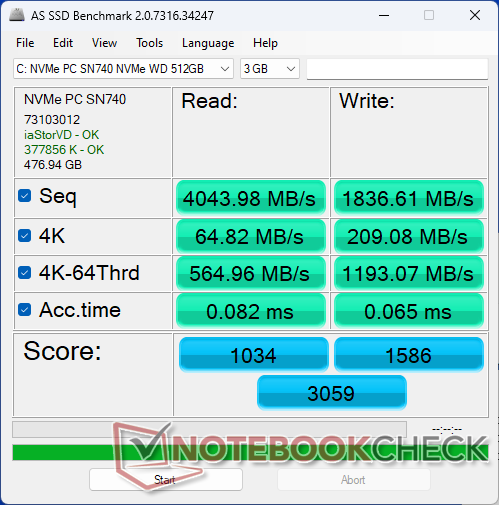
Storage Devices — PCIe4 x4 2230 Only
Our test unit ships with a 512 GB WD SN740 PCIe4 x4 NVMe SSD offering steady sequential read and write rates of up to 4700 MB/s and 3300 MB/s, respectively. This is a midrange drive considering that the latest PCIe4 x4 drives from Samsung can reach over 7000 MB/s. The system can support only one internal drive with no secondary options.

| Drive Performance Rating - Percent | |
| MSI Summit E13 Flip Evo A11MT | |
| Dell Latitude 9330 | |
| HP EliteBook x360 1030 G7 | |
| HP Elite Dragonfly Max | |
| Lenovo ThinkPad X1 Titanium Yoga G1 20QB0016GE | |
| Dell Latitude 5310-23VP6 | |
* ... smaller is better
Disk Throttling: DiskSpd Read Loop, Queue Depth 8
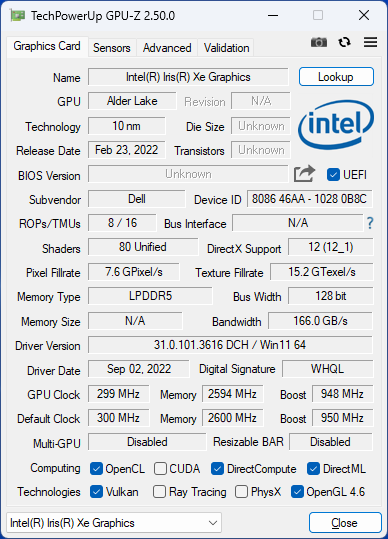
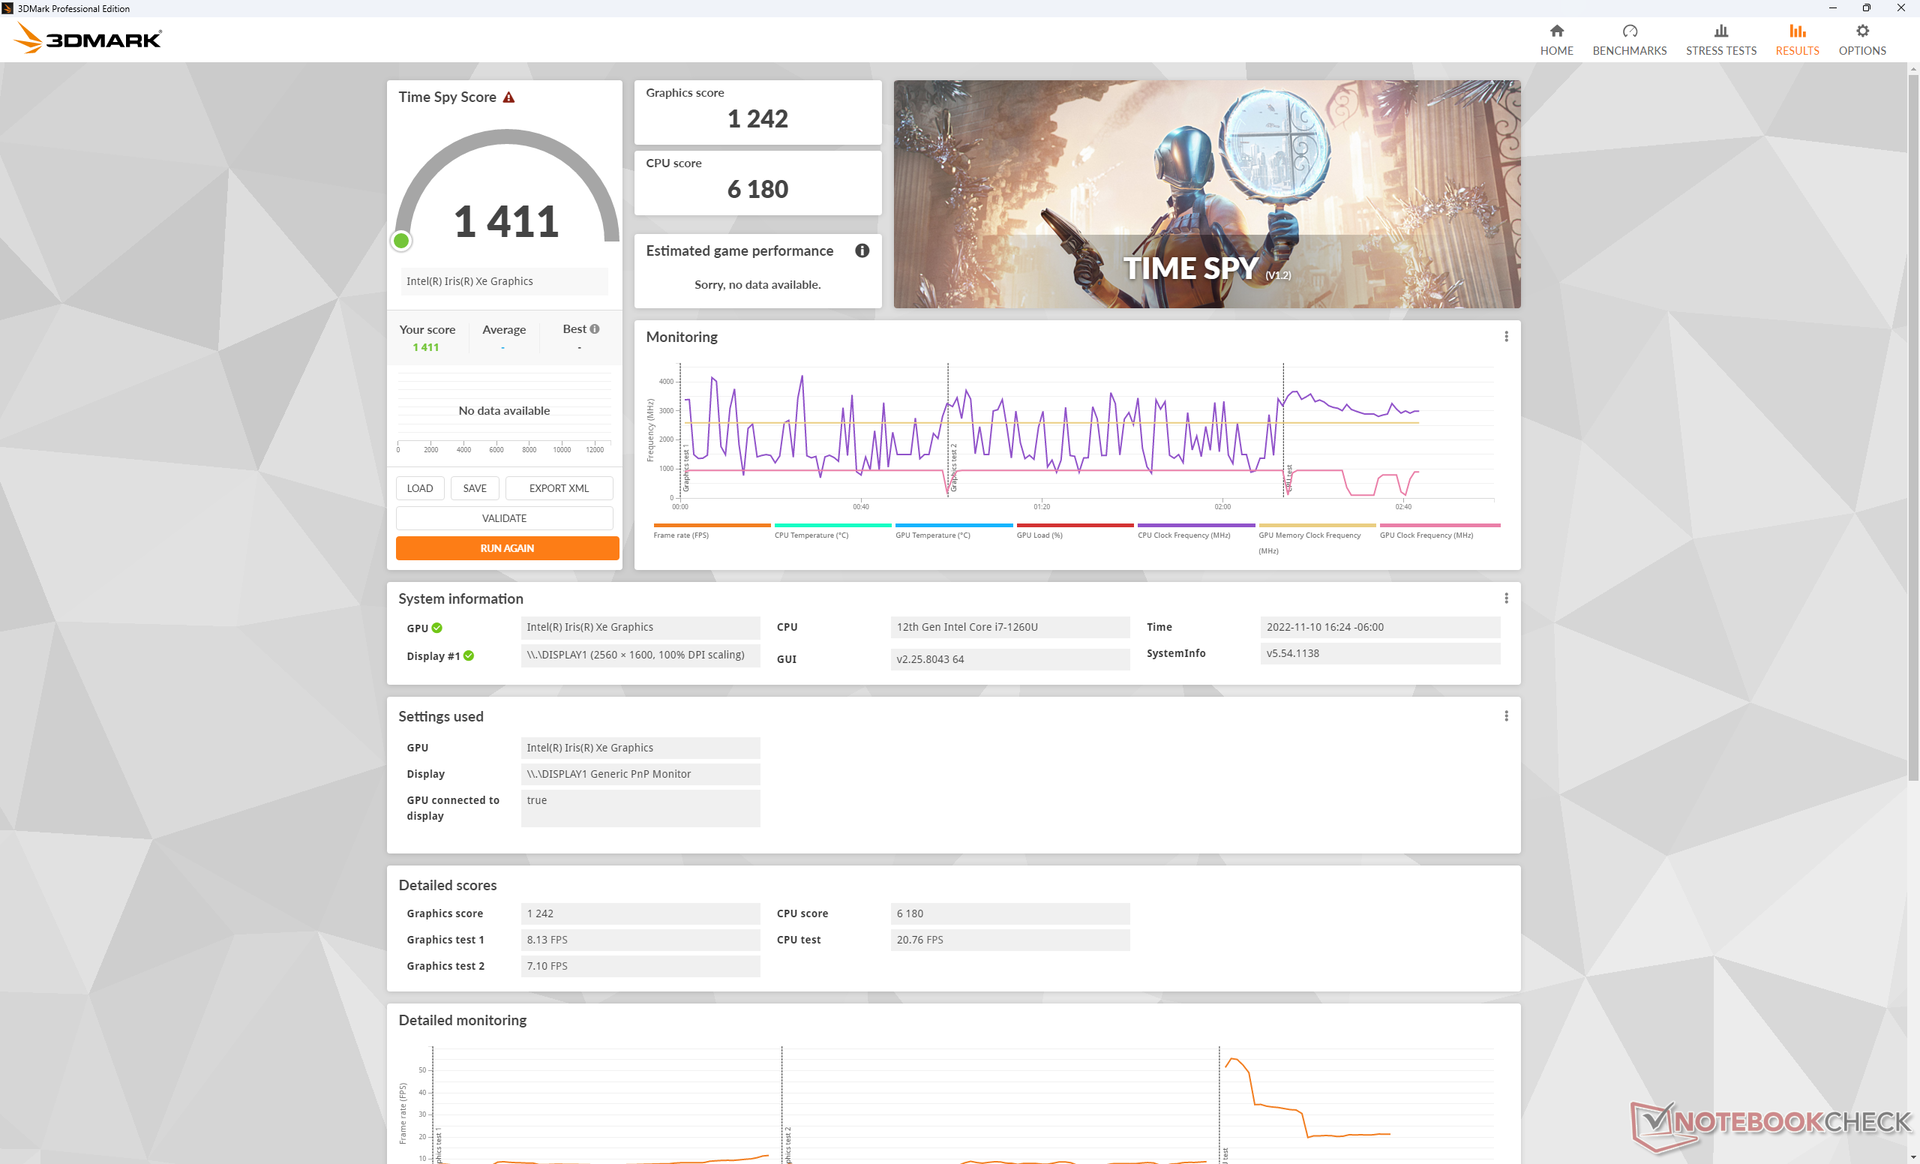
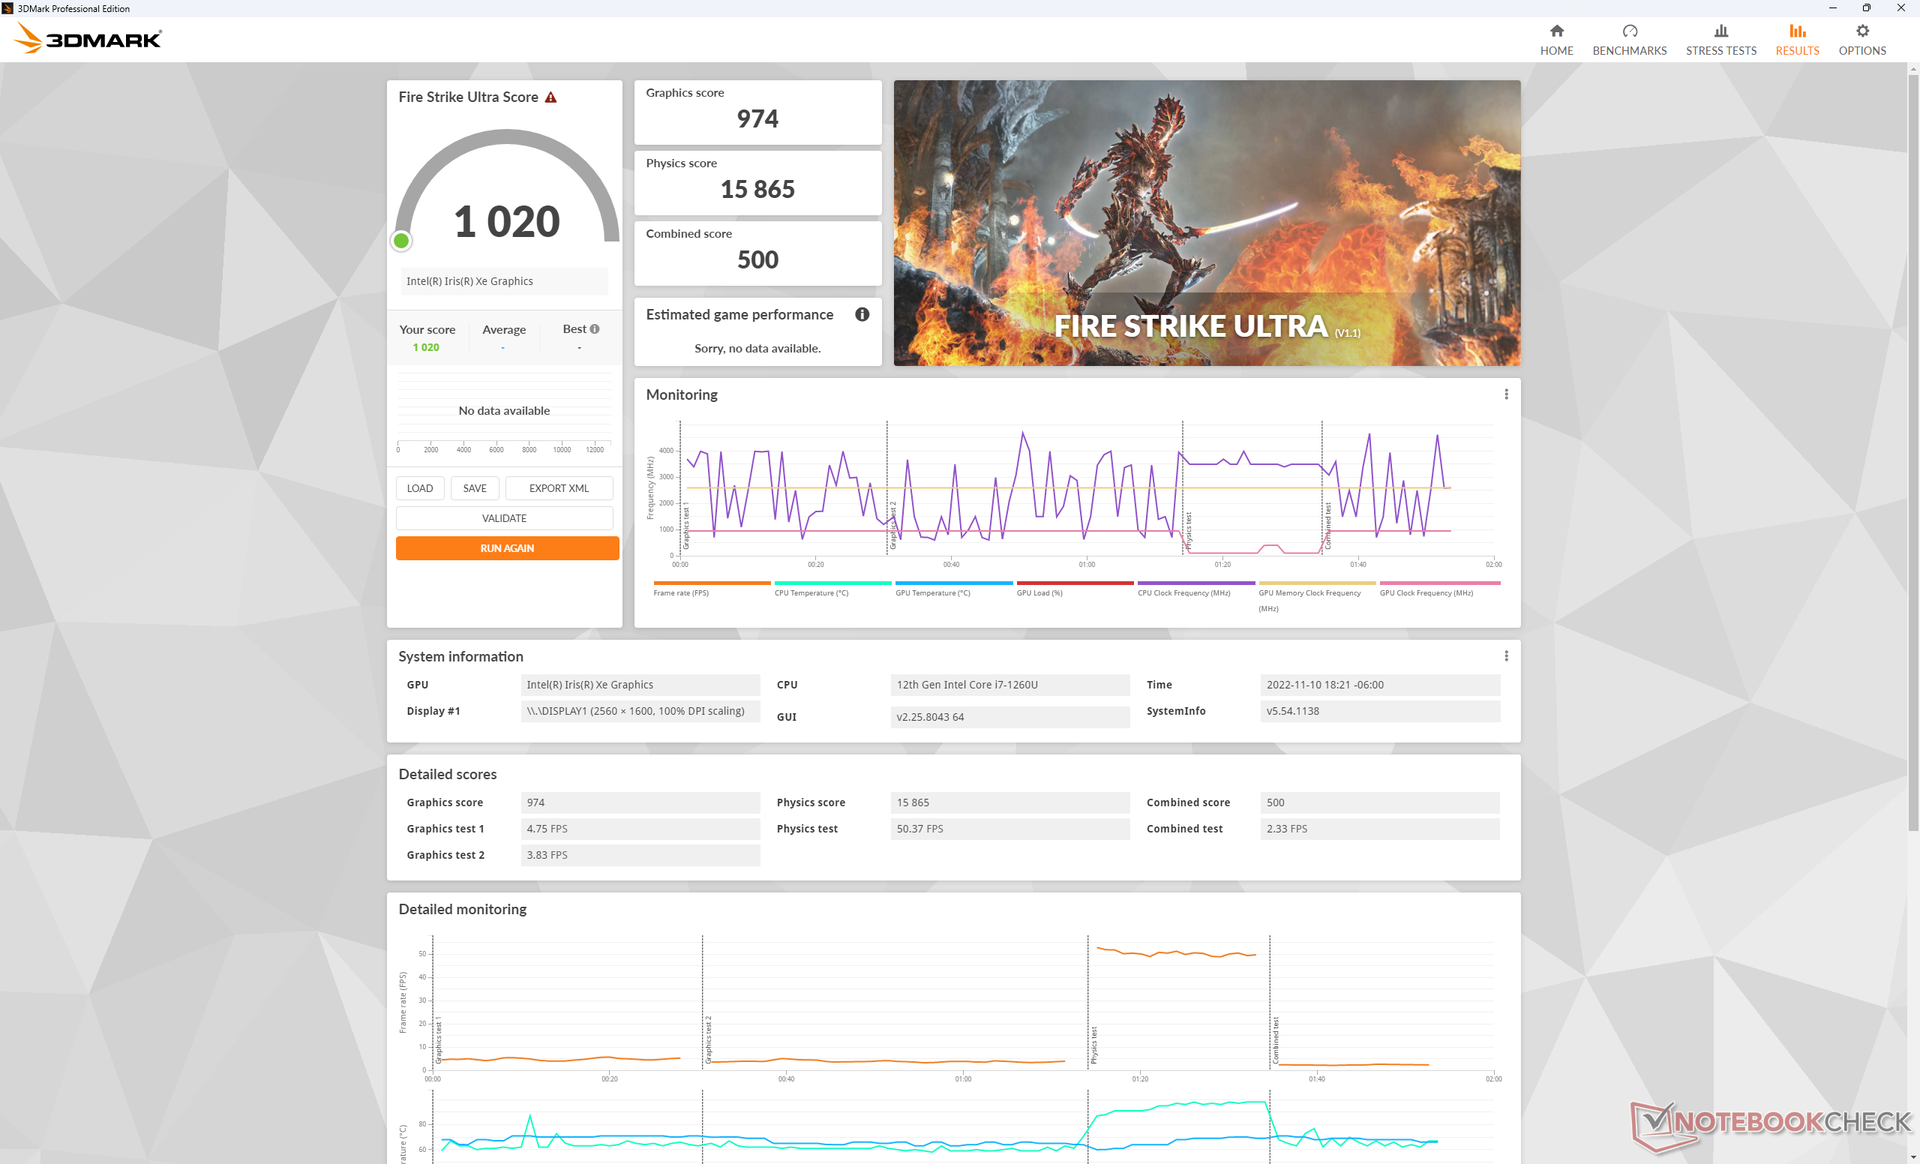
GPU Performance — Good But Not Great
Graphics performance is 15 percent slower than the average laptop in our database with the same integrated Iris Xe 96 EUs GPU despite the spacious 32 GB of LPDDR5-5200 RAM. The Latitude series isn't designed for gaming and so this deficit isn't a big deal. Overall performance is closer to the Iris Xe 80 EUs as found on many Core i5 CPUs.
Most games are still playable on the Latitude 9330 albeit only at low settings.
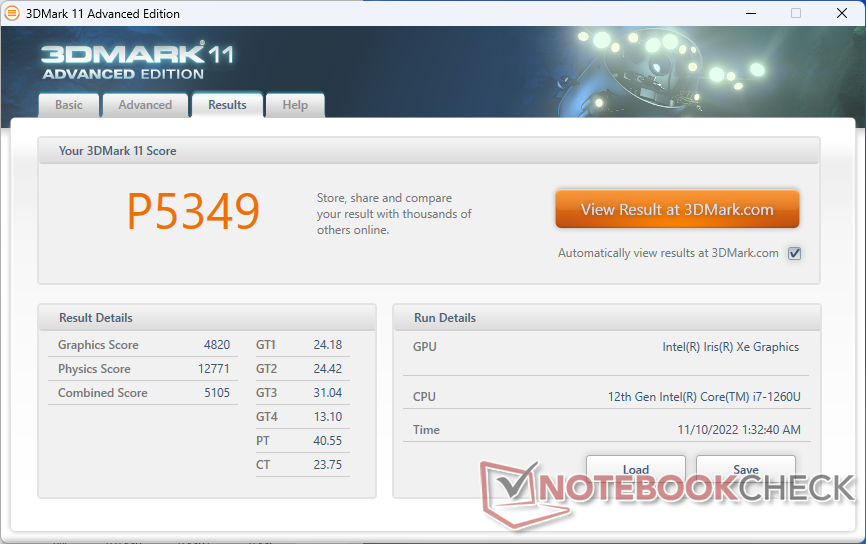
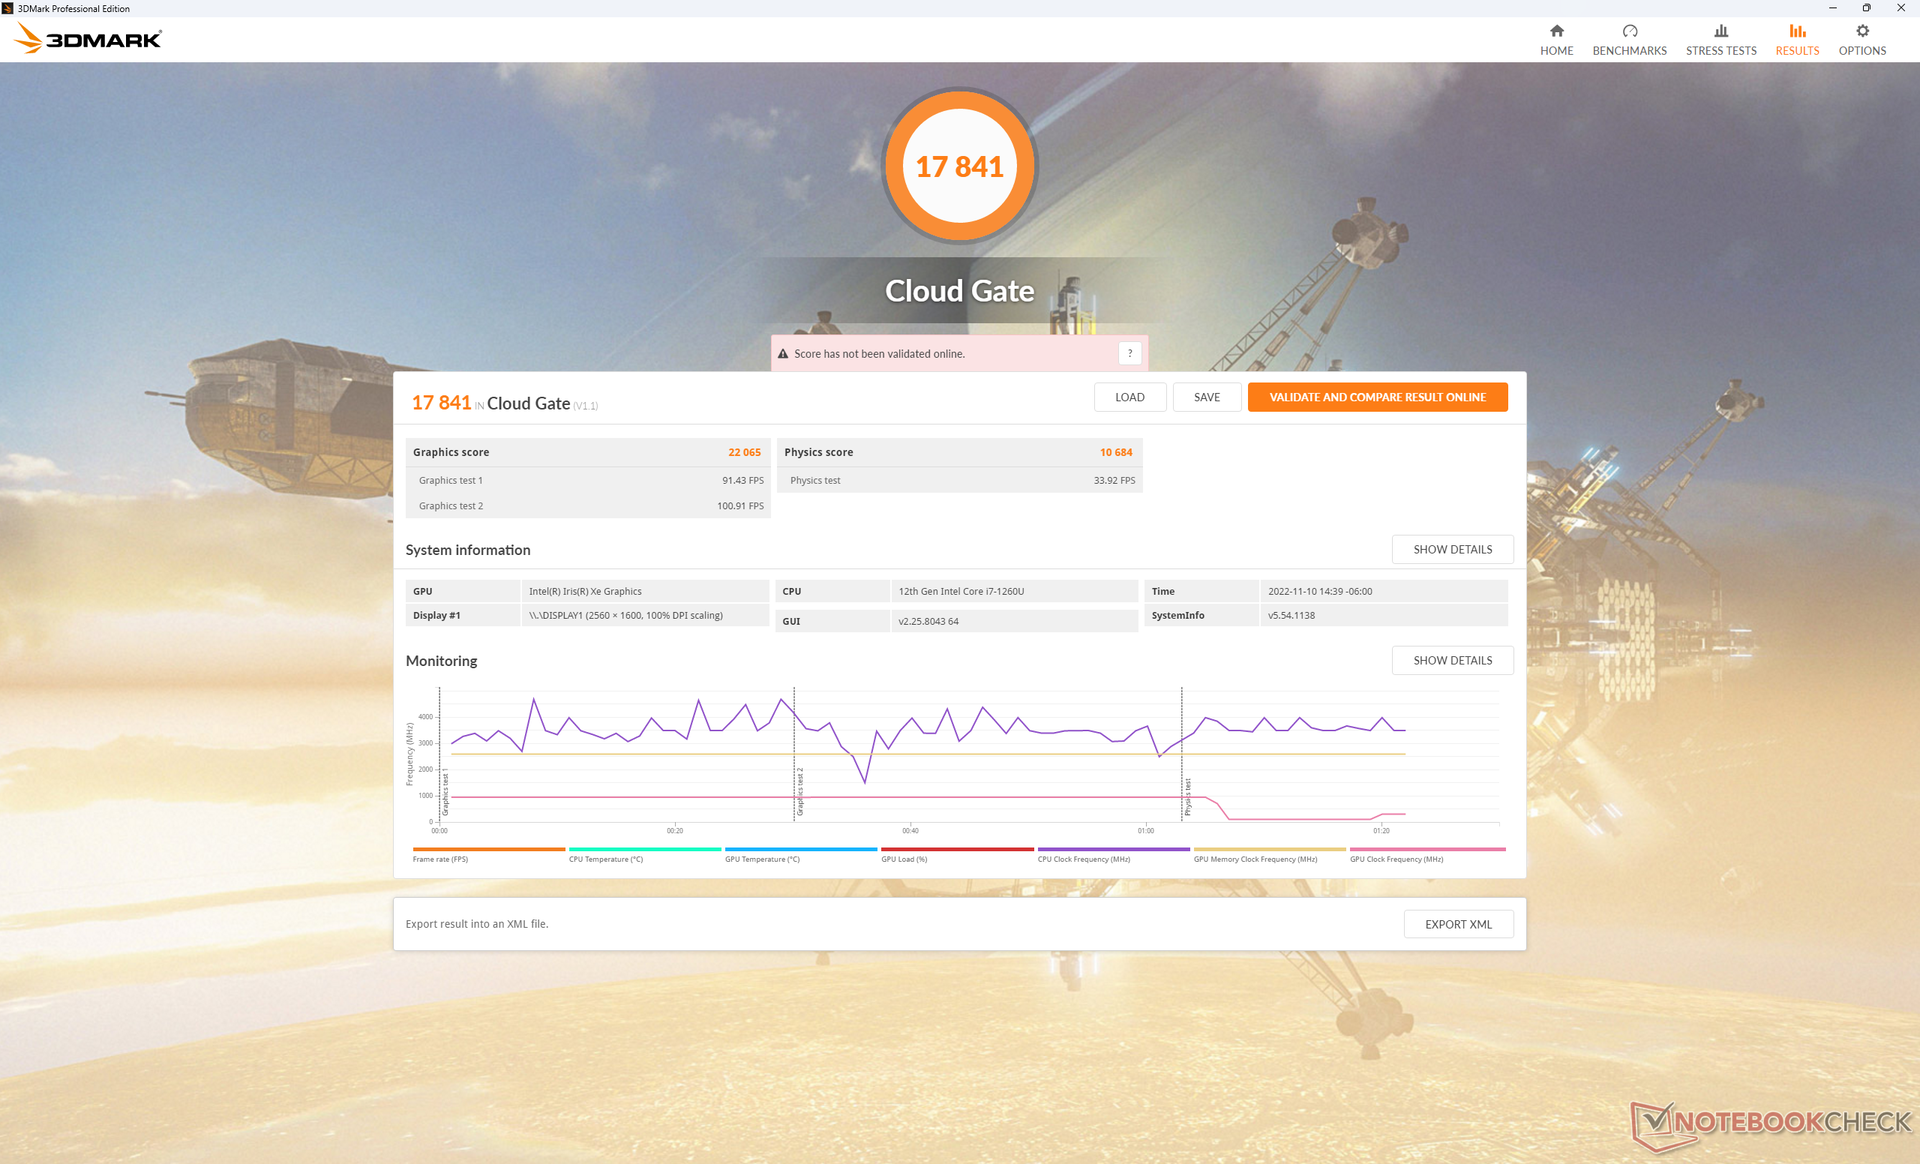
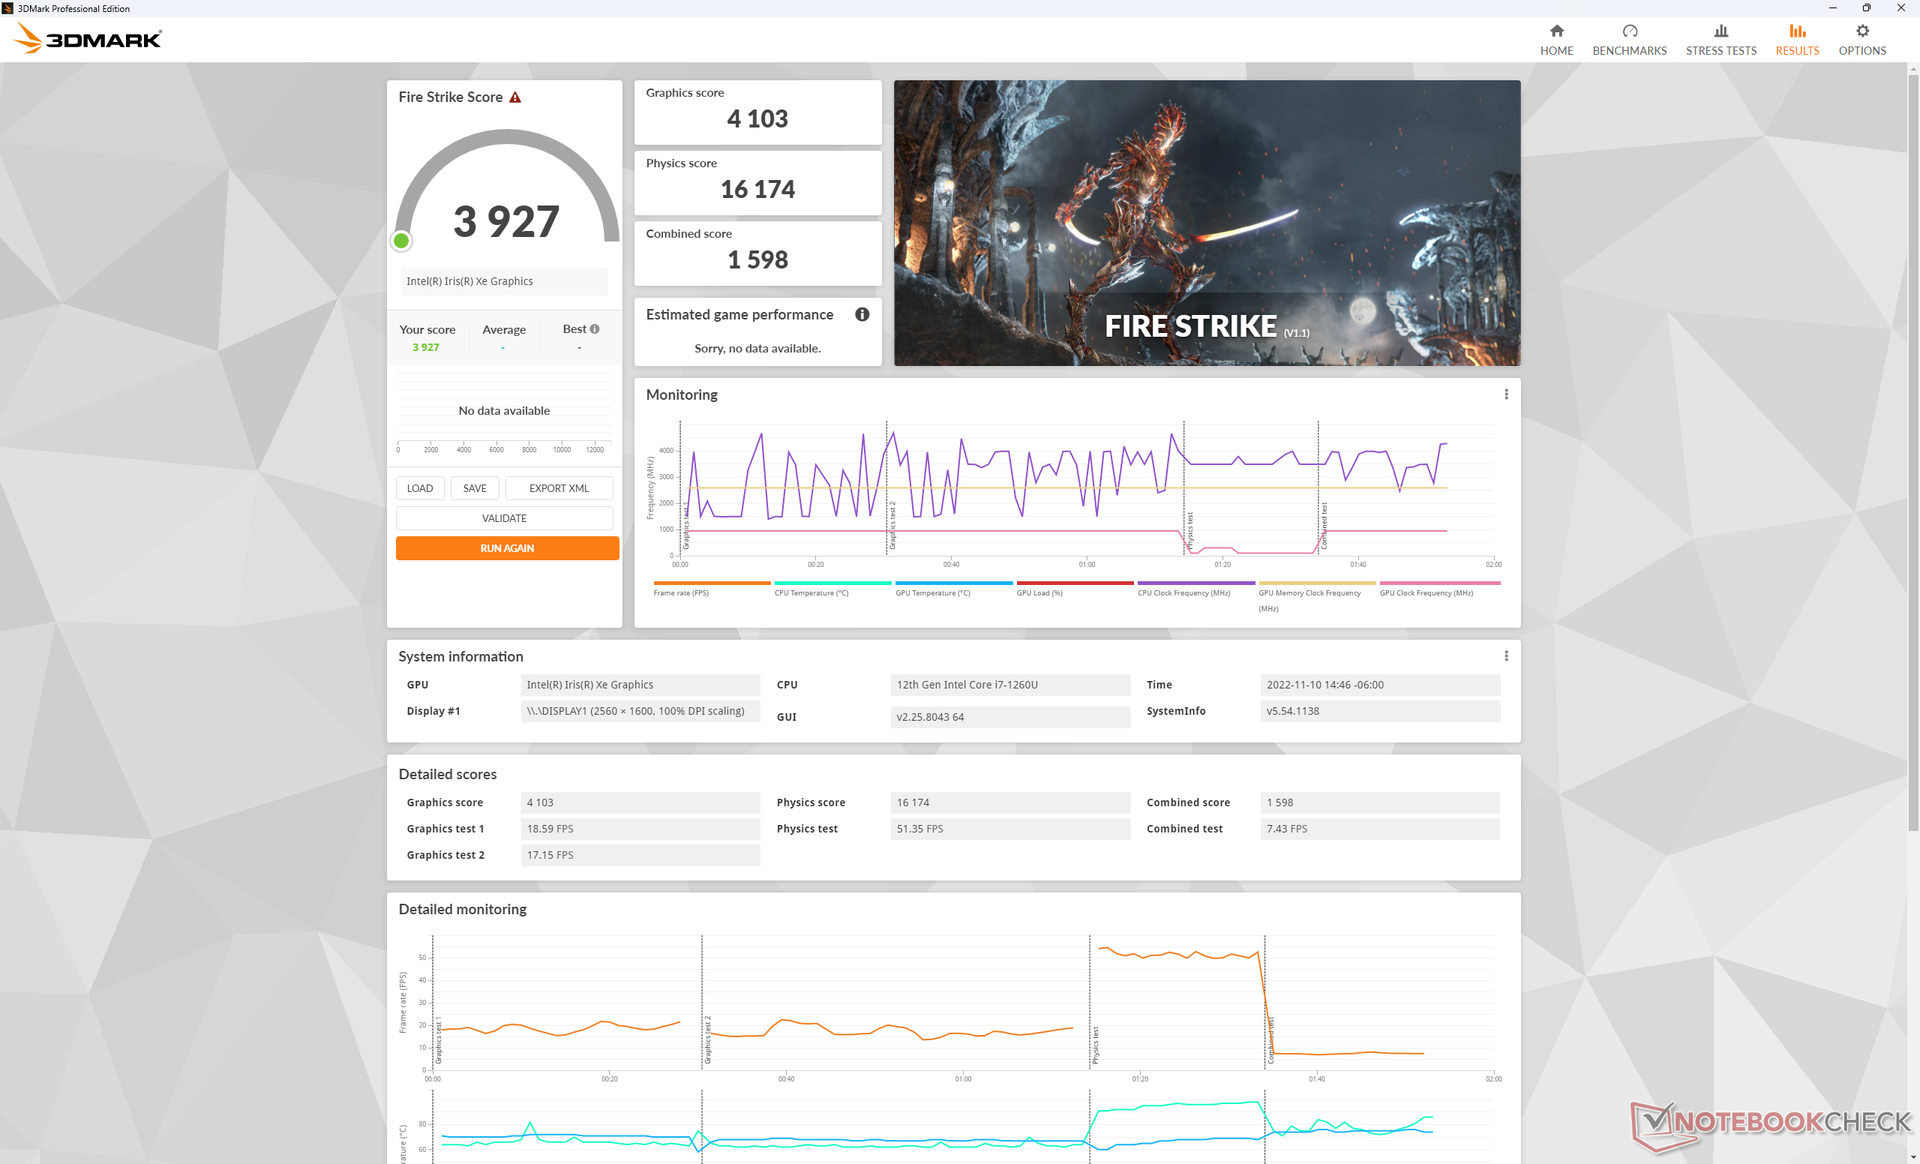
| 3DMark 11 Performance | 5349 points | |
| 3DMark Cloud Gate Standard Score | 17841 points | |
| 3DMark Fire Strike Score | 3927 points | |
| 3DMark Time Spy Score | 1411 points | |
Help | ||
| Blender - v3.3 Classroom CPU | |
| Dell Latitude 9330 | |
| Average Intel Iris Xe Graphics G7 96EUs (336 - 1259, n=93) | |
* ... smaller is better
| Performance Rating - Percent | |
| MSI Summit E13 Flip Evo A11MT | |
| Dell Latitude 9330 | |
| HP Elite Dragonfly Max -1! | |
| Lenovo ThinkPad X1 Titanium Yoga G1 20QB0016GE -3! | |
| HP EliteBook x360 1030 G7 -3! | |
| Dell Latitude 5310-23VP6 -4! | |
| The Witcher 3 - 1920x1080 Ultra Graphics & Postprocessing (HBAO+) | |
| MSI Summit E13 Flip Evo A11MT | |
| HP Elite Dragonfly Max | |
| Dell Latitude 9330 | |
| Lenovo ThinkPad X1 Titanium Yoga G1 20QB0016GE | |
| GTA V - 1920x1080 Highest Settings possible AA:4xMSAA + FX AF:16x | |
| MSI Summit E13 Flip Evo A11MT | |
| Dell Latitude 9330 | |
| Final Fantasy XV Benchmark - 1920x1080 High Quality | |
| MSI Summit E13 Flip Evo A11MT | |
| Dell Latitude 9330 | |
| HP Elite Dragonfly Max | |
| HP EliteBook x360 1030 G7 | |
| Strange Brigade - 1920x1080 ultra AA:ultra AF:16 | |
| MSI Summit E13 Flip Evo A11MT | |
| Dell Latitude 9330 | |
| HP Elite Dragonfly Max | |
| Dota 2 Reborn - 1920x1080 ultra (3/3) best looking | |
| Dell Latitude 9330 | |
| MSI Summit E13 Flip Evo A11MT | |
| Lenovo ThinkPad X1 Titanium Yoga G1 20QB0016GE | |
| HP Elite Dragonfly Max | |
| HP EliteBook x360 1030 G7 | |
| Dell Latitude 5310-23VP6 | |
| X-Plane 11.11 - 1920x1080 high (fps_test=3) | |
| MSI Summit E13 Flip Evo A11MT | |
| Dell Latitude 9330 | |
| HP Elite Dragonfly Max | |
| Lenovo ThinkPad X1 Titanium Yoga G1 20QB0016GE | |
| HP EliteBook x360 1030 G7 | |
| Dell Latitude 5310-23VP6 | |
Witcher 3 FPS Chart
| low | med. | high | ultra | |
| GTA V (2015) | 102.1 | 91.1 | 21.7 | 8.94 |
| The Witcher 3 (2015) | 75.8 | 47.2 | 25.9 | 11.4 |
| Dota 2 Reborn (2015) | 100.3 | 80.1 | 58.6 | 53.4 |
| Final Fantasy XV Benchmark (2018) | 37.3 | 21 | 14.6 | |
| X-Plane 11.11 (2018) | 37.1 | 34.4 | 30.8 | |
| Strange Brigade (2018) | 69.1 | 32.4 | 25 | 20.4 |
| Cyberpunk 2077 1.6 (2022) | 17.5 | 14.5 | 11.2 | 8.9 |
Emissions
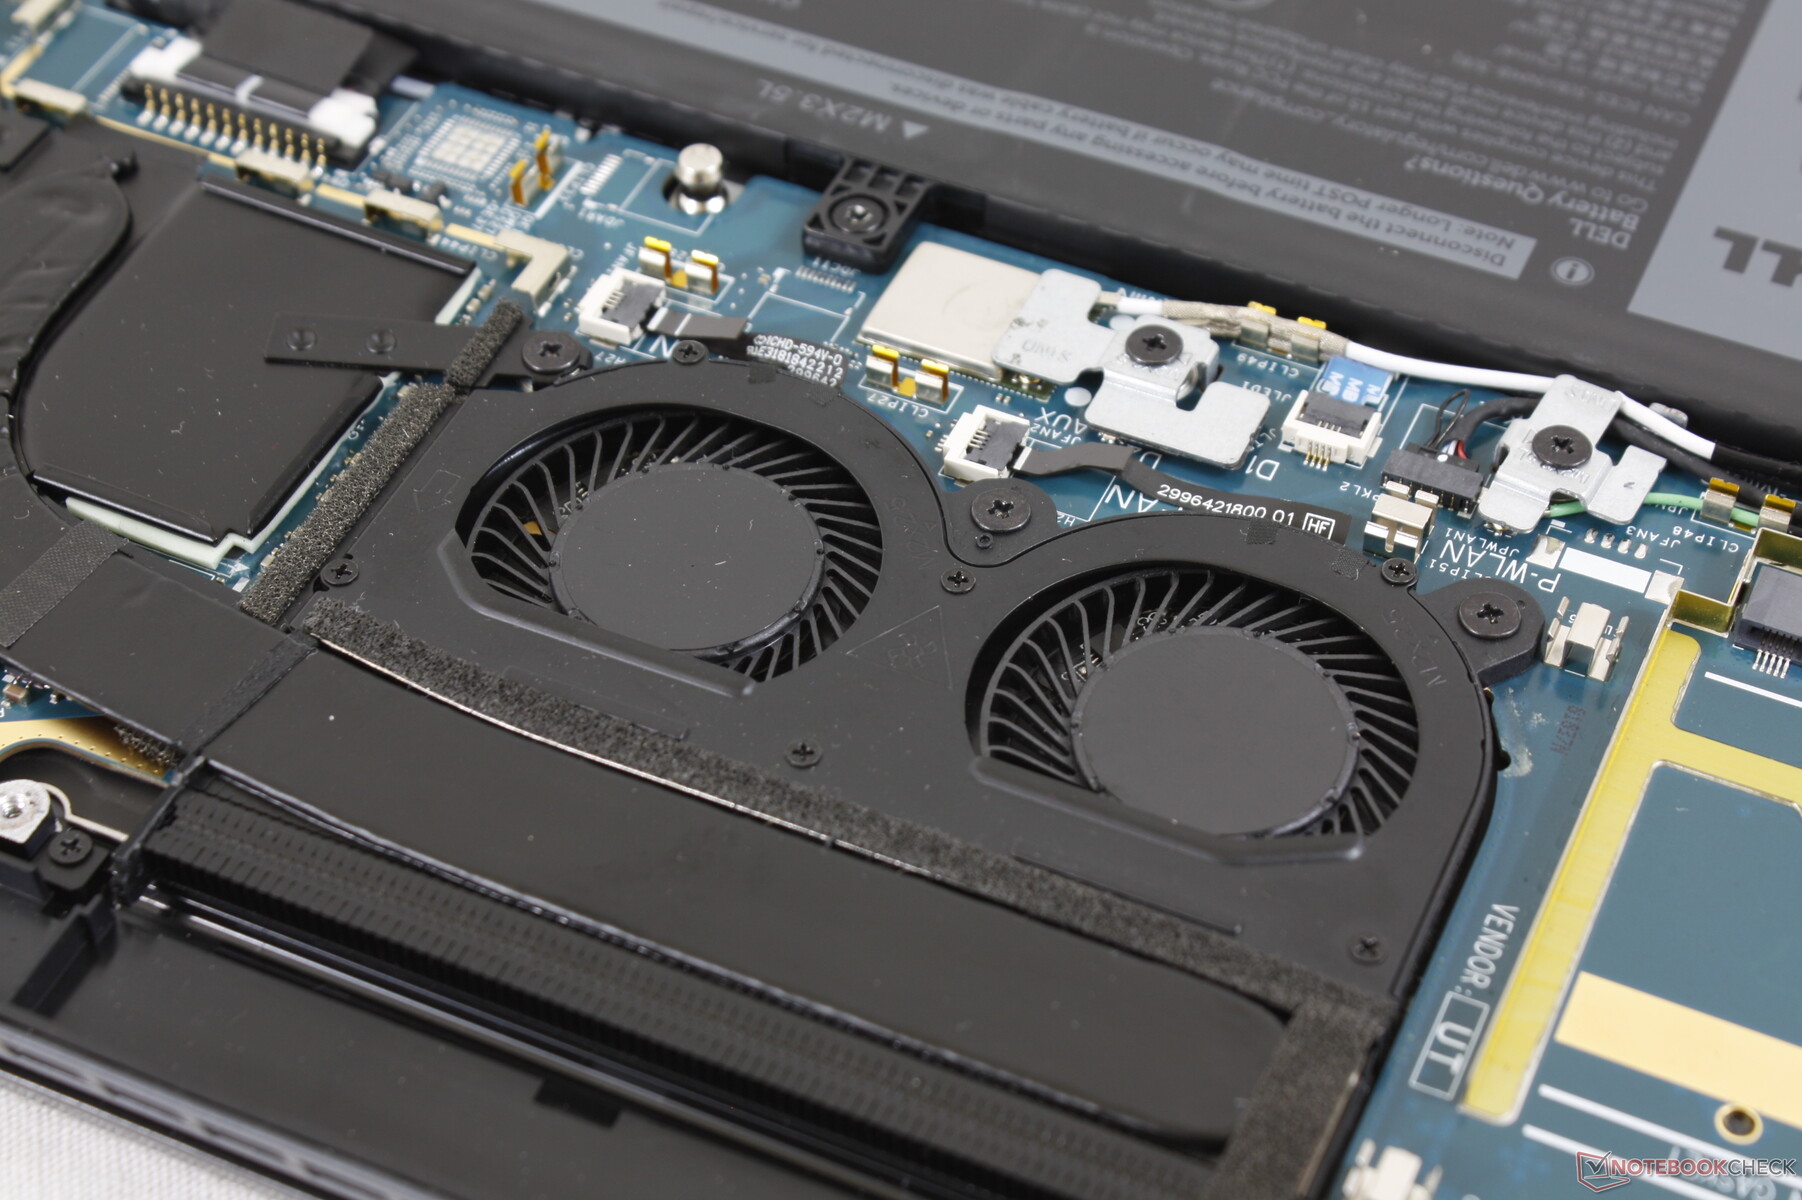
System Noise — High Pitch Fans
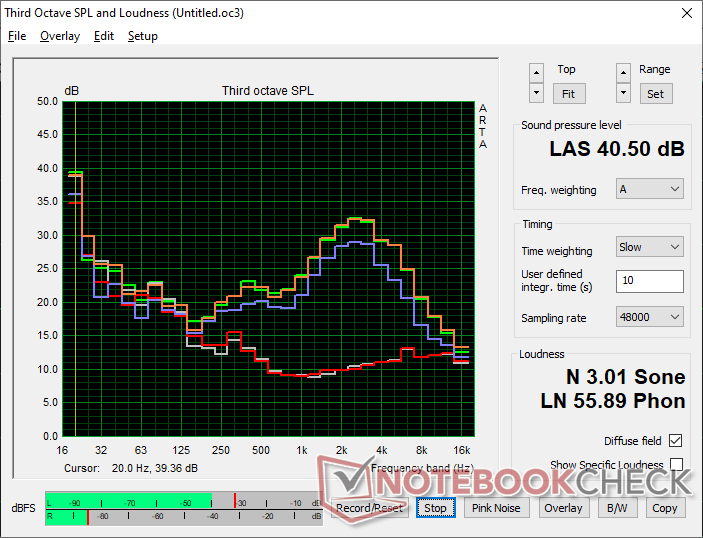
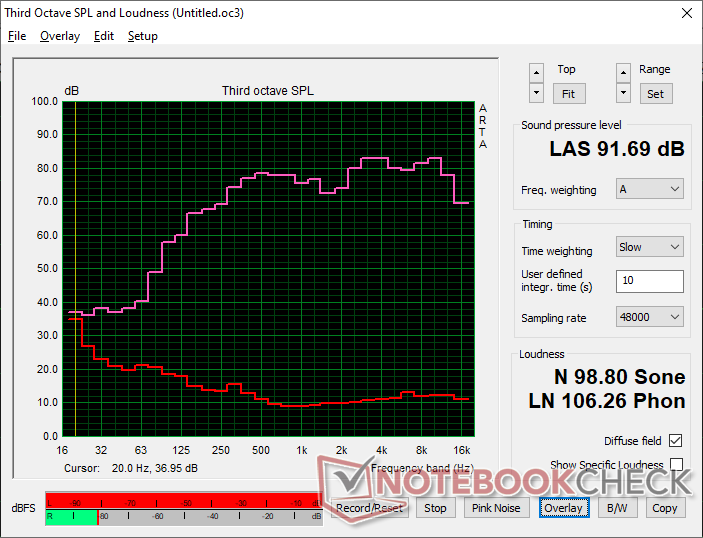
The two internal fans are quite small at just 30 mm in diameter each compared to 40 mm or greater on most other laptops. The main disadvantage with smaller fans is that they are generally higher-pitched than larger ones and so they are more noticeable when active. Our microphone measurements below confirm the higher-pitch noise with a relatively sharp peak of around 3k Hz compared to the broader peaks of other 13-inch subnotebooks like the XPS 13 Plus 9320. In other words, the fans in the Latitude 9330 are more likely to be distracting when browsing the web or streaming video.
When running 3DMark 06, fan noise would increase sharply from silent to 37 dB(A) about halfway through the first benchmark scene. The Dell is much louder than what we recorded on the HP Dragonfly Max while being on par with the Summit E13 Flip. We recommend running the system on Quiet or Balanced mode to keep fan pulsing at a minimum.
Noise Level
| Idle |
| 23 / 23.1 / 23.1 dB(A) |
| Load |
| 37.1 / 40.5 dB(A) |
 | ||
30 dB silent 40 dB(A) audible 50 dB(A) loud |
||
min: | ||
| Dell Latitude 9330 Iris Xe G7 96EUs, i7-1260U | Lenovo ThinkPad X1 Titanium Yoga G1 20QB0016GE Iris Xe G7 80EUs, i5-1140G7, Lenovo UMIS RPJTJ256MEE1OWX | MSI Summit E13 Flip Evo A11MT Iris Xe G7 96EUs, i7-1185G7, Phison 1TB SM2801T24GKBB4S-E162 | HP EliteBook x360 1030 G7 UHD Graphics 620, i7-10810U, Samsung SSD PM981a MZVLB512HBJQ | HP Elite Dragonfly Max Iris Xe G7 96EUs, i7-1185G7, Toshiba XG6 KXG60ZNV512G | Dell Latitude 5310-23VP6 UHD Graphics 620, i5-10310U, SK hynix BC511 HFM512GDHTNI-87A0B | |
|---|---|---|---|---|---|---|
| Noise | -9% | -8% | -13% | 5% | 1% | |
| off / environment * | 23 | 25.61 -11% | 24.5 -7% | 28.1 -22% | 24.9 -8% | 24.9 -8% |
| Idle Minimum * | 23 | 25.61 -11% | 24.7 -7% | 28.1 -22% | 24.9 -8% | 24.9 -8% |
| Idle Average * | 23.1 | 25.61 -11% | 24.7 -7% | 28.1 -22% | 24.9 -8% | 24.9 -8% |
| Idle Maximum * | 23.1 | 25.61 -11% | 26.4 -14% | 28.1 -22% | 24.9 -8% | 24.9 -8% |
| Load Average * | 37.1 | 40.14 -8% | 37.8 -2% | 35.1 5% | 29.7 20% | 30 19% |
| Witcher 3 ultra * | 40.6 | 41.4 -2% | 31.3 23% | 36 11% | ||
| Load Maximum * | 40.5 | 40.14 1% | 48.8 -20% | 37.6 7% | 31.3 23% | 36.3 10% |
* ... smaller is better
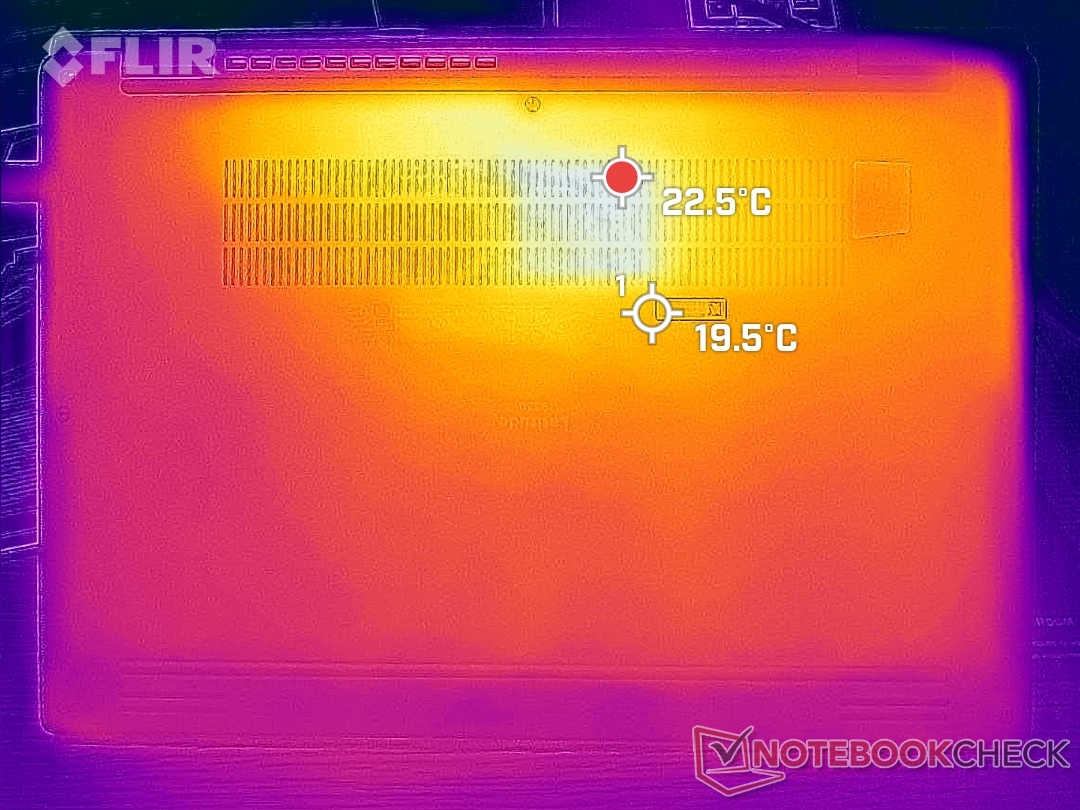
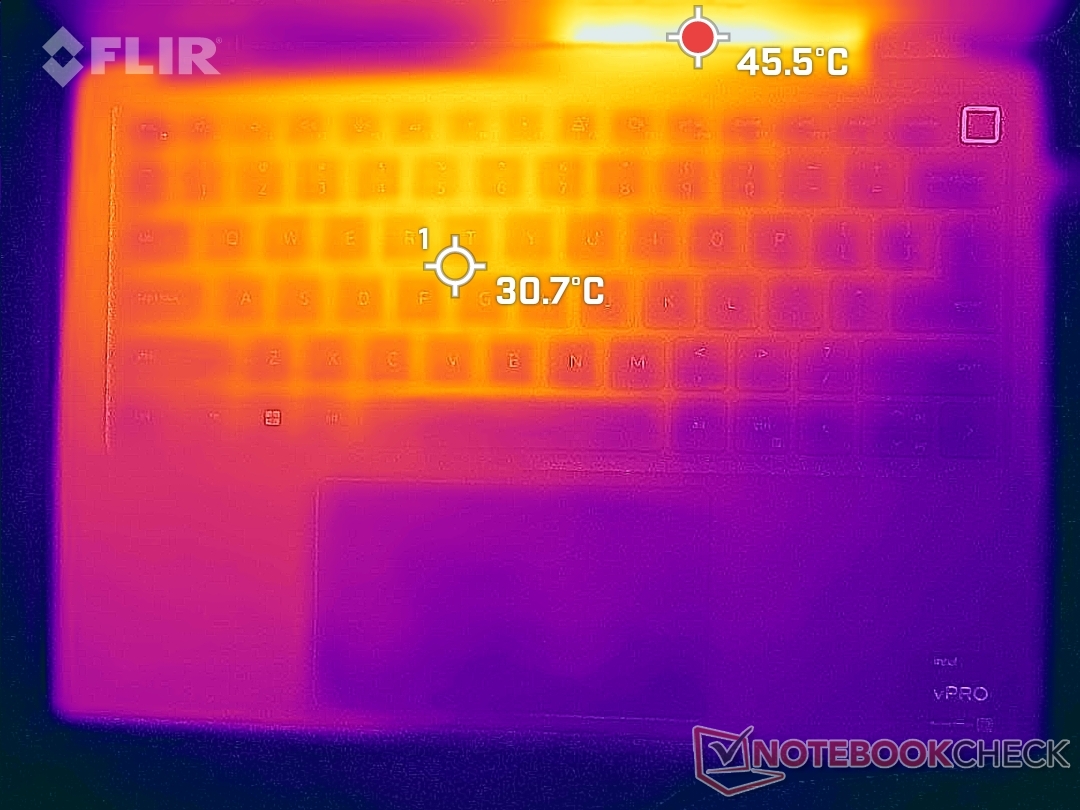
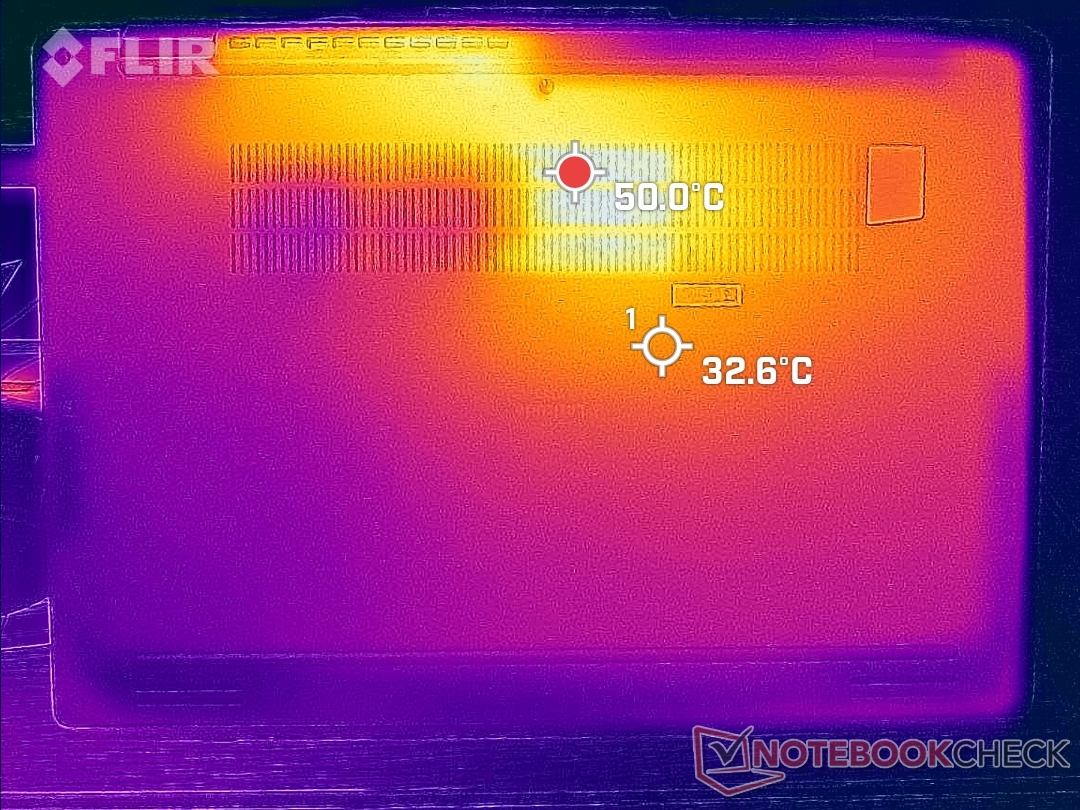
Temperature
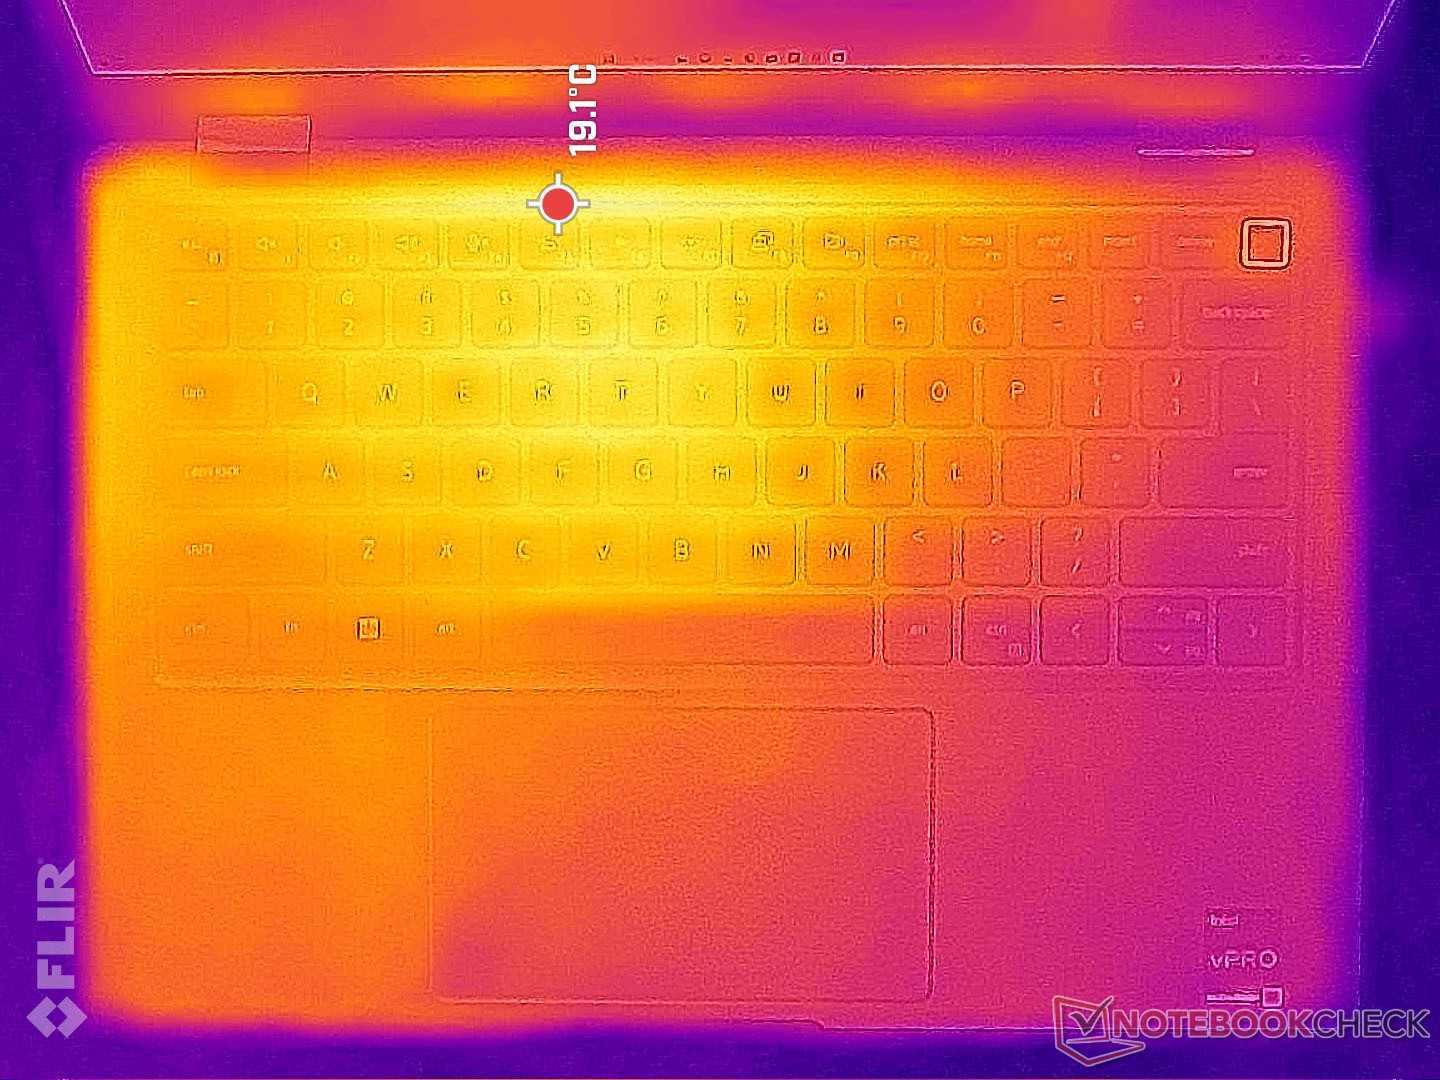
Surface temperatures are very cool during low loads since most of the chassis is metal. When subjected to higher loads, however, hot spots can reach up to 41 C and 50 C on the top and bottom, respectively. The hot spots are toward the rear of the chassis and so the keyboard and palm rests remain cooler for comfortable typing. The competing Dragonfly Max reaches similar maximums while the Summit E13 Flip can become even warmer at up to 57 C.
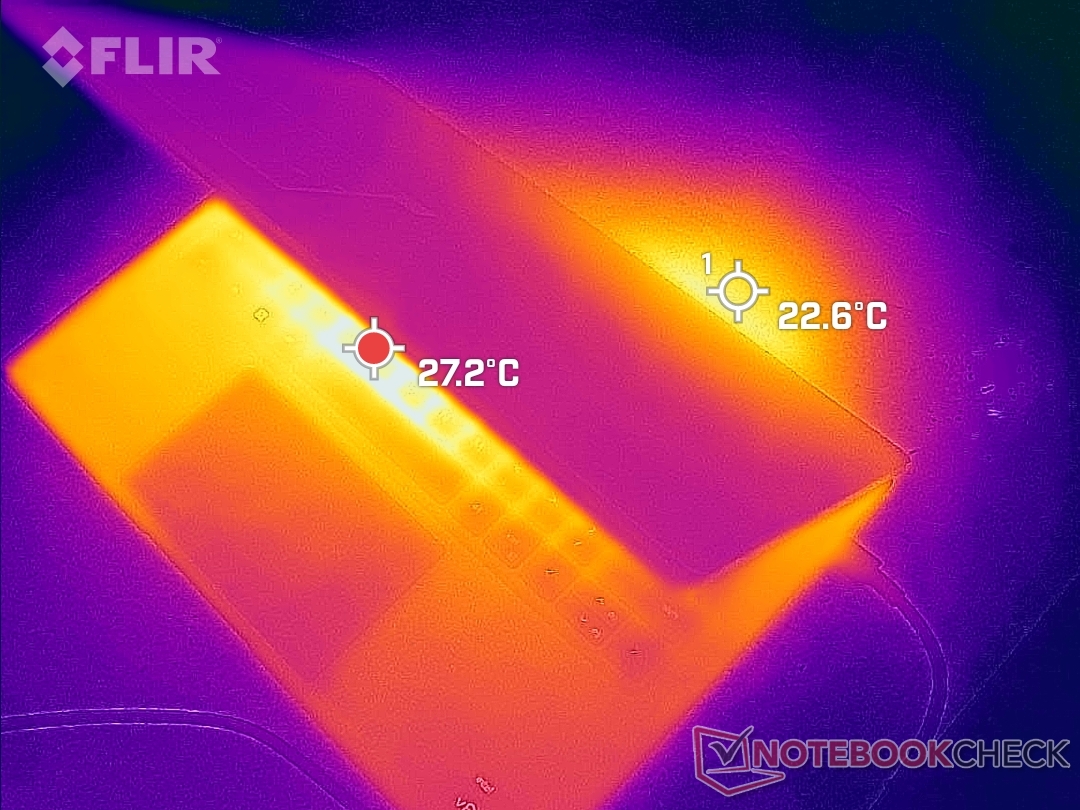
(±) The maximum temperature on the upper side is 40.6 °C / 105 F, compared to the average of 35.3 °C / 96 F, ranging from 19.6 to 55.7 °C for the class Convertible.
(-) The bottom heats up to a maximum of 50.2 °C / 122 F, compared to the average of 36.8 °C / 98 F
(+) In idle usage, the average temperature for the upper side is 23.5 °C / 74 F, compared to the device average of 30.2 °C / 86 F.
(+) The palmrests and touchpad are cooler than skin temperature with a maximum of 28 °C / 82.4 F and are therefore cool to the touch.
(±) The average temperature of the palmrest area of similar devices was 28.1 °C / 82.6 F (+0.1 °C / 0.2 F).
| Dell Latitude 9330 Intel Core i7-1260U, Intel Iris Xe Graphics G7 96EUs | Lenovo ThinkPad X1 Titanium Yoga G1 20QB0016GE Intel Core i5-1140G7, Intel Iris Xe Graphics G7 80EUs | MSI Summit E13 Flip Evo A11MT Intel Core i7-1185G7, Intel Iris Xe Graphics G7 96EUs | HP EliteBook x360 1030 G7 Intel Core i7-10810U, Intel UHD Graphics 620 | HP Elite Dragonfly Max Intel Core i7-1185G7, Intel Iris Xe Graphics G7 96EUs | Dell Latitude 5310-23VP6 Intel Core i5-10310U, Intel UHD Graphics 620 | |
|---|---|---|---|---|---|---|
| Heat | -3% | -22% | -2% | -11% | 6% | |
| Maximum Upper Side * | 40.6 | 46.3 -14% | 52 -28% | 37 9% | 39.4 3% | 39 4% |
| Maximum Bottom * | 50.2 | 43.3 14% | 57.4 -14% | 47.2 6% | 50 -0% | 44.8 11% |
| Idle Upper Side * | 25 | 26.8 -7% | 30.4 -22% | 25.8 -3% | 31.6 -26% | 24.3 3% |
| Idle Bottom * | 27.6 | 28.3 -3% | 34.2 -24% | 32.6 -18% | 33.4 -21% | 25.6 7% |
* ... smaller is better
Stress Test
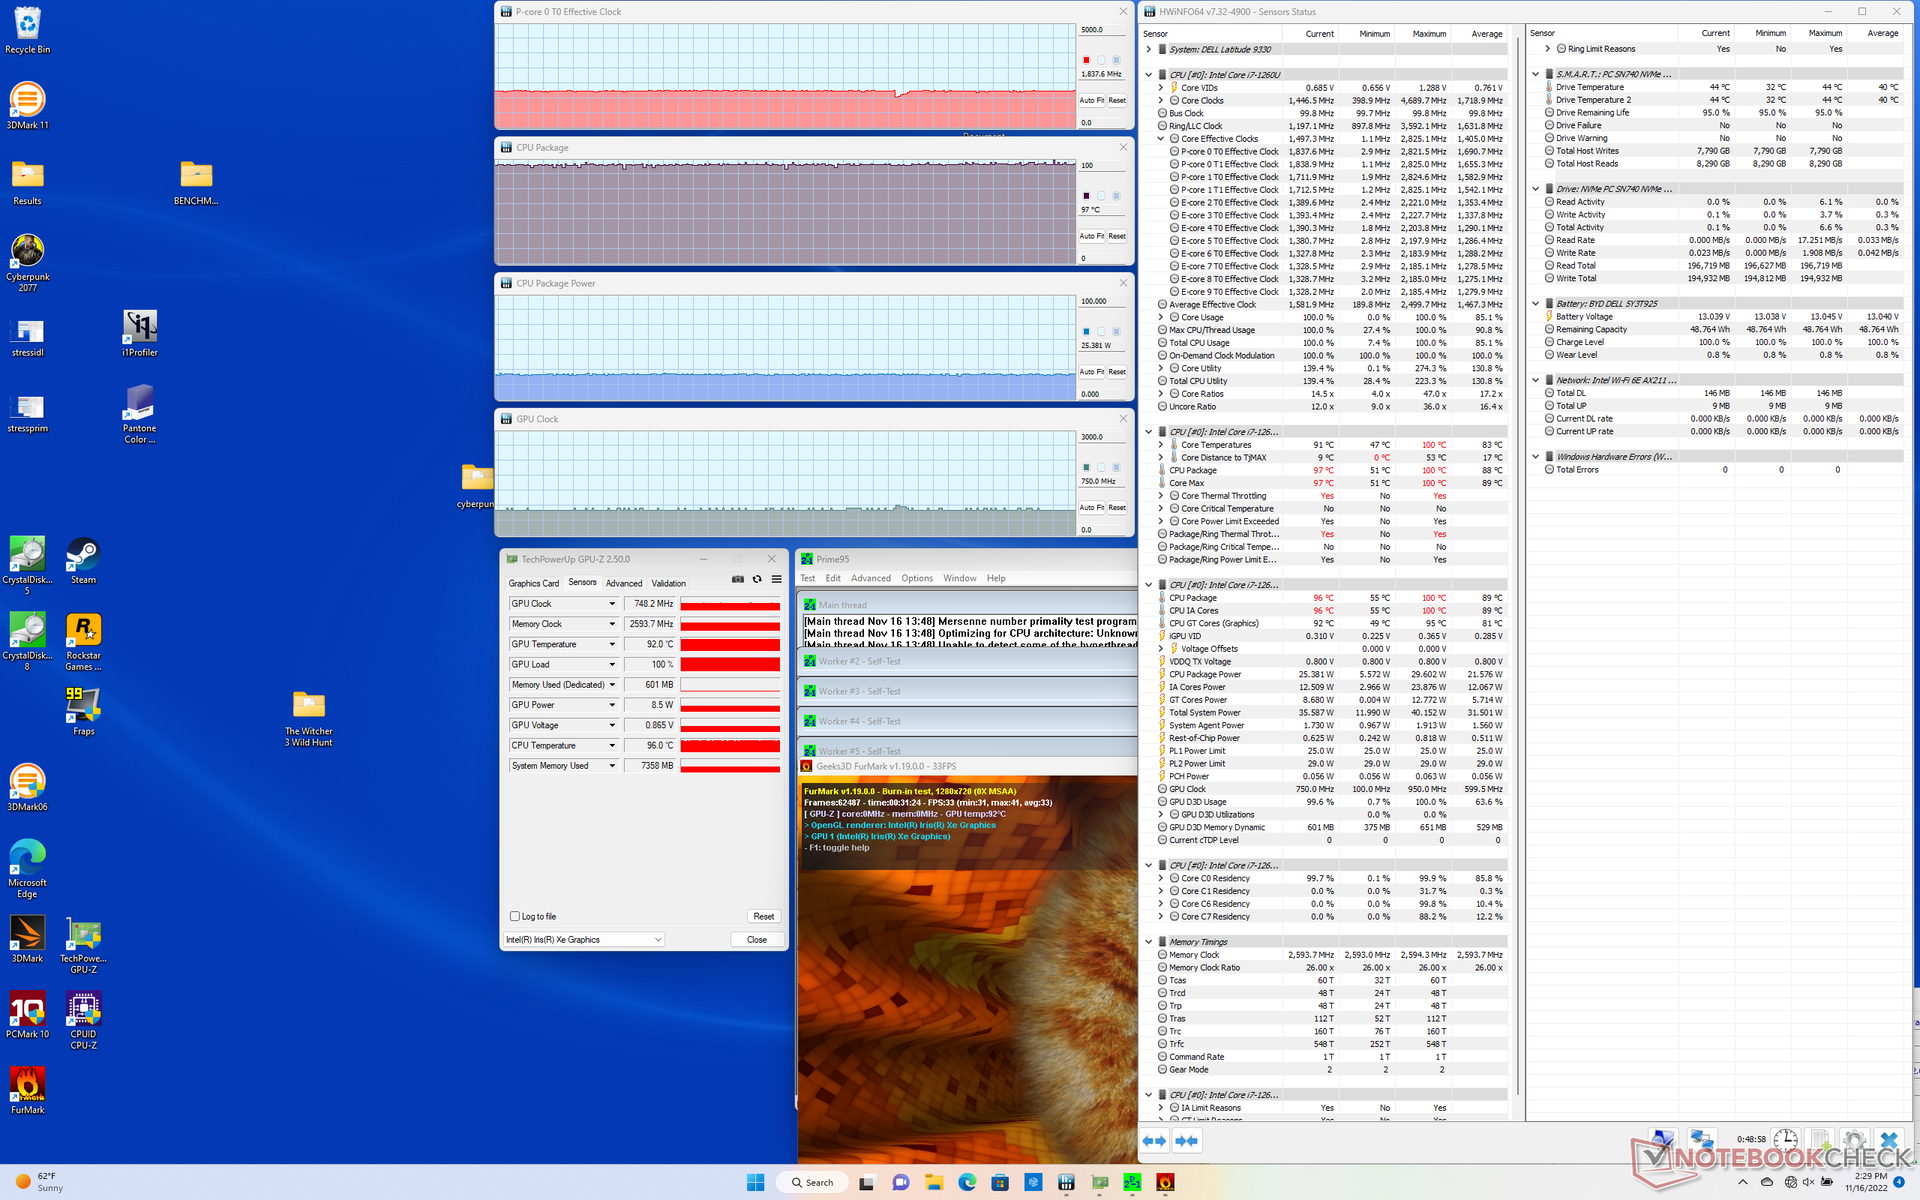
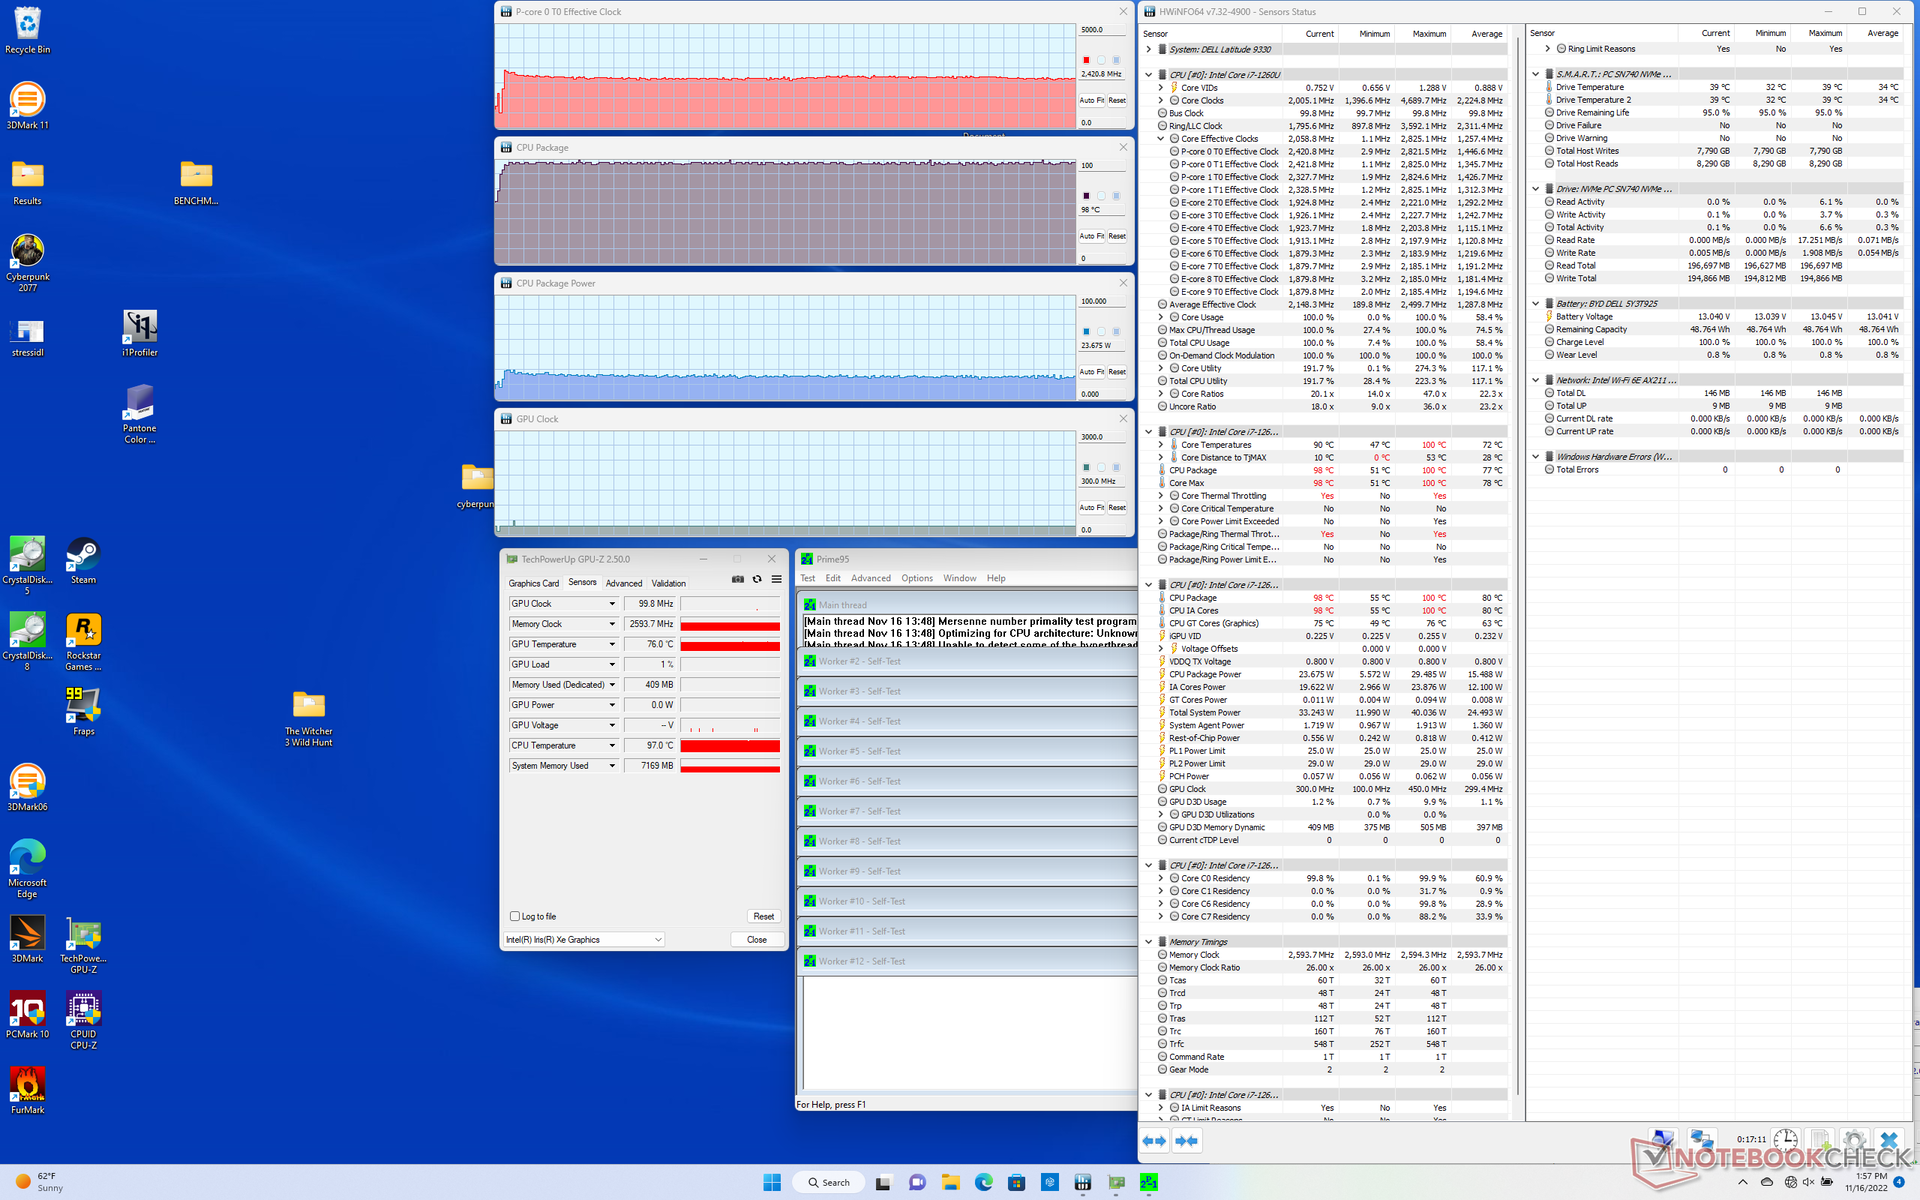
CPU temperature regularly reaches 90 C or higher when running demanding loads. When running Prime95, for example, the CPU would almost instantly shoot up to 99 C, 2.8 GHz, and 29 W, respectively, before quickly falling and stabilizing at 2.4 GHz and 25 W in order to maintain a core temperature of ~98 C. Running this same test on the Dragonfly Max with the Core i7-1185G7 would result in much slower clock rates and a cooler core temperature of just 1.5 GHz and 71 C, respectively. Dell isn't afraid to run the processor warmer than on most other models in order to offer faster performance.
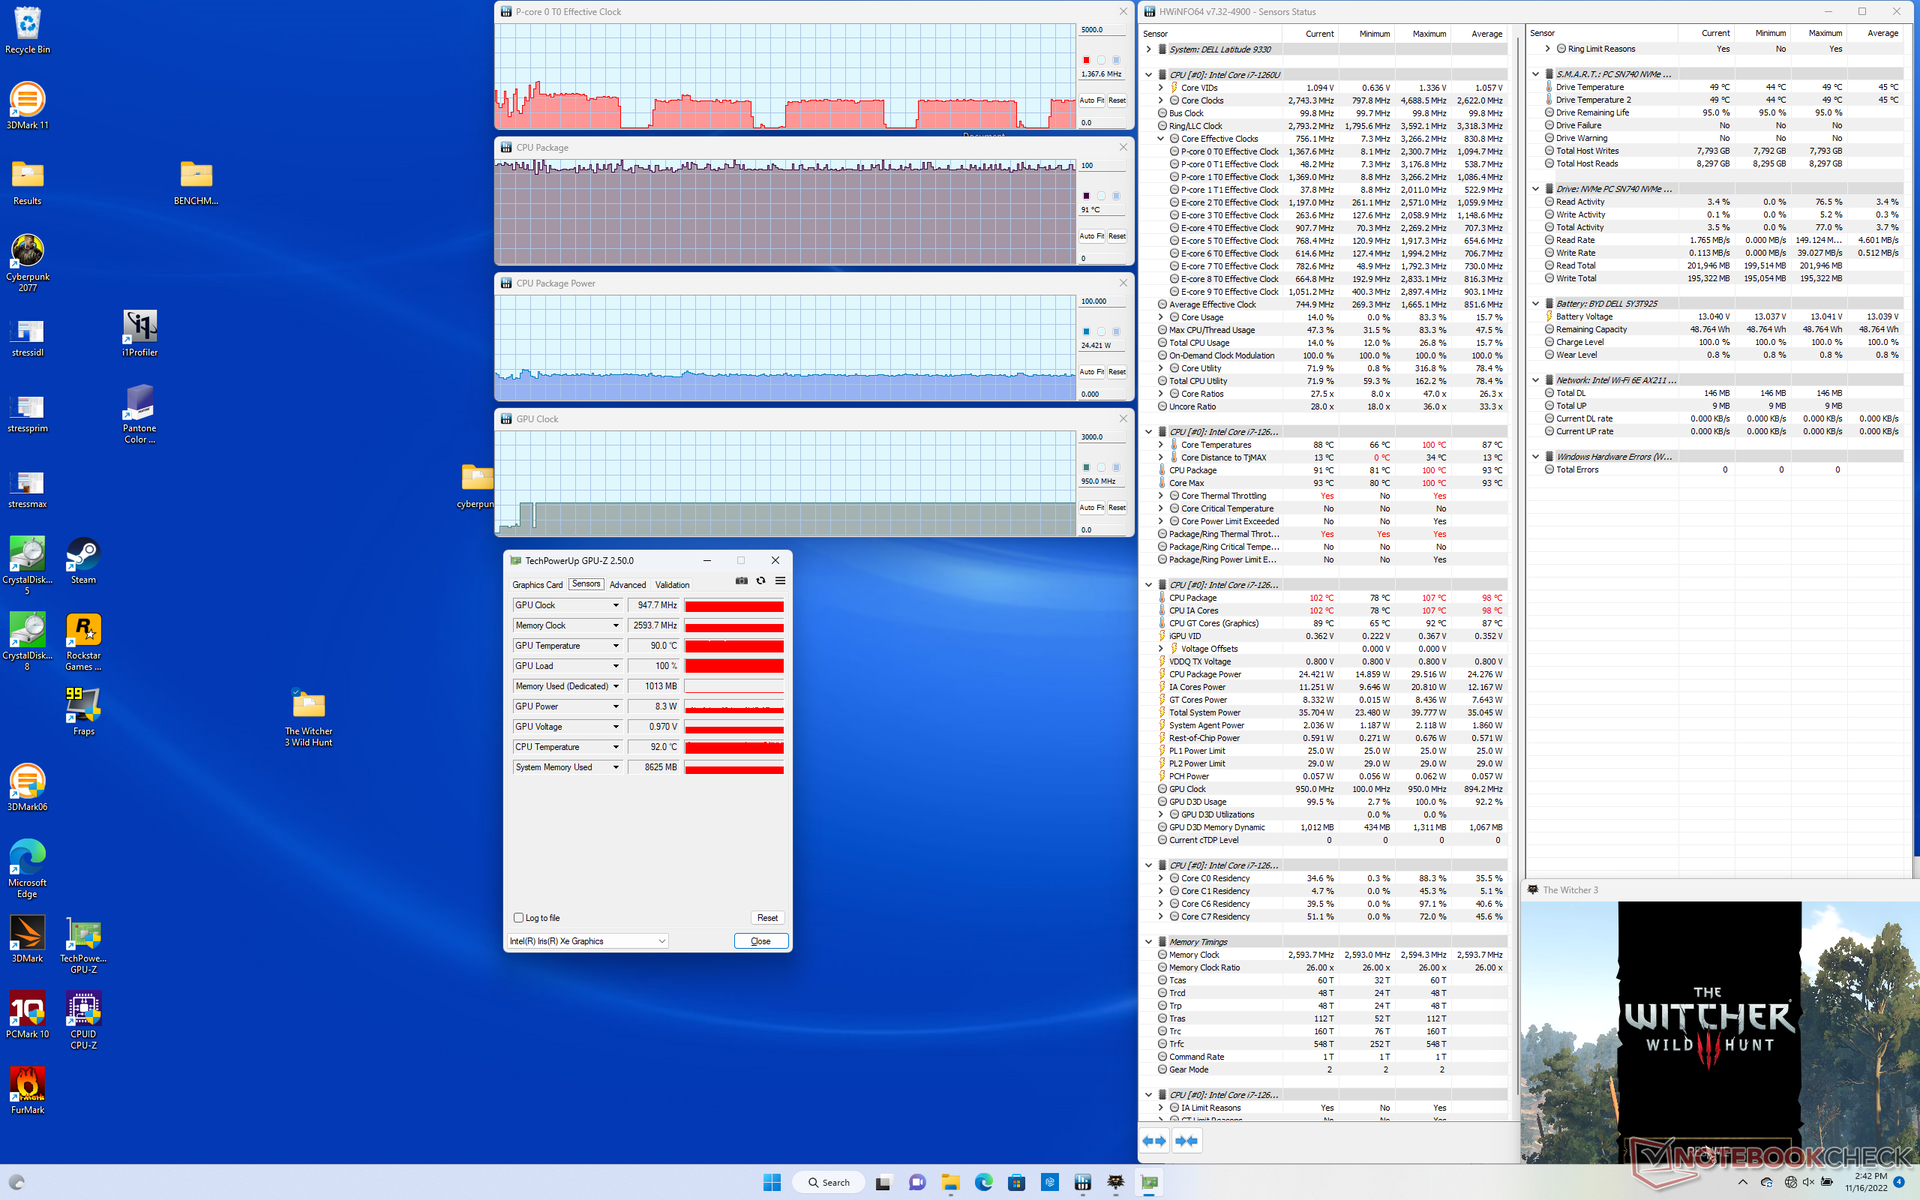
GPU clock rate and temperature when running Witcher 3 to represent demanding graphics load would stabilize at 948 MHz and 91 C, respectively, compared to just 700 MHz and 61 C on the aforementioned HP.
Running on battery power limits performance. A 3DMark 11 test on batteries would return Physics and Graphics scores of 7531 and 4193 points, respectively, compared to 12771 and 4820 points when on mains.
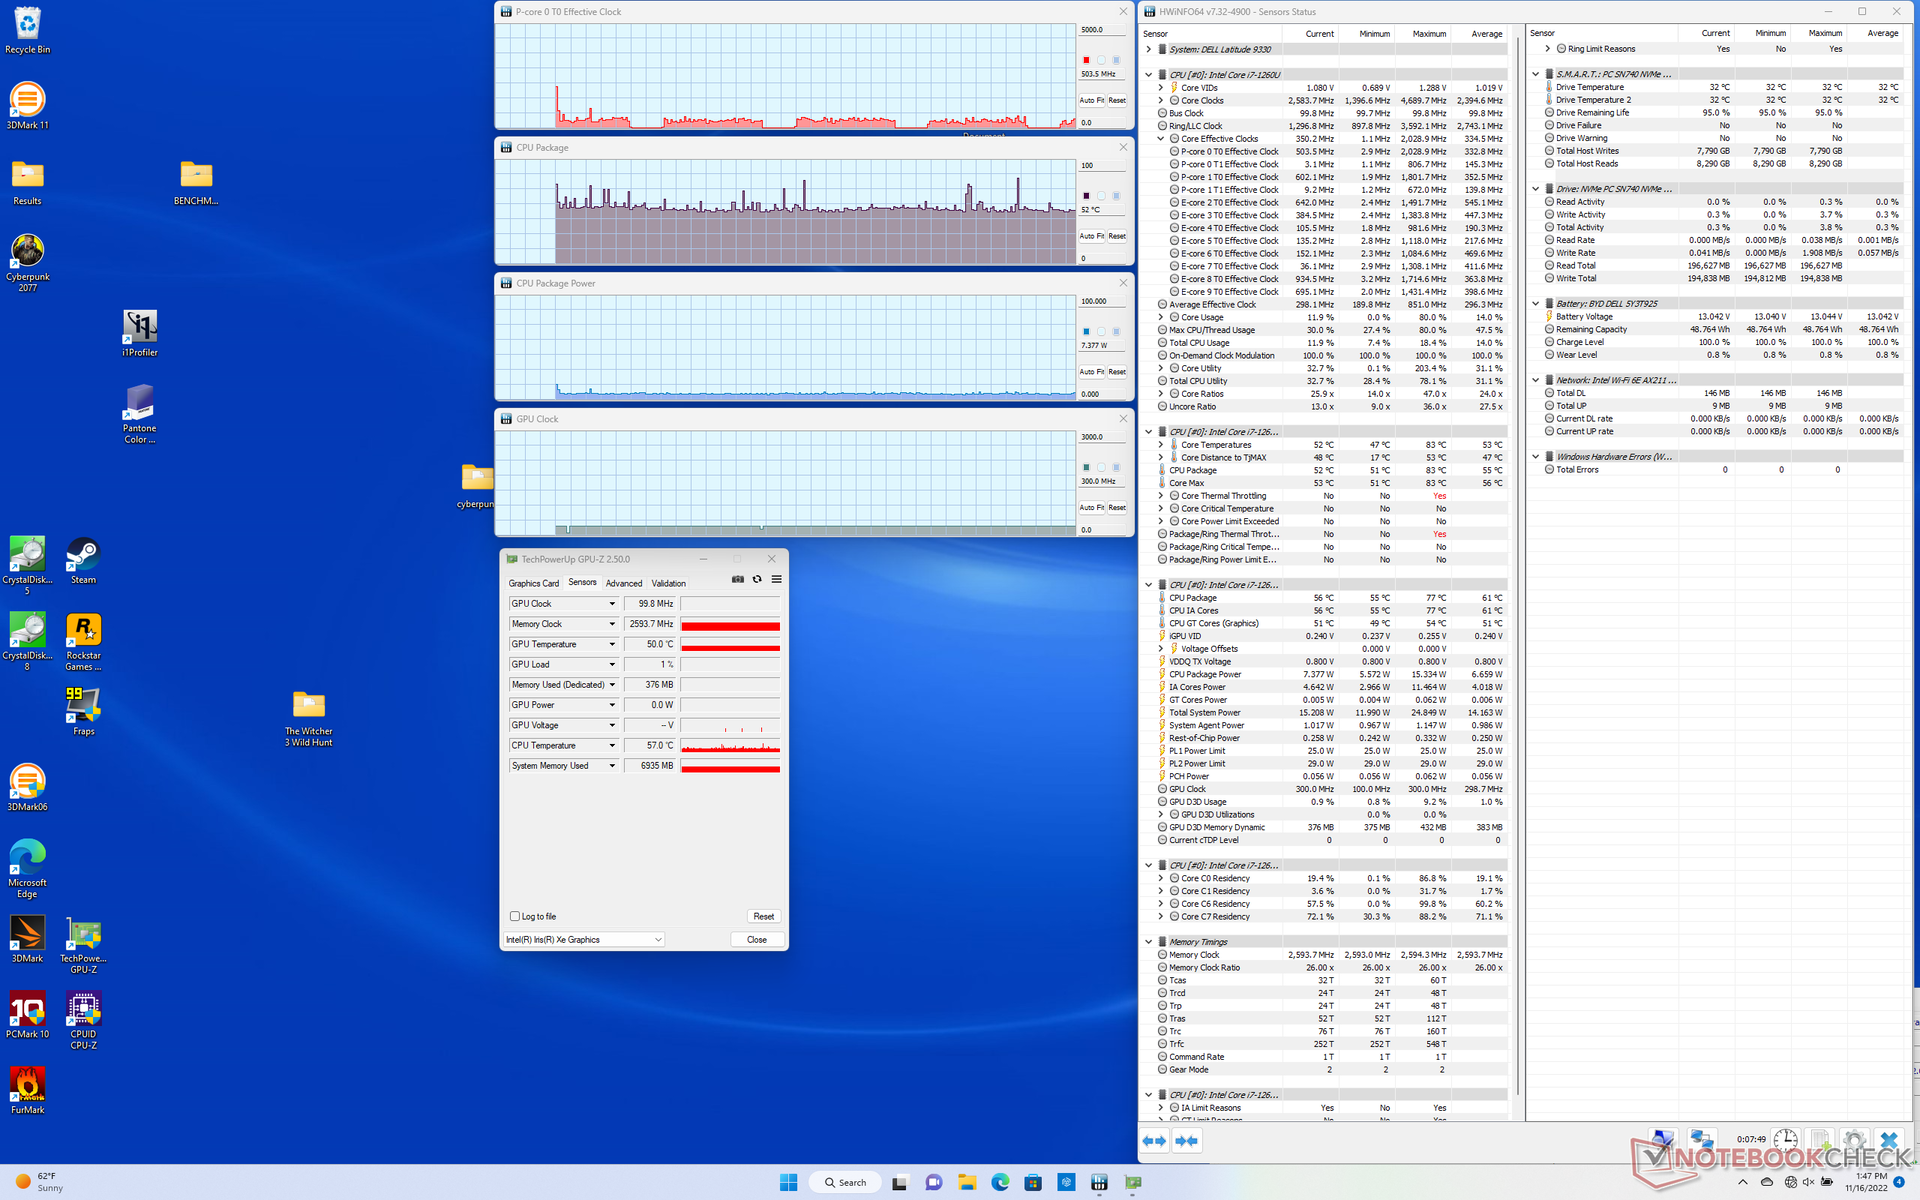
| CPU Clock (GHz) | GPU Clock (MHz) | Average CPU Temperature (°C) | |
| System Idle | -- | -- | 52 |
| Prime95 Stress | 2.4 | -- | 98 |
| Prime95 + FurMark Stress | 1.8 | 748 | 97 |
| Witcher 3 Stress | 1.4 | 948 | 91 |
Speakers
Dell has managed to squeeze in four individual speakers with excellent audio reproduction in spite of the small form factor. Maximum volume is loud and clear with no noticeable static. It's obvious that the internal speakers have been optimized for audio or video conferences.
Dell Latitude 9330 audio analysis
(+) | speakers can play relatively loud (91.7 dB)
Bass 100 - 315 Hz
(±) | reduced bass - on average 11.9% lower than median
(+) | bass is linear (6.3% delta to prev. frequency)
Mids 400 - 2000 Hz
(+) | balanced mids - only 1.9% away from median
(+) | mids are linear (2.7% delta to prev. frequency)
Highs 2 - 16 kHz
(+) | balanced highs - only 3.5% away from median
(+) | highs are linear (3.5% delta to prev. frequency)
Overall 100 - 16.000 Hz
(+) | overall sound is linear (9.2% difference to median)
Compared to same class
» 4% of all tested devices in this class were better, 1% similar, 96% worse
» The best had a delta of 6%, average was 21%, worst was 57%
Compared to all devices tested
» 2% of all tested devices were better, 1% similar, 97% worse
» The best had a delta of 4%, average was 25%, worst was 134%
Apple MacBook Pro 16 2021 M1 Pro audio analysis
(+) | speakers can play relatively loud (84.7 dB)
Bass 100 - 315 Hz
(+) | good bass - only 3.8% away from median
(+) | bass is linear (5.2% delta to prev. frequency)
Mids 400 - 2000 Hz
(+) | balanced mids - only 1.3% away from median
(+) | mids are linear (2.1% delta to prev. frequency)
Highs 2 - 16 kHz
(+) | balanced highs - only 1.9% away from median
(+) | highs are linear (2.7% delta to prev. frequency)
Overall 100 - 16.000 Hz
(+) | overall sound is linear (4.6% difference to median)
Compared to same class
» 0% of all tested devices in this class were better, 0% similar, 100% worse
» The best had a delta of 5%, average was 18%, worst was 45%
Compared to all devices tested
» 0% of all tested devices were better, 0% similar, 100% worse
» The best had a delta of 4%, average was 25%, worst was 134%
Energy Management
Power Consumption — High Performance-Per-Watt
The system is very power efficient as one would expect from a laptop powered by a Core U-series CPU. Most notable is the fact that our Latitude 9330 would consume about 23 percent less power than the older Latitude 5310 when running GPU-intensive applications while offering 2x to 3x the graphics performance. Users upgrading from 10th gen or older Intel CPUs will see significant performance-per-watt gains as a result.
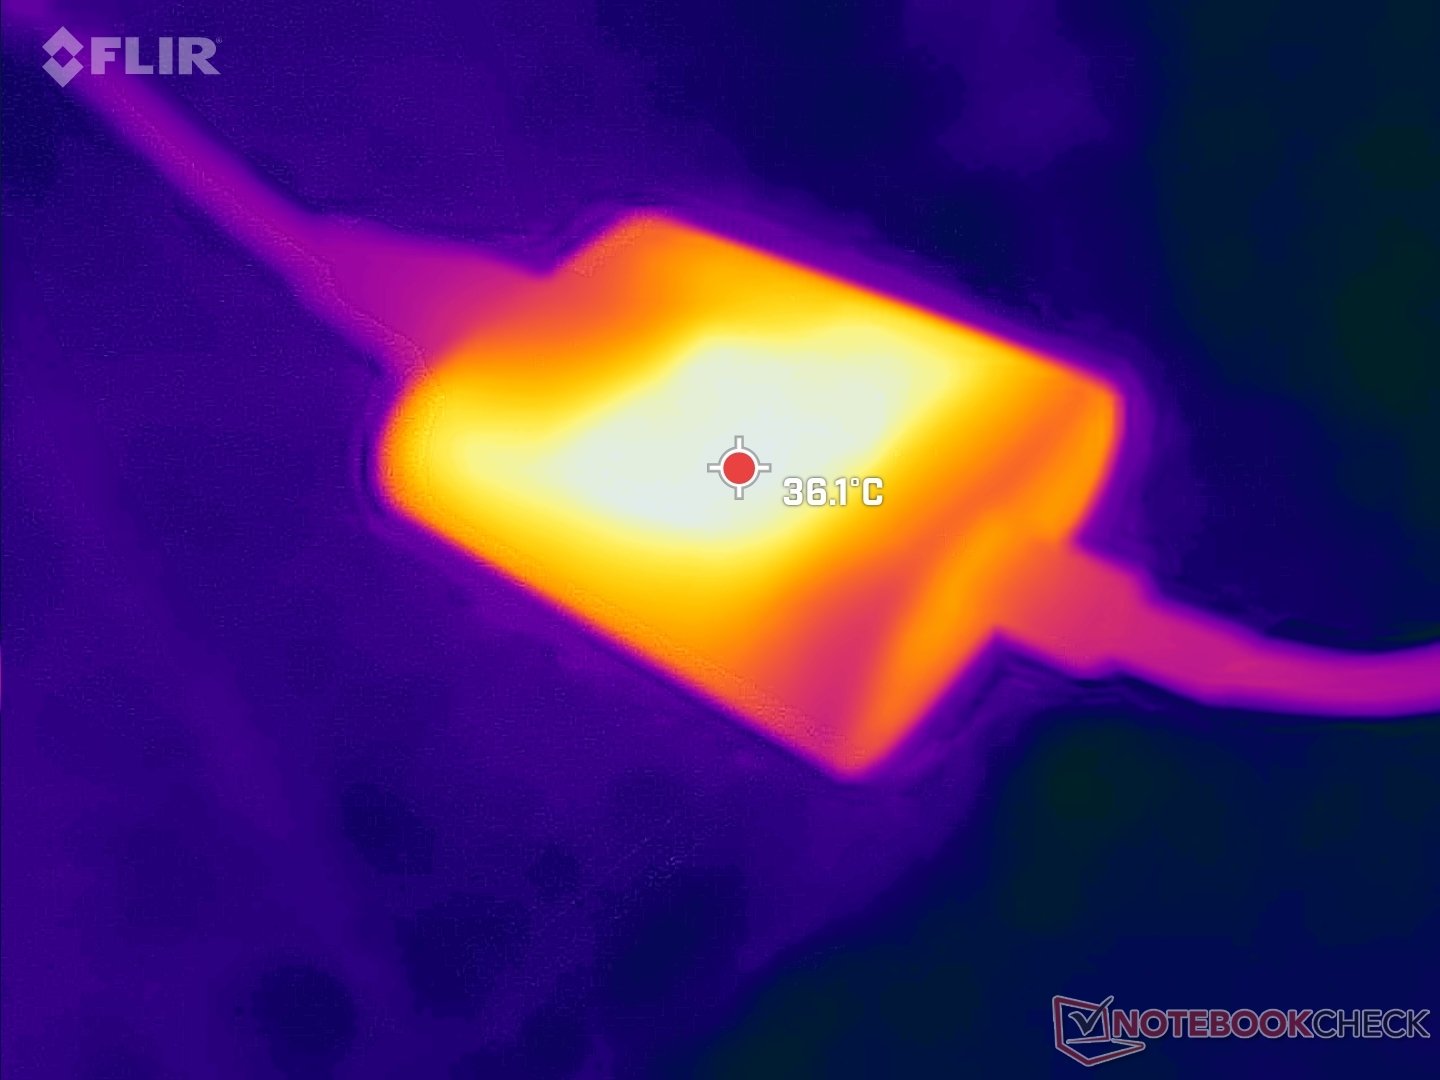
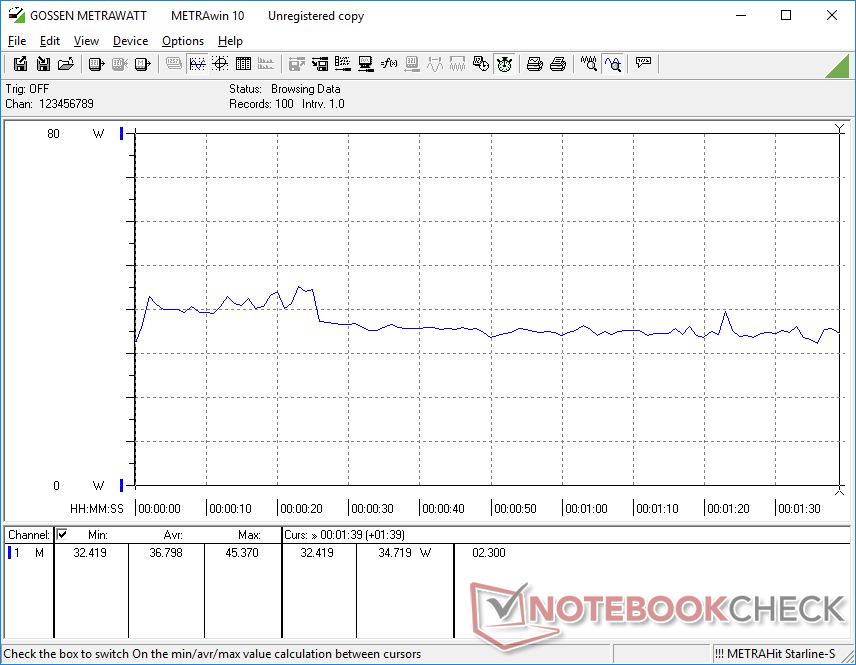
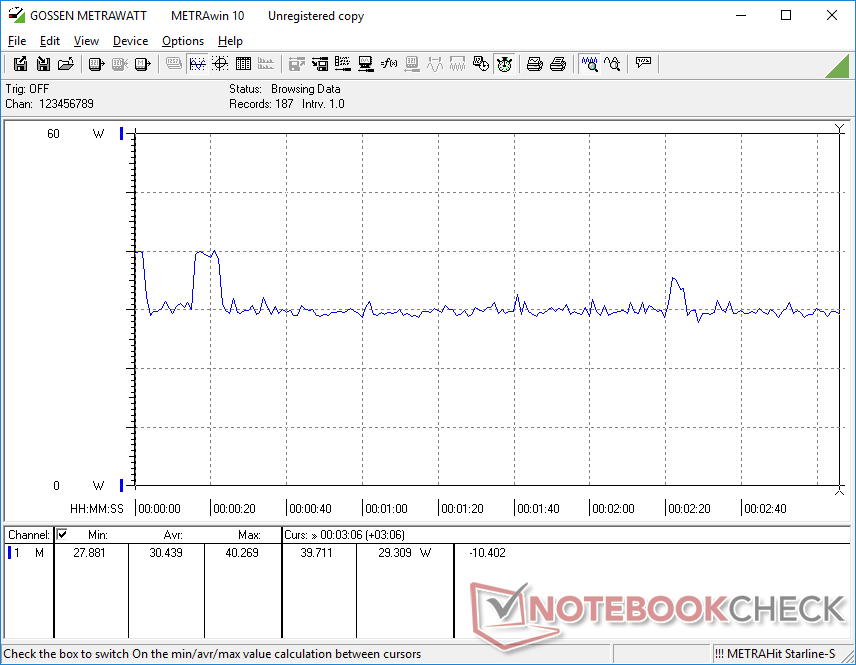
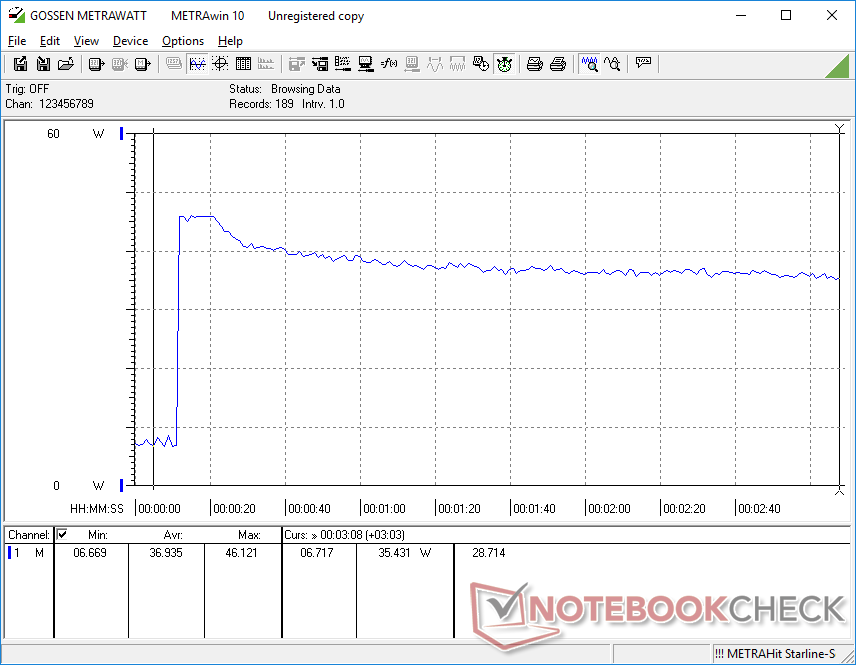
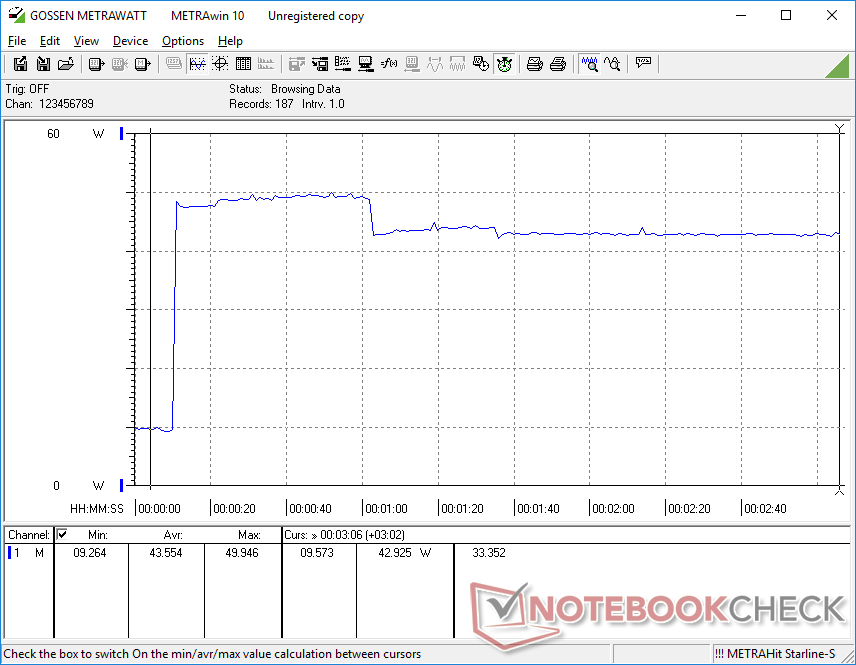
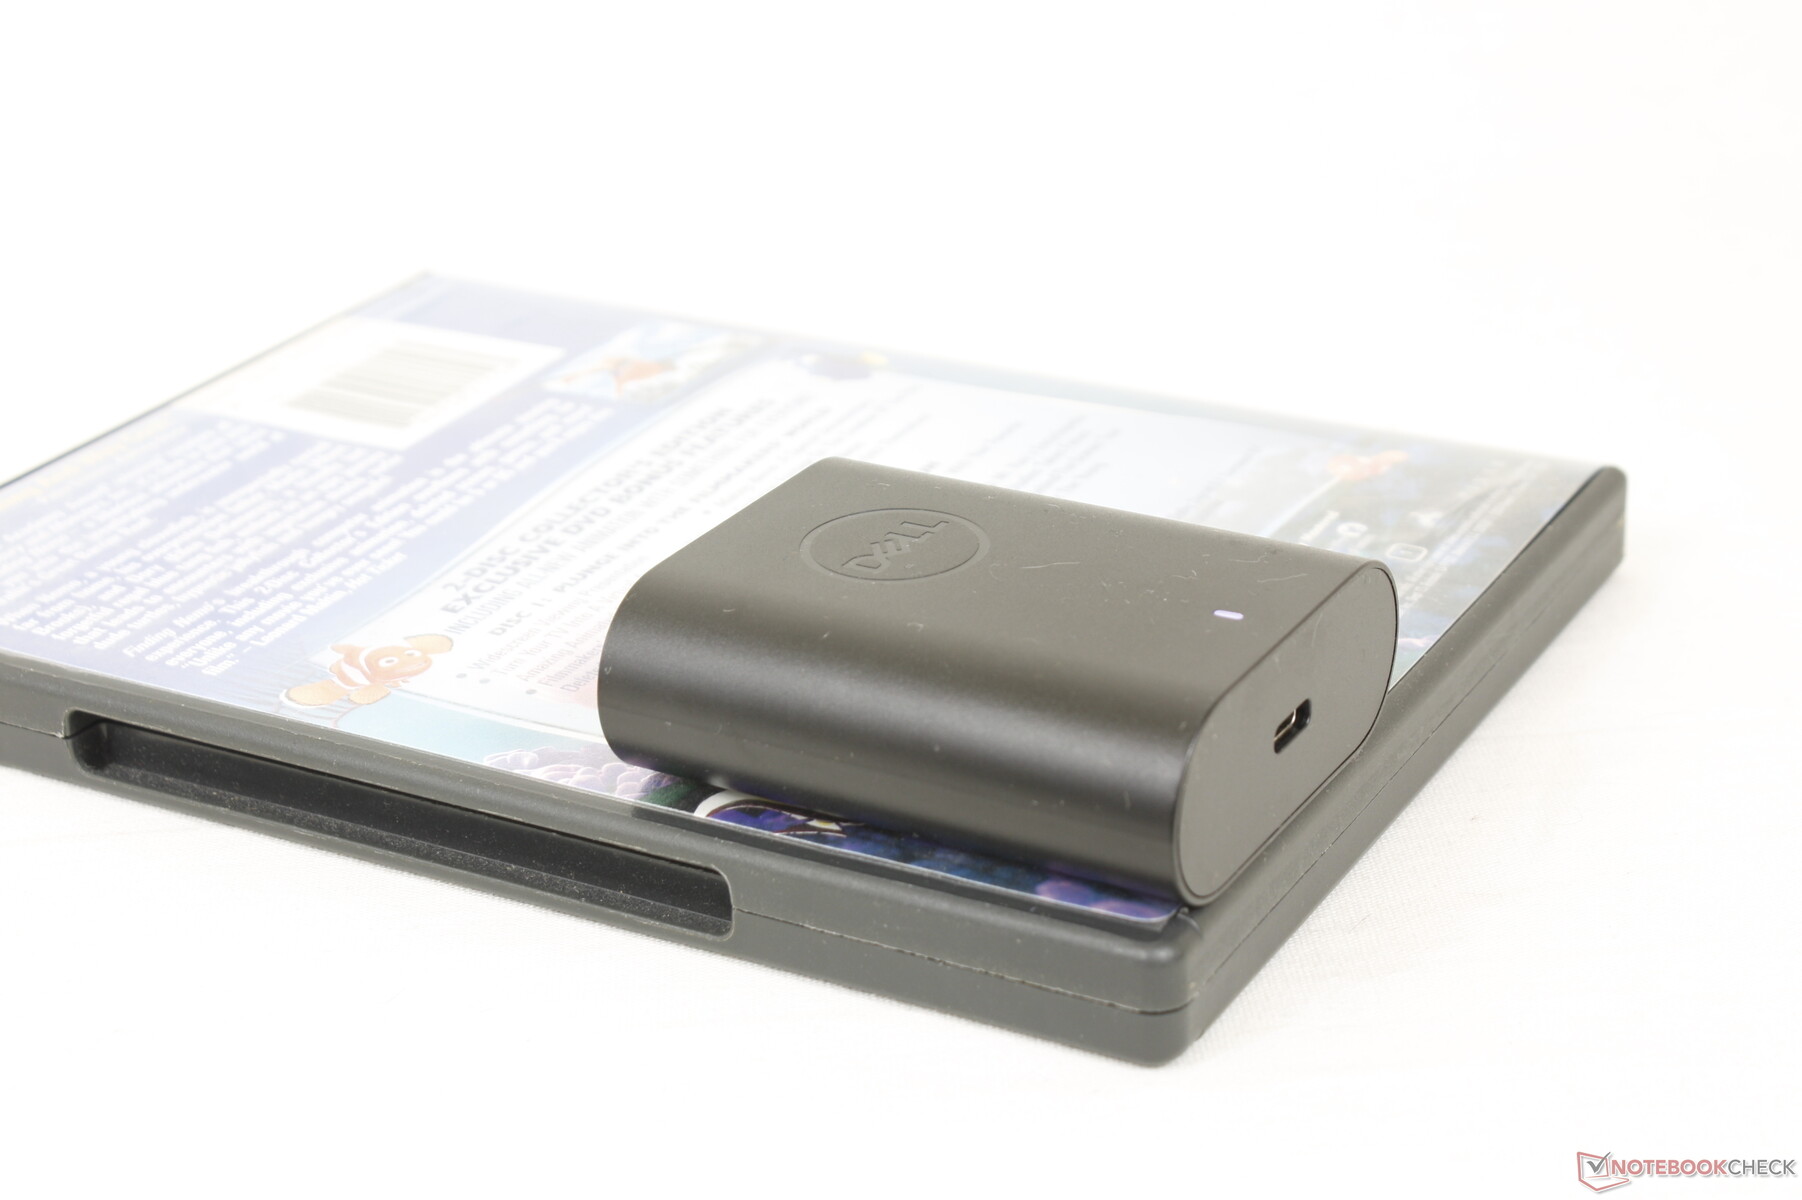
Power consumption is about 27 percent less than the Core i7-1255U-powered Spectre x360 13.5 when running Prime95 stress. We're able to measure a temporary maximum draw of 50 W from the small (~6.7 x 5.3 x 2.3 cm) 60 W USB-C AC adapter when the CPU is at 100 percent utilization. Power draw falls over time as shown by our graphs below as maximum Turbo Boost performance is not indefinite.
| Off / Standby | |
| Idle | |
| Load |
|
| Dell Latitude 9330 i7-1260U, Iris Xe G7 96EUs, , IPS, 2560x1600, 13.30 | Lenovo ThinkPad X1 Titanium Yoga G1 20QB0016GE i5-1140G7, Iris Xe G7 80EUs, Lenovo UMIS RPJTJ256MEE1OWX, IPS LED, 2256x1504, 13.50 | MSI Summit E13 Flip Evo A11MT i7-1185G7, Iris Xe G7 96EUs, Phison 1TB SM2801T24GKBB4S-E162, IPS, 1920x1200, 13.40 | HP Elite Dragonfly Max i7-1185G7, Iris Xe G7 96EUs, Toshiba XG6 KXG60ZNV512G, IPS, 1920x1080, 13.30 | Dell Latitude 5310-23VP6 i5-10310U, UHD Graphics 620, SK hynix BC511 HFM512GDHTNI-87A0B, IPS, 1920x1080, 13.30 | Lenovo Yoga Slim 9 14IAP7 i7-1280P, Iris Xe G7 96EUs, Samsung PM9B1 1024GB MZAL41T0HBLB, OLED, 2880x1800, 14.00 | |
|---|---|---|---|---|---|---|
| Power Consumption | 11% | -23% | -5% | 5% | -98% | |
| Idle Minimum * | 4.7 | 3.75 20% | 4.8 -2% | 2.9 38% | 2.9 38% | 11.8 -151% |
| Idle Average * | 8.2 | 7.75 5% | 8.4 -2% | 9.9 -21% | 5.9 28% | 17.4 -112% |
| Idle Maximum * | 8.4 | 8.69 -3% | 8.6 -2% | 10.4 -24% | 6.7 20% | 22.4 -167% |
| Load Average * | 36.8 | 33.12 10% | 47.1 -28% | 37.1 -1% | 42 -14% | 53 -44% |
| Witcher 3 ultra * | 30.4 | 28.7 6% | 51.6 -70% | 31.5 -4% | 43 -41% | 52.6 -73% |
| Load Maximum * | 49.9 | 35.19 29% | 65.9 -32% | 58.8 -18% | 50 -0% | 71 -42% |
* ... smaller is better
Power Consumption Witcher 3 / Stresstest
Power Consumption external Monitor
Battery Life — Good For A Work Day
Battery capacity is average for a subnotebook at 50 Wh. Runtimes are still good nonetheless at almost 9.5 hours of real-world WLAN use to be just slightly shorter than on the HP Dragonfly Max or MSI Summit E13 Flip.
Charging from empty to full capacity takes about 90 minutes.
| Dell Latitude 9330 i7-1260U, Iris Xe G7 96EUs, 50 Wh | Lenovo ThinkPad X1 Titanium Yoga G1 20QA001RGE i7-1160G7, Iris Xe G7 96EUs, 44.5 Wh | MSI Summit E13 Flip Evo A11MT i7-1185G7, Iris Xe G7 96EUs, 70 Wh | HP EliteBook x360 1030 G7 i7-10810U, UHD Graphics 620, 54 Wh | HP Elite Dragonfly Max i7-1185G7, Iris Xe G7 96EUs, 56 Wh | Dell Latitude 5310-23VP6 i5-10310U, UHD Graphics 620, 60 Wh | |
|---|---|---|---|---|---|---|
| Battery Runtime | -15% | 11% | 35% | 43% | 18% | |
| Reader / Idle | 923 | 1267 37% | 1855 101% | 1723 87% | ||
| WiFi v1.3 | 564 | 506 -10% | 672 19% | 617 9% | 659 17% | 665 18% |
| Load | 140 | 112 -20% | 109 -22% | 135 -4% | 174 24% | |
| H.264 | 685 |
Pros
Cons
Verdict — Excelling Where It Matters
The Latitude 9330 2-in-1 is highly optimized for office environments with features not available on most consumer-centric models including the XPS 13. Build quality and rigidity are some of the best we've seen for an ultrathin 13-inch convertible to give us more confidence in the longevity and reliability of the model. If you decide to invest in the Latitude 9330, then it will more than likely last you for several years.
Though the Dell system is good to excellent in most areas, it's beginning to fall behind in a few others. Competing models from HP are shipping with 1000-nit display options and 5 MP webcams whereas the Latitude 9330 is stuck at 500 nits and 2 MP. The lack of USB-A and HDMI ports will also likely irk many users. Be prepared for noticeably louder fan noise if you intend to run demanding loads on the Dell as well.
Aside from a few average specifications, the Dell Latitude 9330 2-in-1 is our top business convertible to recommend if you want something that will last for several years.
Other drawbacks such as the lesser graphics performance, warmer core temperatures, and no support for M.2 2280 SSDs are relatively minor considering the target audience of business or enterprise users. We would absolutely love to see higher refresh rate display options with faster black-white response times in the future as the smoother frame rate would significantly improve the touchscreen user experience.
Price and Availability
Dell is now shipping the Latitude 9330 2-in-1 starting at $2065 USD up to over $2700 USD if fully configured.
Dell Latitude 9330
-
11/18/2022 v7
Allen Ngo
More articles related to this device
Dell Latitude 9330 (Latitude Series)Related Articles


Pricecompare
