 Deutsch
 English
 Español
 Français
 Italiano
 Nederlands
 Polski
 Português
 Русский
 Türkçe
 Svenska
 Chinese
 Magyar
Intel Atom x7-Z8700 vs Intel Pentium N4200 vs Intel Atom x7-Z8750
Intel Atom x7-Z8700
► remove from comparison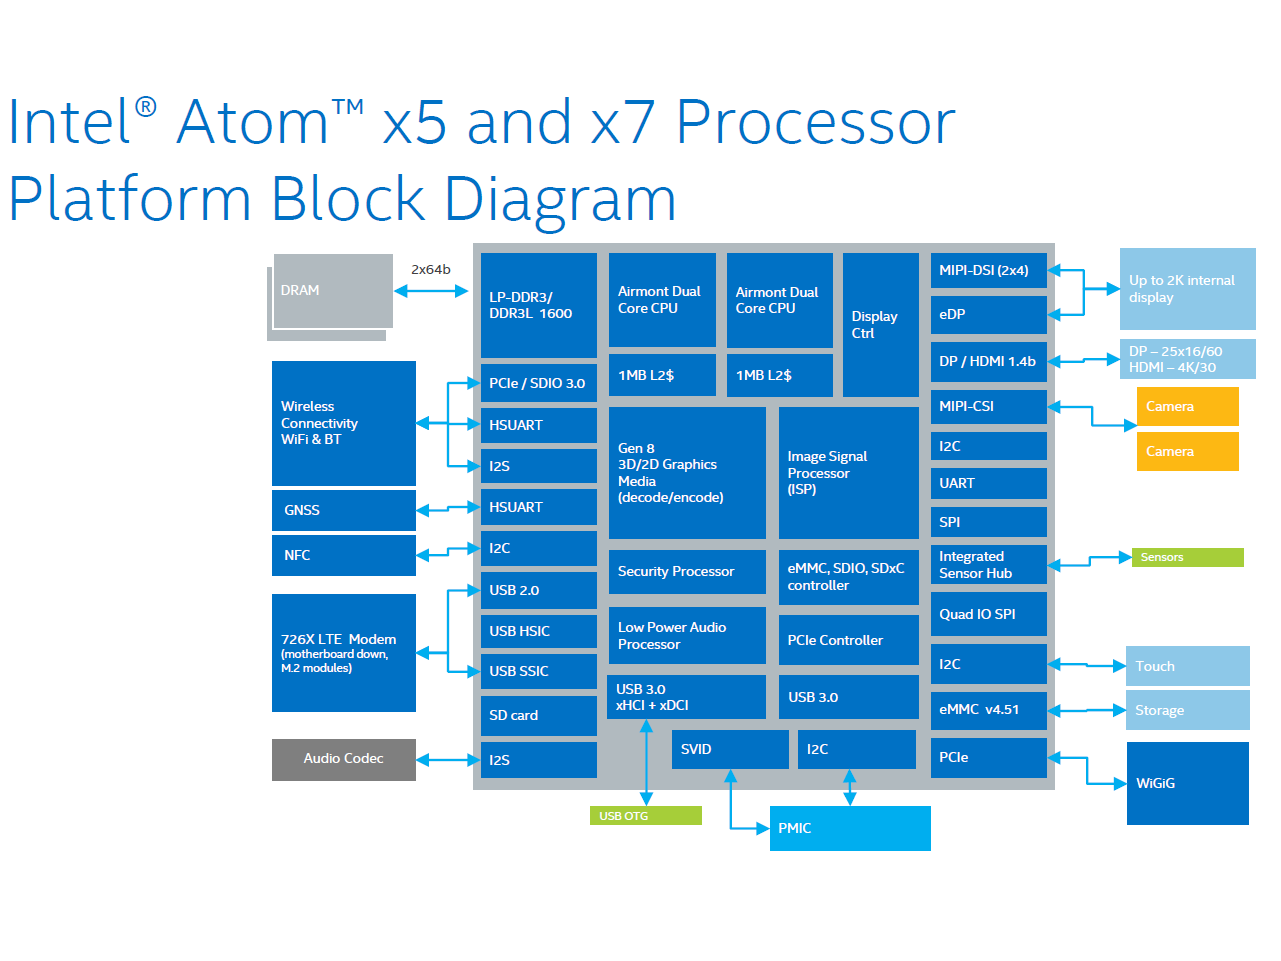
The Intel Atom x7-Z8700 is a power efficient quad-core SoC for Windows and Android devices (tablets and convertibles), which has been presented in March 2015. It is clocked at 1.6 - 2.4 GHz and part of the Cherry Trail platform. Thanks to its new 14 nanometer low-power process (P1273) with tri-gate transistors, energy efficiency has been significantly improved compared to its predecessor Bay Trail-T (e.g. Atom Z3795). In addition to the CPU cores, the SoC offers a DirectX 11.2-capable GPU as well as a LPDDR3 Memory Controller (2x 64 bit, 25.6 GB/s).
Architecture
The processor cores are based on the Airmont architecture, which is basically a slightly modified shrink of the previous Silvermont core. While performance per clock has not been improved, the more efficient 14 nm process leads to a better utilization of the CPU Burst (alias Turbo Boost) and a therefore somewhat higher overall performance.
Performance
Compared to the Atom Z3795, the Atom x7-Z8700 offers about 5 percent more performance and is similar fast as an AMD A6-6210 APU or high-end ARM SoCs, e.g. the Snapdragon 810 or Exynos 7420.
Using Windows, the performance is adequate for everyday tasks such as Internet or Office, but not for very complex software or modern games.
Graphics
The HD Graphics (Cherry Trail) is based on the Intel Gen8 architecture, which supports DirectX 11.2 and is also found in the Broadwell series (e.g. HD Graphics 5300). With 16 EUs (Execution Units) and a clock speed of up to 600 MHz, the GPU is about twice as fast as the HD Graphics (Bay Trail) and will handle older and less demandig Windows games (e.g. Counter-Strike: GO) in low settings at decent frame rates. The GPU also supports 4K/H.265 video acceleration.
Compared to ARM SoCs, the HD Graphics offers a performance somewhere between the Qualcomm Adreno 330 / PowerVR G6430 and the Adreno 420 / PowerVR GX6450.
Power Consumption
The entire SoC is rated at an SDP of 2 watts, which indicates a TDP of less than 4 watts. Thus, the chip can be used in passively cooled tablets.
Intel Pentium N4200
► remove from comparisonThe Intel Pentium N4200 is an Apollo Lake family, quad-core, ultra-low-power processor (SoC) that saw the light of day in 2016. Its four cores run at 1.1 GHz to 2.5 GHz, with only 2.4 GHz available when all the cores are fully loaded; there is no Hyper-Threading here and thus no additional threads. This chip has a fairly competent integrated graphics solution, the Intel HD Graphics 505, and eats very little (~6 W).
Curiously enough, Intel keeps making and selling the Pentium as of early 2023.
Architecture
Just like other Celeron N, Celeron J, Pentium N, Pentium J processors, this Pentium is notable for its small die size. It is easy to manufacture, lowering the costs and enabling Intel to compete with various ARM-based products such as the Raspberry Pi series.
The Pentium N4200 features the Goldmont CPU microarchitecture that came to replace Silvermont (2013), bringing with it several welcome improvements. There is still no L3 cache to be found here, however, it now takes less cycles to perform many operations, making for a double-digit IPC improvement.
The Pentium is compatible with DDR3L-1866, LPDDR3-1866, LPDDR4-2400 RAM. Intel's guidelines state that up to 8 GB are supported; that being said, various forum users report that the CPU functions just fine if mated to 16 GB and even 32 GB of RAM. The chip features six PCI-Express 2.0 lanes for connecting various devices, meaning a four-lane NVMe SSD will not be able to deliver a data transfer rate of more than 2 GB/s. eMMC and SATA storage is supported natively, too.
This Intel CPU is Secure Boot-compatible; technically, it will have no issue running 64-bit Windows 11. However, Microsoft only allows Windows 11 to be installed on systems with CPUs released in 2017 or later, making 64-bit Windows 10 the only OS that the Pentium is officially compatible with.
Last but not the least, please keep in mind that this is not a user-replaceable CPU. It gets permanently soldered to the motherboard (BGA1296 socket interface).
Performance
The average N4200 in our database competes with the Core i5-3339Y, a power efficient chip launched in 2013, as far as multi-thread benchmark scores are concerned, with the (much less ancient) Celeron 6305 lurking a little behind the two. In other words, the Pentium is a slow processor suitable for the most basic tasks only. As of 2021, it is light years behind the latest processors making use of high-performance architectures, such as the Zen 2-powered AMD Ryzen 3 5300U.
The Acer Aspire ES 17 ES1-732 is among the fastest laptops built around the N4200 that we know of. It can be around 50% faster than the slowest system featuring the same CPU in our database, depending on the circumstances.
Graphics
The HD Graphics 505 (18 EUs) is a rather good iGPU, considering this is a lower-end SoC released in 2016 we are talking about. As far as the feature set is concerned, the HD 505 is not much different from the HD Graphics 520 or any other graphics adapter that full-blown six-generation Intel Core i3/i5/i7 chips have. This iGPU is compatible with DX12; it will drive up to 3 monitors simultaneously at up to 2160p60. It will also happily decode VP9 and AVC, the two codecs that YouTube mostly relies on as of 2021.
The UHD Graphics runs at up to 750 MHz. Its actual clock speed will be much lower than that, since the small power budget has to be shared between the iGPU and the CPU cores. Expect most games to run terrible, even ones that were released in 2012 or 2010.
Power consumption
Just like most other N-class Intel processors, the Pentium N4200 has a default TDP of 6 W (also known as the Power Limit 1), making it a great option for passively cooled systems. Increasing the PL1 by just one or two watts, which many systems built around Apollo Lake allow one to do, improves the chip's performance by a huge margin, speaking subjectively.
This Pentium is built with a 14 nm Intel process making for poor energy efficiency (considering 14 nm processes are really old as of mid 2022).
Intel Atom x7-Z8750
► remove from comparison
The Atom x7-Z8750 is a quad-core SoC for entry-level laptops and passive-cooled tablets, which has been presented in early 2016. It is clocked at 1.1 - 2.56 GHz and part of the Cherry Trail platform. Thanks to its new 14 nanometer low-power process (P1273) with tri-gate transistors, energy efficiency has been significantly improved compared to its predecessor Bay Trail. In addition to the CPU cores, the SoC offers a DirectX 11.2-capable GPU as well as a DDR3L Memory Controller (2x 64 bit, 25.6 GB/s).
Compared to the similar Pentium N3710, the Atom x7-Z8750 is tuned for less power consumption and offers less PCI-Express lanes (2 instead of 4) and less USB 3.0 ports (3 instead of 5). Furthermore, the integrated GPU clocks only at 600 (instead of 700) MHz and the memory controller supports LPDDR3-1600.
Architecture
The processor cores are based on the Airmont architecture, which is basically a slightly modified shrink of the previous Silvermont core. While performance per clock has not been improved, the more efficient 14 nm process leads to a better utilization of the CPU Burst (alias Turbo Boost) and a therefore somewhat higher overall performance.
Performance
Due to the passive cooling and lower TDP, the Atom x7-Z8750 is a bit slower than the similar clocked Pentium N3710. The boost frequency of the CPU cores wont be used as long as in an average Pentium based laptop. However, if TDP and cooling are similar, the performance should be comparable. Using Windows, the CPU is adequate for everyday tasks such as Internet browsing or office applications, but may struggle in more demanding software or multitasking.
Graphics
The HD Graphics 405 (Braswell) is based on the Intel Gen8 architecture, which supports DirectX 11.2 and is also found in the Broadwell series (e.g. HD Graphics 5300). With 16 EUs (Execution Units) and a clock speed of up to 600 MHz, the GPU is about twice as fast as the HD Graphics (Bay Trail), but still not powerful enough to handle demanding 3D games of 2015. The GPU also supports 4K/H.265 video acceleration.
Power Consumption
The entire SoC is not rated with a TDP, but only an SDP (Scenario Design Power) of 2 Watt (N3710 SDP 4 Watt, TDP 6 Watt). Thus, the chip can be cooled passively.
| Model | Intel Atom x7-Z8700 | Intel Pentium N4200 | Intel Atom x7-Z8750 | ||||||||||||||||
| Series | Intel Atom x7 | Intel Pentium | Intel Atom x7 | ||||||||||||||||
| Codename | Cherry Trail | Apollo Lake | Cherry Trail | ||||||||||||||||
| Series: Atom x7 Cherry Trail |
|
| |||||||||||||||||
| Clock | 1600 - 2400 MHz | 1100 - 2500 MHz | 1600 - 2560 MHz | ||||||||||||||||
| L2 Cache | 2 MB | 2 MB | 2 MB | ||||||||||||||||
| Cores / Threads | 4 / 4 | 4 / 4 | 4 / 4 | ||||||||||||||||
| Technology | 14 nm | 14 nm | 14 nm | ||||||||||||||||
| max. Temp. | 90 °C | 105 °C | 90 °C | ||||||||||||||||
| Features | Intel HD Graphics (Cherry Trail, 200 - 600 MHz), Wireless Display, AES-NI, max. 8 GB Dual-Channel LPDDR3-1600 (25,6 GB/s), 3x USB 3.0, 2x PCIe 2.0 | DDR3L-1866/LPDDR3-1866/LPDDR4-2400 RAM, PCIe 2, MMX, SSE, SSE2, SSE3, SSSE3, SSE4.1, SSE4.2, AES | Intel HD Graphics 405 (Braswell, 600 MHz), Wireless Display, Quick Sync, AES-NI, max. 8 GB Dual-Channel DDR3L-1600 (25,6 GB/s), 3x USB 3.0, 4x PCIe 2.0, 2x SATA 6.0 Gbit/s | ||||||||||||||||
| iGPU | Intel HD Graphics (Cherry Trail) (200 - 600 MHz) | Intel HD Graphics 505 (200 - 750 MHz) | Intel HD Graphics 405 (Braswell) (400 - 600 MHz) | ||||||||||||||||
| Architecture | x86 | x86 | x86 | ||||||||||||||||
| Announced | |||||||||||||||||||
| Manufacturer | ark.intel.com | ark.intel.com | ark.intel.com | ||||||||||||||||
| TDP | 6 Watt | ||||||||||||||||||
| Socket | BGA1296 | UTFCBGA1380 | |||||||||||||||||
| $161 U.S. | $37 U.S. |

