Notebookcheck Logo

AMD Radeon RX Vega 9 vs AMD Radeon Pro WX Vega M GL

AMD Radeon RX Vega 9

► remove from comparison AMD Vega 9

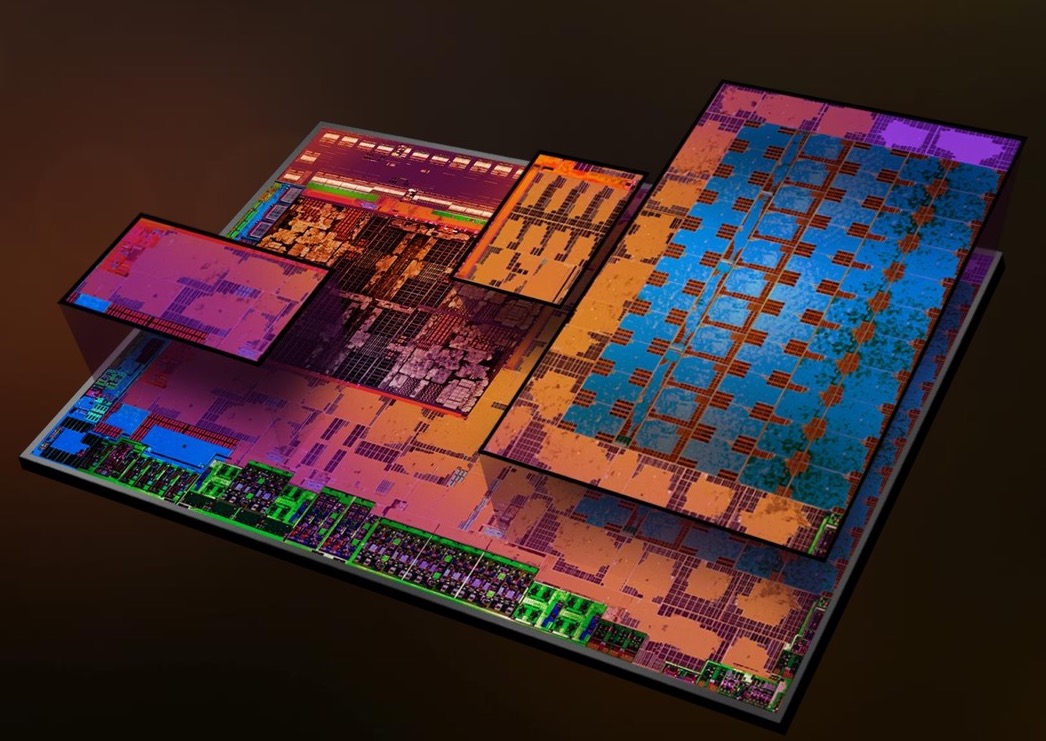
The AMD Radeon RX Vega 9 is an integrated GPU for notebooks. It is used for the Ryzen 5 APUs, which were launched in the end of 2019. The GPU is based on the Vega architecture (5th generation GCN) and has 9 CUs (= 576 of the 704 shaders) clocked at up to 1300 MHz (Ryzen 5 3580U). The performance depends on the configured TDP (12-25 W at launch), the clocks, the cooling, and the memory configuration). The GPU should benefit from fast dual-channel DDR4-2400 RAM (contrary to DDR4-2133 single-channel, which is also possible).

The Vega architecture offers some improvements over the Polaris generation and now supports DirectX 12 Feature Level 12_1. More information is available in our dedicated article about the Raven Ridge architecture.

The performance of the integrated graphics card should be between the Vega 8 and Vega 10. Therefore, demanding games like Control or Borderlands 3 should be playable in lowest settings and 720p. Less demanding games like Fifa 20 or League of Legends can be played fluently in 1080p and highest settings. See e.g. our Vega 8 page for additional benchmarks.

Thanks to the 14nm process and clever power-saving features, the power consumption is comparatively low (according to AMD), so the graphics card can also be used for slim and light notebooks.

AMD Radeon Pro WX Vega M GL

► remove from comparison AMD WX Vega M GL

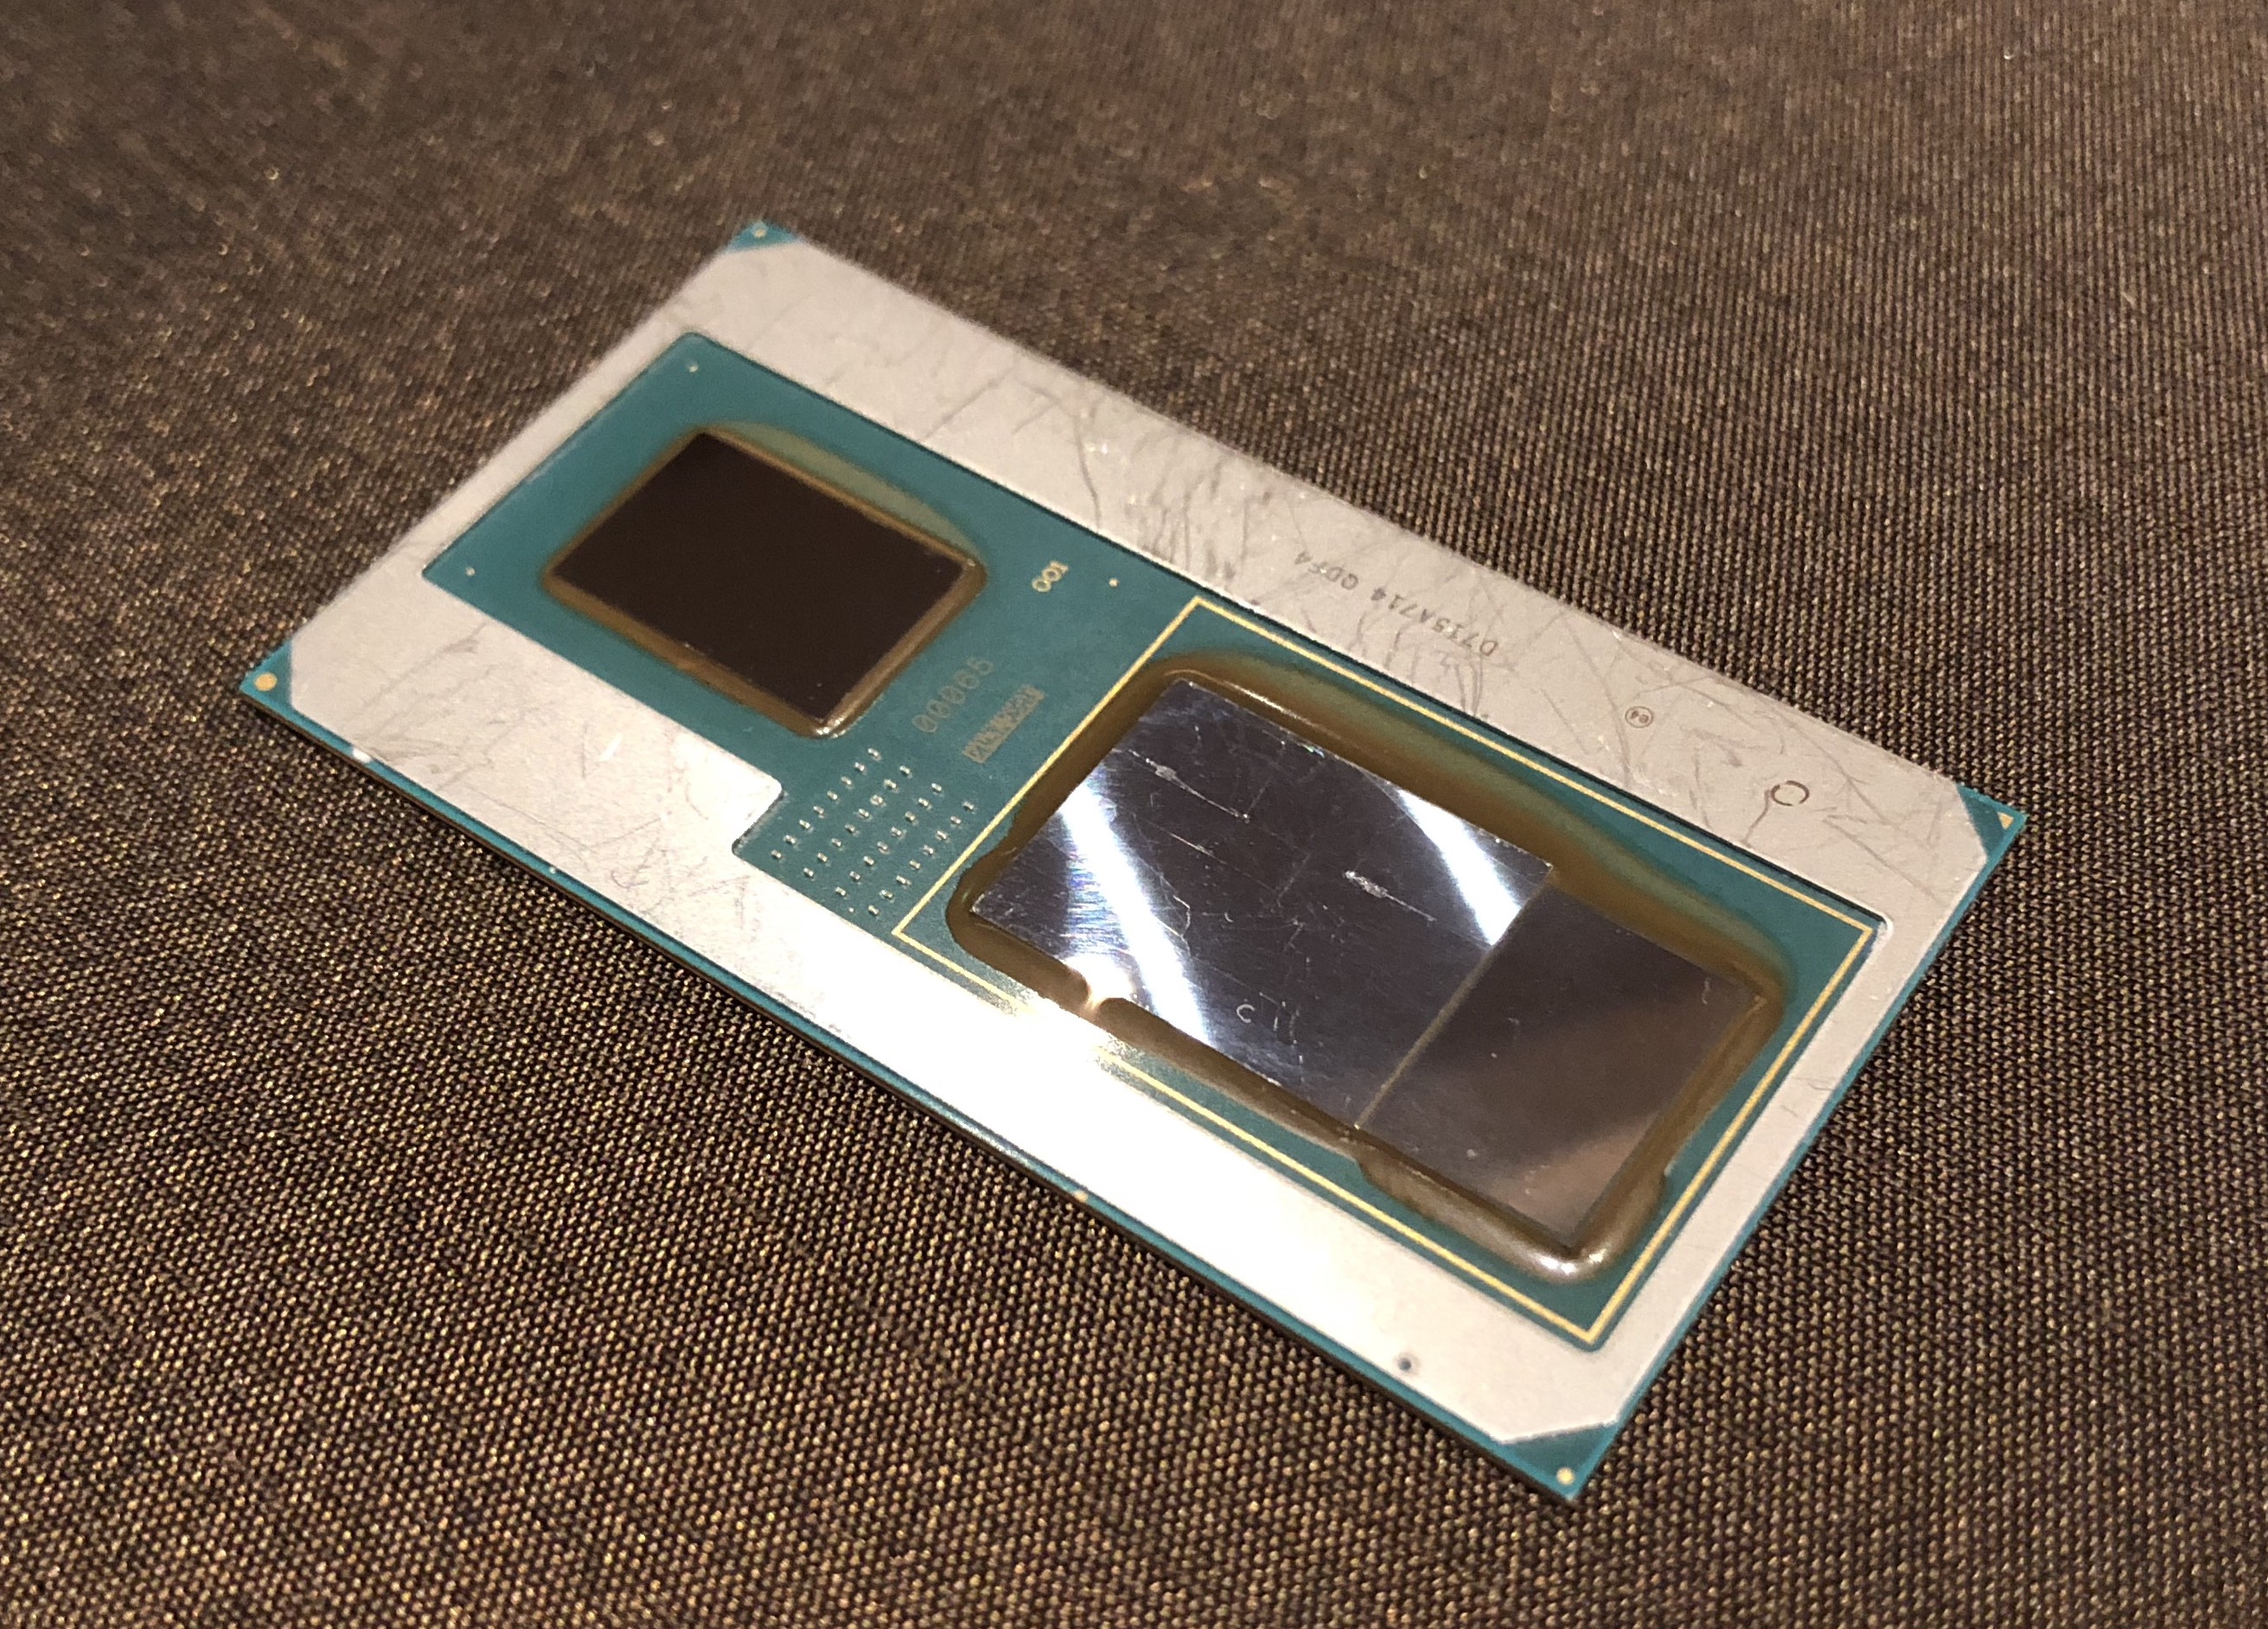
The AMD Radeon WX Vega M GL is an integrated GPU in the slower Intel Kaby-Lake-G SoC. It combines a Kaby-Lake processor, a Vega graphics card and 4 GB HBM2 memory on a single package. The graphics card offers 20 CUs (1280 shaders) and is clocked from 931 - 1011 MHz. It is technically identical to the consumer Radeon RX Vega M GL. The AMD Radeon Pro (formerly known as FirePro) is the counterpart to the Quadro series from Nvidia and offers certified drivers for professional 3D applications (CAD and DCC).

Currently it looks like the GPU is a mixture of Polaris (Shaders?) and Vega (HBM memory controller at least). E.g. the graphics card is called Polaris 22 internally. Detailed information on the Vega architecture can be found in our dedicated article about the Raven Ridge architecture.

The performance of the Vega M GL should be between the Nvidia GeForce GTX 1050 and 1050 Ti.

The power consumption should be quite similar to a dedicated Vega Mobile GPU, but due to the small form factor, smaller laptops can be built with the Kaby-Lake-G SoC. The TDP is specified at 65 Watt for the whole package including GPU, CPU and HBM2 memory.

AMD Radeon RX Vega 9AMD Radeon Pro WX Vega M GL
AMD Radeon RX Vega Series
Vega 10 compare 640 @ 1.3 GHz
Vega 9 576 @ 1.3 GHz
Vega 8 compare 512 @ 1.2 GHz
Vega 6 compare 384 @ 1.1 GHz
Vega 3 compare 192 @ 0.6 - 1.2 GHz
Vega 2 compare 128 @ 1.1 GHz
RX Vega 64 compare 4096 @ 1.63 GHz2048 Bit @ 945 MHz
RX Vega 56 compare 3584 @ 1.14 - 1.47 GHz409.6 Bit @ 800 MHz
Vega Mobile compare 1792 2048 Bit
Vega M GH compare 1536 @ 1.06 - 1.19 GHz
Vega M GL / 870 compare 1280 @ 0.93 - 1.01 GHz
WX Vega M GL 1280 @ 0.93 - 1.01 GHz
Vega 11 compare 704 @ 1.24 GHz
CodenameVega Raven RidgeVega Kaby Lake-G
ArchitectureVegaVega
Pipelines576 - unified1280 - unified
Core Speed1300 (Boost) MHz931 - 1011 (Boost) MHz
Shared Memorynono
APIDirectX 12_1DirectX 12_1
Power Consumption15 Watt65 Watt
Transistors4.5 Billion
technology14 nm14 nm
FeaturesTiled Rasterization, Shared Memory (up to Dual-Channel DDR4-2400)Tiled Rasterization, Shared Memory (up to Dual-Channel DDR4-2400)
Date of Announcement26.10.2017 07.01.2018
Memory TypeHBM2
Max. Amount of Memory4 GB
Notebook Sizemedium sized
CPU in Vega 9GPU Base SpeedGPU Boost / Turbo
AMD Ryzen 5 3580U4 x 2100 MHz, 15 W? MHz1300 MHz

Benchmarks

Performance Rating - 3DMark 11 + Fire Strike + Time Spy - Vega 9
1.3 pt (4%)
Performance Rating - 3DMark 11 + Fire Strike + Time Spy - WX Vega M GL
3.3 pt (10%)
3DMark - 3DMark Time Spy Score
974 Points (3%)
2213 Points (6%)
3DMark - 3DMark Time Spy Graphics
872 Points (2%)
2062 Points (5%)
3DMark - 3DMark Ice Storm Unlimited Graphics
100%
1 Vega 9 +
131922 Points (15%)
3DMark - 3DMark Ice Storm Extreme Graphics
100%
1 Vega 9 +
70492 Points (9%)
3DMark - 3DMark Cloud Gate Score
13582 Points (15%)
19765 Points (21%)
3DMark - 3DMark Cloud Gate Graphics
19255 Points (5%)
38986 Points (10%)
3DMark - 3DMark Fire Strike Standard Score
2524 Points (4%)
6253 Points (11%)
3DMark - 3DMark Fire Strike Standard Graphics
2789 Points (3%)
7333 Points (8%)
3DMark - 3DMark Ice Storm Graphics
94659 Points (11%)
53170 Points (6%)
3DMark 11 - 3DM11 Performance Score
4424 Points (6%)
9731 Points (13%)
3DMark 11 - 3DM11 Performance GPU
4380 Points (4%)
10020 Points (9%)
3DMark Vantage
3DM Vant. Perf. total + AMD Radeon RX Vega 9
3DMark Vantage - 3DM Vant. Perf. total
100%
1 Vega 9 +
12628 Points (4%)
3DM Vant. Perf. GPU no PhysX + AMD Radeon RX Vega 9
3DMark Vantage - 3DM Vant. Perf. GPU no PhysX
100%
1 Vega 9 +
11100 Points (6%)
3DMark 06 3DMark 06 - Standard 1280x1024 + AMD Radeon RX Vega 9
3DMark 06
100%
1 Vega 9 +
13365 Points (18%)
SPECviewperf 12
specvp12 sw-03 + AMD Radeon Pro WX Vega M GL
SPECviewperf 12 - specvp12 sw-03
75.2 fps (19%)
specvp12 snx-02 + AMD Radeon Pro WX Vega M GL
SPECviewperf 12 - specvp12 snx-02
60 fps (9%)
specvp12 showcase-01 + AMD Radeon Pro WX Vega M GL
SPECviewperf 12 - specvp12 showcase-01
38.3 fps (8%)
specvp12 mediacal-01 + AMD Radeon Pro WX Vega M GL
SPECviewperf 12 - specvp12 mediacal-01
19.9 fps (5%)
specvp12 maya-04 + AMD Radeon Pro WX Vega M GL
SPECviewperf 12 - specvp12 maya-04
42.8 fps (12%)
specvp12 energy-01 + AMD Radeon Pro WX Vega M GL
SPECviewperf 12 - specvp12 energy-01
2.9 fps (3%)
specvp12 creo-01 + AMD Radeon Pro WX Vega M GL
SPECviewperf 12 - specvp12 creo-01
57.4 fps (23%)
specvp12 catia-04 + AMD Radeon Pro WX Vega M GL
SPECviewperf 12 - specvp12 catia-04
64.4 fps (11%)
Cinebench R10 Cinebench R10 Shading (32bit) + AMD Radeon RX Vega 9
Cinebench R10 - Cinebench R10 Shading (32bit)
6966 Points (5%)
Cinebench R10 Shading (32bit) + AMD Radeon Pro WX Vega M GL
9667 Points (7%)
Cinebench R11.5 Cinebench R11.5 OpenGL 64 Bit + AMD Radeon RX Vega 9
Cinebench R11.5 - Cinebench R11.5 OpenGL 64 Bit
46.6 fps (16%)
Cinebench R11.5 OpenGL 64 Bit + AMD Radeon Pro WX Vega M GL
108.9 fps (38%)
Cinebench R15
Cinebench R15 OpenGL 64 Bit + AMD Radeon RX Vega 9
Cinebench R15 - Cinebench R15 OpenGL 64 Bit
55 fps (3%)
Cinebench R15 OpenGL 64 Bit + AMD Radeon Pro WX Vega M GL
132.5 fps (8%)
Cinebench R15 OpenGL Ref. Match 64 Bit + AMD Radeon RX Vega 9
Cinebench R15 - Cinebench R15 OpenGL Ref. Match 64 Bit
98 % (98%)
Cinebench R15 OpenGL Ref. Match 64 Bit + AMD Radeon Pro WX Vega M GL
98 % (98%)
GFXBench - GFXBench Car Chase Offscreen
100%
1 Vega 9 +
49 fps (6%)
GFXBench 3.1 - GFXBench Manhattan ES 3.1 Offscreen
100%
1 Vega 9 +
57.4 fps (1%)
GFXBench 3.0 - GFXBench 3.0 Manhattan Offscreen
100%
1 Vega 9 +
73.1 fps (4%)
GFXBench (DX / GLBenchmark) 2.7
GFXBench T-Rex HD Offscreen C24Z16 + AMD Radeon RX Vega 9
GFXBench (DX / GLBenchmark) 2.7 - GFXBench T-Rex HD Offscreen C24Z16
100%
1 Vega 9 +
192 fps (2%)
LuxMark v2.0 64Bit - LuxMark v2.0 Room GPU
239 Samples/s (1%)
845 Samples/s (4%)
LuxMark v2.0 64Bit - LuxMark v2.0 Sala GPU
588 Samples/s (1%)
1567 Samples/s (3%)
ComputeMark v2.1 - ComputeMark v2.1 Result
2806 Points (3%)
967 Points (1%)
Power Consumption - Furmark Stress Test Power Consumption - external Monitor *
100%
1 Vega 9 +
42.2 Watt (6%)
Power Consumption - The Witcher 3 Power Consumption - external Monitor *
100%
1 Vega 9 +
40.3 Watt (6%)
Power Consumption - Witcher 3 Power Consumption *
100%
1 Vega 9 +
45.1 Watt (10%)
82.2 Watt (18%)
Power Consumption - Witcher 3 ultra Power Efficiency
100%
1 Vega 9 +
0.2 fps per Watt (18%)
0.3 fps per Watt (29%)
Power Consumption - Witcher 3 ultra Power Efficiency - external Monitor
100%
1 Vega 9 +
0.2 fps per Watt (17%)
Emissions Witcher 3 Fan Noise + AMD Radeon RX Vega 9
Emissions - Witcher 3 Fan Noise
100%
1 Vega 9 +
39 dB(A) (62%)
Witcher 3 Fan Noise + AMD Radeon Pro WX Vega M GL
47 dB(A) (75%)

Average Benchmarks AMD Radeon RX Vega 9 → 100% n=16

Average Benchmarks AMD Radeon Pro WX Vega M GL → 200% n=16

- Range of benchmark values for this graphics card
- Average benchmark values for this graphics card
* Smaller numbers mean a higher performance
1 This benchmark is not used for the average calculation

Game Benchmarks

The following benchmarks stem from our benchmarks of review laptops. The performance depends on the used graphics memory, clock rate, processor, system settings, drivers, and operating systems. So the results don't have to be representative for all laptops with this GPU. For detailed information on the benchmark results, click on the fps number.

low 1280x720
100%
Vega 9:
28.3  fps
med. 1920x1080
100%
Vega 9:
13.5  fps
high 1920x1080
100%
Vega 9:
7.8  fps
F1 2019

F1 2019

2019
low 1280x720
100%
Vega 9:
51  fps
med. 1920x1080
100%
Vega 9:
21  fps
high 1920x1080
100%
Vega 9:
18  fps
ultra 1920x1080
100%
Vega 9:
12  fps
low 1280x720
100%
Vega 9:
60.7  fps
med. 1920x1080
100%
Vega 9:
20.9  fps
high 1920x1080
100%
Vega 9:
18  fps
ultra 1920x1080
100%
Vega 9:
14.5  fps
low 1280x720
WX Vega M GL:
44  fps
med. 1920x1080
WX Vega M GL:
33  fps
high 1920x1080
WX Vega M GL:
27  fps
ultra 1920x1080
WX Vega M GL:
17  fps
4K 3840x2160
WX Vega M GL:
10  fps
low 1280x720
100%
Vega 9:
29  fps
283%
WX Vega M GL:
82  fps
med. 1920x1080
100%
Vega 9:
8  fps
463%
WX Vega M GL:
37  fps
high 1920x1080
WX Vega M GL:
33  fps
ultra 1920x1080
WX Vega M GL:
28  fps
4K 3840x2160
WX Vega M GL:
8  fps
F1 2018

F1 2018

2018
low 1280x720
WX Vega M GL:
107  fps
med. 1920x1080
WX Vega M GL:
65  fps
high 1920x1080
WX Vega M GL:
54  fps
ultra 1920x1080
WX Vega M GL:
34  fps
4K 3840x2160
WX Vega M GL:
15  fps
low 1280x720
WX Vega M GL:
63  fps
med. 1920x1080
WX Vega M GL:
32.5  fps
high 1920x1080
WX Vega M GL:
21.8  fps
4K 3840x2160
WX Vega M GL:
8.3  fps
Fortnite

Fortnite

2018
low 1280x720
100%
Vega 9:
48  fps
med. 1920x1080
100%
Vega 9:
22.3  fps
high 1920x1080
100%
Vega 9:
15.7  fps
ultra 1920x1080
100%
Vega 9:
9.1  fps
F1 2017

F1 2017

2017
low 1280x720
WX Vega M GL:
122  fps
med. 1920x1080
WX Vega M GL:
78  fps
high 1920x1080
WX Vega M GL:
65  fps
ultra 1920x1080
WX Vega M GL:
40  fps
4K 3840x2160
WX Vega M GL:
17  fps
Dirt 4

Dirt 4

2017
low 1280x720
WX Vega M GL:
194.3  fps
med. 1920x1080
WX Vega M GL:
97.1  fps
high 1920x1080
WX Vega M GL:
54.5  fps
ultra 1920x1080
WX Vega M GL:
31.3  fps
4K 3840x2160
WX Vega M GL:
18.3  fps
low 1280x720
100%
Vega 9:
100.7  fps
184%
WX Vega M GL:
185.6  fps
med. 1920x1080
100%
Vega 9:
46.2  fps
316%
WX Vega M GL:
146.2  fps
high 1920x1080
100%
Vega 9:
30.4  fps
330%
WX Vega M GL:
100.2  fps
4K 3840x2160
WX Vega M GL:
34.3  fps
Prey

Prey

2017
low 1280x720
WX Vega M GL:
116.1  fps
med. 1920x1080
WX Vega M GL:
91.3  fps
high 1920x1080
WX Vega M GL:
74.9  fps
ultra 1920x1080
WX Vega M GL:
65.5  fps
4K 3840x2160
WX Vega M GL:
19.9  fps
Overwatch

Overwatch

2016
low 1280x720
100%
Vega 9:
92.3  fps
210%
WX Vega M GL:
193.7  fps
med. 1366x768
WX Vega M GL:
173.4  fps
high 1920x1080
100%
Vega 9:
36.3  fps
302%
WX Vega M GL:
109.8  fps
ultra 1920x1080
100%
Vega 9:
19.3  fps
271%
WX Vega M GL:
52.3  fps
4K 3840x2160
WX Vega M GL:
32.9  fps
low 1280x768
WX Vega M GL:
50.3  fps
med. 1920x1080
WX Vega M GL:
34.8  fps
high 1920x1080
WX Vega M GL:
16  fps
low 1024x768
WX Vega M GL:
74.4  fps
med. 1366x768
WX Vega M GL:
77.6  fps
high 1920x1080
WX Vega M GL:
40.4  fps
ultra 1920x1080
WX Vega M GL:
31.8  fps
4K 3840x2160
WX Vega M GL:
13.8  fps
Fallout 4

Fallout 4

2015
low 1280x720
WX Vega M GL:
106.9  fps
med. 1366x768
WX Vega M GL:
80.4  fps
high 1920x1080
WX Vega M GL:
49.8  fps
ultra 1920x1080
WX Vega M GL:
35.5  fps
4K 3840x2160
WX Vega M GL:
14.7  fps
low 1024x768
WX Vega M GL:
60  fps
med. 1366x768
WX Vega M GL:
60  fps
high 1920x1080
WX Vega M GL:
60  fps
ultra 1920x1080
WX Vega M GL:
50  fps
4K 3840x2160
WX Vega M GL:
25.1  fps
low 1280x720
WX Vega M GL:
73  fps
med. 1366x768
WX Vega M GL:
73  fps
high 1920x1080
WX Vega M GL:
50  fps
4K 3840x2160
WX Vega M GL:
16  fps
low 1024x768
100%
Vega 9:
41.9  fps
226%
WX Vega M GL:
94.7  fps
med. 1366x768
WX Vega M GL:
79  fps
high 1920x1080
100%
Vega 9:
13.3  fps
332%
WX Vega M GL:
44.2  fps
ultra 1920x1080
100%
Vega 9:
8.1  fps
295%
WX Vega M GL:
23.9  fps
4K 3840x2160
WX Vega M GL:
15.1  fps
Thief

Thief

2014
low 1024x768
WX Vega M GL:
68.6  fps
med. 1366x768
WX Vega M GL:
67.1  fps
high 1366x768
WX Vega M GL:
64.3  fps
ultra 1920x1080
WX Vega M GL:
42.7  fps
low 1024x768
WX Vega M GL:
98.2  fps
med. 1366x768
WX Vega M GL:
94.8  fps
high 1366x768
WX Vega M GL:
77.5  fps
ultra 1920x1080
WX Vega M GL:
41  fps
low 1280x720
100%
Vega 9:
117.9  fps
90%
WX Vega M GL:
106.5  fps
med. 1366x768
WX Vega M GL:
101.2  fps
high 1366x768
WX Vega M GL:
102.9  fps
ultra 1920x1080
100%
Vega 9:
20.5  fps
291%
WX Vega M GL:
59.6  fps
low 1024x768
WX Vega M GL:
254  fps
med. 1366x768
WX Vega M GL:
146  fps
high 1366x768
WX Vega M GL:
134.1  fps
ultra 1920x1080
WX Vega M GL:
71.4  fps
low 1024x768
WX Vega M GL:
113.1  fps
med. 1366x768
WX Vega M GL:
95.9  fps
high 1366x768
WX Vega M GL:
84.6  fps
ultra 1920x1080
WX Vega M GL:
36  fps

Average Gaming AMD Radeon RX Vega 9 → 100%

Average Gaming 30-70 fps → 100%

Average Gaming AMD Radeon Pro WX Vega M GL → 276%

Average Gaming 30-70 fps → 339%

AMD Radeon RX Vega 9lowmed.highultraQHD4K
Borderlands 328.313.57.8
F1 201951211812
Apex Legends60.720.91814.5
Shadow of the Tomb Raider298
Fortnite4822.315.79.1
Rocket League100.746.230.4
Overwatch92.336.319.3
The Witcher 341.913.38.1
BioShock Infinite117.920.5
< 30 fps
< 60 fps
< 120 fps
≥ 120 fps
2
3
4
5
1

5
2

6


AMD Radeon Pro WX Vega M GLlowmed.highultraQHD4K
Assassin´s Creed Odyssey4433271710
Shadow of the Tomb Raider823733288
F1 201810765543415
Final Fantasy XV Benchmark6332.521.88.3
F1 201712278654017
Dirt 4194.397.154.531.318.3
Rocket League185.6146.2100.234.3
Prey116.191.374.965.519.9
Overwatch193.7173.4109.852.332.9
Ashes of the Singularity50.334.816
Rise of the Tomb Raider74.477.640.431.813.8
Fallout 4106.980.449.835.514.7
Metal Gear Solid V6060605025.1
Batman: Arkham Knight73735016
The Witcher 394.77944.223.915.1
Thief68.667.164.342.7
Metro: Last Light98.294.877.541
BioShock Infinite106.5101.2102.959.6
StarCraft II: Heart of the Swarm254146134.171.4
Sleeping Dogs113.195.984.636
< 30 fps
< 60 fps
< 120 fps
≥ 120 fps

2
13
5

4
13
3
3
7
9
1
3
11
2


12
2

For more games that might be playable and a list of all games and graphics cards visit our Gaming List

Add one or more devices and compare

In the following list you can select (and also search for) devices that should be added to the comparison. You can select more than one device.

restrict list:

show all (including archived), 2024, 2023
v1.26
log 16. 08:55:24

#0 checking url part for id 9952 +0s ... 0s

#1 checking url part for id 9018 +0s ... 0s

#2 not redirecting to Ajax server +0s ... 0s

#3 did not recreate cache, as it is less than 5 days old! Created at Tue, 16 Apr 2024 05:39:00 +0200 +0.001s ... 0.001s

#4 composed specs +0.156s ... 0.157s

#5 did output specs +0s ... 0.157s

#6 start showIntegratedCPUs +0s ... 0.157s

#7 getting avg benchmarks for device 9952 +0.045s ... 0.202s

#8 got single benchmarks 9952 +0.008s ... 0.209s

#9 getting avg benchmarks for device 9018 +0.022s ... 0.232s

#10 got single benchmarks 9018 +0.01s ... 0.242s

#11 got avg benchmarks for devices +0s ... 0.242s

#12 min, max, avg, median took s +0.293s ... 0.535s

#13 before gaming benchmark output +0s ... 0.535s

#14 Got 118 rows for game benchmarks. +0.024s ... 0.559s

#15 composed SQL query for gamebenchmarks +0s ... 0.559s

#16 got data and put it in $dataArray +0.021s ... 0.58s

#17 benchmarks composed for output. +0.061s ... 0.642s

#18 calculated avg scores. +0s ... 0.642s

#19 return log +0.049s ... 0.691s

Please share our article, every link counts!
> Expert Reviews and News on Laptops, Smartphones and Tech Innovations > Benchmarks / Tech > Graphics Card Comparison - Head 2 Head
Redaktion, 2017-09- 8 (Update: 2023-07- 1)