Intel UHD Graphics G4 (Lakefield GT1 48 EU) vs Intel UHD Graphics (Jasper Lake 16 EU)
Intel UHD Graphics G4 (Lakefield GT1 48 EU) ► remove from comparison
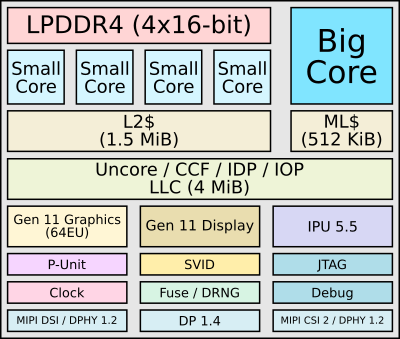
The Intel UHD Graphics G4 (Lakefield GT1 with 48 EUs) is an integrated graphics card in the Lakefield SoCs (e.g. Core i3-L13G4 ) for laptops. It offers no dedicated graphics memory (no eDRAM cache like the Intel Iris Graphics 655 predecessor of the Coffee Lake SoCs). The clock rate ranges between 200 MHz (guaranteed base clock) up to 500 MHz (boost). The TDP of the whole SoC is specified at 7 Watt.
The GPU performance should be a bit slower than the old Intel HD Graphics 620 and therefore only some low demanding games like League of Legends should run with the UHD Graphics.
A special new feature of the Gen11 graphics card is the new Variable Rate Shading (VRS) support. With it game designers can decide where to spend shading time and e.g. shade object in the background or behind fog with less resolution (up to using only one source for a 4x4 block). With this technique early results show up to 1.3x performance in Unreal Engine POC and 1.2x speedup in Civ 6. Up to now VRS is only supported by the new Nvidia Turing architecture (GTX 1650 and up).
The Lakefield SoCs and therefore the integrated GPU are manufactured in the modern 10nm process at Intel that should be comparable to the 7nm process of TSMC.
Intel UHD Graphics (Jasper Lake 16 EU) ► remove from comparison
The Intel UHD Graphics 16 EUs (Jasper Lake, Gen. 11) is an integrated graphics card in the Jasper Lake Celeron SoCs for laptops and small desktops. It is the low end GPU version in the Jasper Lake series (Celeron Dual-Cores) and offers only 16 of the 32 EUs (Execution Units / Shader Blocks). It offers no dedicated graphics memory and the clock rate depends on the processor model. At launch there are two Celeron models (N4500 with 6W and N4505 with 10W) clocked at 350 - 750 MHz.
Thanks to the improved architecture and more EUs, the UHD Graphics is clearly faster than the old Gemini Lake SoCs (e.g. UHD Graphics 600 ).
A special new feature of the Gen11 graphics card is the new Variable Rate Shading (VRS) support. With it game designers can decide where to spend shading time and e.g. shade object in the background or behind fog with less resolution (up to using only one source for a 4x4 block). With this technique early results show up to 1.3x performance in Unreal Engine POC and 1.2x speedup in Civ 6. Up to now VRS is only supported by the new Nvidia Turing architecture (GTX 1650 and up).
Another improved hardware piece is the integrated video de- and encoder that was improved significantly according to Intel. They did not specify any more details, but the previous generation was able to decode VP9 and H.265/HEVC in Main10 profile with 10 bit color depth using the dedicated hardware.
The Jasper Lake SoCs and therefore the integrated GPU are manufactured in the 10nm process (like Ice Lake probably) at Intel that should be comparable to the 7nm process of TSMC.
Intel UHD Graphics G4 (Lakefield GT1 48 EU) Intel UHD Graphics (Jasper Lake 16 EU) Gen. 11 Series Codename Lakefield GT1 Gen. 11 Architecture Gen. 11 Ice Lake Gen. 11 Pipelines 48 - unified 24 - unified Core Speed 200 - 500 (Boost) MHz 350 - 800 (Boost) MHz Memory Type DDR4 Shared Memory yes yes API DirectX 12_1, OpenGL 4.5 DirectX 12_1, OpenGL 4.5, OpenCL 1.2 Power Consumption 7 Watt 4.8 - 10 Watt technology 10 nm 10 nm Features QuickSync QuickSync Date of Announcement 28.05.2020 11.01.2021 Displays 3 Displays (max.) Predecessor UHD Graphics 600
Benchmarks Performance Rating - 3DMark 11 + Fire Strike + Time Spy - UHD Graphics (Jasper Lake 16 EU)
0.3 pt (1%)
...
Intel UHD Graphics (Jasper Lake 16 EU)
...
max:
3DMark - 3DMark Time Spy Score
min: 145 avg: 192.4 median: 203 (1%) max: 210 Points
3DMark - 3DMark Time Spy Graphics
min: 129 avg: 168.2 median: 178 (0%) max: 182 Points
3DMark - 3DMark Ice Storm Unlimited Graphics
min: 43067 avg: 44131 median: 43609.5 (5%) max: 46236 Points
3DMark - 3DMark Ice Storm Extreme Graphics
min: 15477 avg: 18377 median: 17921 (2%) max: 22189 Points
3DMark - 3DMark Cloud Gate Score
min: 3022 avg: 4251 median: 4596.5 (5%) max: 4845 Points
3DMark - 3DMark Cloud Gate Graphics
min: 4210 avg: 4863 median: 4910.5 (1%) max: 5217 Points
3DMark - 3DMark Fire Strike Standard Score
min: 378 avg: 595 median: 626 (1%) max: 658 Points
3DMark - 3DMark Fire Strike Standard Graphics
min: 392 avg: 613 median: 645 (1%) max: 679 Points
3DMark - 3DMark Ice Storm Graphics
min: 23782 avg: 32522 median: 35101 (4%) max: 38682 Points
3DMark 11 - 3DM11 Performance Score
min: 591 avg: 935 median: 975.5 (1%) max: 1028 Points
3DMark 11 - 3DM11 Performance GPU
min: 554 avg: 819 median: 854 (1%) max: 894 Points
3DMark Vantage + Intel UHD Graphics (Jasper Lake 16 EU) 3DMark Vantage - 3DM Vant. Perf. total
3411 Points (1%)
3DM Vant. Perf. GPU no PhysX + Intel UHD Graphics (Jasper Lake 16 EU) 3DMark Vantage - 3DM Vant. Perf. GPU no PhysX
2969 Points (2%)
3DMark 05 - 3DMark 05 - Standard
12573 Points (14%)
3DMark 06 3DMark 06 - Standard 1280x1024 + Intel UHD Graphics (Jasper Lake 16 EU)
min: 5796 avg: 6344 median: 6438 (8%) max: 6704 Points
Unigine Valley 1.0 - Unigine Valley 1.0 DX
3.5 fps (1%)
Cinebench R10 Cinebench R10 Shading (32bit) + Intel UHD Graphics (Jasper Lake 16 EU) Cinebench R10 - Cinebench R10 Shading (32bit)
min: 4674 avg: 5514 median: 5649.5 (4%) max: 6082 Points
Cinebench R11.5 Cinebench R11.5 OpenGL 64 Bit + Intel UHD Graphics (Jasper Lake 16 EU) Cinebench R11.5 - Cinebench R11.5 OpenGL 64 Bit
min: 19.02 avg: 19.5 median: 19.3 (7%) max: 20.53 fps
Cinebench R15 + Intel UHD Graphics (Jasper Lake 16 EU) Cinebench R15 - Cinebench R15 OpenGL 64 Bit
min: 11.8 avg: 24.5 median: 26.2 (2%) max: 28.9 fps
Cinebench R15 OpenGL Ref. Match 64 Bit + Intel UHD Graphics (Jasper Lake 16 EU) Cinebench R15 - Cinebench R15 OpenGL Ref. Match 64 Bit
97.8 % (98%)
GFXBench - GFXBench 5.0 4K Aztec Ruins High Tier Offscreen
1.4 fps (1%)
GFXBench - GFXBench 5.0 Aztec Ruins High Tier Offscreen
min: 3.2 avg: 4.9 median: 4.9 (1%) max: 6.5 fps
GFXBench - GFXBench 5.0 Aztec Ruins Normal Tier Offscreen
min: 7.8 avg: 12.7 median: 12.7 (1%) max: 17.5 fps
GFXBench - GFXBench Car Chase Offscreen
min: 10 avg: 14.2 median: 14.2 (2%) max: 18.3 fps
GFXBench 3.1 - GFXBench Manhattan ES 3.1 Offscreen
min: 8.2 avg: 16.5 median: 16.5 (0%) max: 24.7 fps
GFXBench 3.0 - GFXBench 3.0 Manhattan Offscreen
min: 18 avg: 30.7 median: 30.7 (2%) max: 43.4 fps
GFXBench (DX / GLBenchmark) 2.7 + Intel UHD Graphics (Jasper Lake 16 EU) GFXBench (DX / GLBenchmark) 2.7 - GFXBench T-Rex HD Offscreen C24Z16
min: 38 avg: 56.3 median: 56.3 (0%) max: 74.5 fps
Geekbench 6.2 - Geekbench 6.2 GPU Vulkan
1452 Points (0%)
LuxMark v2.0 64Bit - LuxMark v2.0 Room GPU
min: 96 avg: 106.3 median: 111 (1%) max: 112 Samples/s
LuxMark v2.0 64Bit - LuxMark v2.0 Sala GPU
min: 206 avg: 220 median: 226 (0%) max: 228 Samples/s
ComputeMark v2.1 - ComputeMark v2.1 Result
min: 536 avg: 549 median: 548 (1%) max: 564 Points
Power Consumption - Furmark Stress Test Power Consumption - external Monitor *
min: 11.1 avg: 14.4 median: 15.2 (2%) max: 16 Watt
Power Consumption - The Witcher 3 Power Consumption - external Monitor *
0 Watt (0%)
Power Consumption - Witcher 3 Power Consumption *
13.1 Watt (3%)
Power Consumption - GFXBench Aztec Ruins Normal Tier Offscreen Power Consumption 150cd *
12.7 Watt (5%)
Emissions Witcher 3 Fan Noise + Intel UHD Graphics (Jasper Lake 16 EU) Emissions - Witcher 3 Fan Noise
30.4 dB(A) (49%)
Average Benchmarks Intel UHD Graphics (Jasper Lake 16 EU) → 0% n=
- Range of benchmark values for this graphics card
- Average benchmark values for this graphics card
* Smaller numbers mean a higher performance
1 This benchmark is not used for the average calculation
Game Benchmarks The following benchmarks stem from our benchmarks of review laptops. The performance depends on the used graphics memory, clock rate, processor, system settings, drivers, and operating systems. So the results don't have to be representative for all laptops with this GPU. For detailed information on the benchmark results, click on the fps number.
UHD Graphics (Jasper Lake 16 EU):
0 (!) [X] Asus VIVO Mini PN41-BBC055MVN Intel Celeron N4505 2GHz
UHD Graphics (Jasper Lake 16 EU)
fps
UHD Graphics (Jasper Lake 16 EU):
5.2 [X] Asus VIVO Mini PN41-BBC055MVN Intel Celeron N4505 2GHz
UHD Graphics (Jasper Lake 16 EU)
min:
1.68 fps, P0.1:
1.865 fps, P1:
3.62 fps, max:
22 fps
fps
UHD Graphics (Jasper Lake 16 EU):
19 [X] Asus VIVO Mini PN41-BBC055MVN 803111
Intel Celeron N4505 2GHz
UHD Graphics (Jasper Lake 16 EU)
min:
5 fps, P1:
12 fps, max:
23 fps
fps
UHD Graphics (Jasper Lake 16 EU):
15.2 [X] Asus VIVO Mini PN41-BBC055MVN Intel Celeron N4505 2GHz
UHD Graphics (Jasper Lake 16 EU)
min:
12 fps, max:
16 fps
fps
UHD Graphics (Jasper Lake 16 EU):
7 [X] Asus VIVO Mini PN41-BBC055MVN Intel Celeron N4505 2GHz
UHD Graphics (Jasper Lake 16 EU)
min:
6 fps, max:
15 fps
fps
UHD Graphics (Jasper Lake 16 EU):
16.2 [X] Asus VIVO Mini PN41-BBC055MVN 1.47.22.14 D3D12
Intel Celeron N4505 2GHz
UHD Graphics (Jasper Lake 16 EU)
min:
5 fps, P1:
7.29 fps, max:
116 fps
16.2 [X] Intel NUC11ATKC2, N4505 1.47.22.14 D3D12
Intel Celeron N4505 2GHz
UHD Graphics (Jasper Lake 16 EU)
min:
5 fps, P1:
7.31 fps, max:
115.7 fps
~ 16 fps
UHD Graphics (Jasper Lake 16 EU):
6.5 [X] Intel NUC11ATKC2, N4505 1.47.22.14 D3D12
Intel Celeron N4505 2GHz
UHD Graphics (Jasper Lake 16 EU)
min:
5 fps, P1:
5 fps, max:
89.2 fps
6.6 [X] Asus VIVO Mini PN41-BBC055MVN 1.47.22.14 D3D12
Intel Celeron N4505 2GHz
UHD Graphics (Jasper Lake 16 EU)
min:
5 fps, P1:
5 fps, max:
87.4 fps
~ 7 fps
UHD Graphics (Jasper Lake 16 EU):
6 [X] Asus VIVO Mini PN41-BBC055MVN 1.47.22.14 D3D12
Intel Celeron N4505 2GHz
UHD Graphics (Jasper Lake 16 EU)
min:
5 fps, P1:
5 fps, max:
78.1 fps
6.5 [X] Intel NUC11ATKC2, N4505 1.47.22.14 D3D12
Intel Celeron N4505 2GHz
UHD Graphics (Jasper Lake 16 EU)
min:
5 fps, P1:
5 fps, max:
82.6 fps
~ 6 fps
UHD Graphics (Jasper Lake 16 EU):
7 [X] Asus VIVO Mini PN41-BBC055MVN Intel Celeron N4505 2GHz
UHD Graphics (Jasper Lake 16 EU)
min:
3 fps, max:
9 fps
fps
UHD Graphics (Jasper Lake 16 EU):
10.1 [X] Geekom MiniAir 11 Special Edition Intel Celeron N5095 2GHz
UHD Graphics (Jasper Lake 16 EU)
10.8 [X] Beelink U59 Intel Celeron N5095 2GHz
UHD Graphics (Jasper Lake 16 EU)
11 [X] Asus VIVO Mini PN41-BBC055MVN Intel Celeron N4505 2GHz
UHD Graphics (Jasper Lake 16 EU)
13.2 13.3 15.1 ~ 12 fps
UHD Graphics (Jasper Lake 16 EU):
7.5 8.4 [X] Geekom MiniAir 11 Special Edition Intel Celeron N5095 2GHz
UHD Graphics (Jasper Lake 16 EU)
9 [X] Asus VIVO Mini PN41-BBC055MVN Intel Celeron N4505 2GHz
UHD Graphics (Jasper Lake 16 EU)
9.2 [X] Beelink U59 Intel Celeron N5095 2GHz
UHD Graphics (Jasper Lake 16 EU)
9.2 ~ 9 fps
UHD Graphics (Jasper Lake 16 EU):
7.1 7.9 [X] Geekom MiniAir 11 Special Edition Intel Celeron N5095 2GHz
UHD Graphics (Jasper Lake 16 EU)
8.3 [X] Asus VIVO Mini PN41-BBC055MVN Intel Celeron N4505 2GHz
UHD Graphics (Jasper Lake 16 EU)
8.6 8.6 [X] Beelink U59 Intel Celeron N5095 2GHz
UHD Graphics (Jasper Lake 16 EU)
~ 8 fps
UHD Graphics (Jasper Lake 16 EU):
2.2 6.9 6.9 [X] Geekom MiniAir 11 Special Edition 1.3
Intel Celeron N5095 2GHz
UHD Graphics (Jasper Lake 16 EU)
6.9 7.1 7.2 [X] Beelink U59 1.3
Intel Celeron N5095 2GHz
UHD Graphics (Jasper Lake 16 EU)
~ 6 fps
UHD Graphics (Jasper Lake 16 EU):
3.2 3.3 3.3 [X] Geekom MiniAir 11 Special Edition 1.3
Intel Celeron N5095 2GHz
UHD Graphics (Jasper Lake 16 EU)
~ 3 fps
UHD Graphics (Jasper Lake 16 EU):
2.3 2.3 [X] Geekom MiniAir 11 Special Edition 1.3
Intel Celeron N5095 2GHz
UHD Graphics (Jasper Lake 16 EU)
~ 2 fps
UHD Graphics (Jasper Lake 16 EU):
18.9 36.2 47.7 [X] Asus VIVO Mini PN41-BBC055MVN Intel Celeron N4505 2GHz
UHD Graphics (Jasper Lake 16 EU)
min:
34.8 fps, max:
-1 fps
57.3 [X] Beelink U59 Intel Celeron N5095 2GHz
UHD Graphics (Jasper Lake 16 EU)
min:
47 fps, max:
-1 fps
58.3 [X] Beelink U59 Mini-S Intel Celeron N5095 2GHz
UHD Graphics (Jasper Lake 16 EU)
min:
51.4 fps, max:
-1 fps
58.6 [X] Geekom MiniAir 11 Special Edition Intel Celeron N5095 2GHz
UHD Graphics (Jasper Lake 16 EU)
min:
47.7 fps, max:
-1 fps
61.2 ~ 48 fps
UHD Graphics (Jasper Lake 16 EU):
20.7 [X] Beelink U59 Mini-S Intel Celeron N5095 2GHz
UHD Graphics (Jasper Lake 16 EU)
min:
13.8 fps, max:
-1 fps
22 [X] Geekom MiniAir 11 Special Edition Intel Celeron N5095 2GHz
UHD Graphics (Jasper Lake 16 EU)
min:
11.8 fps, max:
-1 fps
22.8 26.6 [X] Beelink U59 Intel Celeron N5095 2GHz
UHD Graphics (Jasper Lake 16 EU)
min:
20.6 fps, max:
-1 fps
26.9 [X] Asus VIVO Mini PN41-BBC055MVN Intel Celeron N4505 2GHz
UHD Graphics (Jasper Lake 16 EU)
min:
19.7 fps, max:
-1 fps
26.9 ~ 24 fps
UHD Graphics (Jasper Lake 16 EU):
11.6 11.8 [X] Asus VIVO Mini PN41-BBC055MVN Intel Celeron N4505 2GHz
UHD Graphics (Jasper Lake 16 EU)
min:
5.8 fps, max:
-1 fps
11.8 [X] Geekom MiniAir 11 Special Edition Intel Celeron N5095 2GHz
UHD Graphics (Jasper Lake 16 EU)
min:
9.5 fps, max:
-1 fps
11.8 12 [X] Beelink U59 Intel Celeron N5095 2GHz
UHD Graphics (Jasper Lake 16 EU)
min:
9.3 fps, max:
-1 fps
12 ~ 12 fps
UHD Graphics (Jasper Lake 16 EU):
10.8 [X] Asus VIVO Mini PN41-BBC055MVN Intel Celeron N4505 2GHz
UHD Graphics (Jasper Lake 16 EU)
min:
6.2 fps, max:
-1 fps
10.8 10.9 [X] Geekom MiniAir 11 Special Edition Intel Celeron N5095 2GHz
UHD Graphics (Jasper Lake 16 EU)
min:
8.6 fps, max:
-1 fps
10.9 11.2 [X] Beelink U59 Intel Celeron N5095 2GHz
UHD Graphics (Jasper Lake 16 EU)
min:
8.6 fps, max:
-1 fps
11.2 ~ 11 fps
UHD Graphics (Jasper Lake 16 EU):
4 13.5 [X] Asus VIVO Mini PN41-BBC055MVN Intel Celeron N4505 2GHz
UHD Graphics (Jasper Lake 16 EU)
min:
4.28 fps, P0.1:
4.38 fps, P1:
5.85 fps, max:
73 fps
14 [X] Beelink U59 Intel Celeron N5095 2GHz
UHD Graphics (Jasper Lake 16 EU)
min:
13 fps, max:
15 fps
~ 11 fps
UHD Graphics (Jasper Lake 16 EU):
0 (!) [X] Asus VIVO Mini PN41-BBC055MVN Intel Celeron N4505 2GHz
UHD Graphics (Jasper Lake 16 EU)
25.1 ~ 13 fps
UHD Graphics (Jasper Lake 16 EU):
25 fps
UHD Graphics (Jasper Lake 16 EU):
5.6 fps
UHD Graphics (Jasper Lake 16 EU):
57.6 [X] Asus VIVO Mini PN41-BBC055MVN Intel Celeron N4505 2GHz
UHD Graphics (Jasper Lake 16 EU)
fps
UHD Graphics (Jasper Lake 16 EU):
48.1 [X] Asus VIVO Mini PN41-BBC055MVN Intel Celeron N4505 2GHz
UHD Graphics (Jasper Lake 16 EU)
fps
UHD Graphics (Jasper Lake 16 EU):
17.8 [X] Asus VIVO Mini PN41-BBC055MVN Intel Celeron N4505 2GHz
UHD Graphics (Jasper Lake 16 EU)
fps
For more games that might be playable and a list of all games and graphics cards visit our Gaming List
v1.26
log 18. 04:10:42
#0 checking url part for id 10408 +0s ... 0s
#1 checking url part for id 10644 +0s ... 0s
#2 not redirecting to Ajax server +0s ... 0s
#3 did not recreate cache, as it is less than 5 days old! Created at Tue, 16 Apr 2024 05:39:00 +0200 +0.001s ... 0.001s
#4 composed specs +0.104s ... 0.105s
#5 did output specs +0s ... 0.105s
#6 start showIntegratedCPUs +0s ... 0.105s
#7 getting avg benchmarks for device 10408 +0.027s ... 0.132s
#8 got single benchmarks 10408 +0.006s ... 0.138s
#9 getting avg benchmarks for device 10644 +0.02s ... 0.158s
#10 got single benchmarks 10644 +0.034s ... 0.192s
#11 got avg benchmarks for devices +0s ... 0.192s
#12 No cached benchmark found, getting uncached values +0.136s ... 0.328s
#13 min, max, avg, median took s +0.005s ... 0.334s
#14 before gaming benchmark output +0s ... 0.334s
#15 Got 74 rows for game benchmarks. +0.018s ... 0.351s
#16 composed SQL query for gamebenchmarks +0s ... 0.351s
#17 got data and put it in $dataArray +0.01s ... 0.361s
#18 benchmarks composed for output. +0.03s ... 0.391s
#19 calculated avg scores. +0s ... 0.391s
#20 return log +0.037s ... 0.428s
Please share our article, every link counts!
Redaktion, 2017-09- 8 (Update: 2023-07- 1)
 Deutsch
 English
 Español
 Français
 Italiano
 Nederlands
 Polski
 Português
 Русский
 Türkçe
 Svenska
 Chinese
 Magyar