Notebookcheck Logo

AMD Ryzen Threadripper PRO 3975WX vs AMD Ryzen Threadripper PRO 3995WX

AMD Ryzen Threadripper PRO 3975WX

► remove from comparison AMD TR Pro 3975WX

The AMD Ryzen Threadripper Pro 3975WX is a high-end workstation processor with 32 cores (8 per chiplet) based on the Zen 2 architecture. The CPU offers a base clock speed of 2.5 GHz and can boost up to 4.2 GHz. It uses the new sWRX8 socket and therefore can't be used to upgrade older Threadripper systems. The integrated memory controller uses 8 channels and supports DDR4-3200.

AMD Ryzen Threadripper PRO 3995WX

► remove from comparison AMD TR Pro 3995WX

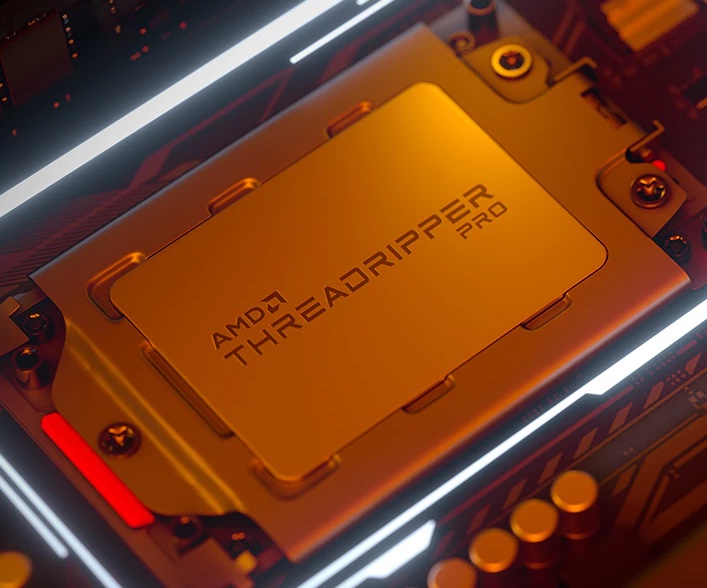
The AMD Ryzen Threadripper Pro 3995WX is a high-end workstation processor with 64 cores (8 per chiplet) based on the Zen 2 architecture. The CPU offers a base clock speed of 2.7 GHz and can boost up to 4.2 GHz. It uses the new sWRX8 socket and therefore can't be used to upgrade older Threadripper systems. The integrated memory controller uses 8 channels and supports DDR4-3200.

Thanks to the 64 cores and good a single-core performance of the Zen 2 architecture, the 3995WX offers a very good performance. However, if the application can not make use of the 128 threads, cheaper processors offer a better price/performance ratio.

The Threadripper Pro 3995WX is rated at 280 Watt and therefore 70 Watt more than the 2990WX. The CPU is With a release price of $5000 (for OEMs), the CPU is very expensive and targeted at high-end workstation desktop PCs.

ModelAMD Ryzen Threadripper PRO 3975WXAMD Ryzen Threadripper PRO 3995WX
SeriesAMD ThreadripperAMD Threadripper
CodenameMatisseMatisse
Series: Threadripper Matisse
AMD Ryzen Threadripper PRO 3995WX2.7 - 4.2 GHz64 / 128 cores256 MB L3
AMD Ryzen Threadripper PRO 3975WX « 3.5 - 4.2 GHz32 / 64 cores128 MB L3
AMD Ryzen Threadripper PRO 3995WX « 2.7 - 4.2 GHz64 / 128 cores256 MB L3
AMD Ryzen Threadripper PRO 3975WX3.5 - 4.2 GHz32 / 64 cores128 MB L3
Clock3500 - 4200 MHz2700 - 4200 MHz
L1 Cache2 MB4 MB
L2 Cache16 MB32 MB
L3 Cache128 MB256 MB
Cores / Threads32 / 6464 / 128
TDP280 Watt280 Watt
Transistors3800 Million3800 Million
Technology7 nm7 nm
Die Size74 mm274 mm2
max. Temp.95 °C95 °C
SocketsWRX8 / sTRX4sWRX8 / sTRX4
FeaturesMMX, SSE, SSE2, SSE3, SSSE3, SSE4A, SSE4.1, SSE4.2, AES, AVX, AVX2, BMI1, BMI2, SHA, F16C, FMA3, AMD64, EVP, AMD-V, SMAP, SMEP, SMT, Precision Boost 2, XFR 2MMX, SSE, SSE2, SSE3, SSSE3, SSE4A, SSE4.1, SSE4.2, AES, AVX, AVX2, BMI1, BMI2, SHA, F16C, FMA3, AMD64, EVP, AMD-V, SMAP, SMEP, SMT, Precision Boost 2, XFR 2
Architecturex86x86
Announced
$5500 U.S.

Benchmarks

Performance Rating - CB R15 + R20 + 7-Zip + X265 + Blender + 3DM11 CPU - TR Pro 3975WX
49.2 pt (68%)
Performance Rating - CB R15 + R20 + 7-Zip + X265 + Blender + 3DM11 CPU - TR Pro 3995WX
52.5 pt (73%)
Cinebench R23 - Cinebench R23 Multi Core
42744 Points (40%)
61102 Points (57%)
Cinebench R23 - Cinebench R23 Single Core
1286 Points (55%)
1249 Points (53%)
Cinebench R20 - Cinebench R20 CPU (Single Core)
500 Points (56%)
488 Points (54%)
Cinebench R20 - Cinebench R20 CPU (Multi Core)
16464 Points (40%)
23571 Points (57%)
Cinebench R15 - Cinebench R15 CPU Multi 64 Bit
7053 Points (45%)
9706 Points (61%)
Cinebench R15 - Cinebench R15 CPU Single 64 Bit
201 Points (61%)
195 Points (59%)
Cinebench R11.5 - Cinebench R11.5 CPU Multi 64 Bit
52.2 Points (68%)
54.3 Points (71%)
Cinebench R11.5 - Cinebench R11.5 CPU Single 64 Bit
2.2 Points (54%)
2.1 Points (53%)
Cinebench R10 - Cinebench R10 Rend. Single (32bit)
5884 Points (36%)
5596 Points (34%)
Cinebench R10 - Cinebench R10 Rend. Multi (32bit)
53924 Points (39%)
52743 Points (38%)
Cinebench R10 - Cinebench R10 Rend. Multi (64bit)
88079 Points (61%)
85956 Points (60%)
Cinebench R10 - Cinebench R10 Rend. Single (64bit)
10178 Points (12%)
9892 Points (12%)
wPrime 2.10 - wPrime 2.0 1024m *
24.3 s (0%)
25.4 s (0%)
wPrime 2.10 - wPrime 2.0 32m *
3.6 s (1%)
6.1 s (1%)
WinRAR - WinRAR 4.0
6530 Points (10%)
6689 Points (11%)
7-Zip 18.03 - 7-Zip 18.03 Multli Thread 4 runs
141386 MIPS (81%)
140172 MIPS (80%)
7-Zip 18.03 - 7-Zip 18.03 Single Thread 4 runs
5140 MIPS (61%)
5021 MIPS (60%)
X264 HD Benchmark 4.0 - x264 Pass 2
193 fps (67%)
192.5 fps (67%)
X264 HD Benchmark 4.0 - x264 Pass 1
268 fps (62%)
264 fps (61%)
HWBOT x265 Benchmark v2.2 - HWBOT x265 4k Preset
43 fps (76%)
46.6 fps (82%)
TrueCrypt - TrueCrypt Serpent
2.6 GB/s (0%)
2.9 GB/s (0%)
TrueCrypt - TrueCrypt Twofish
4.7 GB/s (81%)
4.8 GB/s (83%)
TrueCrypt - TrueCrypt AES
27 GB/s (70%)
26 GB/s (68%)
Blender - Blender 2.79 BMW27 CPU *
69.4 Seconds (0%)
47.8 Seconds (0%)
R Benchmark 2.5 - R Benchmark 2.5 *
0.5 sec (12%)
0.6 sec (12%)
3DMark 06 - CPU - 3DMark 06 - CPU
16923 Points (36%)
16656 Points (35%)
Super Pi mod 1.5 XS 1M - Super Pi mod 1.5 XS 1M *
9.5 s (2%)
9.8 s (2%)
Super Pi mod 1.5 XS 2M - Super Pi mod 1.5 XS 2M *
22.6 s (1%)
23.2 s (1%)
Super Pi Mod 1.5 XS 32M - Super Pi mod 1.5 XS 32M *
714 s (3%)
730 s (3%)
3DMark Vantage - 3DM Vant. Perf. CPU no Physx
min: 66795     avg: 66997     median: 66996.5 (59%)     max: 67198 Points
64449 Points (56%)
3DMark 11 - 3DM11 Performance Physics
min: 17245     avg: 17290     median: 17290 (47%)     max: 17335 Points
17518 Points (47%)
3DMark - 3DMark Ice Storm Physics
min: 42508     avg: 42712     median: 42711.5 (35%)     max: 42915 Points
42915 Points (35%)
3DMark - 3DMark Ice Storm Extreme Physics
min: 43100     avg: 43256     median: 43256 (35%)     max: 43412 Points
43100 Points (35%)
3DMark - 3DMark Ice Storm Unlimited Physics
min: 41865     avg: 42701     median: 42701 (36%)     max: 43537 Points
43537 Points (37%)
3DMark - 3DMark Cloud Gate Physics
min: 14439     avg: 14617     median: 14617 (37%)     max: 14795 Points
14439 Points (37%)
3DMark - 3DMark Fire Strike Standard Physics
min: 23884     avg: 24525     median: 24525 (44%)     max: 25166 Points
25166 Points (45%)
3DMark - 3DMark Time Spy CPU
min: 11061     avg: 11108     median: 11107.5 (47%)     max: 11154 Points
10946 Points (46%)
Geekbench 5.5 - Geekbench 5.1 - 5.4 64 Bit Single-Core
1285 Points (54%)
1720 Points (73%)
Geekbench 5.5 - Geekbench 5.1 - 5.4 64 Bit Multi-Core
28798 Points (52%)
14881 Points (27%)
Geekbench 5.0 - Geekbench 5.0 64 Bit Single-Core
1306 Points (6%)
1266 Points (6%)
Geekbench 5.0 - Geekbench 5.0 64 Bit Multi-Core
29094 Points (92%)
31711 Points (100%)
Geekbench 4.4 - Geekbench 4.1 - 4.4 64 Bit Single-Core
5764 Points (58%)
5567 Points (56%)
Geekbench 4.4 - Geekbench 4.1 - 4.4 64 Bit Multi-Core
81029 Points (90%)
80545 Points (90%)
Mozilla Kraken 1.1 - Kraken 1.1 Total Score *
736 ms (1%)
762 ms (1%)
WebXPRT 3 - WebXPRT 3 Score
198 Points (41%)
229 Points (48%)
Power Consumption - Prime95 Power Consumption - external Monitor *
580 Watt (100%)
420 Watt (72%)
Power Consumption - Cinebench R15 Multi Power Consumption - external Monitor *
318 Watt (58%)
Power Consumption - Cinebench R15 Multi Power Efficiency - external Monitor
30.5 Points per Watt (23%)

Average Benchmarks AMD Ryzen Threadripper PRO 3975WX → 100% n=45

Average Benchmarks AMD Ryzen Threadripper PRO 3995WX → 103% n=45

- Range of benchmark values for this graphics card
- Average benchmark values for this graphics card
* Smaller numbers mean a higher performance
1 This benchmark is not used for the average calculation

Add one or more devices and compare

In the following list you can select (and also search for) devices that should be added to the comparison. You can select more than one device.

restrict list:

show all (including archived), 2024, 2023
v1.26
log 25. 01:16:16

#0 checking url part for id 14011 +0s ... 0s

#1 checking url part for id 13251 +0s ... 0s

#2 not redirecting to Ajax server +0s ... 0s

#3 did not recreate cache, as it is less than 5 days old! Created at Tue, 23 Apr 2024 05:40:15 +0200 +0.001s ... 0.001s

#4 composed specs +0.012s ... 0.013s

#5 did output specs +0s ... 0.013s

#6 getting avg benchmarks for device 14011 +0.018s ... 0.031s

#7 got single benchmarks 14011 +0.013s ... 0.044s

#8 getting avg benchmarks for device 13251 +0.014s ... 0.058s

#9 got single benchmarks 13251 +0.01s ... 0.068s

#10 got avg benchmarks for devices +0s ... 0.068s

#11 min, max, avg, median took s +0.285s ... 0.353s

#12 return log +0.022s ... 0.374s

Please share our article, every link counts!
> Expert Reviews and News on Laptops, Smartphones and Tech Innovations > Benchmarks / Tech > Processor Comparison - Head 2 Head
Redaktion, 2017-09- 8 (Update: 2023-07- 1)