UNISOC T618 vs UNISOC Tangula T700
UNISOC T618 ► remove from comparison
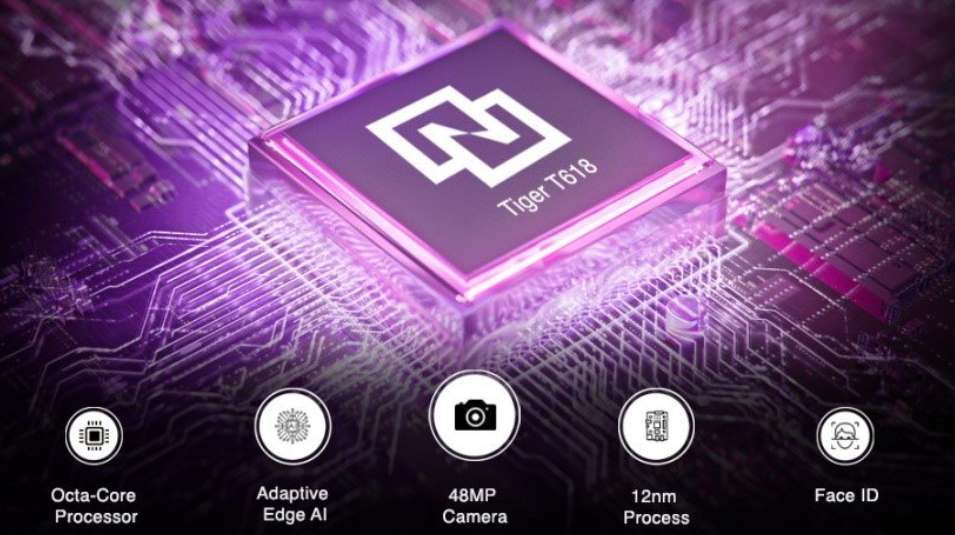
The Unisoc Tiger T618 (former Spreadtrum) is an entry level octa core SoC with two fast ARM Cortex A75 cores at up to 2 GHz and six power efficient ARM Cortex A55 cores at up to 2 GHz. The SoC furthermore includes an LTE modem (TDD-LTE, FDD-LTE, TDSCDMA, WCDMA, CDMA, GSM), a LPDDR3-933 / LPDDR4x-1866 memory controller and an ARM Mali G52MP2 GPU and a tri core ISP. The chip is manufactured at TSMC in 12nm FinFET. AI acceleration is handled by a visual digital signal processor (VDSP) clocked at up to 936 MHz.
UNISOC Tangula T700 ► remove from comparison
The Unisoc Tangula T700 (former Spreadtrum) is an entry level octa core SoC with two fast ARM Cortex A75 cores at up to 1.8 GHz and six power efficient ARM Cortex A55 cores at up to 1.8 GHz. The SoC furthermore includes a LTE modem (TDD-LTE, FDD-LTE, TDSCDMA, WCDMA, CDMA, GSM), an ARM Mali G52MP2 GPU and a tri core ISP. Furthermore, the T700 supports 90 Hz displays.
The chip is manufactured at TSMC in 12nm FinFET.
Model UNISOC T618 UNISOC Tangula T700 Series Codename Cortex-A75 / A55 Cortex-A75 / A55 Series: Cortex-A75 / A55 UNISOC T619 1.8 - 2.2 GHz 8 / 8 1 MB L3 Cortex-A75 / A55 UNISOC T618 « 2 - 2 GHz 8 / 8 1 MB L3 Cortex-A75 / A55 UNISOC T616 1.8 - 2 GHz 8 / 8 1 MB L3 Cortex-A75 / A55 UNISOC T612 1.8 - 2 GHz 8 / 8 1 MB L3 Cortex-A75 / A55 UNISOC T610 1.8 - 2 GHz 8 / 8 1 MB L3 Cortex-A75 / A55 UNISOC T606 1.6 GHz 8 / 8 1 MB L3 Cortex-A75 / A55 UNISOC Tangula T700 1.8 - 1.8 GHz 8 / 8 Cortex-A75 / A55
UNISOC T619 1.8 - 2.2 GHz 8 / 8 1 MB L3 Cortex-A75 / A55 UNISOC T618 2 - 2 GHz 8 / 8 1 MB L3 Cortex-A75 / A55 UNISOC T616 1.8 - 2 GHz 8 / 8 1 MB L3 Cortex-A75 / A55 UNISOC T612 1.8 - 2 GHz 8 / 8 1 MB L3 Cortex-A75 / A55 UNISOC T610 1.8 - 2 GHz 8 / 8 1 MB L3 Cortex-A75 / A55 UNISOC T606 1.6 GHz 8 / 8 1 MB L3 Cortex-A75 / A55 UNISOC Tangula T700 « 1.8 - 1.8 GHz 8 / 8 Cortex-A75 / A55
Clock 2000 - 2000 MHz 1800 - 1800 MHz L3 Cache 1 MB Cores / Threads 8 / 8 8 / 8 Technology 12 nm 12 nm Features ARM Mali G52 MP2, Vivimagic 5.0 Tri-Core-ISP, LTE / 4G Modem, VDSP ARM Mali G52 MP2, Vivimagic 5.0 Tri-Core-ISP, LTE / 4G Modem, VDSP iGPU ARM Mali-G52 MP2 (850 MHz)ARM Mali-G52 MP2 Architecture ARM ARM Announced
Benchmarks Performance Rating - Geekbench 5.5, PCM Work, Sling Shot Physics, Antutu v8 CPU - T618
0.5 pt (37%)
...
...
Performance Rating - Geekbench 5.5, PCM Work, Sling Shot Physics, Antutu v8 CPU - Tangula T700
0.5 pt (37%)
...
...
3DMark - 3DMark Ice Storm Unlimited Physics
22763 Points (19%)
3DMark - 3DMark Sling Shot Extreme (ES 3.1) Unlimited Physics
min: 2526 avg: 2954 median: 3004.5 (35%) max: 3202 Points
min: 2815 avg: 2888 median: 2888 (34%) max: 2961 Points
3DMark - 3DMark Sling Shot (ES 3.0) Unlimited Physics
min: 2611 avg: 2910 median: 2961 (34%) max: 3148 Points
min: 2844 avg: 2903 median: 2902.5 (33%) max: 2961 Points
Geekbench 5.5 - Geekbench 5.1 - 5.4 64 Bit Single-Core
min: 365 avg: 380.2 median: 382 (16%) max: 393 Points
min: 347 avg: 351.5 median: 351.5 (15%) max: 356 Points
Geekbench 5.5 - Geekbench 5.1 - 5.4 64 Bit Multi-Core
min: 1229 avg: 1332 median: 1325.5 (2%) max: 1461 Points
min: 1291 avg: 1342 median: 1342 (2%) max: 1393 Points
Geekbench 4.4 - Geekbench 4.1 - 4.4 64 Bit Single-Core
1911 Points (19%)
Geekbench 4.4 - Geekbench 4.1 - 4.4 64 Bit Multi-Core
5744 Points (6%)
Mozilla Kraken 1.1 - Kraken 1.1 Total Score *
min: 2762 avg: 2962 median: 2874.2 (3%) max: 3432 ms
3722 ms (4%)
Octane V2 - Octane V2 Total Score
min: 10787 avg: 12599 median: 12356.5 (11%) max: 14722 Points
10382 Points (9%)
WebXPRT 4 - WebXPRT 4 Score
58 Points (17%)
WebXPRT 3 - WebXPRT 3 Score
min: 68 avg: 75.7 median: 74.5 (16%) max: 93 Points
65 Points (14%)
min: 38514 avg: 46604 median: 40597 (34%) max: 60702 Points
44936 Points (38%)
AnTuTu v8 - AnTuTu v8 MEM
min: 31976 avg: 38448 median: 40494 (33%) max: 42875 Points
37643 Points (30%)
AnTuTu v8 - AnTuTu v8 GPU
min: 32932 avg: 39187 median: 40289 (7%) max: 44339 Points
36709 Points (7%)
AnTuTu v8 - AnTuTu v8 CPU
min: 62476 avg: 65538 median: 66592 (24%) max: 67546 Points
67597 Points (24%)
AnTuTu v8 - AnTuTu v8 Total Score
min: 173051 avg: 189777 median: 192320 (19%) max: 203961 Points
186885 Points (18%)
Antutu v9 - AnTuTu v9 Total Score
min: 201310 avg: 218309 median: 213115 (13%) max: 240502 Points
164867 Points (10%)
Antutu v9 - AnTuTu v9 CPU
min: 67085 avg: 69141 median: 68306 (19%) max: 72033 Points
65438 Points (18%)
PassMark PerformanceTest Mobile V1 - PerformanceTest Mobile V1 CPU Tests
2078 Points (0%)
PCMark for Android - PCM f. Android Storage 2.0 score
min: 9058 avg: 10105 median: 10105 (18%) max: 11152 Points
10033 Points (18%)
PCMark for Android - PCM f. Android Work Score 3.0
min: 7404 avg: 7980 median: 8273 (38%) max: 8414 Points
min: 8743 avg: 8745 median: 8744.5 (40%) max: 8746 Points
PCMark for Android - PCM f. Android Computer Vision
5739 Points (30%)
5412 Points (29%)
PCMark for Android - PCM f. Android Storage
0 Points (0%)
12328 Points (26%)
PCMark for Android - PCM f. Android Work Score 2.0
min: 82 avg: 3510 median: 3509.5 (23%) max: 6937 Points
8438 Points (55%)
PCMark for Android - PCM f. Android Work Score
12638 Points (63%)
CrossMark - CrossMark Overall
min: 359 avg: 372.3 median: 372.5 (14%) max: 385 Points
Power Consumption - Geekbench 5.5 Power Consumption 150cd *
min: 4.22 avg: 5.1 median: 5.1 (2%) max: 6.22 Watt
min: 0 avg: 4 median: 4 (2%) max: 8.02 Watt
Power Consumption - Idle Power Consumption 150cd 1min *
min: 1.179 avg: 1.9 median: 1.9 (2%) max: 2.42 Watt
Average Benchmarks UNISOC T618 → 100% n=18 Average Benchmarks UNISOC Tangula T700 → 104% n=18
- Range of benchmark values for this graphics card
- Average benchmark values for this graphics card
* Smaller numbers mean a higher performance
1 This benchmark is not used for the average calculation
v1.26
log 19. 02:59:58
#0 checking url part for id 12997 +0s ... 0s
#1 checking url part for id 13247 +0s ... 0s
#2 not redirecting to Ajax server +0s ... 0s
#3 did not recreate cache, as it is less than 5 days old! Created at Tue, 16 Apr 2024 05:37:29 +0200 +0.001s ... 0.001s
#4 composed specs +0.071s ... 0.072s
#5 did output specs +0s ... 0.072s
#6 getting avg benchmarks for device 12997 +0.014s ... 0.086s
#7 got single benchmarks 12997 +0.021s ... 0.106s
#8 getting avg benchmarks for device 13247 +0.01s ... 0.116s
#9 got single benchmarks 13247 +0.008s ... 0.124s
#10 got avg benchmarks for devices +0s ... 0.124s
#11 No cached benchmark found, getting uncached values +0.087s ... 0.211s
#12 min, max, avg, median took s +0.014s ... 0.225s
#13 return log +0.022s ... 0.248s
Please share our article, every link counts!
Redaktion, 2017-09- 8 (Update: 2023-07- 1)
 Deutsch
 English
 Español
 Français
 Italiano
 Nederlands
 Polski
 Português
 Русский
 Türkçe
 Svenska
 Chinese
 Magyar