Notebookcheck Logo

Apple S5 vs Apple A6 vs HiSilicon k3v2 Hi3620

Apple S5

► remove from comparison Apple S5

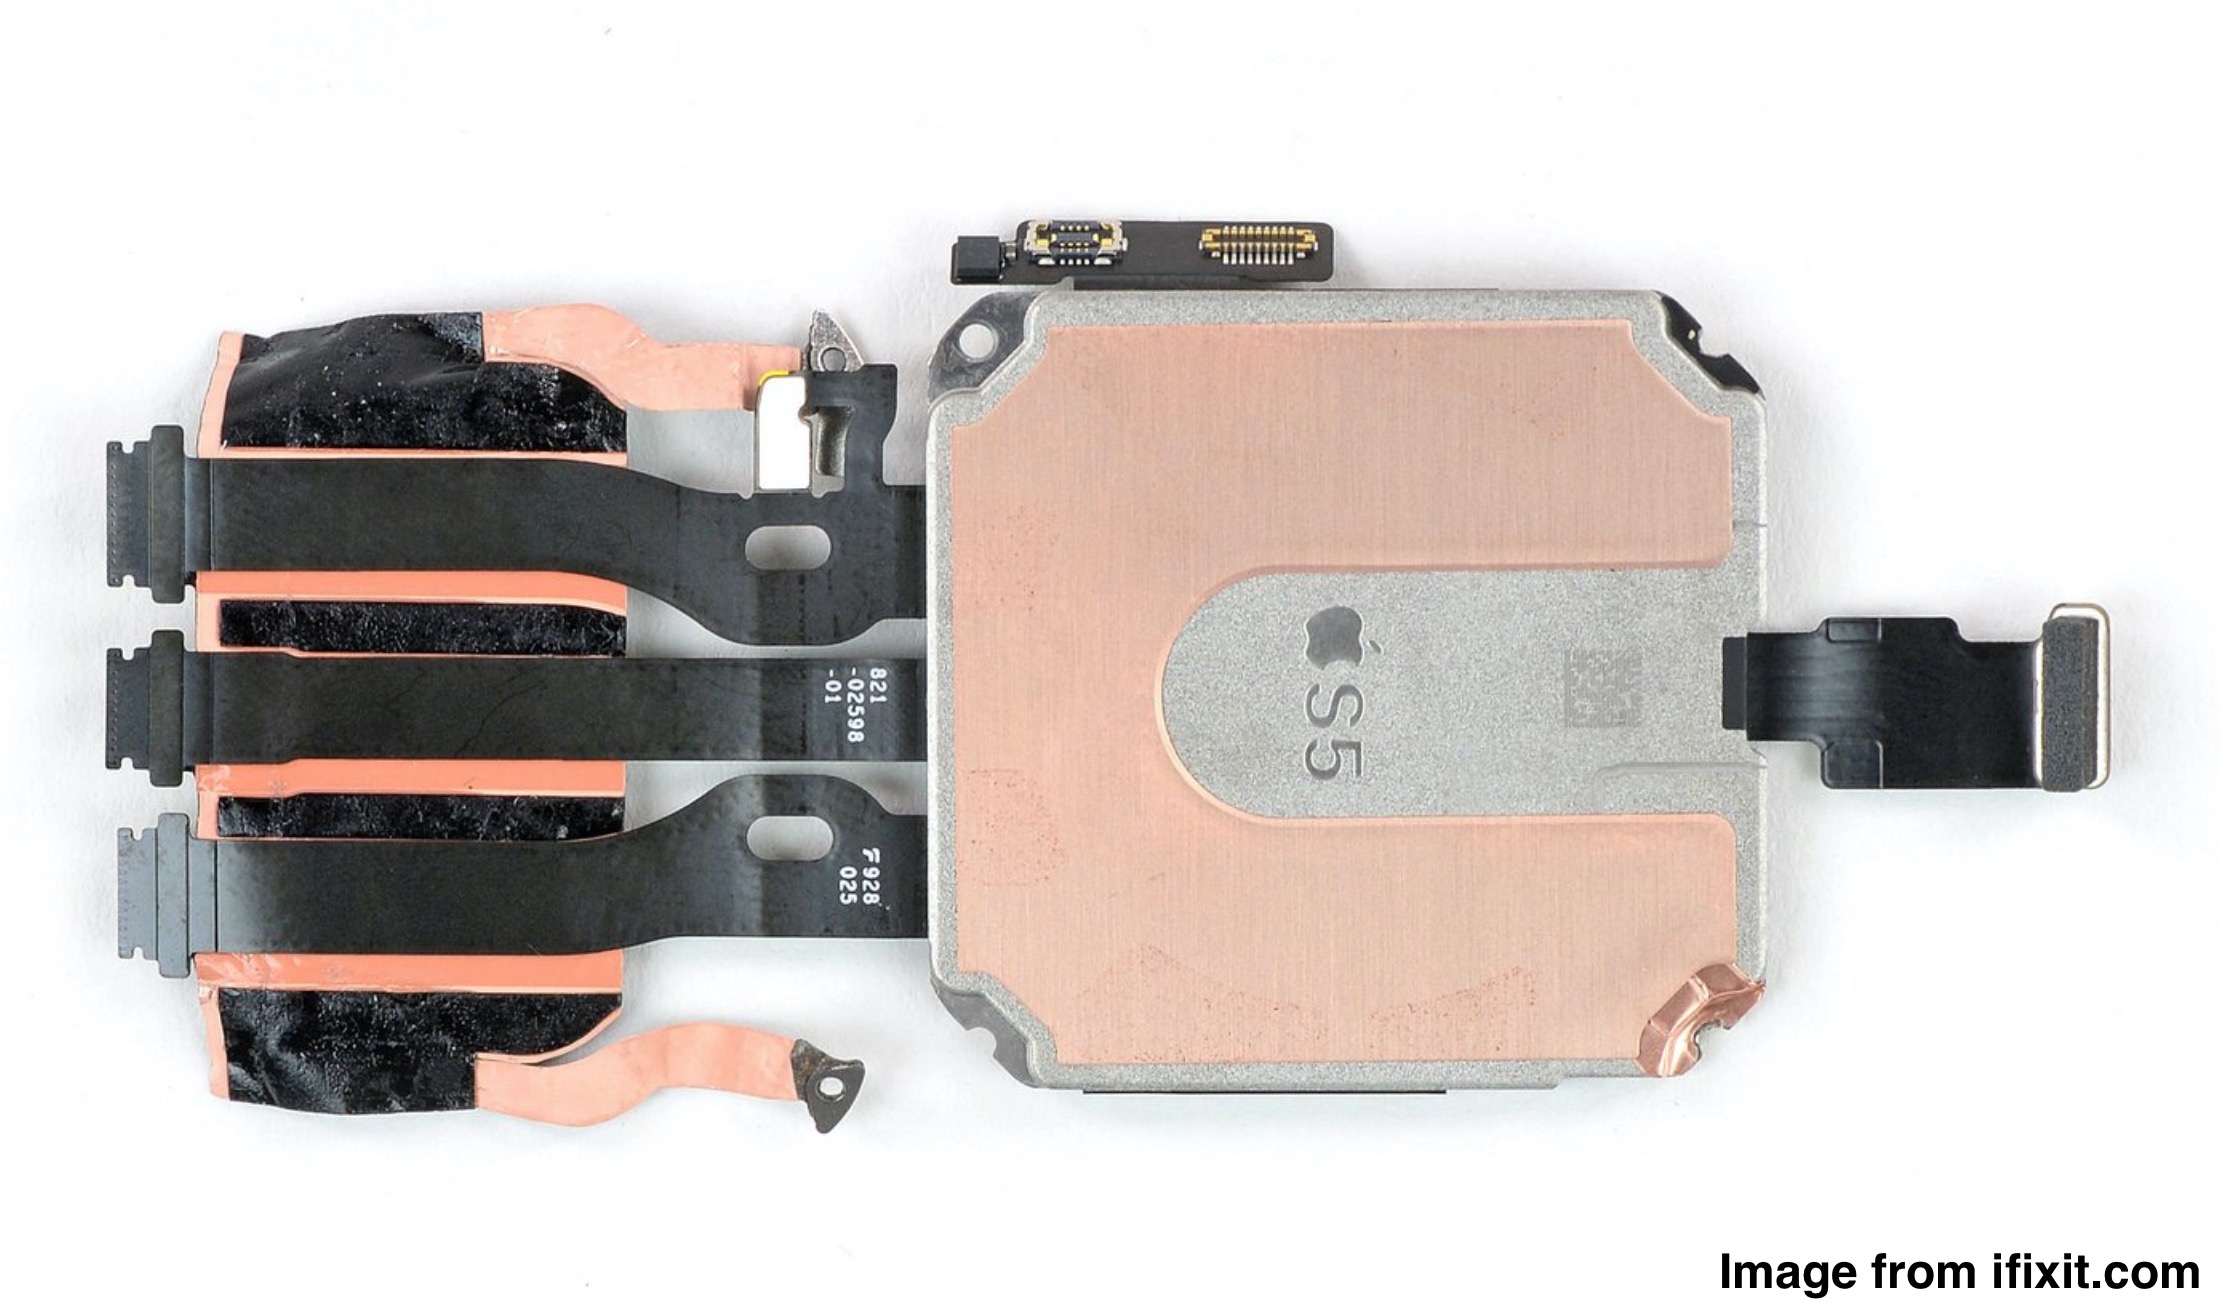
The Apple S5 is a 64-Bit dual core processor for the Apple Watch Series 5 (40 and 44mm). It integrates a GPU, 32 GB flash memory, Bluetooth 5.0, 1 GB RAM, 802.11 b/g/n 2.4 GHz WiFi and satellite positioning (GPS, GLONASS, Galileo, QZSS).

Apple A6

► remove from comparison

The Apple A6 is a dual-core SoC found in the iPhone 5 with ARM compatible CPU cores. The A6 was developed by Apple and supports the extended ARMv7s instruction set. The clock rate of the CPU is between 800 to 1200 MHz depending on the CPU load. The integrated GPU is a PowerVR SGX543MP3 at 266 MHz.

HiSilicon k3v2 Hi3620

► remove from comparison

Coretex A9 Quad-Core - max 1.5 GHz, im Huawei Mediapad 10 FHD mit 1.2 GHz

ModelApple S5Apple A6HiSilicon k3v2 Hi3620
SeriesApple Apple
Series:
HiSilicon Kirin 9000W1.53 - 2.49 GHz12 / 12 cores
UNISOC Tiger T3101.8 - 2 GHz4 / 4 cores
Rockchip RK32881.8 GHz4 / 4 cores
Apple A6x1.4 GHzcores
Apple A61 GHzcores
Apple S5 « 2 / 2 cores
HiSilicon k3v2 Hi36201.2 GHz4 / 4 cores
Rockchip RK3066 1.5 GHz1.5 GHz2 / 2 cores
Amlogic AML8726-MX1.5 GHz2 / 2 cores
Rockchip RK31681.2 GHz2 / 2 cores
Rockchip RK2918 1.2 GHz1.2 GHz1 / 1 cores
ARM Cortex A8 1.2 GHz1.2 GHz1 / 1 cores
Telechips TCC8803 1GHz1 GHz1 / 1 cores
Loongson 2F 900MHz0.9 GHz1 / 1 cores
CSR86700.08 GHzcores
ARM Cortex-M4 cores
HiSilicon Hi6262 cores
DK3.5+STcores
unknown cores
HiSilicon Kirin 9000W1.53 - 2.49 GHz12 / 12 cores
UNISOC Tiger T3101.8 - 2 GHz4 / 4 cores
Rockchip RK32881.8 GHz4 / 4 cores
Apple A6x1.4 GHzcores
Apple A6 « 1 GHzcores
Apple S52 / 2 cores
HiSilicon k3v2 Hi36201.2 GHz4 / 4 cores
Rockchip RK3066 1.5 GHz1.5 GHz2 / 2 cores
Amlogic AML8726-MX1.5 GHz2 / 2 cores
Rockchip RK31681.2 GHz2 / 2 cores
Rockchip RK2918 1.2 GHz1.2 GHz1 / 1 cores
ARM Cortex A8 1.2 GHz1.2 GHz1 / 1 cores
Telechips TCC8803 1GHz1 GHz1 / 1 cores
Loongson 2F 900MHz0.9 GHz1 / 1 cores
CSR86700.08 GHzcores
ARM Cortex-M4 cores
HiSilicon Hi6262 cores
DK3.5+STcores
unknown cores
HiSilicon Kirin 9000W1.53 - 2.49 GHz12 / 12 cores
UNISOC Tiger T3101.8 - 2 GHz4 / 4 cores
Rockchip RK32881.8 GHz4 / 4 cores
Apple A6x1.4 GHzcores
Apple A61 GHzcores
Apple S52 / 2 cores
HiSilicon k3v2 Hi3620 « 1.2 GHz4 / 4 cores
Rockchip RK3066 1.5 GHz1.5 GHz2 / 2 cores
Amlogic AML8726-MX1.5 GHz2 / 2 cores
Rockchip RK31681.2 GHz2 / 2 cores
Rockchip RK2918 1.2 GHz1.2 GHz1 / 1 cores
ARM Cortex A8 1.2 GHz1.2 GHz1 / 1 cores
Telechips TCC8803 1GHz1 GHz1 / 1 cores
Loongson 2F 900MHz0.9 GHz1 / 1 cores
CSR86700.08 GHzcores
ARM Cortex-M4 cores
HiSilicon Hi6262 cores
DK3.5+STcores
unknown cores
Cores / Threads2 / 224 / 4
Announced
Clock1000 MHz1200 MHz
Technology32 nm40 nm
ArchitectureARMARM
FeaturesARMv7

Benchmarks

3DMark - 3DMark Ice Storm Physics
100%
1 A6 +
7961 Points (6%)
min: 3209     avg: 4477     median: 4894 (4%)     max: 5167 Points
3DMark - 3DMark Ice Storm Extreme Physics
100%
1 A6 +
7816 Points (6%)
min: 5354     avg: 5357     median: 5357 (4%)     max: 5360 Points
Geekbench 3 - Geekbench 3 32 Bit Multi-Core
100%
1 A6 +
1273 Points (2%)
1094 Points (2%)
Geekbench 3 - Geekbench 3 32 Bit Single-Core
100%
1 A6 +
min: 701     avg: 706     median: 705.5 (14%)     max: 710 Points
327 Points (6%)
Geekbench 2 - 32 Bit - Geekbench Stream
100%
1 A6 +
940 Points (8%)
min: 439     avg: 489.9     median: 500 (4%)     max: 547 Points
Geekbench 2 - 32 Bit - Geekbench Memory
100%
1 A6 +
1867 Points (17%)
min: 940     avg: 1187     median: 1218 (11%)     max: 1290 Points
Geekbench 2 - 32 Bit - Geekbench Floating Point
100%
1 A6 +
2114 Points (4%)
min: 1793     avg: 2360     median: 2351 (5%)     max: 2731 Points
Geekbench 2 - 32 Bit - Geekbench Integer
100%
1 A6 +
1261 Points (3%)
min: 1000     avg: 1317     median: 1275 (3%)     max: 1591 Points
Geekbench 2 - 32 Bit - Geekbench Total Score
100%
1 A6 +
1648 Points (4%)
min: 1209     avg: 1573     median: 1557 (4%)     max: 1819 Points
Linpack Android / IOS - Linpack Multi Thread
100%
1 A6 +
min: 484     avg: 530     median: 529.5 (18%)     max: 575 MFLOPS
min: 92.3     avg: 133.3     median: 138.1 (5%)     max: 151.8 MFLOPS
Linpack Android / IOS - Linpack Single Thread
100%
1 A6 +
min: 309.4     avg: 337.3     median: 337.3 (33%)     max: 365.2 MFLOPS
min: 37.8     avg: 44.2     median: 46.6 (5%)     max: 48.71 MFLOPS
Mozilla Kraken 1.1 - Kraken 1.1 Total Score *
100%
1 A6 +
14535 ms (17%)
26477 ms (31%)
Sunspider - Sunspider 1.0 Total Score *
100%
S5 +
min: 2014     avg: 2022     median: 2022 (22%)     max: 2030 ms
118%
A6 +
min: 714     avg: 722     median: 722 (8%)     max: 730 ms
min: 856     avg: 2197     median: 1610 (18%)     max: 4026 ms
Sunspider - Sunspider 0.9.1 Total Score *
100%
1 A6 +
935 ms (9%)
min: 1522     avg: 1643     median: 1540 (15%)     max: 2080 ms
Quadrant Standard Edition 2.0 - Quadrant Standard 2.0 Total Score
min: 4404     avg: 4736     median: 4736 (11%)     max: 5068 points
AnTuTu v3 - AnTuTu v3 CPU
min: 4820     avg: 5667     median: 5662 (37%)     max: 6713 Points
AnTuTu v4 - AnTuTu v4 Total Score
14434 Points (34%)
AndEBench - AndEBench Java
min: 92     avg: 191     median: 191 (6%)     max: 290 Iter./s
AndEBench - AndEBench Native
min: 8740     avg: 8897     median: 8897 (29%)     max: 9054 Iter./s
PassMark PerformanceTest Mobile V1 - PerformanceTest Mobile V1 CPU Tests
100%
1 A6 +
24996 Points (3%)
min: 8223     avg: 8737     median: 8678 (1%)     max: 9118 Points

Average Benchmarks Apple S5 → 100% n=1

Average Benchmarks Apple A6 → 118% n=1

Average Benchmarks HiSilicon k3v2 Hi3620 → 106% n=1

- Range of benchmark values for this graphics card
- Average benchmark values for this graphics card
* Smaller numbers mean a higher performance
1 This benchmark is not used for the average calculation

v1.26
log 19. 22:33:43

#0 checking url part for id 11530 +0s ... 0s

#1 checking url part for id 3551 +0s ... 0s

#2 checking url part for id 3613 +0s ... 0s

#3 not redirecting to Ajax server +0s ... 0s

#4 did not recreate cache, as it is less than 5 days old! Created at Fri, 19 Apr 2024 05:38:49 +0200 +0.001s ... 0.001s

#5 composed specs +0.164s ... 0.166s

#6 did output specs +0s ... 0.166s

#7 getting avg benchmarks for device 11530 +0.003s ... 0.169s

#8 got single benchmarks 11530 +0.01s ... 0.179s

#9 getting avg benchmarks for device 3551 +0.004s ... 0.183s

#10 got single benchmarks 3551 +0.01s ... 0.193s

#11 getting avg benchmarks for device 3613 +0.003s ... 0.196s

#12 got single benchmarks 3613 +0.018s ... 0.213s

#13 got avg benchmarks for devices +0s ... 0.213s

#14 min, max, avg, median took s +0.114s ... 0.327s

#15 return log +0s ... 0.327s

Please share our article, every link counts!
> Expert Reviews and News on Laptops, Smartphones and Tech Innovations > Benchmarks / Tech > Processor Comparison - Head 2 Head
Redaktion, 2017-09- 8 (Update: 2023-07- 1)