Notebookcheck Logo

AMD Radeon Pro 455 vs AMD Radeon RX 480 (Laptop)

AMD Radeon Pro 455

► remove from comparison

The AMD Radeon Pro 455 is mobile graphics card for laptops that can be found in the high-end model of the Apple MacBook Pro Retina 15 Late 2016. It is based on the small Polaris 11 chip which is manufactured in 14 nm FinFET at Globalfoundries. Compared to the Radeon RX 460 (see for benchmarks), the Pro 455 features only 768 instead of 896 shaders and definately lower clock speeds. The peak performance is rated at 1.3 TFLOPS and therefore 30% faster than the Pro 450, but clearly slower than the 1.86 TFLOPS of the Pro 460 and 2.2 TFLOPS of the RX460. The performance of the card could be similar to the Nvidia GeForce GTX 960M as the RX 460 is similar to the GTX 965M. A major drawback is the small VRAM size of only 2 GB GDDR5. The optional Radeon Pro 460 offers 4 GB of VRAM, 1024 shaders and 1.86 TFLOPS and should be similar to the RX 460.

Apple and AMD don't provide driver updates for Windows using Bootcamp. The only option is to use modified drivers from BootcampDrivers.com.

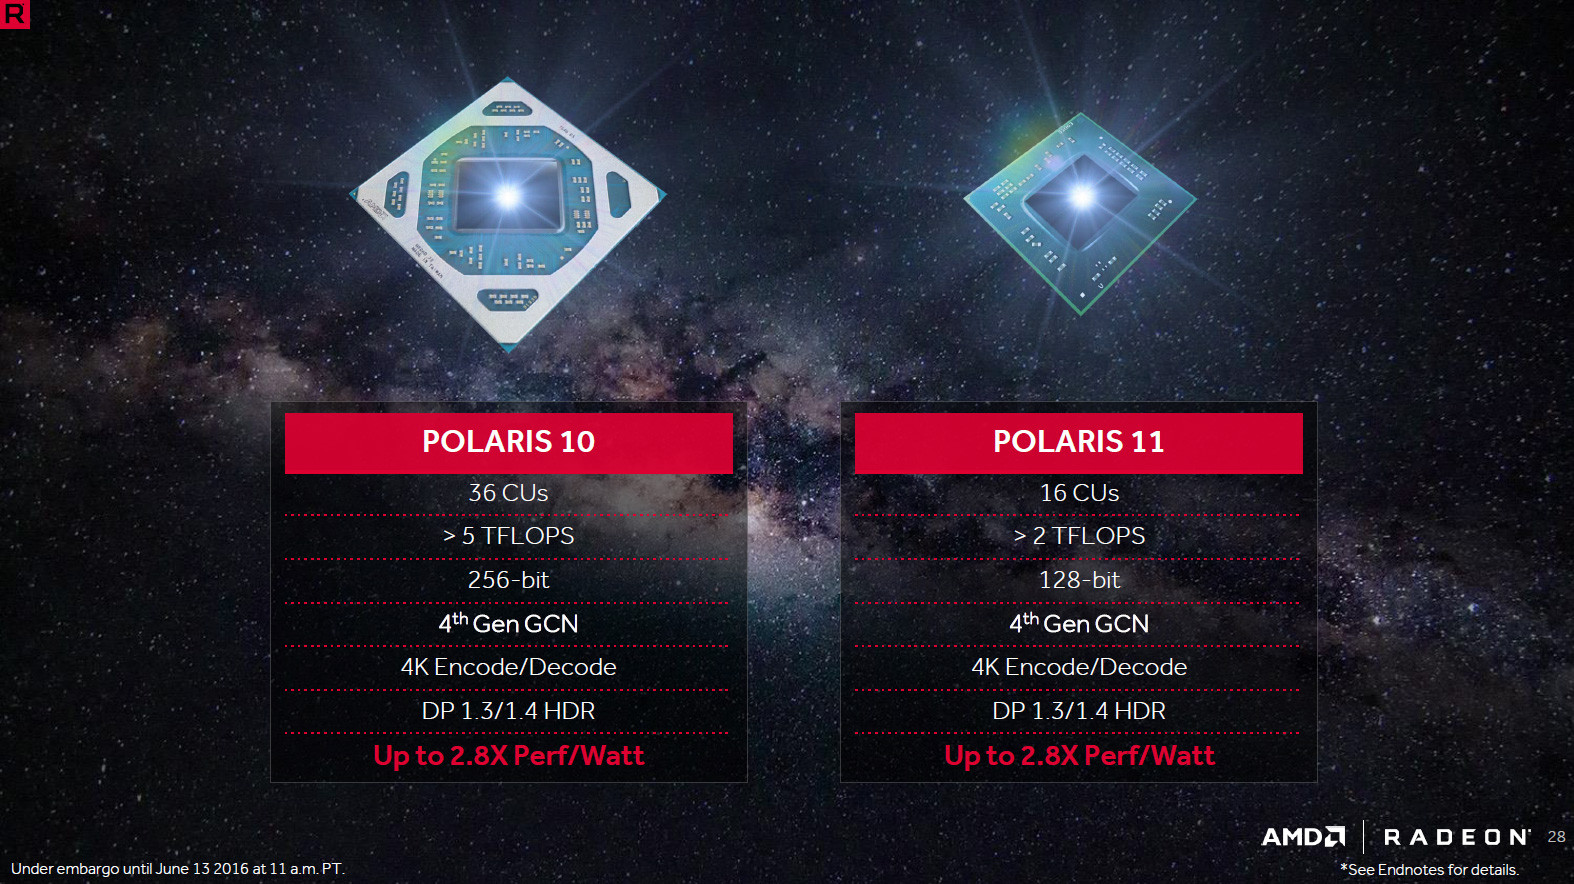
The features of the Radeon Pro 455 are identical to the faster RX 460 and all other Polaris chips. See more details on the Polaris architecture here. According to AMD, the Pro 455 support DisplayPort 1.2 (altough 1.4 is supported by Polaris) and HDMI 2.0 (via USB-C adapter).

The power envelope of the faster Radeon Pro 460 is rated at 35 Watt according to the AMD blog post. Due to the slower specs, the Radeon Pro 455 should use slightly less.

AMD Radeon RX 480 (Laptop)

► remove from comparison AMD Radeon RX 480 (Laptop)

The AMD Radeon RX 480 (formerly known as R9 M480 or RX 480M) is a mobile high end graphics cards. It is based on the new Polaris architecture (Polaris 10 chip) and manufactured in 14nm FinFET. It should be based on the same chip as the desktop RX 480 (see for benchmarks and specs) but maybe offer lower clock speeds. The card was never used in a laptop (up to now) and succeeded by the slightly improved Radeon RX 580.

AMD Radeon Pro 455AMD Radeon RX 480 (Laptop)
Radeon RX 400M Series
Radeon RX 480 (Laptop) 2304 256 Bit
Radeon RX 490M compare
Radeon RX 460 (Laptop) compare 896 @ 1.18 GHz128 Bit @ 6000 MHz
Radeon Pro 460 compare 1024 @ 0.9 GHz128 Bit @ 5000 MHz
Radeon Pro 455 768 @ 0.86 GHz128 Bit @ 5000 MHz
Radeon Pro 450 compare 640 @ 0.8 GHz128 Bit @ 5080 MHz
Radeon RX 480 (Laptop) 2304 256 Bit
Radeon RX 490M compare
Radeon RX 460 (Laptop) compare 896 @ 1.18 GHz128 Bit @ 6000 MHz
Radeon Pro 460 compare 1024 @ 0.9 GHz128 Bit @ 5000 MHz
Radeon Pro 455 768 @ 0.86 GHz128 Bit @ 5000 MHz
Radeon Pro 450 compare 640 @ 0.8 GHz128 Bit @ 5080 MHz
CodenamePolaris 11Polaris
ArchitecturePolarisPolaris
Pipelines768 - unified2304 - unified
Core Speed855 MHz
Memory Speed5000 MHz
Memory Bus Width128 Bit256 Bit
Memory TypeGDDR5GDDR5
Max. Amount of Memory2048 MB
Shared Memorynono
APIDirectX 12, OpenGL VulkanDirectX 12
Power Consumption<35 Watt
Transistors3 Billion
technology14 nm14 nm
FeaturesDisplayPort 1.3 HBR / 1.4 HDR Ready, HDMI 2.0, AMD FreeSync
Notebook Sizelargelarge
Date of Announcement27.10.2016 01.08.2016
Link to Manufacturer Pagecreators.radeon.com

Benchmarks

3DMark - 3DMark Time Spy Score
1254 Points (4%)
3DMark - 3DMark Time Spy Graphics
1118 Points (3%)
3DMark - 3DMark Ice Storm Unlimited Graphics
229045 Points (26%)
3DMark - 3DMark Cloud Gate Score
15766 Points (17%)
3DMark - 3DMark Cloud Gate Graphics
23434 Points (6%)
3DMark - 3DMark Fire Strike Standard Score
3463 Points (6%)
4070 Points (7%)
3DMark - 3DMark Fire Strike Standard Graphics
3759 Points (4%)
3DMark 11 - 3DM11 Performance Score
5774 Points (8%)
7200 Points (10%)
3DMark 11 - 3DM11 Performance GPU
5388 Points (5%)
3DMark Vantage
3DM Vant. Perf. total + AMD Radeon Pro 455
3DMark Vantage - 3DM Vant. Perf. total
16522 Points (5%)
3DM Vant. Perf. GPU no PhysX + AMD Radeon Pro 455
3DMark Vantage - 3DM Vant. Perf. GPU no PhysX
14879 Points (8%)
3DMark 06 3DMark 06 - Standard 1280x1024 + AMD Radeon Pro 455
3DMark 06
25873 Points (34%)
Unigine Valley 1.0 - Unigine Valley 1.0 DX
16.4 fps (5%)
SPECviewperf 12
specvp12 sw-03 + AMD Radeon Pro 455
SPECviewperf 12 - specvp12 sw-03
47.4 fps (12%)
specvp12 snx-02 + AMD Radeon Pro 455
SPECviewperf 12 - specvp12 snx-02
13.9 fps (2%)
specvp12 showcase-01 + AMD Radeon Pro 455
SPECviewperf 12 - specvp12 showcase-01
20.3 fps (4%)
specvp12 mediacal-01 + AMD Radeon Pro 455
SPECviewperf 12 - specvp12 mediacal-01
10.8 fps (3%)
specvp12 maya-04 + AMD Radeon Pro 455
SPECviewperf 12 - specvp12 maya-04
30.2 fps (8%)
specvp12 energy-01 + AMD Radeon Pro 455
SPECviewperf 12 - specvp12 energy-01
0.2 fps (0%)
specvp12 creo-01 + AMD Radeon Pro 455
SPECviewperf 12 - specvp12 creo-01
32.8 fps (13%)
specvp12 catia-04 + AMD Radeon Pro 455
SPECviewperf 12 - specvp12 catia-04
31.2 fps (5%)
specvp12 3dsmax-05 + AMD Radeon Pro 455
SPECviewperf 12 - specvp12 3dsmax-05
26.4 fps (5%)
Cinebench R10 Cinebench R10 Shading (32bit) + AMD Radeon Pro 455
Cinebench R10 - Cinebench R10 Shading (32bit)
12740 Points (9%)
Cinebench R15
Cinebench R15 OpenGL 64 Bit + AMD Radeon Pro 455
Cinebench R15 - Cinebench R15 OpenGL 64 Bit
100 fps (6%)
Cinebench R15 OpenGL Ref. Match 64 Bit + AMD Radeon Pro 455
Cinebench R15 - Cinebench R15 OpenGL Ref. Match 64 Bit
98 % (98%)
GFXBench 3.0 - GFXBench 3.0 Manhattan Offscreen
92.2 fps (5%)
GFXBench (DX / GLBenchmark) 2.7
GFXBench T-Rex HD Offscreen C24Z16 + AMD Radeon Pro 455
GFXBench (DX / GLBenchmark) 2.7 - GFXBench T-Rex HD Offscreen C24Z16
229 fps (2%)
LuxMark v2.0 64Bit - LuxMark v2.0 Room GPU
483 Samples/s (2%)
LuxMark v2.0 64Bit - LuxMark v2.0 Sala GPU
918 Samples/s (2%)
ComputeMark v2.1 - ComputeMark v2.1 Result
3049 Points (3%)
Power Consumption - Furmark Stress Test Power Consumption - external Monitor *
56.1 Watt (8%)
Power Consumption - The Witcher 3 Power Consumption - external Monitor *
48.3 Watt (7%)
Power Consumption - Witcher 3 ultra Power Efficiency - external Monitor
0.3 fps per Watt (24%)

Average Benchmarks AMD Radeon Pro 455 → 100% n=2

Average Benchmarks AMD Radeon RX 480 (Laptop) → 121% n=2

- Range of benchmark values for this graphics card
- Average benchmark values for this graphics card
* Smaller numbers mean a higher performance
1 This benchmark is not used for the average calculation

Game Benchmarks

The following benchmarks stem from our benchmarks of review laptops. The performance depends on the used graphics memory, clock rate, processor, system settings, drivers, and operating systems. So the results don't have to be representative for all laptops with this GPU. For detailed information on the benchmark results, click on the fps number.

low 1280x720
100%
Radeon Pro 455:
146  fps
med. 1920x1080
100%
Radeon Pro 455:
59.4  fps
high 1920x1080
100%
Radeon Pro 455:
34.6  fps
ultra 1920x1080
100%
Radeon Pro 455:
19.7  fps
low 1280x720
100%
Radeon Pro 455:
54.4  fps
high 1920x1080
100%
Radeon Pro 455:
20.7  fps
low 1280x720
100%
Radeon Pro 455:
44.1  fps
high 1920x1080
100%
Radeon Pro 455:
20.6  fps
high 1920x1080
100%
Radeon Pro 455:
40.2  fps
ultra 1920x1080
100%
Radeon Pro 455:
34.4  fps
high 1920x1080
100%
Radeon Pro 455:
33.1  fps
ultra 1920x1080
100%
Radeon Pro 455:
28.8  fps
high 1920x1080
100%
Radeon Pro 455:
71.7  fps
ultra 1920x1080
100%
Radeon Pro 455:
25.8  fps
4K 3840x2160
100%
Radeon Pro 455:
22.8  fps
low 1280x720
100%
Radeon Pro 455:
109  fps
high 1920x1080
100%
Radeon Pro 455:
28.9  fps
ultra 1920x1080
100%
Radeon Pro 455:
25.3  fps
low 1024x768
100%
Radeon Pro 455:
69  fps
high 1920x1080
100%
Radeon Pro 455:
28.8  fps
ultra 1920x1080
100%
Radeon Pro 455:
21.6  fps
Mafia 3

Mafia 3

2016
low 1280x720
100%
Radeon Pro 455:
32.8  fps
high 1920x1080
100%
Radeon Pro 455:
15.1  fps
FIFA 17

FIFA 17

2016
ultra 1920x1080
100%
Radeon Pro 455:
107  fps
low 1280x720
100%
Radeon Pro 455:
59.5  fps
high 1920x1080
100%
Radeon Pro 455:
21.5  fps
ultra 1920x1080
100%
Radeon Pro 455:
8.9  fps
Overwatch

Overwatch

2016
low 1280x720
100%
Radeon Pro 455:
178  fps
high 1920x1080
100%
Radeon Pro 455:
65.8  fps
ultra 1920x1080
100%
Radeon Pro 455:
30.1  fps
4K 3840x2160
100%
Radeon Pro 455:
18.7  fps
Doom

Doom

2016
low 1280x720
100%
Radeon Pro 455:
53.1  fps
high 1920x1080
100%
Radeon Pro 455:
19.8  fps
low 1280x768
100%
Radeon Pro 455:
33.8  fps
med. 1920x1080
100%
Radeon Pro 455:
21.3  fps
high 1920x1080
100%
Radeon Pro 455:
19.3  fps
low 1280x720
100%
Radeon Pro 455:
75  fps
high 1920x1080
100%
Radeon Pro 455:
20.4  fps
low 1280x720
100%
Radeon Pro 455:
88  fps
high 1920x1080
100%
Radeon Pro 455:
25.2  fps
ultra 1920x1080
100%
Radeon Pro 455:
18.5  fps
low 1280x720
100%
Radeon Pro 455:
70  fps
med. 1920x1080
100%
Radeon Pro 455:
32  fps
high 1920x1080
100%
Radeon Pro 455:
30  fps
ultra 1920x1080
100%
Radeon Pro 455:
20  fps
XCOM 2

XCOM 2

2016
low 1280x720
100%
Radeon Pro 455:
70  fps
med. 1920x1080
100%
Radeon Pro 455:
27.2  fps
high 1920x1080
100%
Radeon Pro 455:
17.9  fps
ultra 1920x1080
100%
Radeon Pro 455:
5.9  fps
low 1024x768
100%
Radeon Pro 455:
84  fps
high 1920x1080
100%
Radeon Pro 455:
24.9  fps
ultra 1920x1080
100%
Radeon Pro 455:
18.3  fps
low 1024x768
100%
Radeon Pro 455:
162  fps
high 1920x1080
100%
Radeon Pro 455:
52.7  fps
ultra 1920x1080
100%
Radeon Pro 455:
33.7  fps
Fallout 4

Fallout 4

2015
high 1920x1080
100%
Radeon Pro 455:
27.8  fps
Anno 2205

Anno 2205

2015
low 1024x768
100%
Radeon Pro 455:
86  fps
high 1920x1080
100%
Radeon Pro 455:
17.5  fps
ultra 1920x1080
100%
Radeon Pro 455:
7.7  fps
low 1366x768
100%
Radeon Pro 455:
188  fps
high 1920x1080
100%
Radeon Pro 455:
70.7  fps
ultra 1920x1080
100%
Radeon Pro 455:
53  fps
high 1920x1080
100%
Radeon Pro 455:
67.2  fps
ultra 1920x1080
100%
Radeon Pro 455:
61.5  fps
4K 3840x2160
100%
Radeon Pro 455:
22.8  fps
low 1024x768
100%
Radeon Pro 455:
69.5  fps
high 1920x1080
100%
Radeon Pro 455:
24.6  fps
ultra 1920x1080
100%
Radeon Pro 455:
14.2  fps
GTA V

GTA V

2015
high 1920x1080
100%
Radeon Pro 455:
37.1  fps
ultra 1920x1080
100%
Radeon Pro 455:
11.1  fps
Sims 4

Sims 4

2014
ultra 1920x1080
100%
Radeon Pro 455:
50.6  fps
low 1280x720
100%
Radeon Pro 455:
230  fps
ultra 1920x1080
100%
Radeon Pro 455:
37.8  fps
ultra 1920x1080
100%
Radeon Pro 455:
145  fps

Average Gaming AMD Radeon Pro 455 → 100%

Average Gaming 30-70 fps → 100%

AMD Radeon Pro 455lowmed.highultraQHD4K
Resident Evil 714659.434.619.7
Watch Dogs 254.420.7
Dishonored 244.120.6
Call of Duty Infinite Warfare40.234.4
Titanfall 233.128.8
Farming Simulator 1771.725.822.8
Battlefield 110928.925.3
Civilization VI6928.821.6
Mafia 332.815.1
FIFA 17107
Deus Ex Mankind Divided59.521.58.9
Overwatch17865.830.118.7
Doom53.119.8
Ashes of the Singularity33.821.319.3
Hitman 20167520.4
The Division8825.218.5
Far Cry Primal70323020
XCOM 27027.217.95.9
Rise of the Tomb Raider8424.918.3
Rainbow Six Siege16252.733.7
Fallout 427.8
Anno 22058617.57.7
World of Warships18870.753
Dota 2 Reborn67.261.522.8
The Witcher 369.524.614.2
GTA V37.111.1
Sims 450.6
BioShock Infinite23037.8
Counter-Strike: GO145
< 30 fps
< 60 fps
< 120 fps
≥ 120 fps

6
9
5
2
2

15
6
4
13
6
2
1


3


For more games that might be playable and a list of all games and graphics cards visit our Gaming List

Add one or more devices and compare

In the following list you can select (and also search for) devices that should be added to the comparison. You can select more than one device.

restrict list:

show all (including archived), 2024, 2023
v1.26
log 18. 16:37:56

#0 checking url part for id 7592 +0s ... 0s

#1 checking url part for id 7306 +0s ... 0s

#2 not redirecting to Ajax server +0s ... 0s

#3 did not recreate cache, as it is less than 5 days old! Created at Tue, 16 Apr 2024 05:39:00 +0200 +0.001s ... 0.001s

#4 composed specs +0.077s ... 0.078s

#5 did output specs +0s ... 0.078s

#6 start showIntegratedCPUs +0s ... 0.078s

#7 getting avg benchmarks for device 7592 +0.023s ... 0.102s

#8 got single benchmarks 7592 +0.007s ... 0.108s

#9 getting avg benchmarks for device 7306 +0.002s ... 0.11s

#10 got single benchmarks 7306 +0.004s ... 0.114s

#11 got avg benchmarks for devices +0s ... 0.114s

#12 min, max, avg, median took s +0.153s ... 0.267s

#13 before gaming benchmark output +0s ... 0.268s

#14 Got 74 rows for game benchmarks. +0.009s ... 0.277s

#15 composed SQL query for gamebenchmarks +0s ... 0.277s

#16 got data and put it in $dataArray +0.021s ... 0.298s

#17 benchmarks composed for output. +0.071s ... 0.369s

#18 calculated avg scores. +0s ... 0.369s

#19 return log +0.047s ... 0.416s

Please share our article, every link counts!
> Expert Reviews and News on Laptops, Smartphones and Tech Innovations > Benchmarks / Tech > Graphics Card Comparison - Head 2 Head
Redaktion, 2017-09- 8 (Update: 2023-07- 1)