Notebookcheck Logo

Rockchip RK3188 vs HiSilicon k3v2 Hi3620 vs Rockchip RK3066 1.5 GHz

Rockchip RK3188

► remove from comparison

The Rockchip RK3188 is a fast ARM SoC primarily designed for tablets. It integrates four ARM Cortex A9 cores with NEON extension and a clock speed of up to 1.8 GHz, a Mali-400 MP4 graphics card (up to 600 MHz, 24 GFLOPS) and a low-power (LP-)DDR2/DDR3 memory controller. Due to the high clock rates, the performance of the CPU and GPU is superior to other Cortex-A9 quad-cores such as the Nvidia Tegra 3 and Samsung Exynos 4412. These high frequencies are possible due to the 28nm process (TSMC). However, this results in high power consumption and is thus not suited for compact smartphones.

HiSilicon k3v2 Hi3620

► remove from comparison

Coretex A9 Quad-Core - max 1.5 GHz, im Huawei Mediapad 10 FHD mit 1.2 GHz

Rockchip RK3066 1.5 GHz

► remove from comparison  RK3066

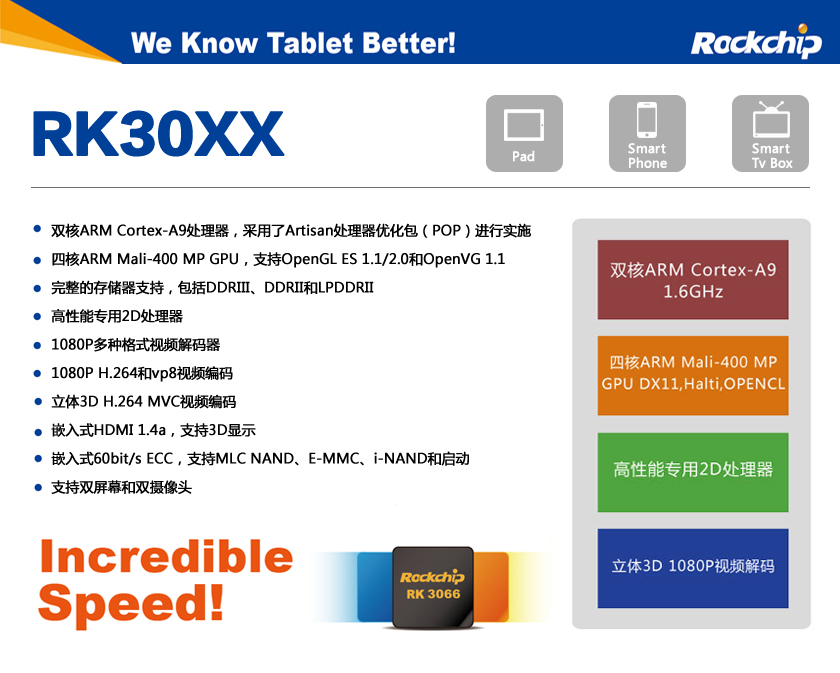
The Rockchip RK3066 is a cheap ARM based SoC for Tablets and Smartphones. It integrates two ARM Cortex-A9 (ARMv7) CPU cores with NEON extensions, a ARM Mali-400MP4 (quad-core clocked at 250 MHz) graphics card and a video de- and encoder as main components. The integrated memory controller supports a maximum of 2 GB DDR1, DDR2 or DDR3 memory.

The CPU cores can be clocked up to 1.6 GHz depending on the cooling solution of the tablet / smartphone.

Additional Features according to Wikipedia

  • VPU (Video Processing Unit) Multi-Media Processor supporting 1080p image and video decoding
  • HDMI 1.4 Interface
  • 2-channels TFT LCD Interface with 5 layers and 3D Display (1920×1080 Maximum Display Size)
  • USB 2.0 Interface
  • SD/MMC Interface

ModelRockchip RK3188HiSilicon k3v2 Hi3620Rockchip RK3066 1.5 GHz
Series
CodenameCortex-A9
Series:
HiSilicon Kirin 910T1.8 GHz4 / 4 cores Cortex-A9
Rockchip RK3188 « 1.8 GHz4 / 4 cores Cortex-A9
HiSilicon Kirin 9101.6 GHz4 / 4 cores Cortex-A9
Renesas MP52321.5 GHz2 / 2 cores Cortex-A9
Broadcom BCM21664T1.2 GHz2 / 2 cores Cortex-A9
Marvell PXA9861.2 GHz2 / 2 cores Cortex-A9
NXP i.MX 6SLL1 GHz1 / 1 cores Cortex-A9
WonderMedia PRIZM WM89501 GHz1 / 1 cores Cortex-A9
HiSilicon Kirin 9000W1.53 - 2.49 GHz12 / 12 cores
UNISOC Tiger T3101.8 - 2 GHz4 / 4 cores
Rockchip RK32881.8 GHz4 / 4 cores
Apple A6x1.4 GHzcores
Apple A61 GHzcores
Apple S52 / 2 cores
HiSilicon k3v2 Hi3620 « 1.2 GHz4 / 4 cores
Rockchip RK3066 1.5 GHz1.5 GHz2 / 2 cores
Amlogic AML8726-MX1.5 GHz2 / 2 cores
Rockchip RK31681.2 GHz2 / 2 cores
Rockchip RK2918 1.2 GHz1.2 GHz1 / 1 cores
ARM Cortex A8 1.2 GHz1.2 GHz1 / 1 cores
Telechips TCC8803 1GHz1 GHz1 / 1 cores
Loongson 2F 900MHz0.9 GHz1 / 1 cores
CSR86700.08 GHzcores
ARM Cortex-M4 cores
HiSilicon Hi6262 cores
DK3.5+STcores
unknown cores
HiSilicon Kirin 9000W1.53 - 2.49 GHz12 / 12 cores
UNISOC Tiger T3101.8 - 2 GHz4 / 4 cores
Rockchip RK32881.8 GHz4 / 4 cores
Apple A6x1.4 GHzcores
Apple A61 GHzcores
Apple S52 / 2 cores
HiSilicon k3v2 Hi36201.2 GHz4 / 4 cores
Rockchip RK3066 1.5 GHz « 1.5 GHz2 / 2 cores
Amlogic AML8726-MX1.5 GHz2 / 2 cores
Rockchip RK31681.2 GHz2 / 2 cores
Rockchip RK2918 1.2 GHz1.2 GHz1 / 1 cores
ARM Cortex A8 1.2 GHz1.2 GHz1 / 1 cores
Telechips TCC8803 1GHz1 GHz1 / 1 cores
Loongson 2F 900MHz0.9 GHz1 / 1 cores
CSR86700.08 GHzcores
ARM Cortex-M4 cores
HiSilicon Hi6262 cores
DK3.5+STcores
unknown cores
Clock1800 MHz1200 MHz1500 MHz
Cores / Threads4 / 44 / 42 / 2
Technology28 nm40 nm40 nm
FeaturesMali-400 MP4 (600 MHz), DDR2/DDR3 Memory Controller (max. 2 GByte)ARMv7Mali-400 MP4, Single Channel DDR3 Memory Controller
iGPUARM Mali-400 MP4 (600 MHz)ARM Mali-400 MP4 (250 MHz)
ArchitectureARMARMARM
Announced
Manufacturerwww.rock-chips.comwww.rock-chips.com
L2 Cache512 KB

Benchmarks

3DMark - 3DMark Ice Storm Physics
min: 5828     avg: 7773     median: 7936 (6%)     max: 8887 Points
min: 3209     avg: 4477     median: 4894 (4%)     max: 5167 Points
min: 4687     avg: 4990     median: 5059 (4%)     max: 5161 Points
3DMark - 3DMark Ice Storm Extreme Physics
min: 5434     avg: 7724     median: 8025.5 (7%)     max: 8812 Points
min: 5354     avg: 5357     median: 5357 (4%)     max: 5360 Points
4890 Points (4%)
3DMark - 3DMark Ice Storm Unlimited Physics
100%
1 RK3188 +
min: 9142     avg: 9821     median: 9821 (8%)     max: 10500 Points
Geekbench 3 - Geekbench 3 32 Bit Multi-Core
100%
1 RK3188 +
min: 1316     avg: 1410     median: 1421 (3%)     max: 1493 Points
1094 Points (2%)
Geekbench 3 - Geekbench 3 32 Bit Single-Core
100%
1 RK3188 +
min: 476     avg: 498.7     median: 504 (10%)     max: 516 Points
327 Points (6%)
Geekbench 2 - 32 Bit - Geekbench Stream
min: 182     avg: 320     median: 272 (2%)     max: 506 Points
min: 439     avg: 489.9     median: 500 (4%)     max: 547 Points
min: 206     avg: 398.6     median: 390 (3%)     max: 621 Points
Geekbench 2 - 32 Bit - Geekbench Memory
min: 326     avg: 687     median: 803 (7%)     max: 933 Points
min: 940     avg: 1187     median: 1218 (11%)     max: 1290 Points
min: 389     avg: 1072     median: 1071 (10%)     max: 1439 Points
Geekbench 2 - 32 Bit - Geekbench Floating Point
min: 1769     avg: 2044     median: 2035 (4%)     max: 2328 Points
min: 1793     avg: 2360     median: 2351 (5%)     max: 2731 Points
min: 843     avg: 1408     median: 1342 (3%)     max: 2107 Points
Geekbench 2 - 32 Bit - Geekbench Integer
min: 924     avg: 1123     median: 1104 (2%)     max: 1341 Points
min: 1000     avg: 1317     median: 1275 (3%)     max: 1591 Points
min: 490     avg: 798     median: 788.5 (2%)     max: 1201 Points
Geekbench 2 - 32 Bit - Geekbench Total Score
min: 1130     avg: 1275     median: 1182 (3%)     max: 1512 Points
min: 1209     avg: 1573     median: 1557 (4%)     max: 1819 Points
min: 694     avg: 1026     median: 1007.5 (3%)     max: 1518 Points
Linpack Android / IOS - Linpack Multi Thread
min: 130     avg: 131.1     median: 131.1 (4%)     max: 132.1 MFLOPS
min: 92.3     avg: 133.3     median: 138.1 (5%)     max: 151.8 MFLOPS
min: 50.7     avg: 80     median: 82.5 (3%)     max: 104.6 MFLOPS
Linpack Android / IOS - Linpack Single Thread
min: 54.9     avg: 57.2     median: 57.2 (6%)     max: 59.4 MFLOPS
min: 37.8     avg: 44.2     median: 46.6 (5%)     max: 48.71 MFLOPS
min: 24.87     avg: 52.1     median: 54.8 (5%)     max: 62.1 MFLOPS
Mozilla Kraken 1.1 - Kraken 1.1 Total Score *
100%
1 RK3188 +
13698 ms (16%)
26477 ms (31%)
Sunspider - Sunspider 1.0 Total Score *
min: 849     avg: 1179     median: 1240 (14%)     max: 1388 ms
min: 856     avg: 2197     median: 1610 (18%)     max: 4026 ms
1959 ms (21%)
Sunspider - Sunspider 0.9.1 Total Score *
min: 702     avg: 986     median: 1086 (10%)     max: 1170 ms
min: 1522     avg: 1643     median: 1540 (15%)     max: 2080 ms
min: 1150     avg: 1418     median: 1355.5 (13%)     max: 1884 ms
Octane V2 - Octane V2 Total Score
100%
1 RK3188 +
min: 3092     avg: 3094     median: 3093.5 (3%)     max: 3095 Points
Quadrant Standard Edition 2.0 - Quadrant Standard 2.0 Total Score
5287 points (12%)
min: 4404     avg: 4736     median: 4736 (11%)     max: 5068 points
min: 3105     avg: 3862     median: 3974 (9%)     max: 4257 points
AnTuTu v3 - AnTuTu v3 CPU
min: 7505     avg: 7723     median: 7807 (51%)     max: 7856 Points
min: 4820     avg: 5667     median: 5662 (37%)     max: 6713 Points
min: 2135     avg: 3577     median: 3734 (24%)     max: 4267 Points
AnTuTu v4 - AnTuTu v4 Total Score
100%
1 RK3188 +
min: 2139     avg: 14154     median: 19571 (46%)     max: 20752 Points
14434 Points (34%)
AndEBench - AndEBench Java
100%
1 RK3188 +
min: 179     avg: 329     median: 374 (11%)     max: 434 Iter./s
min: 92     avg: 191     median: 191 (6%)     max: 290 Iter./s
AndEBench - AndEBench Native
100%
1 RK3188 +
min: 10329     avg: 11213     median: 11588 (38%)     max: 11722 Iter./s
min: 8740     avg: 8897     median: 8897 (29%)     max: 9054 Iter./s
PassMark PerformanceTest Mobile V1 - PerformanceTest Mobile V1 CPU Tests
min: 9258     avg: 10743     median: 10965 (1%)     max: 11782 Points
min: 8223     avg: 8737     median: 8678 (1%)     max: 9118 Points
5852 Points (1%)

Average Benchmarks Rockchip RK3188 → 100% n=14

Average Benchmarks HiSilicon k3v2 Hi3620 → 103% n=14

Average Benchmarks Rockchip RK3066 1.5 GHz → 82% n=14

- Range of benchmark values for this graphics card
- Average benchmark values for this graphics card
* Smaller numbers mean a higher performance
1 This benchmark is not used for the average calculation

v1.26
log 19. 17:15:50

#0 checking url part for id 4137 +0s ... 0s

#1 checking url part for id 3613 +0s ... 0s

#2 checking url part for id 3576 +0s ... 0s

#3 not redirecting to Ajax server +0s ... 0s

#4 did not recreate cache, as it is less than 5 days old! Created at Fri, 19 Apr 2024 05:38:49 +0200 +0.001s ... 0.001s

#5 composed specs +0.173s ... 0.174s

#6 did output specs +0s ... 0.174s

#7 getting avg benchmarks for device 4137 +0.003s ... 0.177s

#8 got single benchmarks 4137 +0.025s ... 0.203s

#9 getting avg benchmarks for device 3613 +0.003s ... 0.205s

#10 got single benchmarks 3613 +0.018s ... 0.223s

#11 getting avg benchmarks for device 3576 +0.003s ... 0.226s

#12 got single benchmarks 3576 +0.024s ... 0.25s

#13 got avg benchmarks for devices +0s ... 0.25s

#14 min, max, avg, median took s +0.175s ... 0.425s

#15 return log +0s ... 0.425s

Please share our article, every link counts!
> Expert Reviews and News on Laptops, Smartphones and Tech Innovations > Benchmarks / Tech > Processor Comparison - Head 2 Head
Redaktion, 2017-09- 8 (Update: 2023-07- 1)