Notebookcheck Logo

AMD Ryzen 9 7900X vs Intel Core i5-14501E vs Intel Core i5-13500

AMD Ryzen 9 7900X

► remove from comparison AMD R9 7900X

The AMD Ryzen 9 7900X is a fast high-end desktop processor of the Raphael series. It offers 12 cores based on the Zen 4 architecture that supports hyperthreading (24 threads). The cores clock from 4.7 (base) up to 5.7 GHz (single core boost). When all 12 cores are fully loaded, 5.1 GHz is the max. clock speed. The 7900X is the second fastest Ryzen at launch, only bested by the Ryzen 9 7950X with 4 more cores.

The performance of the R9 7900X is clearly better than the old Ryzen 9 5900X thanks to the improved architecture and modern 5nm process. Compared to Intels Raptor Lake Core i9-13700K the single-core performance is slightly lower and the multi-core performance slightly faster. The gaming performance is a bit lower, and is on average only on par with the Core i5-13600K and also lower than the old Ryzen 7 5800X3D.

The Raphael series still uses a chiplet design with two CCD-clusters (each with 8 possible cores) in 5nm and an IO-die (including the memory controller and the Radeon Graphics iGPU) in 6nm.

Intel Core i5-14501E

► remove from comparison Intel Core i5-14501E

The Intel Core i5-14501E is a peculiar Raptor Lake family desktop processor (SoC) that has 6 performance cores but 0 efficient cores. It's the lack of E-cores that makes 14X01 chips special.

The product has decently sized level 2 and 3 caches at 12 MB and 24 MB, respectively. Its CPU cores run at up to 5.2 GHz. The UHD 770 serves as the integrated graphics solution. There is no 'proper' NPU here, however, vPro Enterprise features such as RPE (Remote Platform Erase) are onboard.

The i5 chip is manufactured built with the Intel 7 process which is fairly old, as of mid 2025. Its base TDP sits at 65 W which is the standard value for desktop CPUs.

Performance

While we have not tested a single 14X01 processor as of July 2025, we do know that a single 4.6 GHz Raptor Cove core, such as that of an Core i7-14650HX is good for 116 Cinebench 2024 points and 285 Cinebench R15 points. (The 14501E can run at up to 5.2 GHz, too, to remind you.) If we multiply the values by 6, we get a reasonably fair projection that sees the 14501E being about as fast as lower mid-range laptop AMD chips of 2025, such as the AMD Ryzen AI 5 340. While not particularly impressive, this is definitely sufficient for any tasks and applications one could run in 2025, top games included.

Intel Core i5-13500

► remove from comparison Intel i5-13500

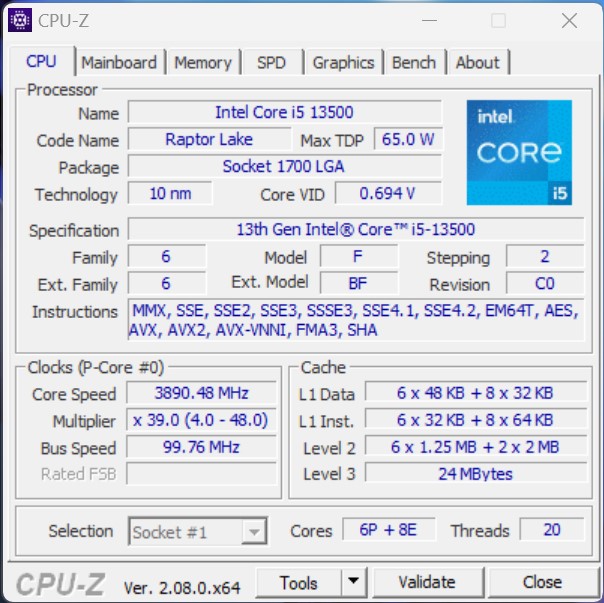
The Intel Core i5-13500 is a fast and relatively power efficient desktop processor based on the Raptor Lake architecture, which was introduced in October 2022. The processor offers a base clock of 2.5 GHz and reaches up to 4.8 GHz in Turbo. The hybrid CPU architecture introduced with Alder Lake is also used in the Raptor Lake processors. Compared to the Intel Core i5-12500, the Intel Core i5-13500 offers more cores, which means a higher overall performance can be achieved. In total, the Intel Core i5-13500 can process up to 20 threads in parallel. The performance cores (P cores) offer hyperthreading for this purpose, which is withheld from the energy-efficient cores (E cores).

Performance

Due to the higher number of physical computing units, the Intel Core i5-13500 offers noticeably more performance compared to the Intel Core i5-12500. Both processors have 6 P-cores, although only the Intel Core i5-13500 is additionally equipped with 8 E-cores.

Graphics unit

Like the Intel Core i5-12600K, the Intel Core i5-13500 offers an integrated graphics unit. The Intel Iris Xe architecture continues to serve as the basis. In terms of performance, however, not much has changed with the new Intel UHD Graphics 770.

Power consumption

The TDP of the Intel Core i5-13500 is 65 watts, with the option to increase this to up to 154 watts in Turbo mode. Compared to the Intel Core i5-12500, the energy requirement increases slightly.

ModelAMD Ryzen 9 7900XIntel Core i5-14501EIntel Core i5-13500
CodenameRaphael (Zen4)Raptor LakeRaptor Lake
SeriesAMD Raphael (Zen 4, Ryzen 7000)Intel Raptor Lake-SIntel Raptor Lake-S
Series: Raptor Lake-S Raptor Lake
AMD Ryzen 9 7950X3D4.2 - 5.7 GHz16 / 32 cores128 MB L3
AMD Ryzen 9 7900X « 4.7 - 5.6 GHz12 / 24 cores64 MB L3
AMD Ryzen 9 79003.7 - 5.4 GHz12 / 24 cores64 MB L3
AMD Ryzen 7 7700X4.5 - 5.4 GHz8 / 16 cores32 MB L3
AMD Ryzen 7 77003.8 - 5.3 GHz8 / 16 cores32 MB L3
AMD Ryzen 7 7800X3D4.2 - 5 GHz8 / 16 cores96 MB L3
AMD Ryzen 5 7600X4.7 - 5.3 GHz6 / 12 cores32 MB L3
AMD Ryzen 5 76003.8 - 5.1 GHz6 / 12 cores32 MB L3
Intel Core i9-13900K3 - 5.8 GHz24 / 32 cores36 MB L3
Intel Core i7-13700K3.4 - 5.4 GHz16 / 24 cores30 MB L3
Intel Core i5-13600K3.5 - 5.1 GHz14 / 20 cores24 MB L3
Intel Core i5-135002.5 - 4.8 GHz14 / 20 cores24 MB L3
Intel Core i5-14501TE2.2 - 5.1 GHz6 / 12 cores12 MB L3
Intel Core i5-14501E « 3.3 - 5.2 GHz6 / 12 cores24 MB L3
Intel Core i5-14401E2.5 - 4.7 GHz6 / 12 cores12 MB L3
Intel Core i5-14401TE2 - 4.5 GHz6 / 12 cores12 MB L3
Intel Core i5-13500T1.6 - 4.6 GHz14 / 20 cores24 MB L3
Intel Core i9-13900K3 - 5.8 GHz24 / 32 cores36 MB L3
Intel Core i7-13700K3.4 - 5.4 GHz16 / 24 cores30 MB L3
Intel Core i5-13600K3.5 - 5.1 GHz14 / 20 cores24 MB L3
Intel Core i5-13500 « 2.5 - 4.8 GHz14 / 20 cores24 MB L3
Intel Core i5-14501TE2.2 - 5.1 GHz6 / 12 cores12 MB L3
Intel Core i5-14501E3.3 - 5.2 GHz6 / 12 cores24 MB L3
Intel Core i5-14401E2.5 - 4.7 GHz6 / 12 cores12 MB L3
Intel Core i5-14401TE2 - 4.5 GHz6 / 12 cores12 MB L3
Intel Core i5-13500T1.6 - 4.6 GHz14 / 20 cores24 MB L3
Clock4700 - 5600 MHz3300 - 5200 MHz2500 - 4800 MHz
L1 Cache768 KB
L2 Cache12 MB12 MB11.5 MB
L3 Cache64 MB24 MB24 MB
Cores / Threads12 / 246 / 12
6 x 5.2 GHz Intel Raptor Cove P-Core
14 / 20
6 x 4.8 GHz Intel Raptor Cove P-Core
8 x 3.5 GHz Intel Gracemont E-Core
TDP170 Watt65 Watt65 Watt
TransistorsCCD: 6,5 Mrd + IOD: 3,4 Mrd Million
Technology5 nm (CCD), 6 nm (I/O) nm10 nm10 nm
Voltage0.650 - 1.475V V
Die Size2x 70 (CCD) mm2 + 122 (I/O) mm2215 mm2
max. Temp.95 °C100 °C
SocketAM5 (LGA 1718)LGA1700LGA 1700
FeaturesMMX(+), SSE, SSE2, SSE3, SSSE3, SSE4.1, SSE4.2, SSE4A, x86-64, AMD-V, AES, AVX, AVX2, AVX512F, FMA3, SHA, Precision Boost 2DDR4-3200/DDR5-4800 RAM, PCIe 5 + PCIe 4, DL Boost, GNA, vPro En., RPE, MMX, SSE, SSE2, SSE3, SSSE3, SSE4.1, SSE4.2, AVX, AVX2, BMI2, ABM, FMA, ADX, SMEP, SMAP, EIST, TM1, TM2, HT, Turbo, SST, AES-NI, RDRAND, RDSEED, SHAIntel UHD Graphics 770, DDR5 4800 MT/s, DDR4 3200 MT/s
iGPUAMD Radeon Graphics (Ryzen 7000)Intel UHD Graphics 770 ( - 1550 MHz)Intel UHD Graphics 770 (300 - 1550 MHz)
Architecturex86x86x86
Announced
Manufacturerwww.intel.comwww.intel.de
TDP Turbo PL2154 Watt

Benchmarks

Performance Rating - CB R15 + R20 + 7-Zip + X265 + Blender + 3DM11 CPU - R9 7900X
48.1 pt (80%)
Restrict / Search: Model: Max. age: years
Performance Rating - CB R15 + R20 + 7-Zip + X265 + Blender + 3DM11 CPU - i5-13500
38.3 pt (64%)
Restrict / Search: Model: Max. age: years
Cinebench 2024 - Cinebench 2024 CPU Single Core
107 Points (60%)
Cinebench 2024 - Cinebench 2024 CPU Multi Core
822 Points (15%)
Cinebench R23 - Cinebench R23 Multi Core
min: 28925     avg: 29289     median: 29300 (27%)     max: 29628 Points
14573 Points (14%)
Cinebench R23 - Cinebench R23 Single Core
min: 2012     avg: 2020     median: 2016.5 (85%)     max: 2039 Points
1780 Points (75%)
Cinebench R20 - Cinebench R20 CPU (Single Core)
min: 780     avg: 783     median: 782.5 (85%)     max: 787 Points
685 Points (75%)
Cinebench R20 - Cinebench R20 CPU (Multi Core)
min: 11353     avg: 11474     median: 11471.5 (28%)     max: 11623 Points
5633 Points (14%)
Cinebench R15 - Cinebench R15 CPU Multi 64 Bit
min: 4753     avg: 4818     median: 4820.5 (30%)     max: 4856 Points
2405 Points (15%)
Cinebench R15 - Cinebench R15 CPU Single 64 Bit
min: 319     avg: 322.2     median: 323 (89%)     max: 325 Points
256 Points (71%)
Cinebench R11.5 - Cinebench R11.5 CPU Multi 64 Bit
min: 53.91     avg: 54.6     median: 54.7 (71%)     max: 55.26 Points
28.4 Points (37%)
Cinebench R11.5 - Cinebench R11.5 CPU Single 64 Bit
min: 3.78     avg: 3.8     median: 3.8 (91%)     max: 3.85 Points
3.1 Points (74%)
Cinebench R10 - Cinebench R10 Rend. Single (32bit)
min: 8465     avg: 8658     median: 8623 (52%)     max: 8858 Points
8875 Points (54%)
Cinebench R10 - Cinebench R10 Rend. Multi (32bit)
min: 67036     avg: 68658     median: 68579.5 (50%)     max: 70741 Points
49300 Points (36%)
Cinebench R10 - Cinebench R10 Rend. Multi (64bit)
min: 121250     avg: 126872     median: 125768 (80%)     max: 134469 Points
79625 Points (51%)
Cinebench R10 - Cinebench R10 Rend. Single (64bit)
min: 16151     avg: 16234     median: 16246 (20%)     max: 16338 Points
14282 Points (17%)
wPrime 2.10 - wPrime 2.0 1024m *
min: 39.576     avg: 40.4     median: 40.3 (0%)     max: 41.122 s
100.7 s (1%)
wPrime 2.10 - wPrime 2.0 32m *
min: 1.781     avg: 1.8     median: 1.8 (0%)     max: 1.872 s
4 s (1%)
WinRAR - WinRAR 4.0
17225 Points (27%)
7704 Points (12%)
7-Zip 18.03 - 7-Zip 18.03 Multi Thread 4 runs
min: 124975     avg: 127080     median: 127195 (73%)     max: 129087 MIPS
55528 MIPS (32%)
7-Zip 18.03 - 7-Zip 18.03 Single Thread 4 runs
min: 8252     avg: 8280     median: 8269 (97%)     max: 8345 MIPS
5887 MIPS (69%)
X264 HD Benchmark 4.0 - x264 Pass 2
241 fps (81%)
134.6 fps (45%)
X264 HD Benchmark 4.0 - x264 Pass 1
376 fps (87%)
306 fps (71%)
HWBOT x265 Benchmark v2.2 - HWBOT x265 4k Preset
min: 36.2     avg: 36.8     median: 36.9 (65%)     max: 37.1 fps
16.3 fps (29%)
TrueCrypt - TrueCrypt Serpent
1.5 GB/s (44%)
1.3 GB/s (38%)
TrueCrypt - TrueCrypt Twofish
2.8 GB/s (48%)
2.3 GB/s (40%)
TrueCrypt - TrueCrypt AES
14.8 GB/s (39%)
12 GB/s (31%)
Blender - Blender 3.3 Classroom CPU *
min: 165     avg: 166.4     median: 166 (2%)     max: 168 Seconds
399 Seconds (5%)
Blender - Blender 2.79 BMW27 CPU *
min: 105     avg: 106.2     median: 106 (1%)     max: 107 Seconds
223 Seconds (2%)
R Benchmark 2.5 - R Benchmark 2.5 *
min: 0.3643     avg: 0.4     median: 0.4 (8%)     max: 0.3758 sec
0.4 sec (10%)
3DMark 06 - CPU - 3DMark 06 - CPU
min: 20439     avg: 21223     median: 21284 (45%)     max: 21659 Points
14875 Points (32%)
Super Pi mod 1.5 XS 1M - Super Pi mod 1.5 XS 1M *
6.1 s (1%)
7.8 s (2%)
Super Pi mod 1.5 XS 2M - Super Pi mod 1.5 XS 2M *
13.3 s (1%)
17.2 s (1%)
Super Pi Mod 1.5 XS 32M - Super Pi mod 1.5 XS 32M *
313.4 s (1%)
3DMark Vantage - 3DM Vant. Perf. CPU no Physx
min: 82063     avg: 100438     median: 102019 (78%)     max: 102765 Points
69725 Points (54%)
3DMark 11 - 3DM11 Performance Physics
min: 26455     avg: 27800     median: 27731 (68%)     max: 28963 Points
18026 Points (44%)
3DMark - 3DMark Ice Storm Physics
min: 96003     avg: 102745     median: 103232 (84%)     max: 105350 Points
84456 Points (69%)
3DMark - 3DMark Ice Storm Extreme Physics
min: 97281     avg: 102964     median: 103220 (84%)     max: 106230 Points
83392 Points (68%)
3DMark - 3DMark Ice Storm Unlimited Physics
min: 94657     avg: 102993     median: 101826 (84%)     max: 108551 Points
81778 Points (68%)
3DMark - 3DMark Cloud Gate Physics
min: 25631     avg: 26260     median: 26310.5 (67%)     max: 26732 Points
17891 Points (45%)
3DMark - 3DMark Fire Strike Standard Physics
min: 40436     avg: 42329     median: 42325 (75%)     max: 43200 Points
26263 Points (47%)
3DMark - 3DMark Time Spy CPU
min: 13634     avg: 15940     median: 15959.5 (67%)     max: 16721 Points
9655 Points (41%)
Geekbench 6.4 - Geekbench 6.4 Single-Core
2990 Points (75%)
2483 Points (62%)
Geekbench 6.4 - Geekbench 6.4 Multi-Core
18300 Points (71%)
10348 Points (40%)
Geekbench 6.0 - Geekbench 6.0 Single-Core
3105 Points (99%)
Geekbench 6.0 - Geekbench 6.0 Multi-Core
21003 Points (86%)
Geekbench 5.5 - Geekbench 5.1 - 5.5 64 Bit Single-Core
min: 2274     avg: 2290     median: 2294 (90%)     max: 2297 Points
1805 Points (71%)
Geekbench 5.5 - Geekbench 5.1 - 5.5 64 Bit Multi-Core
min: 19987     avg: 20553     median: 20667.5 (37%)     max: 20799 Points
10322 Points (18%)
Geekbench 5.0 - Geekbench 5.0 64 Bit Single-Core
min: 2183     avg: 2195     median: 2196 (10%)     max: 2201 Points
1749 Points (8%)
Geekbench 5.0 - Geekbench 5.0 64 Bit Multi-Core
min: 19975     avg: 20532     median: 20658 (65%)     max: 20765 Points
10213 Points (32%)
Geekbench 4.4 - Geekbench 4.1 - 4.4 64 Bit Single-Core
min: 9193     avg: 9260     median: 9275 (93%)     max: 9311 Points
7379 Points (74%)
Geekbench 4.4 - Geekbench 4.1 - 4.4 64 Bit Multi-Core
min: 74731     avg: 76662     median: 77033 (77%)     max: 77769 Points
39094 Points (39%)
Mozilla Kraken 1.1 - Kraken 1.1 Total Score *
min: 431     avg: 438     median: 440 (1%)     max: 441 ms
519 ms (1%)
WebXPRT 4 - WebXPRT 4 Score
min: 300     avg: 305.8     median: 304.5 (84%)     max: 314 Points
254 Points (70%)
WebXPRT 3 - WebXPRT 3 Score
min: 371     avg: 383.8     median: 383 (69%)     max: 395 Points
266 Points (48%)
CrossMark - CrossMark Overall
min: 2315     avg: 2370     median: 2370 (89%)     max: 2408 Points
1549 Points (58%)
Power Consumption - Prime95 Power Consumption - external Monitor *
319 Watt (55%)
98.7 Watt (17%)
Power Consumption - Cinebench R15 Multi Power Consumption - external Monitor *
313 Watt (57%)
121 Watt (22%)
Power Consumption - Idle Power Consumption - external Monitor *
94.1 Watt (62%)
1190%
1 i5-13500 +
7.9 Watt (5%)
Power Consumption - Power Efficiency - Cinebench R15 Multi external Monitor
15.5 Points per Watt (12%)
19.9 Points per Watt (15%)

Average Benchmarks AMD Ryzen 9 7900X → 0% n=0

Average Benchmarks Intel Core i5-13500 → 0% n=0

- Range of benchmark values for this graphics card
red legend - Average benchmark values for this graphics card
* Smaller numbers mean a higher performance
1 This benchmark is not used for the average calculation

v1.33
log 19. 14:32:13

#0 ran 0s before starting gpusingle class +0s ... 0s

#1 checking url part for id 14608 +0s ... 0s

#2 checking url part for id 18709 +0s ... 0s

#3 checking url part for id 17901 +0s ... 0s

#4 redirected to Ajax server, took 1752928333s time from redirect:0 +0s ... 0s

#5 did not recreate cache, as it is less than 5 days old! Created at Sat, 19 Jul 2025 13:28:35 +0200 +0s ... 0s

#6 composed specs +0.006s ... 0.007s

#7 did output specs +0s ... 0.007s

#8 getting avg benchmarks for device 14608 +0.004s ... 0.011s

#9 got single benchmarks 14608 +0.017s ... 0.028s

#10 getting avg benchmarks for device 18709 +0.001s ... 0.029s

#11 got single benchmarks 18709 +0s ... 0.029s

#12 getting avg benchmarks for device 17901 +0.004s ... 0.032s

#13 got single benchmarks 17901 +0.004s ... 0.037s

#14 got avg benchmarks for devices +0s ... 0.037s

#15 min, max, avg, median took s +0.048s ... 0.084s

#16 return log +0s ... 0.084s

Please share our article, every link counts!
Mail Logo
> Expert Reviews and News on Laptops, Smartphones and Tech Innovations > Benchmarks / Tech > Processor Comparison - Head 2 Head
Redaktion, 2017-09- 8 (Update: 2023-07- 1)