Notebookcheck Logo

AMD Ryzen 9 3900 vs AMD Ryzen 7 3800XT vs AMD Ryzen 9 3950X

AMD Ryzen 9 3900

► remove from comparison AMD R9 3900

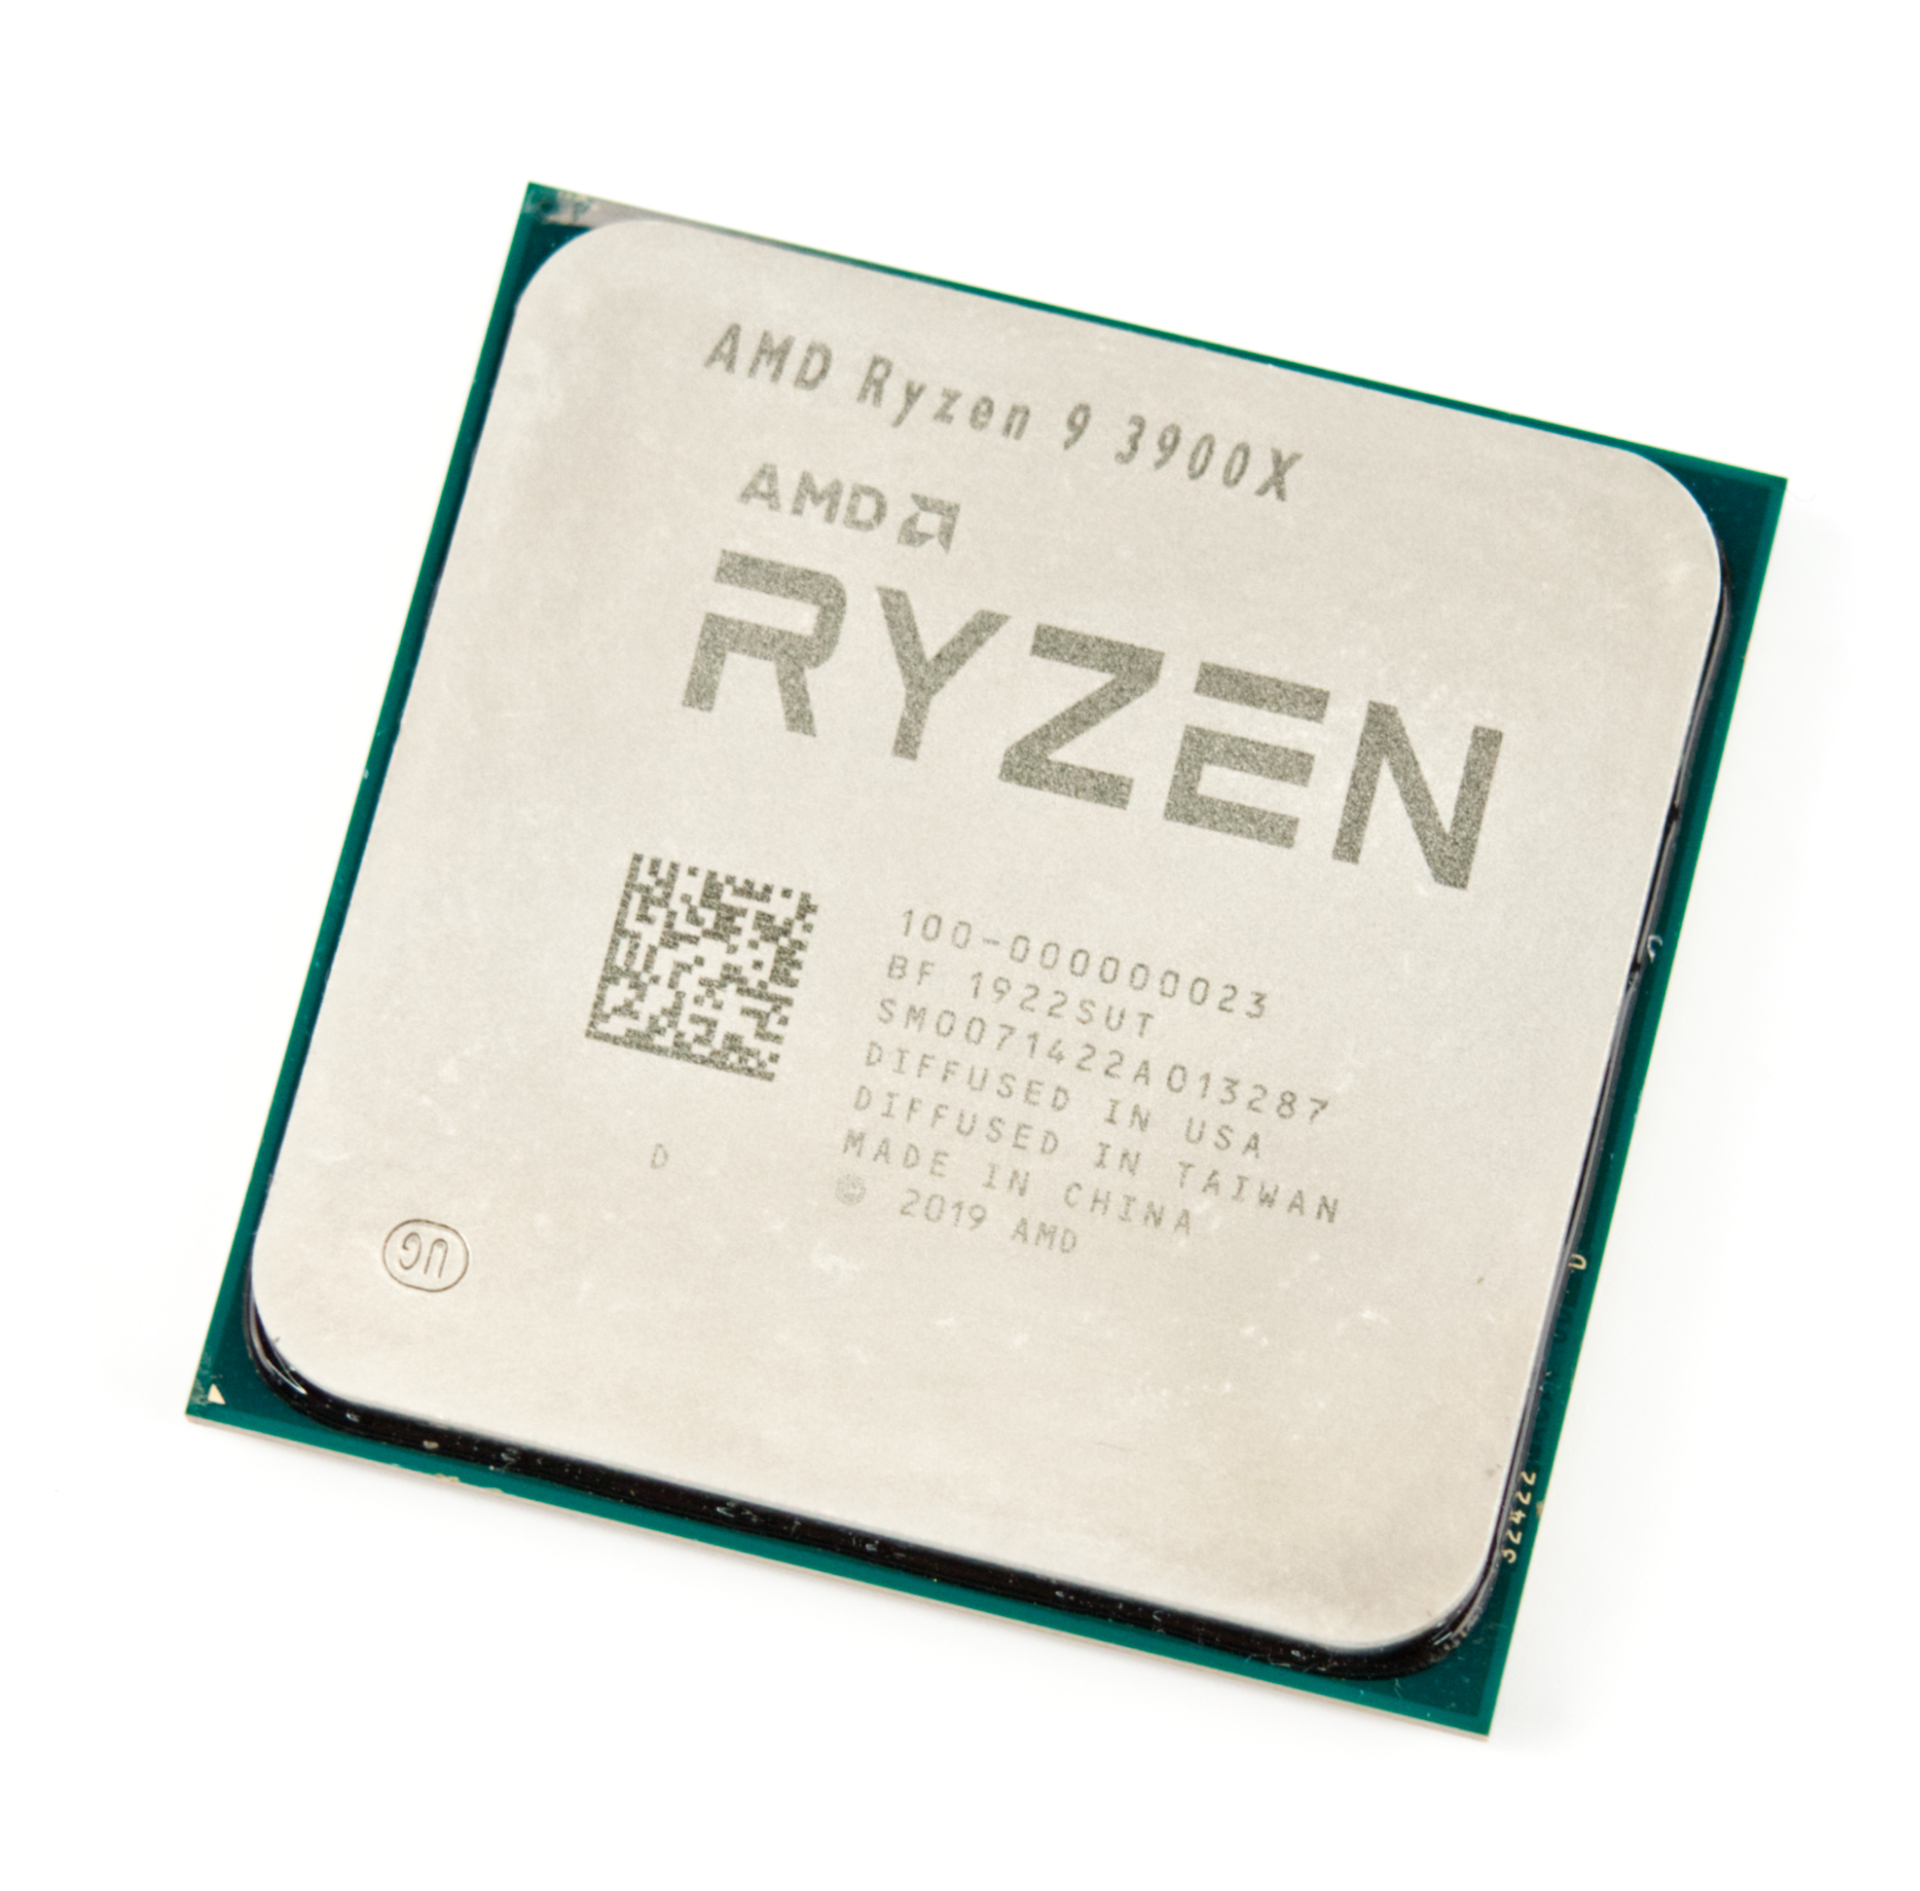
The Ryzen 9 3900 is a fast desktop CPU with 12 cores and 24 threads based on the Matisse series. It is the fastest 65 Watt CPU at launch in late 2019 and clocks the cores between 3.1 (base) to 4.3 (boost) clock (including Precision Boost). It uses 4 CCX-clusters where 3 of the 4 cores are activated. The CPU is manufactured in the modern 7nm process at TSMC. The I/O die on the package is separate and manufactured in 12 nm at Globalfoundries.

Due to the reduced Turbo speed, the Ryzen 9 3900 is aimed at content creators and other professionals that can make use of the 12 cores. For games, a fast 8-core CPU with higher boost clocks is the better choice.

AMD Ryzen 7 3800XT

► remove from comparison AMD R7 3800XT

The AMD Ryzen 7 3800XT is a fast desktop processor with 8 cores (octa core) based on the Zen 2 architecture. At launch it is the fastest 8-core-CPU of the Matisse series. The 3800XT clocks from 3.9 GHz (base) up to 4.7 GHz (Turbo). All eight cores can reach up to 4.2 GHz.

Performance

The average 3800XT in our database is in the same league as the Core i5-12500H, Core i5-13500H, Core i9-10910, Ryzen 7 5700G, Ryzen 7 7735HS, Ryzen 9 6900HS, Ryzen 9 6900HX, as far as multi-thread performance is concerned.

Power consumption

This Ryzen 7 series processor has a default TDP, also known as the long-term power limit, of 105 W. Needless to say, if one was to overclock it, the chip's power consumption would go up by a huge margin.

The R7 3800XT is built with TSMC's 7 nm process making for average, as of mid 2023, energy efficiency.

AMD Ryzen 9 3950X

► remove from comparison AMD R9 3950X

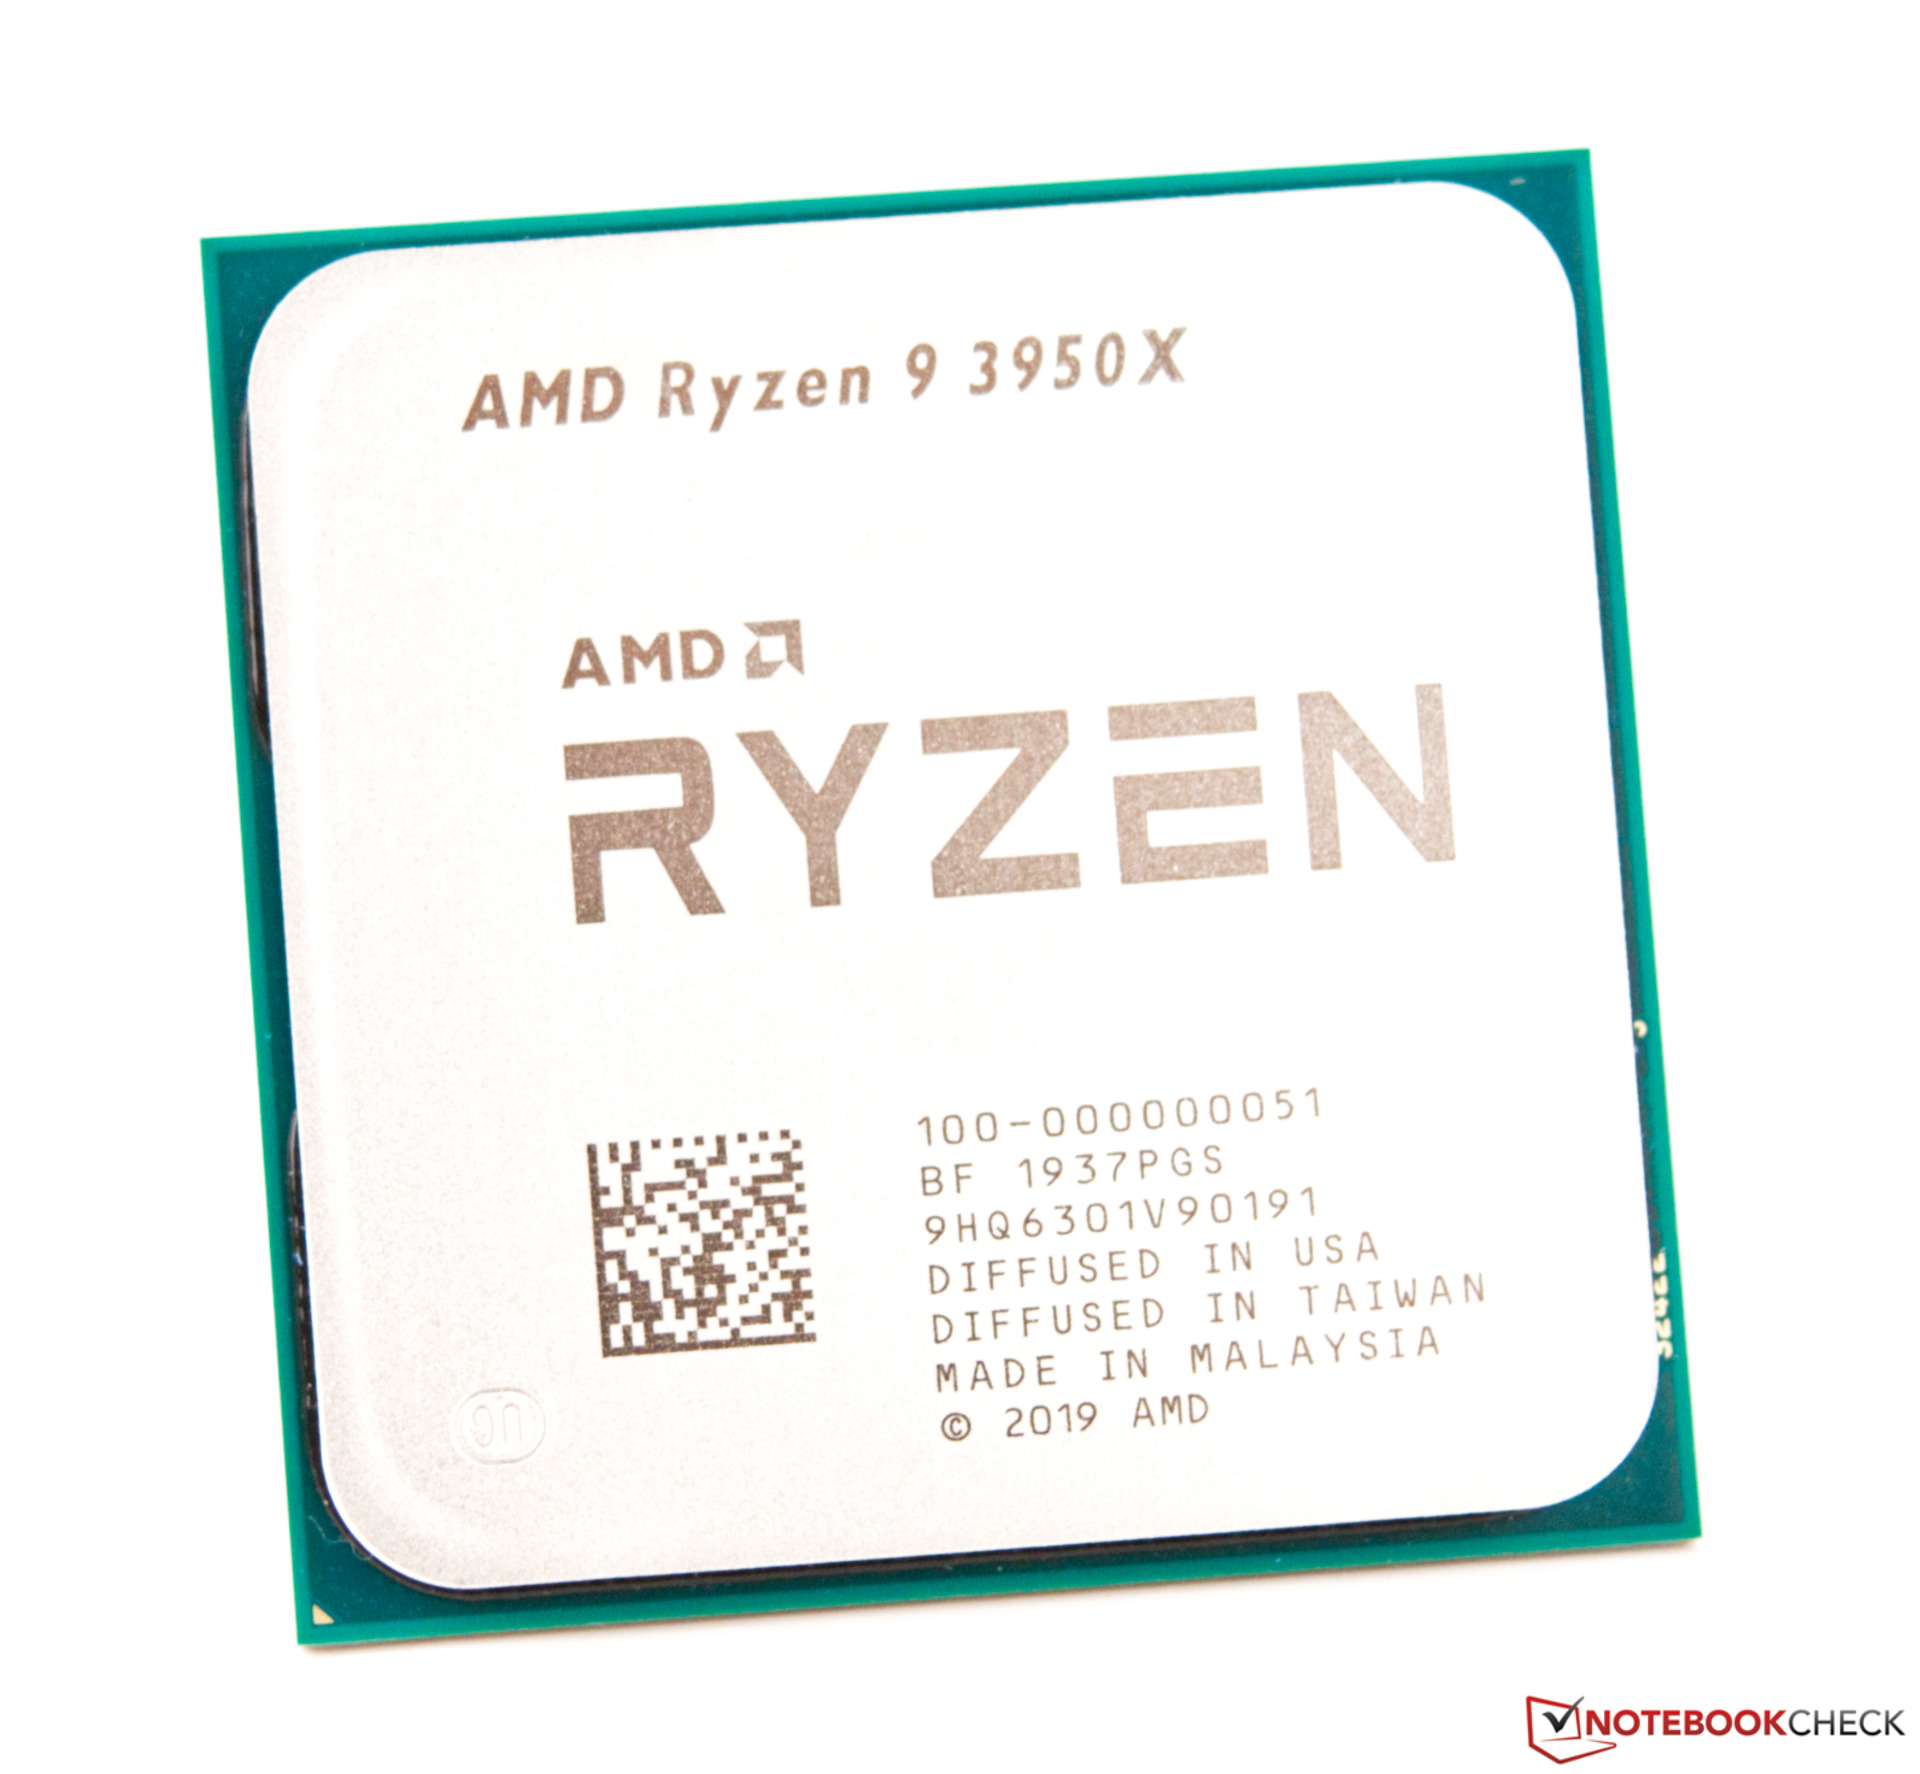
The AMD Ryzen 9 3950X is a high-end desktop processor with 16 cores based on the Zen 2 architecture. At launch in November 2019 it is the fastest CPU of the Matisse series. The 3950X clocks from 3.5 GHz (base) up to 4.7 GHz (Turbo for a single core). All sixteen cores can reach up to 4.1 GHz.

Thanks to the 16 cores and 32 threads, the 3950X offers excellent application performance - if the number of cores can be used. Thanks to the relatively high Turbo, the single core performance is also situated in the high end. For games however, there are faster CPUs, like the Core i9-10900K.

The Ryzen 9 3950X is manufactured in 7nm (the four CCX-cluster with the cores) at TSMC and 12 nm (I/O die) at Globalfoundries. The TDP is rated at 250 Watt and therefore the CPU needs a very powerful cooling system.

ModelAMD Ryzen 9 3900AMD Ryzen 7 3800XTAMD Ryzen 9 3950X
SeriesAMD Matisse (Ryzen 3000 Desktop)AMD Matisse (Ryzen 3000 Desktop)AMD Matisse (Ryzen 3000 Desktop)
CodenameMatisse (Zen 2)Matisse (Zen 2)Matisse (Zen 2)
Series: Matisse (Ryzen 3000 Desktop) Matisse (Zen 2)
AMD Ryzen 9 3950X3.5 - 4.7 GHz16 / 32 cores64 MB L3
AMD Ryzen 9 3900X3.8 - 4.6 GHz12 / 24 cores64 MB L3
AMD Ryzen 9 3900 « 3.1 - 4.3 GHz12 / 24 cores64 MB L3
AMD Ryzen 7 3800XT3.9 - 4.7 GHz8 / 16 cores32 MB L3
AMD Ryzen 7 3700X3.6 - 4.4 GHz8 / 16 cores32 MB L3
AMD Ryzen 3 3300X3.8 - 4.3 GHz4 / 8 cores16 MB L3
AMD Ryzen 3 31003.6 - 3.9 GHz4 / 8 cores16 MB L3
AMD Ryzen 9 3950X3.5 - 4.7 GHz16 / 32 cores64 MB L3
AMD Ryzen 9 3900X3.8 - 4.6 GHz12 / 24 cores64 MB L3
AMD Ryzen 9 39003.1 - 4.3 GHz12 / 24 cores64 MB L3
AMD Ryzen 7 3800XT « 3.9 - 4.7 GHz8 / 16 cores32 MB L3
AMD Ryzen 7 3700X3.6 - 4.4 GHz8 / 16 cores32 MB L3
AMD Ryzen 3 3300X3.8 - 4.3 GHz4 / 8 cores16 MB L3
AMD Ryzen 3 31003.6 - 3.9 GHz4 / 8 cores16 MB L3
AMD Ryzen 9 3950X « 3.5 - 4.7 GHz16 / 32 cores64 MB L3
AMD Ryzen 9 3900X3.8 - 4.6 GHz12 / 24 cores64 MB L3
AMD Ryzen 9 39003.1 - 4.3 GHz12 / 24 cores64 MB L3
AMD Ryzen 7 3800XT3.9 - 4.7 GHz8 / 16 cores32 MB L3
AMD Ryzen 7 3700X3.6 - 4.4 GHz8 / 16 cores32 MB L3
AMD Ryzen 3 3300X3.8 - 4.3 GHz4 / 8 cores16 MB L3
AMD Ryzen 3 31003.6 - 3.9 GHz4 / 8 cores16 MB L3
Clock3100 - 4300 MHz3900 - 4700 MHz3500 - 4700 MHz
L1 Cache768 KB512 KB1 MB
L2 Cache6 MB4 MB8 MB
L3 Cache64 MB32 MB64 MB
Cores / Threads12 / 248 / 1616 / 32
TDP65 Watt105 Watt105 Watt
Technology7 nm7 nm7 nm
SocketAM4 (1331)AM4 (LGA1331)AM4 (1331)
FeaturesMMX(+), SSE, SSE2, SSE3, SSSE3, SSE4.1, SSE4.2, SSE4A, x86-64, AMD-V, AES, AVX, AVX2, FMA3, SHA, Precision Boost 2DDR4-3200 RAM, PCIe 4, MMX, SSE, SSE2, SSE3, SSSE3, SSE4A, SSE4.1, SSE4.2, AVX, AVX2, BMI2, ABM, FMA, ADX, SMEP, SMAP, SMT, CPB, AES-NI, RDRAND, RDSEED, SHA, SMEMMX(+), SSE, SSE2, SSE3, SSSE3, SSE4.1, SSE4.2, SSE4A, x86-64, AMD-V, AES, AVX, AVX2, FMA3, SHA, Precision Boost 2
Architecturex86x86x86
Announced
max. Temp.95 °C
$399 U.S.$799 U.S.
Manufacturerwww.amd.com
Die Size2 x 72 mm + 125 mm (IO-Die) mm2

Benchmarks

Performance Rating - CB R15 + R20 + 7-Zip + X265 + Blender + 3DM11 CPU - R9 3900
39 pt (54%)
Performance Rating - CB R15 + R20 + 7-Zip + X265 + Blender + 3DM11 CPU - R7 3800XT
39.1 pt (54%)
Performance Rating - CB R15 + R20 + 7-Zip + X265 + Blender + 3DM11 CPU - R9 3950X
43.2 pt (60%)
Cinebench R20 - Cinebench R20 CPU (Single Core)
490 Points (54%)
544 Points (60%)
520 Points (58%)
Cinebench R20 - Cinebench R20 CPU (Multi Core)
6321 Points (15%)
5120 Points (12%)
9075 Points (22%)
Cinebench R15 - Cinebench R15 CPU Multi 64 Bit
2804 Points (18%)
2230 Points (14%)
4002 Points (25%)
Cinebench R15 - Cinebench R15 CPU Single 64 Bit
197 Points (59%)
219 Points (66%)
209 Points (63%)
Cinebench R11.5 - Cinebench R11.5 CPU Multi 64 Bit
31 Points (40%)
24.2 Points (31%)
43.7 Points (57%)
Cinebench R11.5 - Cinebench R11.5 CPU Single 64 Bit
2.2 Points (55%)
2.4 Points (59%)
2.4 Points (59%)
Cinebench R10 - Cinebench R10 Rend. Single (32bit)
5700 Points (34%)
6035 Points (36%)
6102 Points (37%)
Cinebench R10 - Cinebench R10 Rend. Multi (32bit)
44191 Points (32%)
40528 Points (29%)
53396 Points (39%)
Cinebench R10 - Cinebench R10 Rend. Multi (64bit)
68388 Points (47%)
86232 Points (60%)
Cinebench R10 - Cinebench R10 Rend. Single (64bit)
10497 Points (13%)
10580 Points (13%)
wPrime 2.10 - wPrime 2.0 1024m *
81.4 s (1%)
44.9 s (1%)
wPrime 2.10 - wPrime 2.0 32m *
3.7 s (1%)
4.1 s (1%)
WinRAR - WinRAR 4.0
7145 Points (11%)
7467 Points (12%)
7409 Points (12%)
7-Zip 18.03 - 7-Zip 18.03 Multli Thread 4 runs
75612 MIPS (43%)
59247 MIPS (34%)
99467 MIPS (57%)
7-Zip 18.03 - 7-Zip 18.03 Single Thread 4 runs
5134 MIPS (61%)
5516 MIPS (66%)
5340 MIPS (64%)
X264 HD Benchmark 4.0 - x264 Pass 2
131.9 fps (46%)
119 fps (42%)
168 fps (59%)
X264 HD Benchmark 4.0 - x264 Pass 1
255.5 fps (59%)
271 fps (63%)
265 fps (61%)
HWBOT x265 Benchmark v2.2 - HWBOT x265 4k Preset
18.9 fps (33%)
16.1 fps (28%)
15.8 fps (28%)
TrueCrypt - TrueCrypt Serpent
1.6 GB/s (0%)
1.2 GB/s (0%)
2.3 GB/s (0%)
TrueCrypt - TrueCrypt Twofish
2.4 GB/s (41%)
2 GB/s (34%)
3.6 GB/s (62%)
TrueCrypt - TrueCrypt AES
10.4 GB/s (27%)
11.4 GB/s (30%)
10.8 GB/s (28%)
Blender - Blender 2.79 BMW27 CPU *
179 Seconds (1%)
222.7 Seconds (2%)
125.8 Seconds (1%)
R Benchmark 2.5 - R Benchmark 2.5 *
0.5 sec (12%)
0.5 sec (11%)
0.5 sec (11%)
3DMark 06 - CPU - 3DMark 06 - CPU
100%
1 R9 3900 +
13817 Points (29%)
Super Pi mod 1.5 XS 1M - Super Pi mod 1.5 XS 1M *
9.6 s (2%)
9.1 s (2%)
9.2 s (2%)
Super Pi mod 1.5 XS 2M - Super Pi mod 1.5 XS 2M *
20.9 s (1%)
19.6 s (1%)
19.8 s (1%)
Super Pi Mod 1.5 XS 32M - Super Pi mod 1.5 XS 32M *
547 s (2%)
508 s (2%)
512 s (2%)
3DMark 11 - 3DM11 Performance Physics
16803 Points (45%)
18905 Points (51%)
21016 Points (57%)
3DMark - 3DMark Ice Storm Physics
82027 Points (67%)
68726 Points (56%)
3DMark - 3DMark Ice Storm Extreme Physics
82302 Points (67%)
68471 Points (56%)
3DMark - 3DMark Ice Storm Unlimited Physics
84207 Points (71%)
69542 Points (59%)
3DMark - 3DMark Cloud Gate Physics
16410 Points (42%)
14253 Points (36%)
17927 Points (45%)
3DMark - 3DMark Fire Strike Standard Physics
26216 Points (47%)
25132 Points (45%)
32004 Points (57%)
3DMark - 3DMark Time Spy CPU
10725 Points (45%)
10302 Points (43%)
12404 Points (52%)
Geekbench 5.5 - Geekbench 5.1 - 5.4 64 Bit Single-Core
1246 Points (53%)
1353 Points (57%)
1306 Points (55%)
Geekbench 5.5 - Geekbench 5.1 - 5.4 64 Bit Multi-Core
10190 Points (18%)
8948 Points (16%)
12363 Points (22%)
Geekbench 5.0 - Geekbench 5.0 64 Bit Single-Core
1258 Points (5%)
1360 Points (6%)
1315 Points (6%)
Geekbench 5.0 - Geekbench 5.0 64 Bit Multi-Core
10695 Points (34%)
9163 Points (29%)
12976 Points (41%)
Geekbench 4.4 - Geekbench 4.1 - 4.4 64 Bit Single-Core
5449 Points (54%)
5830 Points (58%)
5749 Points (57%)
Geekbench 4.4 - Geekbench 4.1 - 4.4 64 Bit Multi-Core
40720 Points (45%)
35526 Points (40%)
48962 Points (55%)
Geekbench 4.0 - Geekbench 4.0 64 Bit Single-Core
100%
1 R9 3900 +
5482 Points (75%)
Geekbench 4.0 - Geekbench 4.0 64 Bit Multi-Core
100%
1 R9 3900 +
41058 Points (100%)
Mozilla Kraken 1.1 - Kraken 1.1 Total Score *
746 ms (1%)
683 ms (1%)
706 ms (1%)
WebXPRT 3 - WebXPRT 3 Score
227 Points (47%)
249 Points (52%)
239 Points (50%)
Power Consumption - Prime95 Power Consumption - external Monitor *
191.8 Watt (33%)
198.8 Watt (34%)
Power Consumption - Cinebench R15 Multi Power Consumption - external Monitor *
193.7 Watt (35%)
219.5 Watt (40%)
Power Consumption - Cinebench R15 Multi Power Efficiency - external Monitor
11.5 Points per Watt (9%)
18.2 Points per Watt (14%)

Average Benchmarks AMD Ryzen 9 3900 → 100% n=34

Average Benchmarks AMD Ryzen 7 3800XT → 97% n=34

Average Benchmarks AMD Ryzen 9 3950X → 114% n=34

- Range of benchmark values for this graphics card
- Average benchmark values for this graphics card
* Smaller numbers mean a higher performance
1 This benchmark is not used for the average calculation

v1.26
log 24. 15:45:51

#0 checking url part for id 12174 +0s ... 0s

#1 checking url part for id 12265 +0s ... 0s

#2 checking url part for id 12204 +0s ... 0s

#3 not redirecting to Ajax server +0s ... 0s

#4 did not recreate cache, as it is less than 5 days old! Created at Tue, 23 Apr 2024 05:40:15 +0200 +0.001s ... 0.001s

#5 composed specs +0.034s ... 0.035s

#6 did output specs +0s ... 0.035s

#7 getting avg benchmarks for device 12174 +0.02s ... 0.055s

#8 got single benchmarks 12174 +0.01s ... 0.065s

#9 getting avg benchmarks for device 12265 +0.013s ... 0.078s

#10 got single benchmarks 12265 +0.009s ... 0.087s

#11 getting avg benchmarks for device 12204 +0.018s ... 0.105s

#12 got single benchmarks 12204 +0.009s ... 0.114s

#13 got avg benchmarks for devices +0s ... 0.114s

#14 min, max, avg, median took s +0.405s ... 0.519s

#15 return log +0s ... 0.519s

Please share our article, every link counts!
> Expert Reviews and News on Laptops, Smartphones and Tech Innovations > Benchmarks / Tech > Processor Comparison - Head 2 Head
Redaktion, 2017-09- 8 (Update: 2023-07- 1)