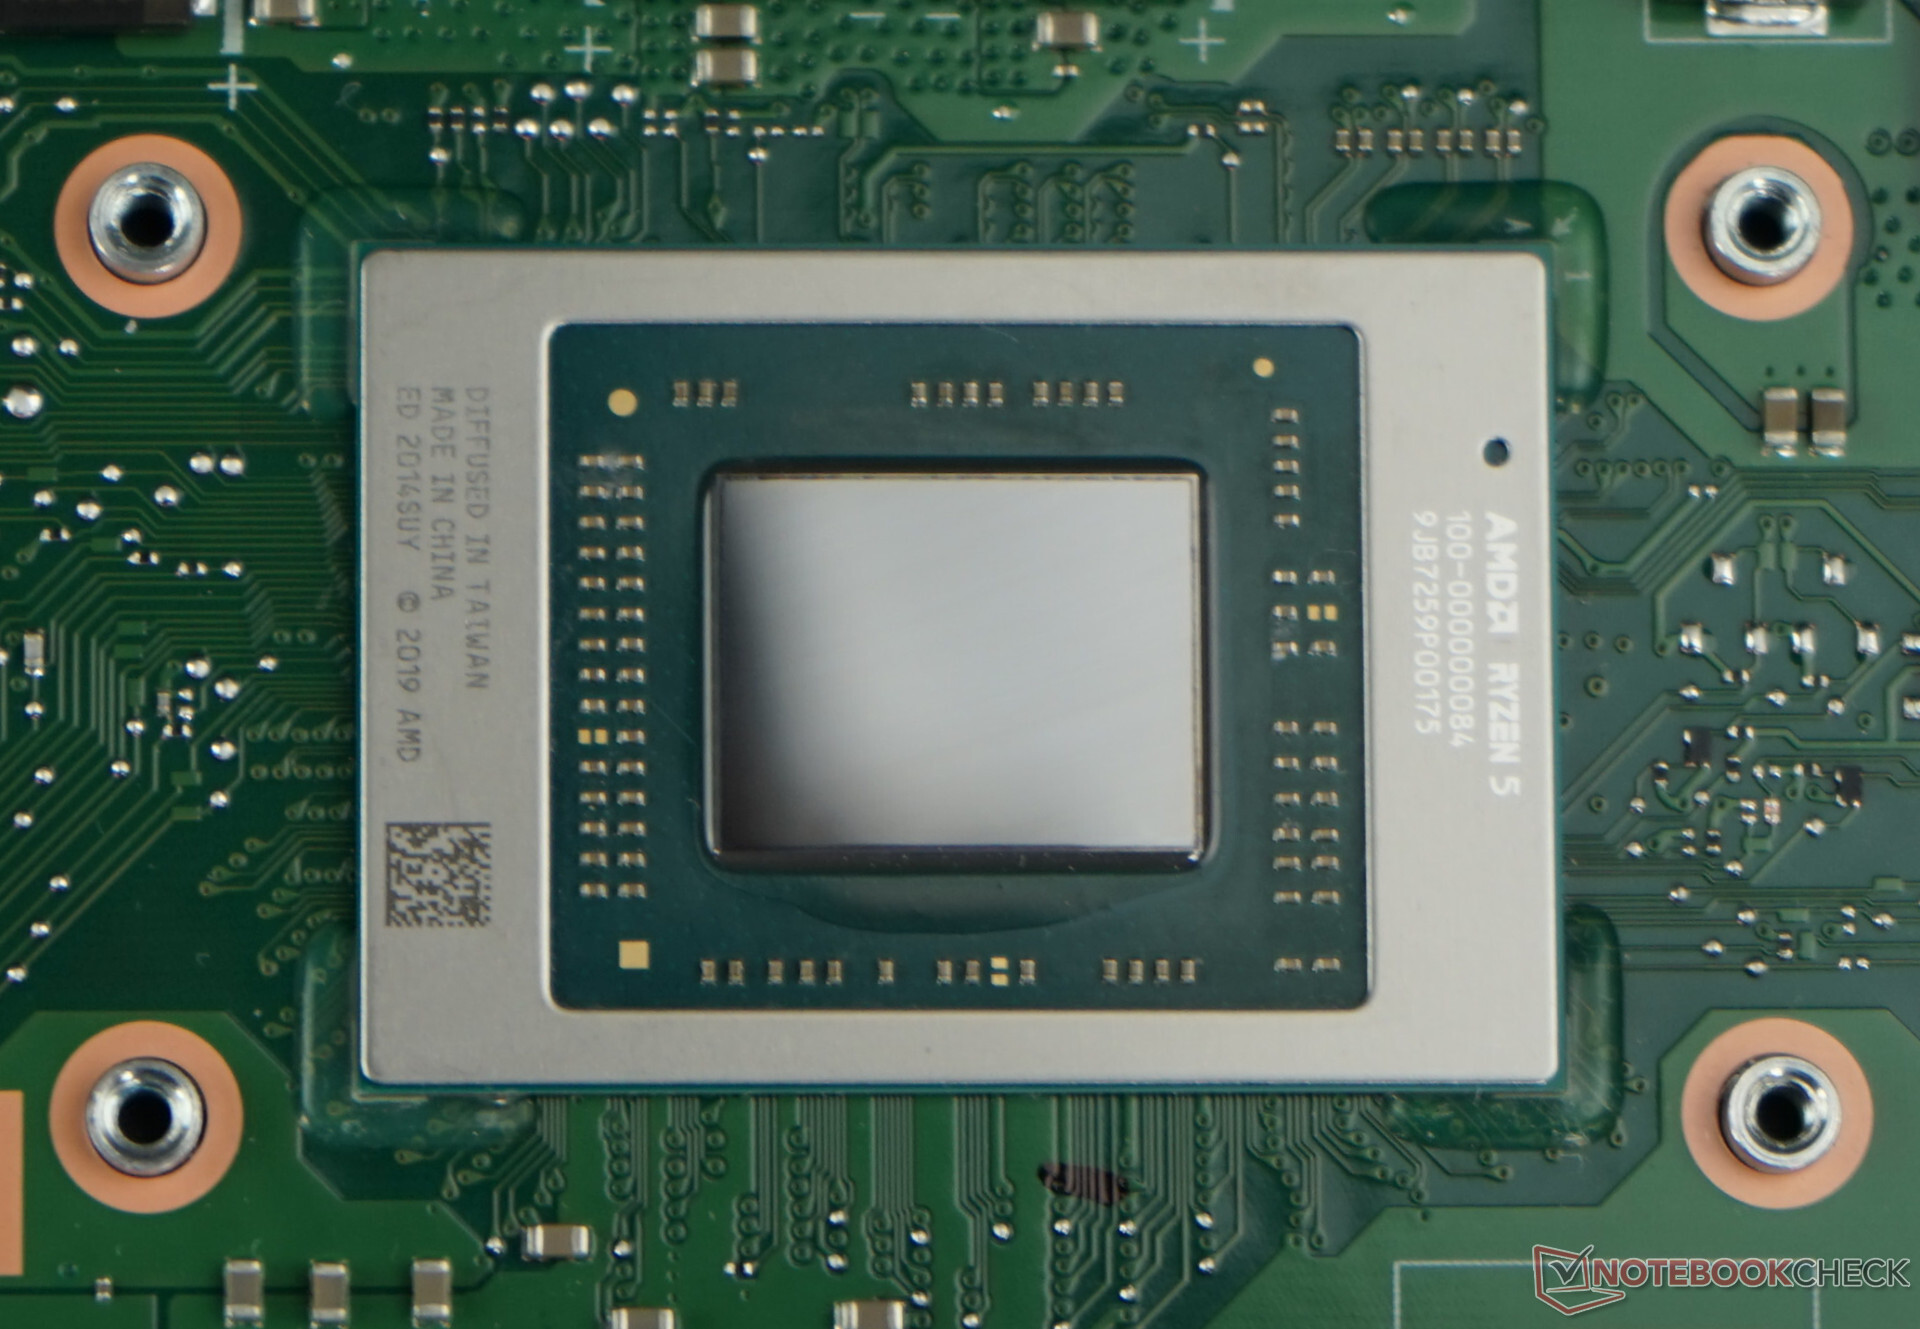
The AMD Ryzen 5 4500U is an upper mid-range, hexa-core processor of the Renoir product family. The APU was unveiled in H1 2020; it is designed for use in thinner, lighter laptops. Its six Zen 2 CPU cores run at 2.3 GHz (base clock speed) to 4.0 GHz (highest Boost frequency possible). Ryzen 5 4500U features the Vega 6 iGPU.
The sole advantage of Ryzen 5 4600U over Ryzen 5 4500U is the thread-doubling SMT technology support. The former has SMT while the latter does not.
Architecture
Zen 2 is a resounding success, delivering massive improvements over outgoing Zen Plus-based processors. Ryzen 5 4500U is manufactured on the cutting-edge 7 nm TSMC process; it is compatible with dual-channel DDR4-3200 or quad-channel LPDDR4-4266 memory. This processor has 8 MB of Level 3 cache.
While the APU uses Zen 2 cores just like the desktop-grade Ryzen 3000-series processors do, Ryzen 7 3800XT included, it does does not have PCI-Express 4.0 support. It does feature several PCI-Express 3.0 lanes for connecting discrete graphics cards, SSDs and other devices. Four PCI-Express 3.0 lanes allow for read/write rates of up to 3.9 GB/s provided a suitably fast NVMe SSD is used.
Ryzen 5 4500U gets soldered permanently on to the motherboard (FP6 socket interface) and is anything but user-replaceable.
Performance
The average Ryzen 5 4500U in our database nearly matches the Core i5-11300H, the Core i5-11320H and also the AMD Ryzen 3 5300U as far as multi-thread benchmark scores are concerned - thus delivering an undeniably impressive performance jump over the outgoing Ryzen 5 3500U.
Thanks to its decent cooling solution and a long-term power limit of 38 W, the Xiaomi RedmiBook 16 R5 is among the fastest systems powered by the R5 4500U that we know of. It can be about 20% faster in CPU-bound workloads than the slowest system built around the same chip in our database, as of August 2023.
Graphics
Just like its name suggests, the Radeon RX Vega 6 graphics adapter has 6 Compute Units (6 x 64 = 384 unified shaders). In the case of Ryzen 5 4500U, this graphics adapter runs at up to 1,500 MHz. The iGPU definitely supports UHD 2160p monitors at 60 Hz; it will have no trouble HW-decoding HEVC, AVC, VP9, MPEG-2 and other widespread video codecs. AV1 is not supported though; such a video will have to be software-decoded for much lower energy efficiency.
Vega 6 will let you play many titles of 2020 and 2021 as long as you stick to low settings and low resolutions. F1 2021 (720p, Low) runs at 32 fps; Outriders (720p, Low) runs at 27 fps, to give you an example or two. As the iGPU has no VRAM of its own, it is paramount that fast system RAM is used.
Power consumption
This Ryzen chip is very energy efficient, as of mid 2022, thanks to the cutting-edge 7 nm TSMC manufacturing process and the mature Zen 2 architecture.
The Ryzen 5 4500U has a default TDP (also known as the long-term Power Limit) of 15 W that can be changed to anything between 10 W and 25 W by laptop makers if required, a right they use more often than not. Clock speeds and performance will change accordingly as a result. By going for the lowest value, it will be possible to use the APU as the heart of a passively cooled tablet, laptop, mini-PC.
The Intel Core i3-1005G1 is a low-power, Ice Lake family processor (SoC) featuring 2 cores, 4 threads, 4 MB of L3 cache and the UHD G1 (32 EUs) iGPU. It saw the light of day in 2019. The chip is designed for use in highly portable laptops of the more affordable flavour; the CPU cores run at 1.2 GHz to 3.4 GHz which is not a lot.
Architecture & Features
Ice Lake family chips are powered by Sunny Cove CPU cores.The latter aim to do what Palm Cove cores (that we never really got a chance to get a taste of) were expected to do, delivering a double-digit IPC uplift over the venerable Skylake architecture thanks to a range of small improvements across the board including scheduler improvements, larger caches and buffers, and support for new instruction sets.
Thunderbolt 3 support is built right into the Core i3 (meaning it has several PCIe 3 lanes exclusive to Thunderbolt devices, reducing the number of additional components required for Thunderbolt to work) and so is Intel CNVi Wi-Fi 6 support (making it easier for Intel to sell its proprietary WLAN cards to laptop makers). The Core i3-1005G1 also has the DL Boost and GNA features for applications centered around machine learning.
The 4 GT/s bus is indicative of a consumer-grade chip, since CPUs for gaming laptops and portable workstations usually employ the faster 8 GT/s bus. RAM support is nothing to sneeze at, at up to DDR4-3200 or LPDDR4-3733. NVMe SSDs are supported, with data transfer rates limited to 3.9 GB/s (this is what four PCIe 3 lanes are good for). SATA drives and even eMMC chips are also natively supported here.
This is not a user-replaceable CPU, as it gets permanently soldered to the motherboard (BGA1526 socket interface).
OS support is limited to 64-bit Windows 10 and 64-bit Windows 11, as well as many Linux distros.
Performance
The average 1005G1 in our database is a disappointment, its multi-thread benchmark scores only matching those of Intel's Core i5-7267U and AMD's Ryzen 3 2300U. This is unfortunately in line with what we've been seeing from other Ice Lake family processors; they tend to be held back by their comparatively low clock speeds. While not as slow as many Celerons and Pentiums, this Core i3 will still look out of place in anything but the most affordable laptops and mini-PCs.
With its long-term CPU power limit of 25 W, the Lenovo V17-IIL 82GX008TGE is among the fastest laptops built around this Core i3 that we know of.
Graphics
The Core i3-1005G1 features the UHD Graphics G1 (32 EUs) graphics adapter running at up to 900 MHz. This DX12-compatible iGPU is not much faster than the dated UHD 620 graphics solution, making it almost useless to gamers, and there are no cutting-edge features such as ray tracing support to be found here, either. The list of supported resolutions tops out at 5120 x 3200, and there is no hardware AV1 codec support meaning such a video will be SW-decoded with rather low energy efficiency. The usual HEVC, AVC and VP9 options are supported, thankfully.
The G1 will drive up to 3 monitors simultaneously, provided the system has the outputs required. Higher-end Ice Lake chips are equipped with the G4 (48 EUs) or the G7 (64 EUs) adapters that are significantly faster.
Power consumption
The Core i3 has a 15 W default TDP (also known as the long-term power limit), a value that laptop makers are allowed to reduce slightly - 13 W being the lower limit - resulting in lower clock speeds and lower performance. Either way, that's a tad too high to allow for passively cooled designs.
The SoC is built with Intel's second-gen 10 nm process (not "10 nm SuperFin" or "Intel 7") for average, as of late 2022, energy efficiency.
- Range of benchmark values for this graphics card - Average benchmark values for this graphics card * Smaller numbers mean a higher performance 1 This benchmark is not used for the average calculation
v1.26
log 19. 12:45:30
#0 checking url part for id 11687 +0s ... 0s
#1 checking url part for id 11413 +0s ... 0s
#2 not redirecting to Ajax server +0s ... 0s
#3 did not recreate cache, as it is less than 5 days old! Created at Fri, 19 Apr 2024 05:38:49 +0200 +0.001s ... 0.001s
#4 composed specs +0.054s ... 0.055s
#5 did output specs +0s ... 0.055s
#6 getting avg benchmarks for device 11687 +0.018s ... 0.073s
#7 got single benchmarks 11687 +0.069s ... 0.142s
#8 getting avg benchmarks for device 11413 +0.017s ... 0.16s
#9 got single benchmarks 11413 +0.053s ... 0.212s
#10 got avg benchmarks for devices +0s ... 0.212s
#11 min, max, avg, median took s +0.424s ... 0.637s
 Deutsch
 English
 Español
 Français
 Italiano
 Nederlands
 Polski
 Português
 Русский
 Türkçe
 Svenska
 Chinese
 Magyar