Notebookcheck Logo

AMD Ryzen 5 2600X vs AMD Ryzen 5 3580U vs AMD Ryzen 5 2600

AMD Ryzen 5 2600X

► remove from comparison AMD R5 2600X

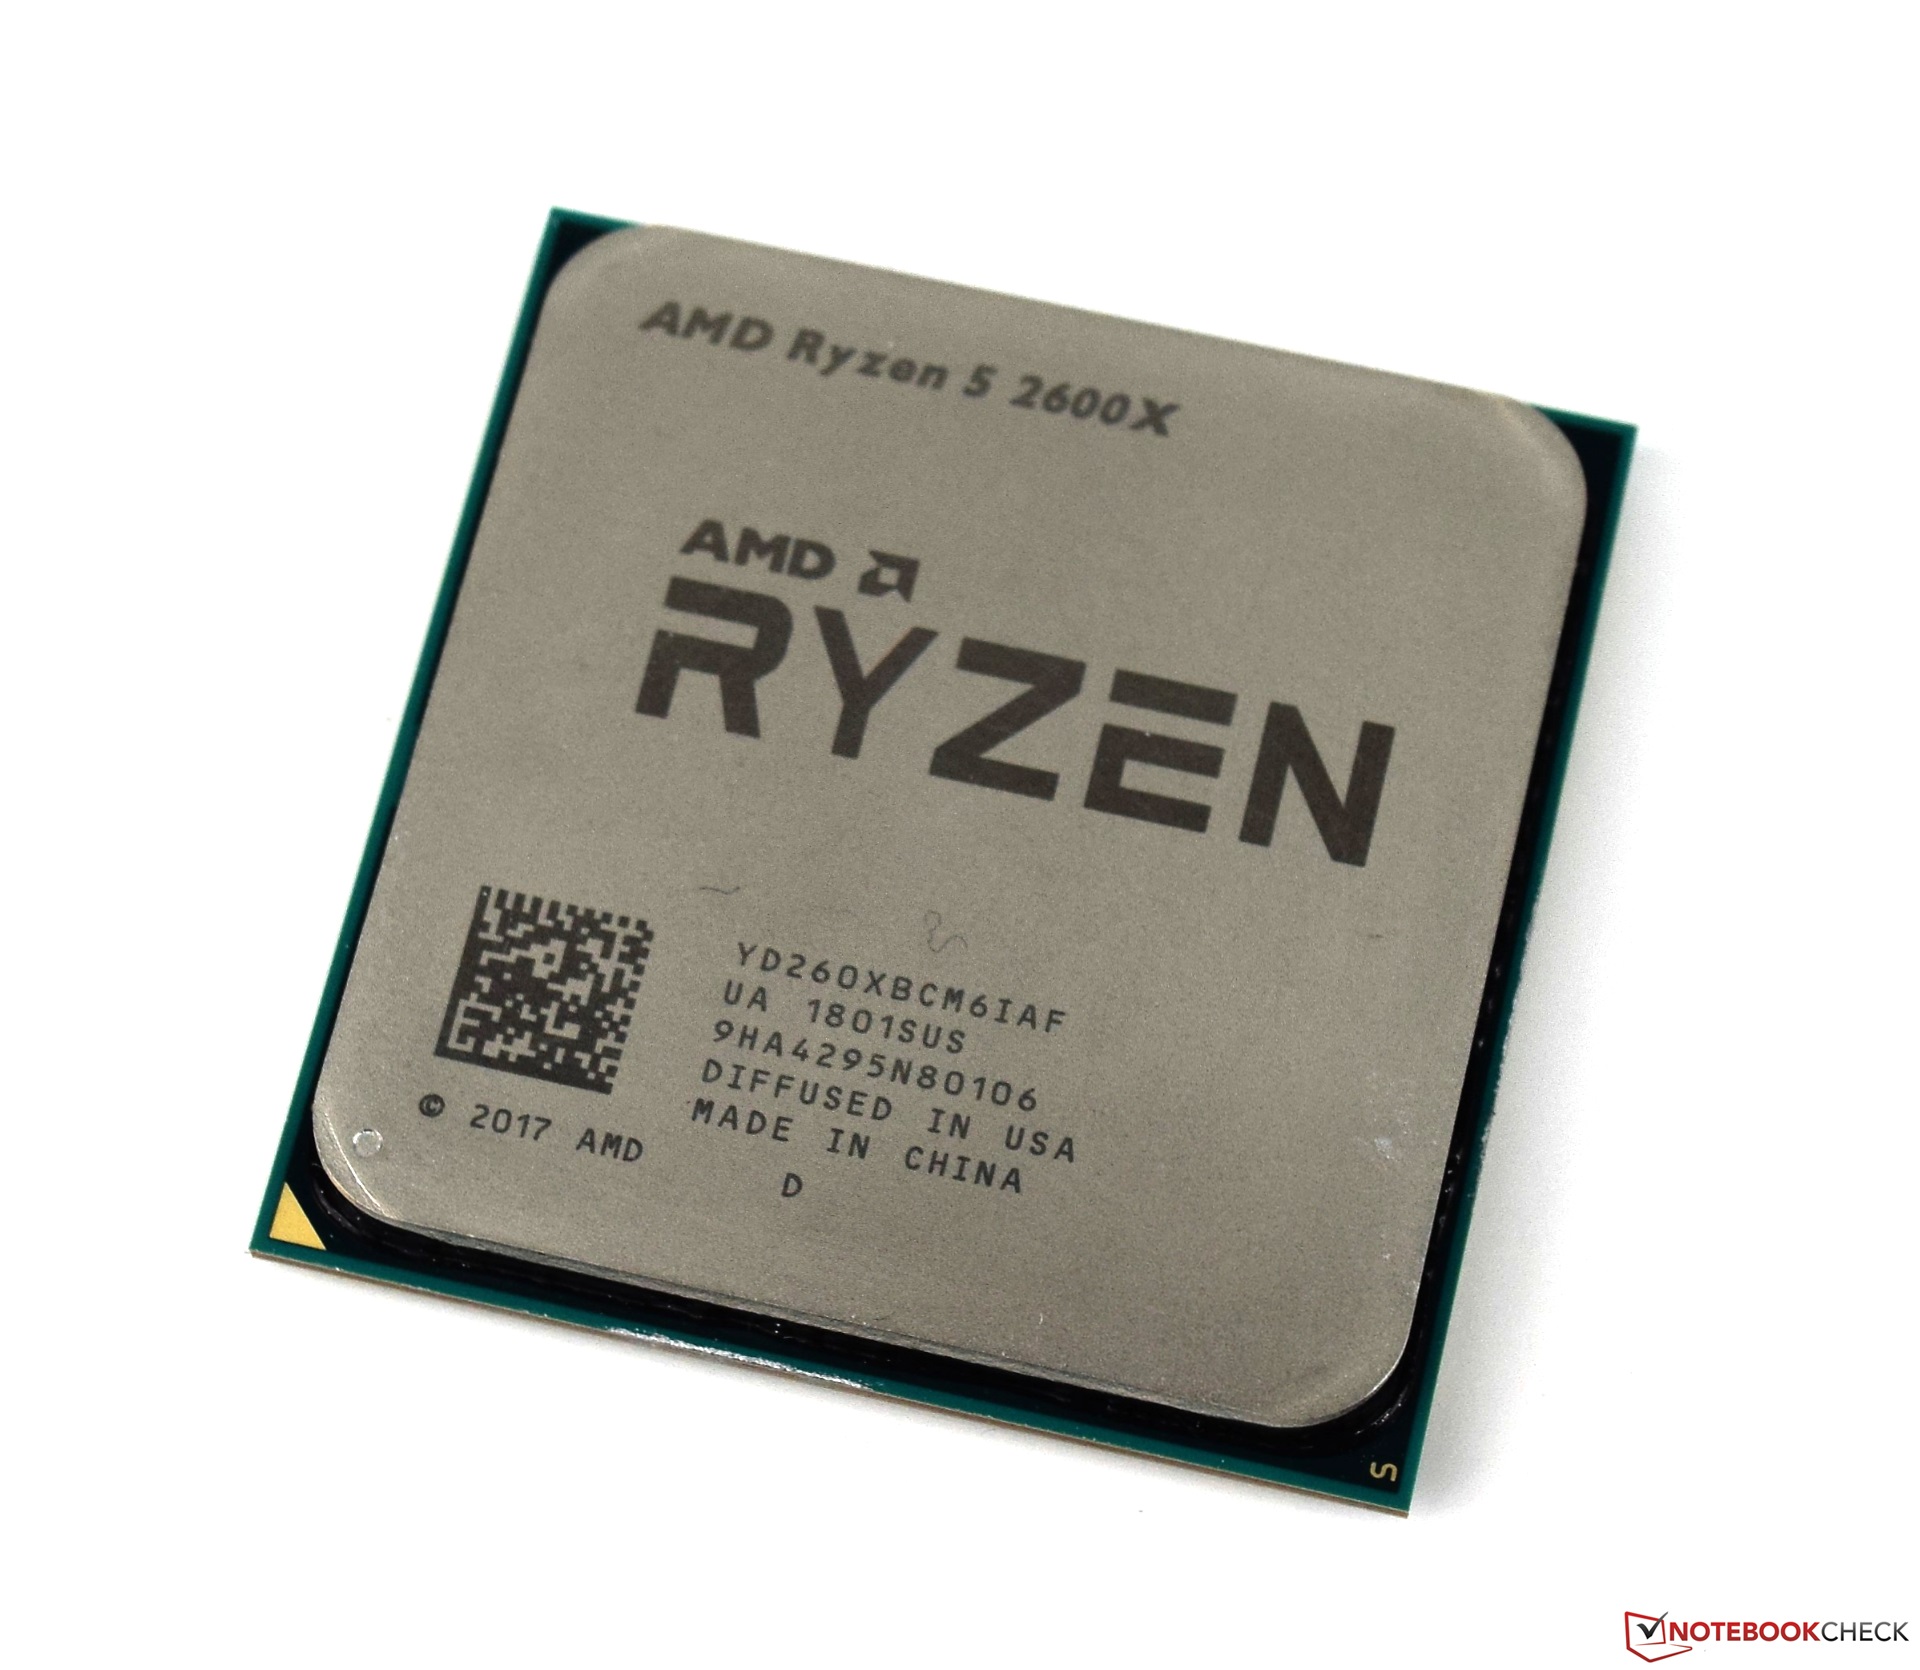
The AMD Ryzen 5 2600X is a high-end desktop processor with 6 cores (12 threads) that was announced early 2018. It is based on the revised Zen+ cores and at launch the second fastest Ryzen CPU behind the Ryzen 7 2700X. The CPU cores clock at 3.6 GHz base and using Precision Boost 2 up to 4.2 GHz. All 6 cores and 12 threads can clock up to 3.9 GHz. The 6 cores are divided in two cluster (3 cores each with own L3 cache) connected via Infinity Fabric.

Compared to the older first Ryzen generation (e.g., Ryzen 5 1600X), the second generation is manufactured in an improved process (12nm called), offers and improved Precision Boost 2 (especially in partial load of the cores) and faster cache and memory speeds.

See our second generation Ryzen review for detailed benchmarks and information.

AMD Ryzen 5 3580U

► remove from comparison AMD R5 3580U

The AMD Ryzen 5 3580U, a Microsoft Surface Edition chip, is a mobile SoC that was announced in October 2019 as part of the Surface Book 15. It combines four Zen+ cores (8 threads) clocked at 2.2 - 3.8 GHz with a Radeon RX Vega 9 graphics adapter with 9 CUs (576 Shaders) clocked at up to 1300 MHz. Compared to the similar Ryzen 5 3500U, the 3580 integrates a faster GPU with 9 instead of 8 CUs.

The Picasso SoCs use the Zen+ microarchitecture with slight improvements that should lead to a 3% IPS (performance per clock) improvements. Furthermore, the 12nm process allows higher clock rates at similar power consumptions.

The integrated dual-channel memory controller supports up to DDR4-2400 memory. As the features of the Picasso APUs are the same compared to the Raven Ridge predecessors, we point to our Raven Ridge launch article.

Performance

The average 3580U in our extensive database is in the same league as the Core i5-1035G7 and also the Core i7-10510U, as far as multi-thread benchmark scores are concerned. This is a fairly decent result, as of mid 2021.

Power consumption

This Ryzen 5 has a default TDP (also known as the long-term power limit) of 15 W, a value that laptop manufacturers - or should we say, Microsoft - are allowed to change to anything between 12 W and 35 W with clock speeds and performance changing correspondingly. Those values are not low enough to allow for fan-free designs, for better or worse.

The CPU is built with a fairly old, as of late 2022, 12 nm process for lower-than-average energy efficiency.

AMD Ryzen 5 2600

► remove from comparison AMD R5 2600

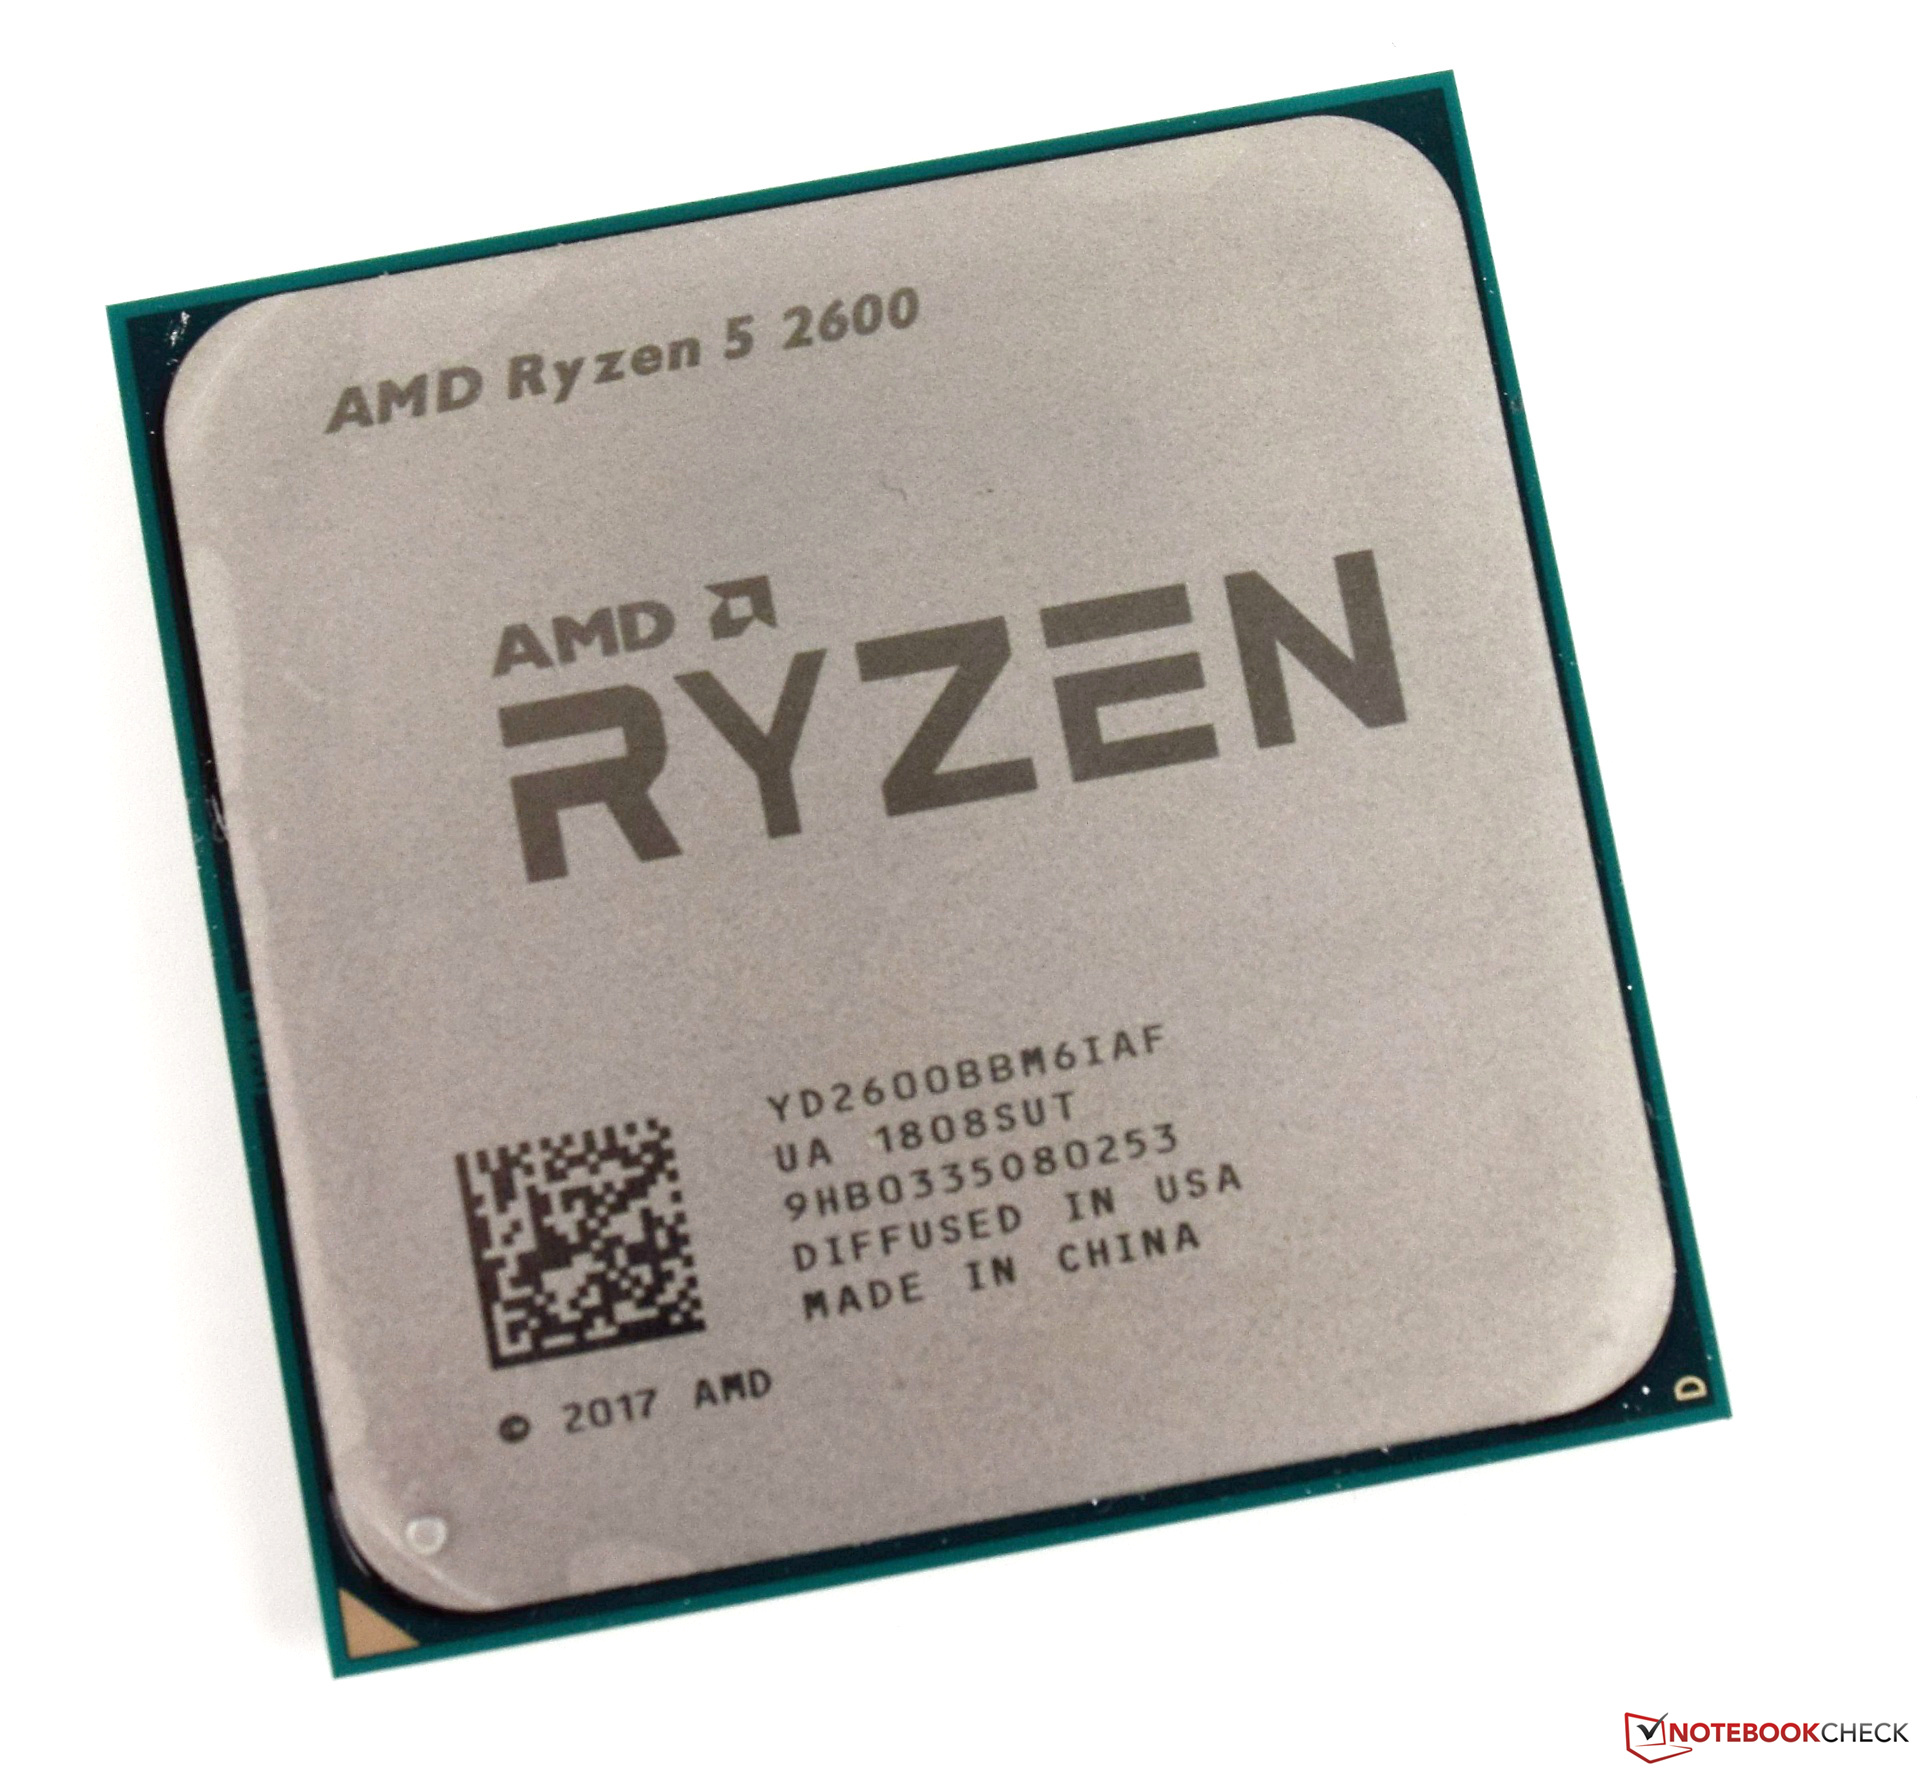
The AMD Ryzen 5 2600 is a six-core desktop processor that can handle twelve threads simultaneously thanks to Simultaneous Multithreading (SMT). This technology is equivalent to Intel's Hyper-Threading. Launched in April 2018, the Ryzen 5 2600 is the second fastest Ryzen 5 processor and is much more economical than its flagship sibling. The Ryzen 5 2600 has a 65 W TDP, which is nearly 40% more efficient than the 95 W TDP Ryzen 5 2600 X. This energy efficiency comes at a cost to performance though.

The Ryzen 5 2600 has a base clock speed of 3.4 GHz, which can be boosted by Extended Frequency Range (XFR) up to 3.9 GHz. The power gain is still high in multi-threaded applications, although this is some way off the Ryzen 5 2600X. The Ryzen 5 2600 benefits from AMD's new Zen+ architecture, with a greater number of instructions per cycle (IPC) and higher clock speeds than last year's Zen chips. The Ryzen 5 2600's six cores are divided into two clusters that are connected by Infinity Fabric, a subset of HyperTransport. Each cluster has its own L3 cache.

The Ryzen 5 2600 has good performance in games. Moreover, the Ryzen 5 2600 has a higher base clock than the Ryzen 7 2700. Seeing as many games currently lack multi-core support, this means that the Ryzen 5 2600 performs better than its technically superior sibling.

Detailed information, benchmarks and values can be found in our review of the Ryzen 5 2600.

ModelAMD Ryzen 5 2600XAMD Ryzen 5 3580UAMD Ryzen 5 2600
SeriesAMD Ryzen 5AMD Picasso (Ryzen 3000 APU)AMD Ryzen 5
CodenameZen+Picasso-U (Zen+)Pinnacle Riege (Zen+)
Clock3600 - 4200 MHz2100 - 3700 MHz3400 - 3900 MHz
L2 Cache4 MB2 MB3 MB
L3 Cache16 MB4 MB16 MB
Cores / Threads6 / 124 / 86 / 12
TDP95 Watt15 Watt65 Watt
Transistors4940 Million4500 Million4940 Million
Technology12 nm12 nm12 nm
Die Size209.78 mm2213 mm2
SocketAM4 (1331)FP5AM4 (LGA1331)
FeaturesSSE4.2, SSE4A, AMD-V, AES, AVX2, FMA3, SHADDR4-2400 RAM, PCIe 3, MMX (+), SSE, SSE2, SSE3, SSSE3, SSE4.1, SSE4.2, SSE4A, AES, AVX, AVX2, FMA3, SHADDR4-2933 RAM, PCIe 3, MMX, SSE, SSE2, SSE3, SSSE3, SSE4A, SSE4.1, SSE4.2, AVX, AVX2, BMI2, ABM, FMA, ADX, SMEP, SMAP, SMT, CPB, AES-NI, RDRAND, RDSEED, SHA, SME
Architecturex86x86
$229 U.S.
Announced
Series: Picasso (Ryzen 3000 APU) Picasso-U (Zen+)
AMD Ryzen 7 3780U2.3 - 4 GHz4 / 8 cores4 MB L3
AMD Ryzen 7 3700U2.3 - 4 GHz4 / 8 cores4 MB L3
AMD Ryzen 5 3550H2.1 - 3.7 GHz4 / 8 cores4 MB L3
AMD Ryzen 5 3500U2.1 - 3.7 GHz4 / 8 cores4 MB L3
AMD Ryzen 5 3450U2.1 - 3.5 GHz4 / 8 cores4 MB L3
AMD Ryzen 5 3580U « 2.1 - 3.7 GHz4 / 8 cores4 MB L3
L1 Cache384 KB
max. Temp.105 °C95 °C
iGPUAMD Radeon RX Vega 9 ( - 1300 MHz)
Manufacturerwww.amd.comwww.amd.com

Benchmarks

Performance Rating - CB R15 + R20 + 7-Zip + X265 + Blender + 3DM11 CPU - R5 2600X
31 pt (43%)
Performance Rating - CB R15 + R20 + 7-Zip + X265 + Blender + 3DM11 CPU - R5 3580U
26.2 pt (36%)
Performance Rating - CB R15 + R20 + 7-Zip + X265 + Blender + 3DM11 CPU - R5 2600
29.7 pt (41%)
Cinebench R20 - Cinebench R20 CPU (Single Core)
421 Points (47%)
352 Points (39%)
380 Points (42%)
Cinebench R20 - Cinebench R20 CPU (Multi Core)
2688 Points (7%)
1549 Points (4%)
2793 Points (7%)
Cinebench R15 - Cinebench R15 CPU Multi 64 Bit
1341 Points (8%)
693 Points (4%)
min: 1245     avg: 1254     median: 1248 (8%)     max: 1270 Points
Cinebench R15 - Cinebench R15 CPU Single 64 Bit
163 Points (49%)
139 Points (42%)
min: 155.9     avg: 157.4     median: 157.3 (47%)     max: 159 Points
Cinebench R11.5 - Cinebench R11.5 CPU Multi 64 Bit
14.6 Points (19%)
7.8 Points (10%)
13.7 Points (18%)
Cinebench R11.5 - Cinebench R11.5 CPU Single 64 Bit
1.8 Points (45%)
1.7 Points (41%)
1.8 Points (44%)
Cinebench R10 - Cinebench R10 Rend. Single (32bit)
4958 Points (30%)
4525 Points (27%)
4726 Points (29%)
Cinebench R10 - Cinebench R10 Rend. Multi (32bit)
29954 Points (22%)
18307 Points (13%)
28173 Points (20%)
Cinebench R10 - Cinebench R10 Rend. Multi (64bit)
48146 Points (33%)
45033 Points (31%)
Cinebench R10 - Cinebench R10 Rend. Single (64bit)
8272 Points (10%)
8024 Points (10%)
wPrime 2.10 - wPrime 2.0 1024m *
133.8 s (2%)
274.7 s (3%)
140.9 s (2%)
wPrime 2.10 - wPrime 2.0 32m *
4.6 s (1%)
7.2 s (1%)
5.5 s (1%)
WinRAR - WinRAR 4.0
4599 Points (7%)
2924 Points (5%)
4517 Points (7%)
7-Zip 18.03 - 7-Zip 18.03 Multli Thread 4 runs
33222 MIPS (19%)
15209 MIPS (9%)
30898 MIPS (18%)
7-Zip 18.03 - 7-Zip 18.03 Single Thread 4 runs
4293 MIPS (51%)
3572 MIPS (43%)
4020 MIPS (48%)
X264 HD Benchmark 4.0 - x264 Pass 2
80.5 fps (28%)
40.1 fps (14%)
75 fps (26%)
X264 HD Benchmark 4.0 - x264 Pass 1
207.4 fps (48%)
135.3 fps (31%)
205.3 fps (47%)
HWBOT x265 Benchmark v2.2 - HWBOT x265 4k Preset
8.3 fps (15%)
4.1 fps (7%)
min: 7.79     avg: 7.8     median: 7.8 (14%)     max: 7.82 fps
TrueCrypt - TrueCrypt Serpent
0.8 GB/s (0%)
0.4 GB/s (0%)
0.7 GB/s (0%)
TrueCrypt - TrueCrypt Twofish
1.2 GB/s (21%)
0.6 GB/s (10%)
1 GB/s (17%)
TrueCrypt - TrueCrypt AES
8 GB/s (21%)
3.5 GB/s (9%)
7.5 GB/s (20%)
Blender - Blender 2.79 BMW27 CPU *
min: 350     avg: 352     median: 352 (2%)     max: 353.9 Seconds
710 Seconds (5%)
min: 374.2     avg: 375     median: 375 (3%)     max: 375.7 Seconds
R Benchmark 2.5 - R Benchmark 2.5 *
0.6 sec (14%)
0.7 sec (14%)
3DMark 06 - CPU - 3DMark 06 - CPU
5545 Points (12%)
168%
1 R5 2600 +
9290 Points (20%)
Super Pi mod 1.5 XS 1M - Super Pi mod 1.5 XS 1M *
11.4 s (2%)
12 s (3%)
11.2 s (2%)
Super Pi mod 1.5 XS 2M - Super Pi mod 1.5 XS 2M *
24.8 s (1%)
27.2 s (1%)
24.3 s (1%)
Super Pi Mod 1.5 XS 32M - Super Pi mod 1.5 XS 32M *
616 s (3%)
694 s (3%)
615 s (3%)
3DMark Vantage - 3DM Vant. Perf. CPU no Physx
45760 Points (40%)
21501 Points (19%)
43794 Points (38%)
3DMark 11 - 3DM11 Performance Physics
12074 Points (33%)
6856 Points (19%)
12405 Points (34%)
3DMark - 3DMark Ice Storm Physics
73430 Points (60%)
47473 Points (39%)
69692 Points (57%)
3DMark - 3DMark Ice Storm Extreme Physics
73424 Points (60%)
48287 Points (39%)
69478 Points (56%)
3DMark - 3DMark Ice Storm Unlimited Physics
74442 Points (63%)
52082 Points (44%)
70522 Points (59%)
3DMark - 3DMark Cloud Gate Physics
11855 Points (30%)
6687 Points (17%)
11219 Points (28%)
3DMark - 3DMark Fire Strike Standard Physics
18091 Points (32%)
9805 Points (17%)
17063 Points (30%)
3DMark - 3DMark Time Spy CPU
6530 Points (28%)
2898 Points (12%)
6265 Points (26%)
Geekbench 5.5 - Geekbench 5.1 - 5.4 64 Bit Single-Core
min: 1066     avg: 1145     median: 1144.5 (48%)     max: 1223 Points
900 Points (38%)
min: 1014     avg: 1119     median: 1118.5 (47%)     max: 1223 Points
Geekbench 5.5 - Geekbench 5.1 - 5.4 64 Bit Multi-Core
min: 5816     avg: 6094     median: 6094 (11%)     max: 6372 Points
2990 Points (5%)
min: 5767     avg: 6070     median: 6069.5 (11%)     max: 6372 Points
Geekbench 5.0 - Geekbench 5.0 64 Bit Single-Core
1067 Points (5%)
1020 Points (4%)
Geekbench 5.0 - Geekbench 5.0 64 Bit Multi-Core
5939 Points (19%)
5885 Points (19%)
Geekbench 4.4 - Geekbench 4.1 - 4.4 64 Bit Single-Core
min: 4577     avg: 4642     median: 4641.5 (46%)     max: 4706 Points
110%
1 R5 2600 +
min: 4631     avg: 5109     median: 5109 (51%)     max: 5587 Points
Geekbench 4.4 - Geekbench 4.1 - 4.4 64 Bit Multi-Core
min: 21616     avg: 22301     median: 22301 (25%)     max: 22986 Points
103%
1 R5 2600 +
min: 20633     avg: 23018     median: 23018 (26%)     max: 25403 Points
Geekbench 4.0 - Geekbench 4.0 64 Bit Single-Core
3908 Points (53%)
Geekbench 4.0 - Geekbench 4.0 64 Bit Multi-Core
11829 Points (29%)
Mozilla Kraken 1.1 - Kraken 1.1 Total Score *
884 ms (1%)
1243 ms (1%)
951 ms (1%)
Octane V2 - Octane V2 Total Score
28517 Points (26%)
WebXPRT 3 - WebXPRT 3 Score
186 Points (39%)
179 Points (37%)
Power Consumption - Prime95 Power Consumption - external Monitor *
171.7 Watt (30%)
41.1 Watt (7%)
103%
1 R5 2600 +
157.5 Watt (27%)
Power Consumption - Cinebench R15 Multi Power Consumption - external Monitor *
164.4 Watt (30%)
40 Watt (7%)
104%
1 R5 2600 +
149.5 Watt (27%)
Power Consumption - Cinebench R15 Multi Power Efficiency - external Monitor
8.2 Points per Watt (6%)
17.3 Points per Watt (13%)
104%
1 R5 2600 +
8.5 Points per Watt (6%)

Average Benchmarks AMD Ryzen 5 2600X → 100% n=34

Average Benchmarks AMD Ryzen 5 3580U → 69% n=34

Average Benchmarks AMD Ryzen 5 2600 → 96% n=34

- Range of benchmark values for this graphics card
- Average benchmark values for this graphics card
* Smaller numbers mean a higher performance
1 This benchmark is not used for the average calculation

v1.26
log 24. 00:17:04

#0 checking url part for id 9980 +0s ... 0s

#1 checking url part for id 11514 +0s ... 0s

#2 checking url part for id 10032 +0s ... 0s

#3 not redirecting to Ajax server +0s ... 0s

#4 did not recreate cache, as it is less than 5 days old! Created at Tue, 23 Apr 2024 05:40:15 +0200 +0.001s ... 0.001s

#5 composed specs +0.031s ... 0.032s

#6 did output specs +0s ... 0.032s

#7 getting avg benchmarks for device 9980 +0.016s ... 0.048s

#8 got single benchmarks 9980 +0.01s ... 0.058s

#9 getting avg benchmarks for device 11514 +0.014s ... 0.072s

#10 got single benchmarks 11514 +0.008s ... 0.08s

#11 getting avg benchmarks for device 10032 +0.013s ... 0.092s

#12 got single benchmarks 10032 +0.009s ... 0.102s

#13 got avg benchmarks for devices +0s ... 0.102s

#14 min, max, avg, median took s +0.373s ... 0.475s

#15 return log +0s ... 0.475s

Please share our article, every link counts!
> Expert Reviews and News on Laptops, Smartphones and Tech Innovations > Benchmarks / Tech > Processor Comparison - Head 2 Head
Redaktion, 2017-09- 8 (Update: 2023-07- 1)