Notebookcheck Logo

NVIDIA Quadro T1000 Max-Q vs NVIDIA T600

NVIDIA Quadro T1000 Max-Q

► remove from comparison NVIDIA Quadro T1000 Max-Q

The Nvidia Quadro T1000 with Max-Q Design is a professional mobile graphics card that is based on the Turing architecture (TU117 chip). Compared to the consumer GTX 1650, the Quadro T1000 features less CUDA cores / shaders (768 versus 896). The chip is manufactured in 12nm FinFET at TSMC. Compared to the normal Quadro T1000, the Max-Q variants are clocked lower and work in a more efficient state. Currently, we know of two variants with different clock speeds and power consumptions (35 and 40 W).

ModelShaderTGP (W)Base (MHz)Boost (MHz)
Quadro T1000 Mobile7685013951455
Quadro T1000 Max-Q7684012301455
Quadro T1000 Max-Q768357951455
Quadro T2000 Mobile10246015751785
GeForce GTX 1650 Mobile8965013951560

The Quadro T1000 is a mobile graphics card that is based on the Turing architecture (TU116 chip). Compared to the faster RTX 2000 GPUs (e.g. RTX 2060), the T1000 integrates no Raytracing or Tensor cores. Due to the same boost clock as the mobile T1000, the Max-Q variants can perform similar with sufficient cooling.

The Turing generation did not only introduce raytracing for the RTX cards, but also optimized the architecture of the cores and caches. According to Nvidia the CUDA cores offer now a concurrent execution of floating point and integer operations for increased performance in compute-heavy workloads of modern games. Furthermore, the caches were reworked (new unified memory architecture with twice the cache compared to Pascal). This leads to up to 50% more instructions per clock and a 40% more power efficient usage compared to Pascal.

Thanks to the low power consumption, the Max-Q T2000 GPU can be used in thin and light laptops. The used TU116 chip is manufactured in 12nm FFN at TSMC.

NVIDIA T600

► remove from comparison NVIDIA T600

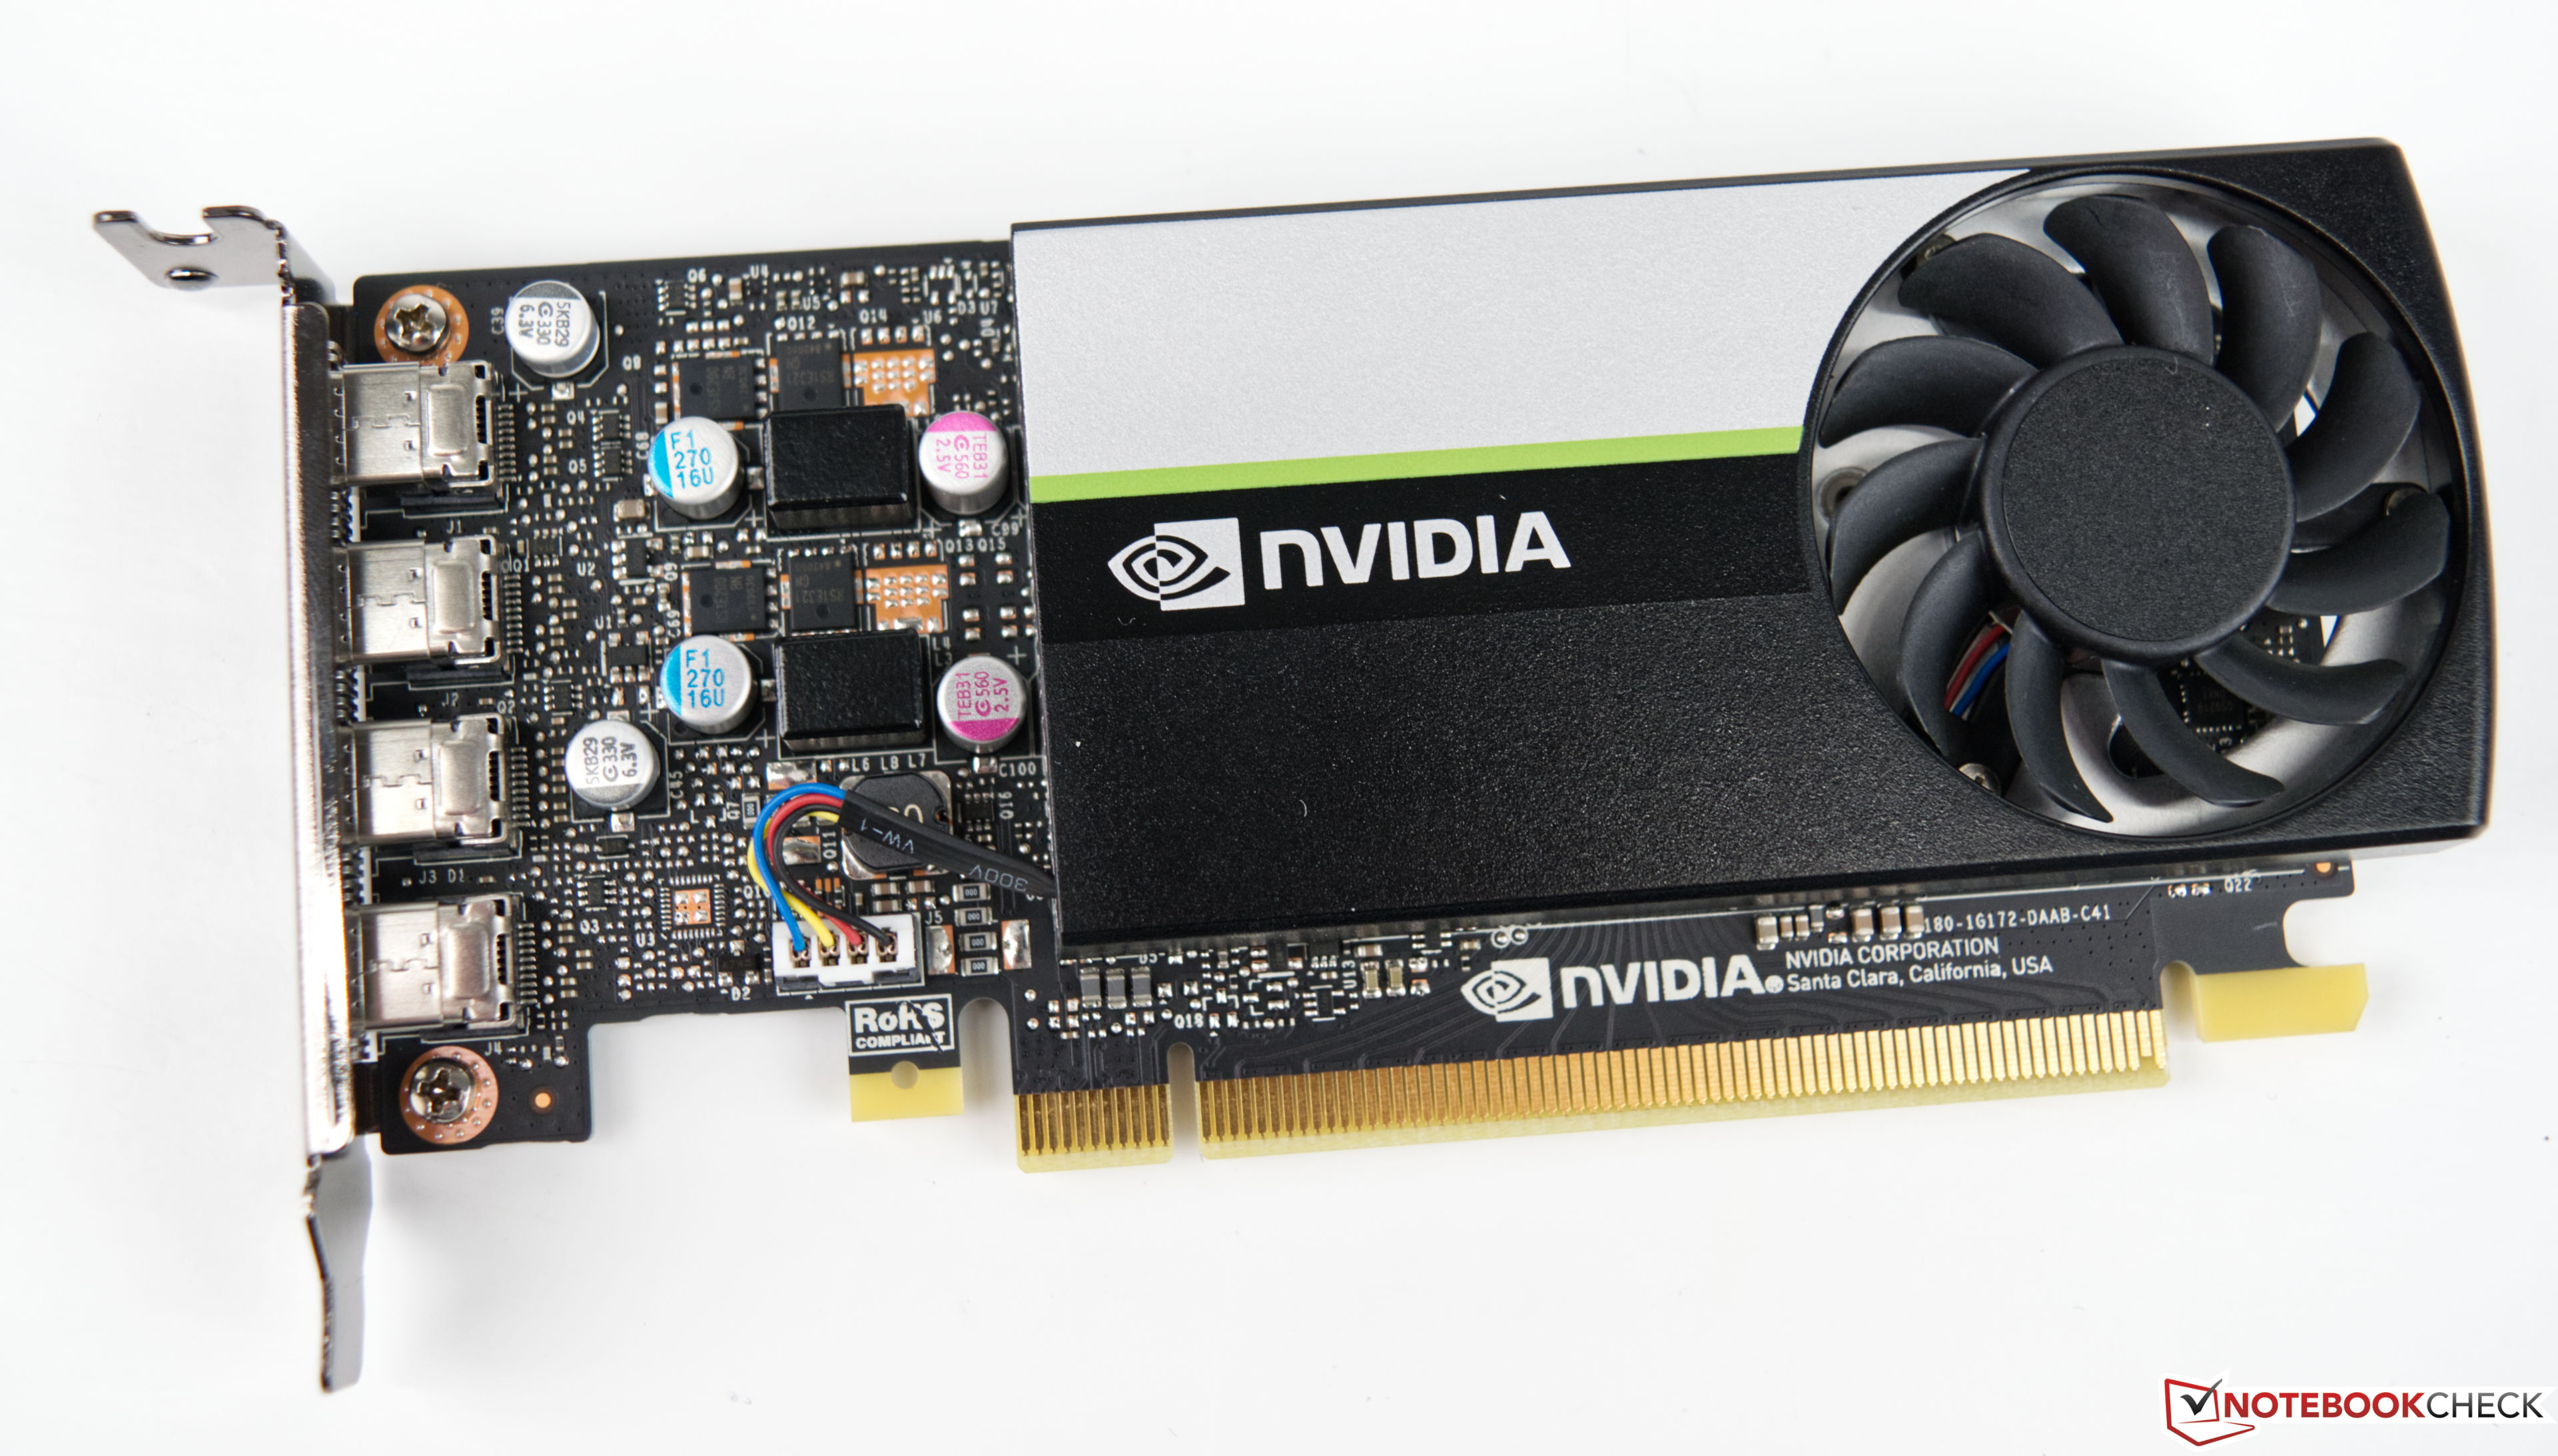
The Nvidia T600 Desktop GPU is a professional graphics card for workstations that is based on the Turing architecture (TU117 chip). The desktop version only offers 640 of the 1024 cores and therefore also less than the T600 mobile (896 CUDA cores). The card offers 4 GB GDDR6 graphics memory connected with a 128 bit bus (up to 160 GB/s bandwidth). The T600 supports certified drivers (former Quadro line) for professional applications like CAD, 3D modelling, DCC, medicine, or visualization applications.

The maximum power consumption of the card is rated at 40W.

NVIDIA Quadro T1000 Max-QNVIDIA T600
Quadro Turing Series
Quadro RTX 6000 (Laptop) compare 4608 @ 1.28 - 1.46 GHz384 Bit @ 14000 MHz
Quadro RTX 5000 (Laptop) compare 3072 @ 1.04 - 1.55 GHz256 Bit @ 14000 MHz
Quadro RTX 5000 Max-Q compare 3072 @ 0.6 - 1.35 GHz256 Bit @ 14000 MHz
Quadro RTX 4000 (Laptop) compare 2560 @ 1.11 - 1.56 GHz256 Bit @ 14000 MHz
Quadro RTX 4000 Max-Q compare 2560 @ 0.78 - 1.38 GHz256 Bit @ 14000 MHz
Quadro RTX 3000 (Laptop) compare 1920 @ 0.95 - 1.38 GHz192 Bit @ 14000 MHz
Quadro RTX 3000 Max-Q compare 1920 @ 0.6 - 1.22 GHz192 Bit @ 14000 MHz
Quadro T2000 (Laptop) compare 1024 @ 1.58 - 1.79 GHz128 Bit @ 8000 MHz
Quadro T2000 Max-Q compare 1024 @ 0.93 - 1.5 GHz128 Bit @ 8000 MHz
T1200 Laptop GPU compare 1024 @ 0.86 - 1.43 GHz128 Bit @ 10000 MHz
Quadro T1000 (Laptop) compare 768 @ 1.4 - 1.46 GHz128 Bit @ 8000 MHz
Quadro T1000 Max-Q 768 @ 0.8 - 1.46 GHz128 Bit @ 8000 MHz
T600 Laptop GPU compare 896 @ 1.4 GHz128 Bit @ 10000 MHz
T550 Laptop GPU compare 1024 @ 1.07 - 1.67 GHz64 Bit @ 12000 MHz
T500 Laptop GPU compare 896 @ 1.37 - 1.7 GHz64 Bit @ 10000 MHz
T600 640 @ 0.74 - 1.34 GHz128 Bit @ 10000 MHz
CodenameN19P-Q1
ArchitectureTuringTuring
Pipelines768 - unified640 - unified
Core Speed795 / 1230 - 1455 (Boost) MHz735 - 1335 (Boost) MHz
Memory Speed8000 MHz10000 effective = 1250 MHz
Memory Bus Width128 Bit128 Bit
Memory TypeGDDR5GDDR6
Max. Amount of Memory4 GB4 GB
Shared Memorynono
APIDirectX 12_1, OpenGL 4.6DirectX 12_1, Shader 6.6, OpenGL 4.6, OpenCL 3.0, Vulkan 1.3
Power Consumption35 - 40 Watt40 Watt
technology12 nm12 nm
Notebook Sizemedium sized
Date of Announcement27.05.2019 12.04.2021
TMUs40
ROPs32
Memory Bandwidth160 GB/s
Transistors4.7 Billion
Die Size 200 mm²
PCIe3.0 x16
Displays4 Displays (max.), DisplayPort 4x mini-DisplayPort 1.4a

Benchmarks

Performance Rating - 3DMark 11 + Fire Strike + Time Spy - T600
3 pt (9%)
3DMark - 3DMark Time Spy Score
100%
1 T600 +
2496 Points (7%)
3DMark - 3DMark Time Spy Graphics
100%
1 T600 +
2195 Points (6%)
3DMark - 3DMark Ice Storm Unlimited Graphics
100%
1 T600 +
304731 Points (35%)
3DMark - 3DMark Ice Storm Extreme Graphics
100%
1 T600 +
152912 Points (20%)
3DMark - 3DMark Cloud Gate Score
100%
1 T600 +
31922 Points (34%)
3DMark - 3DMark Cloud Gate Graphics
100%
1 T600 +
40917 Points (11%)
3DMark - 3DMark Fire Strike Standard Score
100%
1 T600 +
6284 Points (11%)
3DMark - 3DMark Fire Strike Standard Graphics
100%
1 T600 +
6552 Points (7%)
3DMark - 3DMark Ice Storm Graphics
100%
1 T600 +
182459 Points (22%)
3DMark 11 - 3DM11 Performance Score
100%
1 T600 +
9497 Points (13%)
3DMark 11 - 3DM11 Performance GPU
100%
1 T600 +
8694 Points (7%)
3DMark Vantage
3DM Vant. Perf. total + NVIDIA T600
3DMark Vantage - 3DM Vant. Perf. total
100%
1 T600 +
344838 Points (100%)
3DM Vant. Perf. GPU no PhysX + NVIDIA T600
3DMark Vantage - 3DM Vant. Perf. GPU no PhysX
100%
1 T600 +
30400 Points (17%)
3DMark 05 - 3DMark 05 - Standard
100%
1 T600 +
46380 Points (51%)
3DMark 06 3DMark 06 - Standard 1280x1024 + NVIDIA T600
3DMark 06
100%
1 T600 +
43997 Points (58%)
Unigine Valley 1.0 - Unigine Valley 1.0 DX
100%
1 T600 +
32.7 fps (11%)
SPECviewperf 12
specvp12 sw-03 + NVIDIA T600
SPECviewperf 12 - specvp12 sw-03
100%
1 T600 +
115 fps (29%)
specvp12 snx-02 + NVIDIA T600
SPECviewperf 12 - specvp12 snx-02
100%
1 T600 +
68.6 fps (10%)
specvp12 showcase-01 + NVIDIA T600
SPECviewperf 12 - specvp12 showcase-01
100%
1 T600 +
35.3 fps (8%)
specvp12 mediacal-01 + NVIDIA T600
SPECviewperf 12 - specvp12 mediacal-01
100%
1 T600 +
19.5 fps (5%)
specvp12 maya-04 + NVIDIA T600
SPECviewperf 12 - specvp12 maya-04
100%
1 T600 +
67.4 fps (18%)
specvp12 energy-01 + NVIDIA T600
SPECviewperf 12 - specvp12 energy-01
100%
1 T600 +
5 fps (4%)
specvp12 creo-01 + NVIDIA T600
SPECviewperf 12 - specvp12 creo-01
100%
1 T600 +
78.5 fps (31%)
specvp12 catia-04 + NVIDIA T600
SPECviewperf 12 - specvp12 catia-04
100%
1 T600 +
76.9 fps (13%)
specvp12 3dsmax-05 + NVIDIA T600
SPECviewperf 12 - specvp12 3dsmax-05
100%
1 T600 +
80 fps (14%)
SPECviewperf 13 specvp13 sw-04 + NVIDIA T600
SPECviewperf 13 - specvp13 sw-04
100%
1 T600 +
114 fps (31%)
specvp13 snx-03 + NVIDIA T600
SPECviewperf 13 - specvp13 snx-03
100%
1 T600 +
122 fps (14%)
specvp13 showcase-02 + NVIDIA T600
SPECviewperf 13 - specvp13 showcase-02
100%
1 T600 +
34.9 fps (8%)
specvp13 medical-02 + NVIDIA T600
SPECviewperf 13 - specvp13 medical-02
100%
1 T600 +
35.7 fps (7%)
specvp13 maya-05 + NVIDIA T600
SPECviewperf 13 - specvp13 maya-05
100%
1 T600 +
99.8 fps (11%)
specvp13 energy-02 + NVIDIA T600
SPECviewperf 13 - specvp13 energy-02
100%
1 T600 +
12.6 fps (4%)
specvp13 creo-02 + NVIDIA T600
SPECviewperf 13 - specvp13 creo-02
100%
1 T600 +
98 fps (14%)
specvp13 3dsmax-06 + NVIDIA T600
SPECviewperf 13 - specvp13 3dsmax-06
100%
1 T600 +
79.9 fps (14%)
SPECviewperf 2020 specvp2020 solidworks-05 4k + NVIDIA T600
SPECviewperf 2020 - specvp2020 solidworks-05 4k
100%
1 T600 +
16.9 fps (5%)
specvp2020 snx-04 4k + NVIDIA T600
SPECviewperf 2020 - specvp2020 snx-04 4k
100%
1 T600 +
75.6 fps (8%)
specvp2020 medical-03 4k + NVIDIA T600
SPECviewperf 2020 - specvp2020 medical-03 4k
100%
1 T600 +
4.5 fps (4%)
specvp2020 maya-06 4k + NVIDIA T600
SPECviewperf 2020 - specvp2020 maya-06 4k
100%
1 T600 +
46.1 fps (8%)
specvp2020 energy-03 4k + NVIDIA T600
SPECviewperf 2020 - specvp2020 energy-03 4k
100%
1 T600 +
6.7 fps (1%)
specvp2020 creo-03 4k + NVIDIA T600
SPECviewperf 2020 - specvp2020 creo-03 4k
100%
1 T600 +
32.3 fps (15%)
specvp2020 catia-06 4k + NVIDIA T600
SPECviewperf 2020 - specvp2020 catia-06 4k
100%
1 T600 +
13.8 fps (9%)
specvp2020 3dsmax-07 4k + NVIDIA T600
SPECviewperf 2020 - specvp2020 3dsmax-07 4k
100%
1 T600 +
19.4 fps (8%)
Cinebench R10 Cinebench R10 Shading (32bit) + NVIDIA T600
Cinebench R10 - Cinebench R10 Shading (32bit)
100%
1 T600 +
6830 Points (5%)
Cinebench R11.5 Cinebench R11.5 OpenGL 64 Bit + NVIDIA T600
Cinebench R11.5 - Cinebench R11.5 OpenGL 64 Bit
100%
1 T600 +
104.1 fps (36%)
Cinebench R15
Cinebench R15 OpenGL 64 Bit + NVIDIA T600
Cinebench R15 - Cinebench R15 OpenGL 64 Bit
100%
1 T600 +
227.1 fps (13%)
Cinebench R15 OpenGL Ref. Match 64 Bit + NVIDIA T600
Cinebench R15 - Cinebench R15 OpenGL Ref. Match 64 Bit
100%
1 T600 +
99.6 % (100%)
LuxMark v2.0 64Bit - LuxMark v2.0 Room GPU
100%
1 T600 +
1121 Samples/s (5%)
LuxMark v2.0 64Bit - LuxMark v2.0 Sala GPU
100%
1 T600 +
2049 Samples/s (4%)
ComputeMark v2.1 - ComputeMark v2.1 Result
100%
1 T600 +
4825 Points (5%)
Power Consumption - Furmark Stress Test Power Consumption - external Monitor *
100%
1 T600 +
76.7 Watt (11%)
Power Consumption - The Witcher 3 Power Consumption - external Monitor *
100%
1 T600 +
83.5 Watt (12%)
Power Consumption - Witcher 3 ultra Power Efficiency - external Monitor
100%
1 T600 +
0.3 fps per Watt (27%)

Average Benchmarks NVIDIA T600 → 0% n=

- Range of benchmark values for this graphics card
- Average benchmark values for this graphics card
* Smaller numbers mean a higher performance
1 This benchmark is not used for the average calculation

Game Benchmarks

The following benchmarks stem from our benchmarks of review laptops. The performance depends on the used graphics memory, clock rate, processor, system settings, drivers, and operating systems. So the results don't have to be representative for all laptops with this GPU. For detailed information on the benchmark results, click on the fps number.

Far Cry 6

Far Cry 6

2021
low 1280x720
T600:
93.5  fps
med. 1920x1080
T600:
44.6  fps
high 1920x1080
T600:
21.3  fps
ultra 1920x1080
T600:
6.3  fps
F1 2021

F1 2021

2021
low 1280x720
T600:
171.9  fps
med. 1920x1080
T600:
78.8  fps
high 1920x1080
T600:
63.7  fps
ultra 1920x1080
T600:
40.2  fps
QHD 2560x1440
T600:
29.1  fps
4K 3840x2160
T600:
15.7  fps
F1 2020

F1 2020

2020
low 1280x720
T600:
150.4  fps
med. 1920x1080
T600:
73.1  fps
high 1920x1080
T600:
55.5  fps
ultra 1920x1080
T600:
38.6  fps
QHD 2560x1440
T600:
27  fps
4K 3840x2160
T600:
14.5  fps
low 1280x720
T600:
107.6  fps
med. 1920x1080
T600:
42  fps
high 1920x1080
T600:
26.7  fps
ultra 1920x1080
T600:
19.9  fps
QHD 2560x1440
T600:
13.4  fps
4K 3840x2160
T600:
5.5  fps
low 1280x720
T600:
74.6  fps
med. 1920x1080
T600:
34  fps
high 1920x1080
T600:
24  fps
ultra 1920x1080
T600:
19.4  fps
QHD 2560x1440
T600:
14.8  fps
4K 3840x2160
T600:
8.5  fps
Strange Brigade

Strange Brigade

2018
low 1280x720
T600:
174.4  fps
med. 1920x1080
T600:
64.9  fps
high 1920x1080
T600:
51.4  fps
ultra 1920x1080
T600:
44.8  fps
QHD 2560x1440
T600:
31.9  fps
4K 3840x2160
T600:
17.9  fps
Far Cry 5

Far Cry 5

2018
low 1280x720
T600:
95  fps
med. 1920x1080
T600:
46  fps
high 1920x1080
T600:
42  fps
ultra 1920x1080
T600:
39  fps
QHD 2560x1440
T600:
26  fps
4K 3840x2160
T600:
12  fps
low 1280x720
T600:
132.8  fps
med. 1920x1080
T600:
107  fps
high 1920x1080
T600:
95.9  fps
4K 3840x2160
T600:
40.8  fps
low 1280x720
T600:
70.7  fps
med. 1920x1080
T600:
34.9  fps
high 1920x1080
T600:
25.1  fps
QHD 2560x1440
T600:
17.8  fps
4K 3840x2160
T600:
10  fps
low 1280x720
T600:
162.8  fps
med. 1366x768
T600:
148.6  fps
high 1920x1080
T600:
120.7  fps
ultra 1920x1080
T600:
110.5  fps
4K 3840x2160
T600:
39.6  fps
low 1024x768
T600:
139.1  fps
med. 1366x768
T600:
82.8  fps
high 1920x1080
T600:
47.5  fps
ultra 1920x1080
T600:
27.2  fps
4K 3840x2160
T600:
16.1  fps
GTA V

GTA V

2015
low 1024x768
T600:
181.5  fps
med. 1366x768
T600:
175.6  fps
high 1920x1080
T600:
80.3  fps
ultra 1920x1080
T600:
38.2  fps
QHD 2560x1440
T600:
26.6  fps
4K 3840x2160
T600:
25  fps
NVIDIA T600lowmed.highultraQHD4K
Far Cry 693.544.621.36.33
F1 2021171.978.863.740.229.115.7
F1 2020150.473.155.538.62714.5
Borderlands 3107.64226.719.913.45.54
Metro Exodus74.6342419.414.88.47
Strange Brigade174.464.951.444.831.917.9
Far Cry 5954642392612
X-Plane 11.11132.810795.940.8
Final Fantasy XV Benchmark70.734.925.117.89.98
Dota 2 Reborn162.8148.6120.7110.539.6
The Witcher 3139.182.847.527.216.1
GTA V181.5175.680.338.226.625
< 30 fps
< 60 fps
< 120 fps
≥ 120 fps


5
7

5
5
2
4
4
3
1
4
5
1
7
1

9
2

For more games that might be playable and a list of all games and graphics cards visit our Gaming List

Add one or more devices and compare

In the following list you can select (and also search for) devices that should be added to the comparison. You can select more than one device.

restrict list:

show all (including archived), 2024, 2023
v1.26
log 19. 03:56:14

#0 checking url part for id 9888 +0s ... 0s

#1 checking url part for id 11373 +0s ... 0s

#2 not redirecting to Ajax server +0s ... 0s

#3 did not recreate cache, as it is less than 5 days old! Created at Tue, 16 Apr 2024 05:39:00 +0200 +0.001s ... 0.001s

#4 composed specs +0.127s ... 0.128s

#5 did output specs +0s ... 0.128s

#6 start showIntegratedCPUs +0s ... 0.128s

#7 getting avg benchmarks for device 9888 +0.039s ... 0.167s

#8 got single benchmarks 9888 +0.006s ... 0.173s

#9 getting avg benchmarks for device 11373 +0.023s ... 0.196s

#10 got single benchmarks 11373 +0.01s ... 0.206s

#11 got avg benchmarks for devices +0s ... 0.206s

#12 min, max, avg, median took s +0.204s ... 0.41s

#13 before gaming benchmark output +0s ... 0.41s

#14 Got 65 rows for game benchmarks. +0.014s ... 0.424s

#15 composed SQL query for gamebenchmarks +0s ... 0.424s

#16 got data and put it in $dataArray +0.009s ... 0.433s

#17 benchmarks composed for output. +0.029s ... 0.462s

#18 calculated avg scores. +0s ... 0.462s

#19 return log +0.075s ... 0.537s

Please share our article, every link counts!
> Expert Reviews and News on Laptops, Smartphones and Tech Innovations > Benchmarks / Tech > Graphics Card Comparison - Head 2 Head
Redaktion, 2017-09- 8 (Update: 2023-07- 1)