Notebookcheck Logo

NVIDIA Quadro P4200 vs NVIDIA Quadro P5200 vs NVIDIA Quadro P1000

NVIDIA Quadro P4200

► remove from comparison NVIDIA Quadro P4200

The Nvidia Quadro P4200 is a mobile high-end workstation graphics card for notebooks. It is based on the GP104 chip (like the consumer GeForce GTX 1070 or 1080 for laptops) and features 2304 shader cores. The clock rate is not disclosed but the theoretical SP performance is rated at 8.9 TFLOPs (for the fast Max-P version) and therefore faster than the old Quadro P5000 but below the Quadro P5200 (see table below). The P4200 is equipped with 8 GB GDDR5 which leads to 224 GB7s peak bandwidth due to the 256 Bit memory bus. There are two variants available, a Max-P performance version and a Max-Q version tuned for efficiency (with lower clock speeds).

The Quadro GPUs offer certified drivers, which are optimized for stability and performance in professional applications (CAD, DCC, medical, prospection, and visualizing applications). The performance in these areas is therefore much better compared to corresponding consumer GPUs.

Power Consumption

The power consumption of the Quadro P4200 is rated at 115 Watt TGP (max power consumption incl. memory) and therefore 15 Watt more than the Quadro P5000. The card is therefore best suited for large 17-inch notebooks.

NVIDIA Quadro P5200

► remove from comparison NVIDIA Quadro P5200

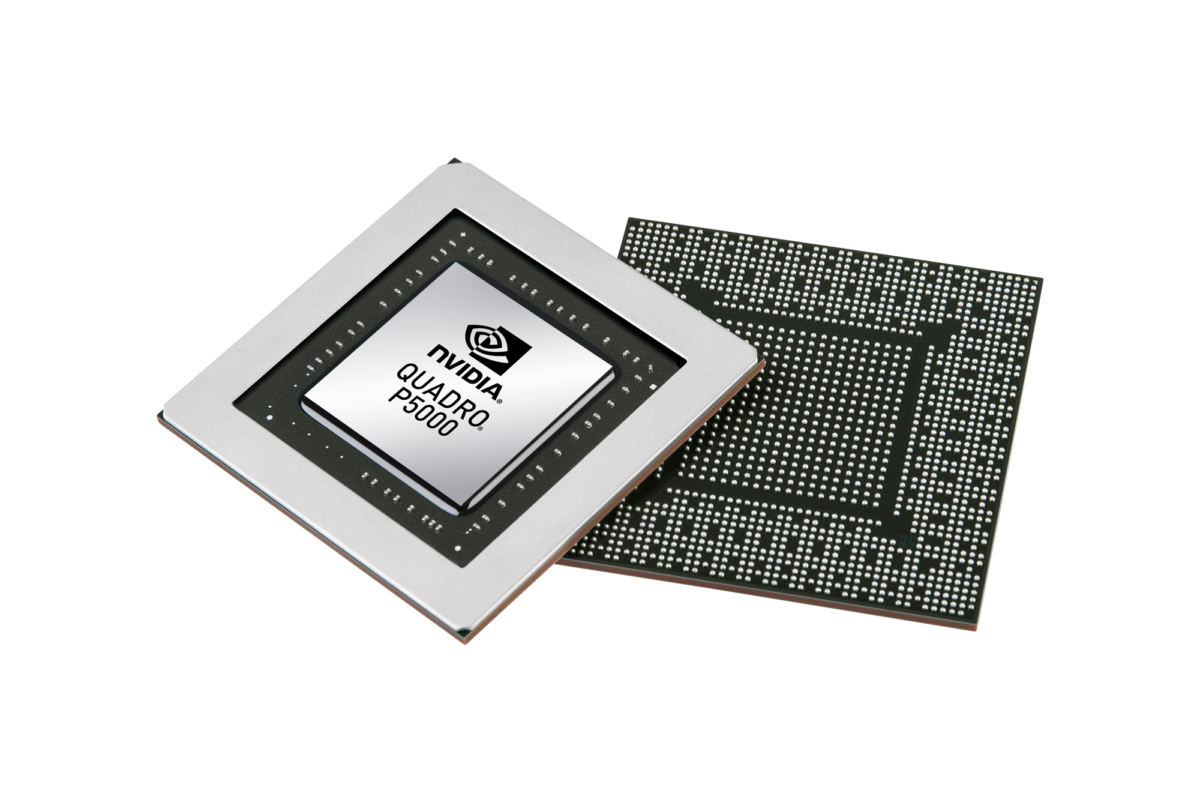
The Nvidia Quadro P5200 is a mobile high-end workstation graphics card for laptops. Similar to the consumer GeForce GTX 1080 (Laptop), it is based on a GP104 chip with 2560 shaders but uses a bit slower GDDR5 instead of GDDR5X of the GTX1080. The Quadro P5200 ist the successor to the Quadro P5000. There will be a normal (Max-P) and a slower but more efficient (Max-Q) variant of the card. For the Max-P variant, the clock speeds are specified from 1556 (base) to 1746 MHz (Boost), the power efficient Max-Q clocks from 1316 MHz (base) to 1569 (Boost) according to a GPU-Z screenshot from a reader (-15% / -10%). The 16 GB GDDR5 are clocked at 3,6 GHz leading to a memory bandwidth of 230 GB/s.

The Quadro GPUs offer certified drivers, which are optimized for stability and performance in professional applications (CAD, DCC, medical, prospection, and visualizing applications). The performance in these areas is therefore much better compared to corresponding consumer GPUs.

Performance

The theoretical performance should be a bit above the older Quadro P5000. Altough the clock speed increase is not yet known, the power consumption is rumored to be a lot higher, which should lead to a noticable improved performance. Nvidia specifies a theoretical peak performance of 8,9 GFLOPS (Single Precision).

Power Consumption

The power consumption of the Quadro P5200 is specified by Nvidia as 150 Watt (Max-P) and rumored to be 100 - 110 Watt for the Max-Q variant. Therefore, it is a lot higher than the Quadro P5000 versions (100 Watt and 80 Watt).

NVIDIA Quadro P1000

► remove from comparison NVIDIA Quadro P1000

The Nvidia Quadro P1000 is a mobile entry-level workstation graphics card for notebooks. Similar to the consumer GeForce GTX 1050 (Laptop), it is based on the GP107 chip but offers only 512 shaders (1050 offers 640, 1050 Ti 768). The graphics card is designed for the Kaby Lake / Coffee Lake generation.

The Quadro GPUs offer certified drivers, which are optimized for stability and performance in professional applications (CAD, DCC, medical, prospection, and visualizing applications). The performance in these areas is therefore much better compared to corresponding consumer GPUs.

Performance

The theoretical performance should be below the GeForce GTX 1050 due to the lower shader count.

NVIDIA Quadro P4200NVIDIA Quadro P5200NVIDIA Quadro P1000
Quadro P Series
Quadro P5200 2560 @ 1.32 - 1.57 GHz256 Bit @ 7216 MHz
Quadro P4200 2304 @ 1.22 - 1.48 GHz256 Bit @ 7132 MHz
Quadro P5000 2048 @ 1.16 - 1.51 GHz256 Bit @ 6006 MHz
Quadro P5000 Max-Q 2048 @ 1.1 - 1.37 GHz256 Bit @ 6006 MHz
Quadro P4000 1792 @ 1.2 - 1.23 GHz256 Bit @ 6006 MHz
Quadro P4000 Max-Q 1792 @ 1.11 - 1.24 GHz256 Bit @ 6006 MHz
Quadro P3200 1792 @ 0.71 - 1.23 GHz192 Bit @ 7008 MHz
Quadro P3000 1280 @ 1.09 - 1.22 GHz192 Bit @ 7008 MHz
Quadro P3000 Max-Q 1280 @ 1.08 - 1.24 GHz192 Bit @ 7008 MHz
Quadro P2000 768 @ 1.22 - 1.47 GHz128 Bit @ 6008 MHz
Quadro P2000 Max-Q 768 @ 1.22 - 1.47 GHz128 Bit @ 6008 MHz
Quadro P1000 512 @ 1.49 - 1.52 GHz128 Bit @ 6008 MHz
Quadro P620 512 @ 1.18 - 1.44 GHz128 Bit @ 6000 MHz
ArchitecturePascalPascalPascal
Pipelines2304 - unified2560 - unified512 - unified
Core Speed1215 - 1480 (Boost) MHz1316 - 1569 (Boost) MHz1493 - 1519 (Boost) MHz
Memory Speed7132 MHz7216 MHz6008 MHz
Memory Bus Width256 Bit256 Bit128 Bit
Memory TypeGDDR5GDDR5GDDR5
Max. Amount of Memory8 GB16 GB4 GB
Shared Memorynonono
APIDirectX 12_1, Shader 5.0, OpenGL 4.5DirectX 12_1, Shader 5.0, OpenGL 4.5DirectX 12_1, Shader 5.0, OpenGL 4.6
Power Consumption115 Watt150 Watt40 Watt
technology16 nm16 nm14 nm
FeaturesOptimus, PhysX, 3D Vision Pro, nView, OptimusOptimus, PhysX, 3D Vision Pro, nView, OptimusOptimus, PhysX, 3D Vision Pro, nView, Optimus
Notebook Sizelargelargelarge
Date of Announcement07.05.2018 11.01.2017 01.02.2017
Transistors3.3 Billion
Link to Manufacturer Pagewww.nvidia.com

Benchmarks

Performance Rating - 3DMark 11 + Fire Strike + Time Spy - Quadro P5200
8.4 pt (25%)
Performance Rating - 3DMark 11 + Fire Strike + Time Spy - Quadro P1000
2.2 pt (7%)
3DMark - 3DMark Time Spy Score
min: 6580     avg: 6647     median: 6646.5 (19%)     max: 6713 Points
1560 Points (4%)
3DMark - 3DMark Time Spy Graphics
min: 6390     avg: 6422     median: 6422 (17%)     max: 6454 Points
1395 Points (4%)
3DMark - 3DMark Cloud Gate Score
min: 39077     avg: 43444     median: 43443.5 (46%)     max: 47810 Points
min: 16596     avg: 19513     median: 20654 (22%)     max: 21290 Points
3DMark - 3DMark Cloud Gate Graphics
min: 105184     avg: 106328     median: 106328 (28%)     max: 107472 Points
min: 21391     avg: 27836     median: 30721 (8%)     max: 31396 Points
3DMark - 3DMark Fire Strike Standard Score
min: 11280     avg: 12485     median: 12485 (22%)     max: 13690 Points
min: 16528     avg: 16626     median: 16625.5 (29%)     max: 16723 Points
min: 4453     avg: 4502     median: 4508 (8%)     max: 4545 Points
3DMark - 3DMark Fire Strike Standard Graphics
min: 18390     avg: 18467     median: 18467 (21%)     max: 18544 Points
min: 4756     avg: 4795     median: 4787 (5%)     max: 4843 Points
3DMark - 3DMark Ice Storm Graphics
387870 Points (47%)
80331 Points (10%)
3DMark 11 - 3DM11 Performance Score
min: 21204     avg: 21715     median: 21715 (30%)     max: 22226 Points
min: 6363     avg: 6415     median: 6377 (9%)     max: 6506 Points
3DMark 11 - 3DM11 Performance GPU
min: 24934     avg: 25100     median: 25100 (22%)     max: 25266 Points
min: 5982     avg: 6033     median: 6001 (5%)     max: 6115 Points
3DMark Vantage
3DM Vant. Perf. total + NVIDIA Quadro P5200
3DMark Vantage - 3DM Vant. Perf. total
65844 Points (19%)
3DM Vant. Perf. total + NVIDIA Quadro P1000
24240 Points (7%)
3DM Vant. Perf. GPU no PhysX + NVIDIA Quadro P5200
3DMark Vantage - 3DM Vant. Perf. GPU no PhysX
68614 Points (39%)
3DM Vant. Perf. GPU no PhysX + NVIDIA Quadro P1000
21687 Points (12%)
3DMark 06 3DMark 06 - Standard 1280x1024 + NVIDIA Quadro P5200
3DMark 06
44390 Points (59%)
3DMark 06 - Standard 1280x1024 + NVIDIA Quadro P1000
32223 Points (42%)
Unigine Valley 1.0 - Unigine Valley 1.0 DX
min: 25.8     avg: 25.9     median: 26 (9%)     max: 26 fps
Unigine Heaven 2.1 - Heaven 2.1 high
63.5 fps (12%)
SPECviewperf 11
specvp11 snx-01 + NVIDIA Quadro P1000
SPECviewperf 11 - specvp11 snx-01
min: 49.1     avg: 49.3     median: 49.3 (29%)     max: 49.36 fps
specvp11 tcvis-02 + NVIDIA Quadro P1000
SPECviewperf 11 - specvp11 tcvis-02
min: 39.2     avg: 40.4     median: 40.9 (23%)     max: 41.21 fps
specvp11 sw-02 + NVIDIA Quadro P1000
SPECviewperf 11 - specvp11 sw-02
min: 37     avg: 39.2     median: 38.8 (29%)     max: 41.79 fps
specvp11 proe-05 + NVIDIA Quadro P1000
SPECviewperf 11 - specvp11 proe-05
min: 15.3     avg: 15.8     median: 15.6 (18%)     max: 16.53 fps
specvp11 maya-03 + NVIDIA Quadro P1000
SPECviewperf 11 - specvp11 maya-03
min: 54.5     avg: 56.3     median: 57 (43%)     max: 57.5 fps
specvp11 lightwave-01 + NVIDIA Quadro P1000
SPECviewperf 11 - specvp11 lightwave-01
min: 45.02     avg: 45.7     median: 45.6 (49%)     max: 46.46 fps
specvp11 ensight-04 + NVIDIA Quadro P1000
SPECviewperf 11 - specvp11 ensight-04
min: 52.4     avg: 52.7     median: 52.5 (25%)     max: 53.1 fps
specvp11 catia-03 + NVIDIA Quadro P1000
SPECviewperf 11 - specvp11 catia-03
min: 38.12     avg: 39.3     median: 39.8 (21%)     max: 40.1 fps
SPECviewperf 12
specvp12 sw-03 + NVIDIA Quadro P5200
SPECviewperf 12 - specvp12 sw-03
min: 199.8     avg: 205.9     median: 205.9 (51%)     max: 212 fps
specvp12 sw-03 + NVIDIA Quadro P1000
min: 75.2     avg: 83.9     median: 86.6 (21%)     max: 89.8 fps
specvp12 snx-02 + NVIDIA Quadro P5200
SPECviewperf 12 - specvp12 snx-02
min: 213.7     avg: 215.8     median: 215.8 (32%)     max: 217.9 fps
specvp12 snx-02 + NVIDIA Quadro P1000
min: 55.4     avg: 56.2     median: 55.7 (8%)     max: 57.4 fps
specvp12 showcase-01 + NVIDIA Quadro P5200
SPECviewperf 12 - specvp12 showcase-01
min: 75     avg: 75.3     median: 75.3 (16%)     max: 75.6 fps
specvp12 showcase-01 + NVIDIA Quadro P1000
min: 27.4     avg: 27.5     median: 27.4 (6%)     max: 27.56 fps
specvp12 mediacal-01 + NVIDIA Quadro P5200
SPECviewperf 12 - specvp12 mediacal-01
min: 79.1     avg: 79.3     median: 79.3 (20%)     max: 79.4 fps
specvp12 mediacal-01 + NVIDIA Quadro P1000
min: 14.89     avg: 15.1     median: 14.9 (4%)     max: 15.41 fps
specvp12 maya-04 + NVIDIA Quadro P5200
SPECviewperf 12 - specvp12 maya-04
min: 143.4     avg: 145.7     median: 145.7 (40%)     max: 147.9 fps
specvp12 maya-04 + NVIDIA Quadro P1000
min: 36.99     avg: 40.5     median: 42.3 (12%)     max: 42.3 fps
specvp12 energy-01 + NVIDIA Quadro P5200
SPECviewperf 12 - specvp12 energy-01
16.9 fps (15%)
specvp12 energy-01 + NVIDIA Quadro P1000
min: 3.66     avg: 4     median: 3.9 (3%)     max: 4.57 fps
specvp12 creo-01 + NVIDIA Quadro P5200
SPECviewperf 12 - specvp12 creo-01
min: 152     avg: 156     median: 156 (62%)     max: 160 fps
specvp12 creo-01 + NVIDIA Quadro P1000
min: 51.2     avg: 55.8     median: 57.1 (23%)     max: 59 fps
specvp12 catia-04 + NVIDIA Quadro P5200
SPECviewperf 12 - specvp12 catia-04
min: 188.6     avg: 192.6     median: 192.6 (32%)     max: 196.6 fps
specvp12 catia-04 + NVIDIA Quadro P1000
min: 53.8     avg: 54.4     median: 54 (9%)     max: 55.3 fps
specvp12 3dsmax-05 + NVIDIA Quadro P1000
SPECviewperf 12 - specvp12 3dsmax-05
min: 50.8     avg: 53     median: 52.9 (9%)     max: 55.4 fps
SPECviewperf 13 specvp13 sw-04 + NVIDIA Quadro P5200
SPECviewperf 13 - specvp13 sw-04
min: 178.3     avg: 183.8     median: 183.8 (49%)     max: 189.2 fps
specvp13 sw-04 + NVIDIA Quadro P1000
min: 76.6     avg: 80.4     median: 80.4 (22%)     max: 84.2 fps
specvp13 snx-03 + NVIDIA Quadro P5200
SPECviewperf 13 - specvp13 snx-03
min: 386.7     avg: 391.5     median: 391.5 (43%)     max: 396.3 fps
specvp13 snx-03 + NVIDIA Quadro P1000
min: 102.6     avg: 103.2     median: 103.2 (11%)     max: 103.7 fps
specvp13 showcase-02 + NVIDIA Quadro P5200
SPECviewperf 13 - specvp13 showcase-02
min: 74.7     avg: 75.1     median: 75.1 (16%)     max: 75.5 fps
specvp13 showcase-02 + NVIDIA Quadro P1000
min: 27.23     avg: 27.4     median: 27.4 (6%)     max: 27.56 fps
specvp13 medical-02 + NVIDIA Quadro P5200
SPECviewperf 13 - specvp13 medical-02
min: 61.5     avg: 61.6     median: 61.6 (13%)     max: 61.7 fps
specvp13 medical-02 + NVIDIA Quadro P1000
min: 11.93     avg: 12.8     median: 12.8 (3%)     max: 13.58 fps
specvp13 maya-05 + NVIDIA Quadro P5200
SPECviewperf 13 - specvp13 maya-05
min: 251.9     avg: 253.5     median: 253.5 (29%)     max: 255 fps
specvp13 maya-05 + NVIDIA Quadro P1000
min: 71     avg: 71.7     median: 71.7 (8%)     max: 72.3 fps
specvp13 energy-02 + NVIDIA Quadro P5200
SPECviewperf 13 - specvp13 energy-02
min: 17.14     avg: 17.2     median: 17.2 (6%)     max: 17.28 fps
specvp13 energy-02 + NVIDIA Quadro P1000
min: 3.15     avg: 3.2     median: 3.2 (1%)     max: 3.28 fps
specvp13 creo-02 + NVIDIA Quadro P5200
SPECviewperf 13 - specvp13 creo-02
min: 241.6     avg: 244.7     median: 244.7 (36%)     max: 247.7 fps
specvp13 creo-02 + NVIDIA Quadro P1000
min: 66.9     avg: 67.9     median: 67.9 (10%)     max: 68.8 fps
specvp13 catia-05 + NVIDIA Quadro P5200
SPECviewperf 13 - specvp13 catia-05
min: 291.7     avg: 297.1     median: 297.1 (33%)     max: 302.4 fps
specvp13 catia-05 + NVIDIA Quadro P1000
min: 78.1     avg: 78.8     median: 78.8 (9%)     max: 79.4 fps
specvp13 3dsmax-06 + NVIDIA Quadro P5200
SPECviewperf 13 - specvp13 3dsmax-06
149.6 fps (26%)
specvp13 3dsmax-06 + NVIDIA Quadro P1000
min: 50.7     avg: 51.9     median: 51.9 (9%)     max: 53.1 fps
Cinebench R10 Cinebench R10 Shading (32bit) + NVIDIA Quadro P5200
Cinebench R10 - Cinebench R10 Shading (32bit)
min: 6830     avg: 6833     median: 6833 (5%)     max: 6836 Points
Cinebench R10 Shading (32bit) + NVIDIA Quadro P1000
5759 Points (4%)
Cinebench R11.5 Cinebench R11.5 OpenGL 64 Bit + NVIDIA Quadro P5200
Cinebench R11.5 - Cinebench R11.5 OpenGL 64 Bit
min: 145.4     avg: 158     median: 158 (55%)     max: 170.5 fps
Cinebench R11.5 OpenGL 64 Bit + NVIDIA Quadro P1000
110.5 fps (38%)
Cinebench R15
Cinebench R15 OpenGL 64 Bit + NVIDIA Quadro P5200
Cinebench R15 - Cinebench R15 OpenGL 64 Bit
min: 219     avg: 234.3     median: 234.3 (14%)     max: 249.6 fps
Cinebench R15 OpenGL 64 Bit + NVIDIA Quadro P1000
min: 122.9     avg: 136.2     median: 136.5 (8%)     max: 149.2 fps
Cinebench R15 OpenGL Ref. Match 64 Bit + NVIDIA Quadro P5200
Cinebench R15 - Cinebench R15 OpenGL Ref. Match 64 Bit
99.6 % (100%)
Cinebench R15 OpenGL Ref. Match 64 Bit + NVIDIA Quadro P1000
99.6 % (100%)
GFXBench - GFXBench Car Chase Offscreen
89.9 fps (10%)
GFXBench 3.1 - GFXBench Manhattan ES 3.1 Offscreen
144.3 fps (3%)
GFXBench 3.0 - GFXBench 3.0 Manhattan Offscreen
187.9 fps (11%)
GFXBench (DX / GLBenchmark) 2.7
GFXBench T-Rex HD Offscreen C24Z16 + NVIDIA Quadro P1000
GFXBench (DX / GLBenchmark) 2.7 - GFXBench T-Rex HD Offscreen C24Z16
374.7 fps (3%)
LuxMark v2.0 64Bit - LuxMark v2.0 Room GPU
2539 Samples/s (11%)
min: 712     avg: 734     median: 713 (3%)     max: 777 Samples/s
LuxMark v2.0 64Bit - LuxMark v2.0 Sala GPU
5183 Samples/s (9%)
min: 1260     avg: 1294     median: 1260 (2%)     max: 1361 Samples/s
ComputeMark v2.1 - ComputeMark v2.1 Result
15892 Points (17%)
3531 Points (4%)
Power Consumption - Witcher 3 Power Consumption *
min: 218.9     avg: 227.6     median: 227.6 (50%)     max: 236.3 Watt
min: 64     avg: 68     median: 66 (15%)     max: 74 Watt
Power Consumption - Witcher 3 ultra Power Efficiency
min: 0.2823     avg: 0.3     median: 0.3 (28%)     max: 0.2896 fps per Watt
min: 0.2122     avg: 0.2     median: 0.3 (25%)     max: 0.2561 fps per Watt
Emissions Witcher 3 Fan Noise + NVIDIA Quadro P5200
Emissions - Witcher 3 Fan Noise
min: 51.4     avg: 51.8     median: 51.8 (83%)     max: 52.2 dB(A)
Witcher 3 Fan Noise + NVIDIA Quadro P1000
min: 33.1     avg: 34.3     median: 34.8 (56%)     max: 35 dB(A)

Average Benchmarks NVIDIA Quadro P4200 → 100% n=1

Average Benchmarks NVIDIA Quadro P5200 → 133% n=1

Average Benchmarks NVIDIA Quadro P1000 → 36% n=1

- Range of benchmark values for this graphics card
- Average benchmark values for this graphics card
* Smaller numbers mean a higher performance
1 This benchmark is not used for the average calculation

Game Benchmarks

The following benchmarks stem from our benchmarks of review laptops. The performance depends on the used graphics memory, clock rate, processor, system settings, drivers, and operating systems. So the results don't have to be representative for all laptops with this GPU. For detailed information on the benchmark results, click on the fps number.

FIFA 19

FIFA 19

2018
low 1280x720
Quadro P1000:
204.6  fps
med. 1920x1080
Quadro P1000:
107.8  fps
high 1920x1080
Quadro P1000:
99.9  fps
ultra 1920x1080
Quadro P1000:
89.5  fps
low 1280x720
Quadro P5200:
147  fps
med. 1920x1080
Quadro P5200:
91  fps
high 1920x1080
Quadro P5200:
84  fps
ultra 1920x1080
Quadro P5200:
72  fps
4K 3840x2160
Quadro P5200:
26  fps
F1 2018

F1 2018

2018
low 1280x720
Quadro P5200:
212  fps
Quadro P1000:
96  fps
med. 1920x1080
Quadro P5200:
152  fps
Quadro P1000:
53  fps
high 1920x1080
Quadro P5200:
125  fps
Quadro P1000:
41  fps
ultra 1920x1080
Quadro P5200:
83  fps
Quadro P1000:
25  fps
4K 3840x2160
Quadro P5200:
46  fps
low 1280x720
Quadro P5200:
183.5  fps
med. 1920x1080
Quadro P5200:
110.1  fps
high 1920x1080
Quadro P5200:
100.4  fps
ultra 1920x1080
Quadro P5200:
77.4  fps
4K 3840x2160
Quadro P5200:
24.1  fps
Far Cry 5

Far Cry 5

2018
low 1280x720
Quadro P1000:
64  fps
med. 1920x1080
Quadro P1000:
32  fps
high 1920x1080
Quadro P1000:
29  fps
ultra 1920x1080
Quadro P1000:
27  fps
low 1280x720
Quadro P1000:
51.9  fps
med. 1920x1080
Quadro P1000:
25.3  fps
high 1920x1080
Quadro P1000:
18.2  fps
low 1280x720
Quadro P1000:
114.4  fps
med. 1920x1080
Quadro P1000:
44.6  fps
high 1920x1080
Quadro P1000:
37.9  fps
ultra 1920x1080
Quadro P1000:
26.6  fps
low 1280x720
Quadro P1000:
127.1  fps
med. 1920x1080
Quadro P1000:
81  fps
high 1920x1080
Quadro P1000:
41.1  fps
ultra 1920x1080
Quadro P1000:
33.4  fps
Destiny 2

Destiny 2

2017
low 1280x720
Quadro P5200:
13  fps
med. 1920x1080
Quadro P5200:
12.7  fps
high 1920x1080
Quadro P5200:
12.6  fps
ultra 1920x1080
Quadro P5200:
12.2  fps
4K 3840x2160
Quadro P5200:
12.3  fps
low 1280x720
Quadro P5200:
219  fps
med. 1920x1080
Quadro P5200:
137  fps
high 1920x1080
Quadro P5200:
106  fps
ultra 1920x1080
Quadro P5200:
84  fps
4K 3840x2160
Quadro P5200:
33  fps
Dirt 4

Dirt 4

2017
low 1280x720
Quadro P5200:
354.1  fps
med. 1920x1080
Quadro P5200:
221.2  fps
high 1920x1080
Quadro P5200:
126  fps
ultra 1920x1080
Quadro P5200:
84.4  fps
4K 3840x2160
Quadro P5200:
56.8  fps
low 1280x720
Quadro P5200:
248.5  fps
Quadro P1000:
235.5  fps
med. 1920x1080
Quadro P5200:
247  fps
Quadro P1000:
123.8  fps
high 1920x1080
Quadro P5200:
185.8  fps
Quadro P1000:
81.8  fps
4K 3840x2160
Quadro P5200:
92.5  fps
Prey

Prey

2017
low 1280x720
Quadro P5200:
145  fps
med. 1920x1080
Quadro P5200:
144.6  fps
high 1920x1080
Quadro P5200:
145  fps
ultra 1920x1080
Quadro P5200:
144.1  fps
4K 3840x2160
Quadro P5200:
60.9  fps
low 1280x720
Quadro P1000:
71.7  fps
med. 1920x1080
Quadro P1000:
31.9  fps
high 1920x1080
Quadro P1000:
29.1  fps
ultra 1920x1080
Quadro P1000:
15.8  fps
For Honor

For Honor

2017
low 1280x720
Quadro P1000:
117.6  fps
med. 1920x1080
Quadro P1000:
44.3  fps
high 1920x1080
Quadro P1000:
42  fps
ultra 1920x1080
Quadro P1000:
33  fps
low 1280x720
Quadro P1000:
135.8  fps
med. 1366x768
Quadro P1000:
80.5  fps
high 1920x1080
Quadro P1000:
38.7  fps
ultra 1920x1080
Quadro P1000:
35.3  fps
low 1024x768
Quadro P1000:
114.7  fps
med. 1366x768
Quadro P1000:
71.3  fps
high 1920x1080
Quadro P1000:
33.5  fps
ultra 1920x1080
Quadro P1000:
27  fps
Overwatch

Overwatch

2016
low 1280x720
Quadro P5200:
300  fps
med. 1366x768
Quadro P5200:
300  fps
high 1920x1080
Quadro P5200:
252.2  fps
ultra 1920x1080
Quadro P5200:
174.1  fps
4K 3840x2160
Quadro P5200:
88.7  fps
Doom

Doom

2016
low 1280x720
Quadro P1000:
91.7  fps
med. 1366x768
Quadro P1000:
78.4  fps
high 1920x1080
Quadro P1000:
43.3  fps
ultra 1920x1080
Quadro P1000:
41.6  fps
low 1280x768
Quadro P5200:
113  fps
med. 1920x1080
Quadro P5200:
99.1  fps
high 1920x1080
Quadro P5200:
97.8  fps
4K 3840x2160
Quadro P5200:
43.5  fps
low 1024x768
Quadro P5200:
289 292.9 ~ 291 fps
Quadro P1000:
88.3 100.1 101.5 ~ 97 fps
med. 1366x768
Quadro P5200:
210.1 220.6 ~ 215 fps
Quadro P1000:
55.7 57.5 59.1 ~ 57 fps
high 1920x1080
Quadro P5200:
121.5 125.5 ~ 124 fps
Quadro P1000:
29.6 32 32.3 ~ 31 fps
ultra 1920x1080
Quadro P5200:
101 105.2 ~ 103 fps
Quadro P1000:
24.1 26.2 27 ~ 26 fps
4K 3840x2160
Quadro P5200:
44.9 46.6 ~ 46 fps
Quadro P1000:
10.6  fps
low 1024x768
Quadro P1000:
172.7  fps
med. 1366x768
Quadro P1000:
115.1  fps
high 1920x1080
Quadro P1000:
62.8  fps
ultra 1920x1080
Quadro P1000:
56.1  fps
Fallout 4

Fallout 4

2015
low 1280x720
Quadro P5200:
241.9  fps
med. 1366x768
Quadro P5200:
236.3  fps
4K 3840x2160
Quadro P5200:
46.8  fps
low 1024x768
Quadro P5200:
60  fps
med. 1366x768
Quadro P5200:
60  fps
high 1920x1080
Quadro P5200:
60  fps
ultra 1920x1080
Quadro P5200:
60  fps
4K 3840x2160
Quadro P5200:
60  fps
low 1280x720
Quadro P5200:
186  fps
med. 1366x768
Quadro P5200:
176  fps
high 1920x1080
Quadro P5200:
131  fps
ultra 1920x1080
Quadro P5200:
90  fps
4K 3840x2160
Quadro P5200:
50  fps
low 1024x768
Quadro P5200:
303.5 327.2 ~ 315 fps
Quadro P1000:
88.7 88.8 89.4 ~ 89 fps
med. 1366x768
Quadro P5200:
211.6 228.7 ~ 220 fps
Quadro P1000:
52.5 53.8 54.4 ~ 54 fps
high 1920x1080
Quadro P5200:
116.1 120.2 ~ 118 fps
Quadro P1000:
26.1 29.5 29.9 ~ 29 fps
ultra 1920x1080
Quadro P5200:
63.4 66.7 ~ 65 fps
Quadro P1000:
15.7 16.1 16.9 ~ 16 fps
4K 3840x2160
Quadro P5200:
43.9 47.2 ~ 46 fps
Thief

Thief

2014
low 1024x768
Quadro P5200:
149.4  fps
med. 1366x768
Quadro P5200:
145.1  fps
high 1366x768
Quadro P5200:
145.7  fps
ultra 1920x1080
Quadro P5200:
114.2  fps
low 1024x768
Quadro P5200:
177.5  fps
med. 1366x768
Quadro P5200:
175.2  fps
high 1366x768
Quadro P5200:
171.6  fps
ultra 1920x1080
Quadro P5200:
119.2  fps
low 1280x720
Quadro P5200:
395 435 ~ 415 fps
Quadro P1000:
229.9 249.7 276.8 ~ 252 fps
med. 1366x768
Quadro P5200:
341.6 375.5 ~ 359 fps
Quadro P1000:
149.3 152.2 155.4 ~ 152 fps
high 1366x768
Quadro P5200:
315.1 346.5 ~ 331 fps
Quadro P1000:
132.3 133.7 133.8 ~ 133 fps
ultra 1920x1080
Quadro P1000:
51 51.3 51.7 ~ 51 fps
low 1024x768
Quadro P5200:
753  fps
med. 1366x768
Quadro P5200:
346.2  fps
high 1366x768
Quadro P5200:
296.6  fps
ultra 1920x1080
Quadro P5200:
218.9  fps
low 1024x768
Quadro P5200:
145.1  fps
high 1366x768
Quadro P5200:
83.5  fps
ultra 1920x1080
Quadro P5200:
85.4  fps
low 1024x768
Quadro P5200:
344.2  fps
med. 1366x768
Quadro P5200:
288.1  fps
high 1366x768
Quadro P5200:
267.3  fps
ultra 1920x1080
Quadro P5200:
118.8  fps
NVIDIA Quadro P1000lowmed.highultraQHD4K
FIFA 19204.6107.899.989.5
F1 201896534125
Far Cry 564322927
Final Fantasy XV Benchmark51.925.318.2
Star Wars Battlefront 2114.444.637.926.6
Call of Duty WWII127.18141.133.4
Rocket League235.5123.881.8
Ghost Recon Wildlands71.731.929.115.8
For Honor117.644.34233
Battlefield 1135.880.538.735.3
Civilization VI114.771.333.527
Doom91.778.443.341.6
Rise of the Tomb Raider9757312610.6
Rainbow Six Siege172.7115.162.856.1
The Witcher 389542916
BioShock Infinite25215213351
< 30 fps
< 60 fps
< 120 fps
≥ 120 fps

1
9
6
1
7
6
2
4
8
3
1
7
6
1


1


NVIDIA Quadro P5200lowmed.highultraQHD4K
Shadow of the Tomb Raider14791847226
F1 20182121521258346
Monster Hunter World183.5110.1100.477.424.1
Destiny 21312.712.612.212.3
Middle-earth: Shadow of War2191371068433
Dirt 4354.1221.212684.456.8
Rocket League248.5247185.892.5
Prey145144.6145144.160.9
Overwatch300300252.2174.188.7
Ashes of the Singularity11399.197.843.5
Rise of the Tomb Raider29121512410346
Fallout 4241.9236.346.8
Metal Gear Solid V6060606060
Batman: Arkham Knight1861761319050
The Witcher 33152201186546
Thief149.4145.1145.7114.2
Metro: Last Light177.5175.2171.6119.2
BioShock Infinite415359331
StarCraft II: Heart of the Swarm753346.2296.6218.9
Guild Wars 2145.183.585.4
Sleeping Dogs344.2288.1267.3118.8
< 30 fps
< 60 fps
< 120 fps
≥ 120 fps
1

2
18
1

4
15
1

7
12
1

13
3


3
8
4

For more games that might be playable and a list of all games and graphics cards visit our Gaming List

v1.26
log 19. 00:26:06

#0 checking url part for id 8814 +0s ... 0s

#1 checking url part for id 8094 +0s ... 0s

#2 checking url part for id 8846 +0s ... 0s

#3 not redirecting to Ajax server +0s ... 0s

#4 did not recreate cache, as it is less than 5 days old! Created at Tue, 16 Apr 2024 05:39:00 +0200 +0.001s ... 0.001s

#5 composed specs +0.167s ... 0.169s

#6 did output specs +0s ... 0.169s

#7 start showIntegratedCPUs +0s ... 0.169s

#8 getting avg benchmarks for device 8814 +0.044s ... 0.212s

#9 got single benchmarks 8814 +0.007s ... 0.22s

#10 getting avg benchmarks for device 8094 +0.02s ... 0.24s

#11 got single benchmarks 8094 +0.016s ... 0.256s

#12 getting avg benchmarks for device 8846 +0.019s ... 0.275s

#13 got single benchmarks 8846 +0.016s ... 0.291s

#14 got avg benchmarks for devices +0s ... 0.291s

#15 min, max, avg, median took s +0.312s ... 0.603s

#16 before gaming benchmark output +0s ... 0.603s

#17 Got 193 rows for game benchmarks. +0.018s ... 0.621s

#18 composed SQL query for gamebenchmarks +0s ... 0.621s

#19 got data and put it in $dataArray +0.023s ... 0.644s

#20 benchmarks composed for output. +0.076s ... 0.72s

#21 calculated avg scores. +0s ... 0.72s

#22 return log +0.002s ... 0.722s

Please share our article, every link counts!
> Expert Reviews and News on Laptops, Smartphones and Tech Innovations > Benchmarks / Tech > Graphics Card Comparison - Head 2 Head
Redaktion, 2017-09- 8 (Update: 2023-07- 1)