ERROR: No GPU found with the ID:160

getGPUInfos: Perhaps the translation is missing or the German GPU is not selected in the page header (or a wrong one is selected) NVIDIA Quadro NVS 160M vs vs Vivante GC1000+ Dual-Core
Notebookcheck Logo

NVIDIA Quadro NVS 160M vs vs Vivante GC1000+ Dual-Core

NVIDIA Quadro NVS 160M

► remove from comparison NVIDIA Quadro NVS 160M

The Nvidia Quadro NVS 150M is a business graphics adapater for notebooks. It is based on the GeForce 9300M GS consumer graphics card but features special drivers which are optimized for business applications. A short list of the applications which are certified for the NVS line can be found here (including MS Office, Exceed, Notes, McAffee, pcAnywhere, Bloomberg, Reuters, Tradestation).

The gaming performance should be similar to the GeForce 9300M GS and therefore only suited for less demanding games with low details. Still the business drivers are not optimized for games and may therefore show a worse performance (or some bugs). The memory is clocked either with 700 MHz (DDR3) or 400 MHz (DDR2) which is noticable slower.

Compared to the Quadro NVS 150M, the 160M features a higher clock speed and supports higher resolutions up to 1920x1200 (digital) or 2048x1536 (analog).

As the 9300M GS, the Quadro NVS 160M also supports PureVideo HD to decode HD videos with the graphics chip (and save current).

Vivante GC1000+ Dual-Core

► remove from comparison Vivante Vivante GC1000+ Dual-Core

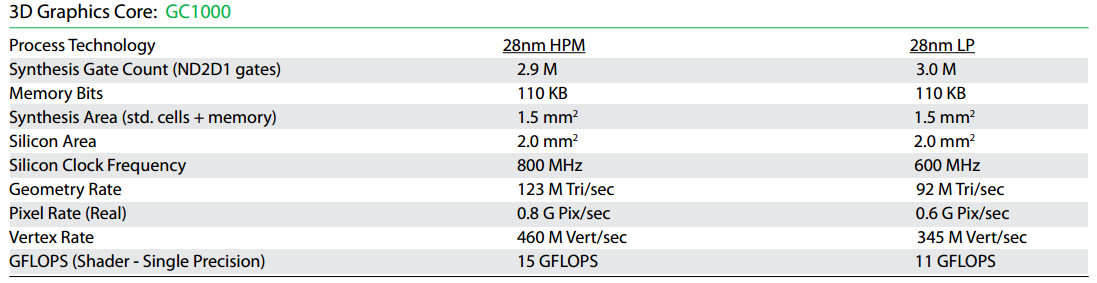
The Vivante GC1000+ Dual-Core is an integrated graphics card for ARM based SoCs. It supports Android, Windows Mobile 6, Windows CE and Linux and the standards OpenGL ES 2.0, OpenGL 2.1, OpenVG 1.1, and DirectX 11 (9_3). The chip is can be clocked with up to 600 MHz (28nm LP) or 800 MHz (28nm HPM). The theoretical calculating power of the GPU is 50 Mio triangles / s, 650 Mio pixels / s and 12 GFLOPS (according to cnx-software.com). According to Vivante however the GC1000 is capable of 345 to 460 Mio triangles /s and 11 to 15 GFLOPS.

NVIDIA Quadro NVS 160MVivante GC1000+ Dual-Core
Series
Quadro NVS 5100M 48 @ 0.55 GHz128 Bit @ 800 MHz
Quadro NVS 320M 32 @ 0.58 GHz128 Bit @ 700 MHz
Quadro NVS 300M 8/5 cores @ 0.45 GHz128 Bit @ 500 MHz
Quadro NVS 140M 16 @ 0.4 GHz64 Bit @ 700 MHz
Quadro NVS 160M 8 @ 0.58 GHz64 Bit @ 700 MHz
Quadro NVS 150M 8 @ 0.53 GHz64 Bit @ 700 MHz
Quadro NVS 135M 16 @ 0.4 GHz64 Bit @ 600 MHz
Quadro NVS 130M 8 64 Bit @ 700 MHz
Quadro NVS 120M 4/3 cores @ 0.45 GHz64 Bit @ 700 MHz
Quadro NVS 110M 4/3 cores @ 0.3 GHz64 Bit @ 600 MHz
Vivante GC1000+ Dual-Core 2 @ 0.6 GHz
GC800 1 @ 0.32 - 0.58 GHz
Extreme Graphics 2 @ 0.13 GHz
PXP
unknown
Pipelines8 - unified2 - unified
Core Speed580 MHz600 / 800 MHz
Shader Speed1450 MHz
Memory Speed700 MHz
Memory Bus Width64 Bit
Memory TypeGDDR2, GDDR3
Max. Amount of Memory256 MB
Shared Memorynono
APIDirectX 10, Shader 4.0DirectX 9_3, OpenGL 2.1 / ES 2.0
Power Consumption12 Watt
technology65 nm
Date of Announcement15.08.2008 12.09.2013
InformationOpenGL 2.1, max. 1920x1200 (digital) bzw 2048x1536 (analog), max. 2 unabhängige Displays, PCI-Express x16, optionale Interfaces (des Chips): DP, VGA, DVI, LVDS, HDMI
Link to Manufacturer Pagewww.nvidia.com

Benchmarks

3DMark - 3DMark Ice Storm Unlimited Graphics
min: 2237     avg: 2329     median: 2373 (0%)     max: 2377 Points
3DMark - 3DMark Ice Storm Extreme Graphics
min: 997     avg: 1177     median: 1207.5 (0%)     max: 1295 Points
3DMark 2001SE - 3DMark 2001 - Standard
13740 Points (14%)
3DMark 03 - 3DMark 03 - Standard
min: 5278     avg: 5911     median: 5911 (3%)     max: 6544 Points
3DMark 05 - 3DMark 05 - Standard
min: 3250     avg: 3587     median: 3586.5 (4%)     max: 3923 Points
3DMark 06 3DMark 06 - Standard 1280x800 + NVIDIA Quadro NVS 160M
3DMark 06
min: 1698     avg: 1939     median: 1841 (2%)     max: 2278 Points
Cinebench R10 Cinebench R10 Shading (32bit) + NVIDIA Quadro NVS 160M
Cinebench R10 - Cinebench R10 Shading (32bit)
min: 2663     avg: 2864     median: 2923 (2%)     max: 3006 Points
GFXBench 3.0 - GFXBench 3.0 Manhattan Offscreen
0 fps (0%)
GFXBench (DX / GLBenchmark) 2.7
GFXBench T-Rex HD Offscreen C24Z16 + Vivante GC1000+ Dual-Core
GFXBench (DX / GLBenchmark) 2.7 - GFXBench T-Rex HD Offscreen C24Z16
min: 2.5     avg: 2.8     median: 2.7 (0%)     max: 3.3 fps
AnTuTu 3DRating - Antutu 3DRating Off-screen
1651 Points (57%)
AnTuTu 3DRating - Antutu 3DRating Score
4981 Points (44%)
AnTuTu v3 - AnTuTu v3 GPU
5503 Points (57%)
Basemark ES 2.0 - Basemark ES 2.0
min: 13.87     avg: 18     median: 20.1 (33%)     max: 20.09 fps
Basemark X 1.0 - Basemark X 1.0 Off-Screen
min: 1.246     avg: 1.8     median: 1.8 (8%)     max: 2.262 fps
PassMark PerformanceTest Mobile V1 - PerformanceTest Mobile V1 2D Graphics Tests
min: 1549     avg: 1910     median: 1798 (2%)     max: 2667 Points
PassMark PerformanceTest Mobile V1 - PerformanceTest Mobile V1 3D Graphics Tests
min: 682     avg: 707     median: 688 (1%)     max: 753 Points
Smartbench 2012 - Smartbench 2012 Gaming Index
min: 1832     avg: 2304     median: 2322 (50%)     max: 2758 Points

Average Benchmarks NVIDIA Quadro NVS 160M → 0% n=

Average Benchmarks Vivante GC1000+ Dual-Core → 0% n=

- Range of benchmark values for this graphics card
- Average benchmark values for this graphics card
* Smaller numbers mean a higher performance
1 This benchmark is not used for the average calculation

Game Benchmarks

The following benchmarks stem from our benchmarks of review laptops. The performance depends on the used graphics memory, clock rate, processor, system settings, drivers, and operating systems. So the results don't have to be representative for all laptops with this GPU. For detailed information on the benchmark results, click on the fps number.

F.E.A.R.

F.E.A.R.

2005
low 640x480
100%
Quadro NVS 160M:
297  fps
med. 800x600
100%
Quadro NVS 160M:
58  fps
high 1024x768
100%
Quadro NVS 160M:
13  fps
Doom 3

Doom 3

2004
low 640x480
100%
Quadro NVS 160M:
106.4  fps
med. 640x480
100%
Quadro NVS 160M:
106.6  fps
high 800x600
100%
Quadro NVS 160M:
78.5  fps
ultra 1024x768
100%
Quadro NVS 160M:
49.8  fps
Quake 3 Arena - Timedemo

Quake 3 Arena - Timedemo

1999
high 1024x768
100%
Quadro NVS 160M:
210.7  fps

Average Gaming NVIDIA Quadro NVS 160M → 100%

Average Gaming 30-70 fps → 100%

NVIDIA Quadro NVS 160Mlowmed.highultraQHD4K
F.E.A.R.2975813
Doom 3106.4106.678.549.8
Quake 3 Arena - Timedemo210.7
< 30 fps
< 60 fps
< 120 fps
≥ 120 fps


1
1

1
1
1

1
1

1


For more games that might be playable and a list of all games and graphics cards visit our Gaming List

v1.26
log 19. 22:53:07

#0 checking url part for id 879 +0s ... 0s

#1 checking url part for id 160 +0s ... 0s

#2 checking url part for id 4572 +0s ... 0s

#3 not redirecting to Ajax server +0s ... 0s

#4 did not recreate cache, as it is less than 5 days old! Created at Fri, 19 Apr 2024 05:40:26 +0200 +0.001s ... 0.001s

#5 composed specs +0.175s ... 0.176s

#6 did output specs +0s ... 0.176s

#7 start showIntegratedCPUs +0s ... 0.176s

#8 getting avg benchmarks for device 879 +0.043s ... 0.218s

#9 got single benchmarks 879 +0.011s ... 0.23s

#10 getting avg benchmarks for device 160 +0.002s ... 0.232s

#11 got single benchmarks 160 +0s ... 0.232s

#12 getting avg benchmarks for device 4572 +0.002s ... 0.234s

#13 got single benchmarks 4572 +0.014s ... 0.248s

#14 got avg benchmarks for devices +0s ... 0.248s

#15 No cached benchmark found, getting uncached values +0.067s ... 0.315s

#16 min, max, avg, median took s +0.014s ... 0.329s

#17 before gaming benchmark output +0s ... 0.329s

#18 Got 8 rows for game benchmarks. +0.004s ... 0.333s

#19 composed SQL query for gamebenchmarks +0s ... 0.333s

#20 got data and put it in $dataArray +0.002s ... 0.335s

#21 benchmarks composed for output. +0.008s ... 0.343s

#22 calculated avg scores. +0s ... 0.343s

#23 return log +0.002s ... 0.345s

Please share our article, every link counts!
> Expert Reviews and News on Laptops, Smartphones and Tech Innovations > Benchmarks / Tech > Graphics Card Comparison - Head 2 Head
Redaktion, 2017-09- 8 (Update: 2023-07- 1)