NVIDIA Quadro M5500 vs NVIDIA Quadro M3000M vs NVIDIA Quadro M1200
NVIDIA Quadro M5500 ► remove from comparison
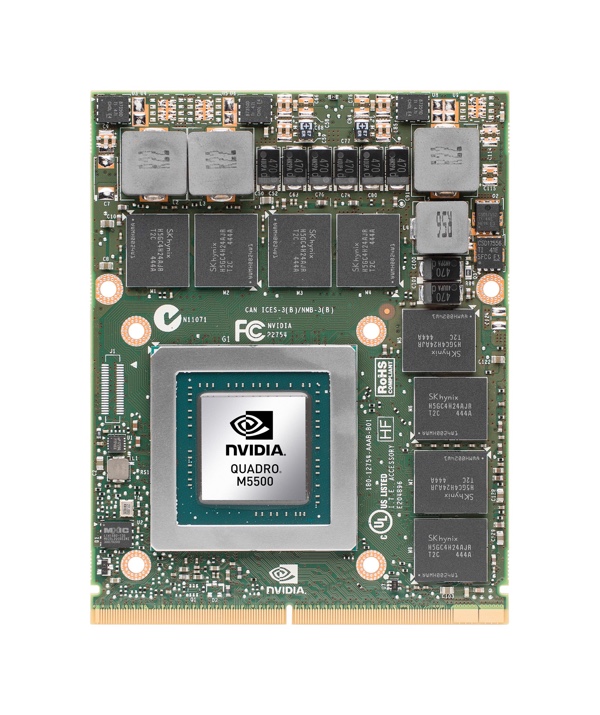
The Nvidia Quadro M5500 is a high-end, DirectX 12 (FL_12_1) and OpenGL 4.5-compatible graphics card for mobile workstations. It is a Maxwell-based GPU built on the GM204 chip with all 2048 shader cores activated and is manufactured in 28 nm at TSMC. Therefore, the GPU is similar to the consumer Nvidia GeForce GTX 980 (Notebook). Compared to the slower and less power hungry Quadro M5000M, the M5500 offers 512 more shaders which should result in 30-40% more performance according to Nvidia.
The Quadro series offers certified drivers that are optimized for stability and performance in professional applications like CAD or DCC. OpenGL performance, for example, should be significantly better compared to GeForce graphics cards of similar specifications.
Using CUDA (Compute Capability 5.2) or OpenCL 1.2 , the cores of the Quadro M5000M can be used for general calculations.
The power consumption of the Quadro M5000M is rated at the same TGP of 150 Watt. Therefore, the card is suited for very large notebooks with 17-inch displays or greater.
The first laptop with the M5500 in it is the MSI WT72 Workstation.
NVIDIA Quadro M3000M ► remove from comparison
The Nvidia Quadro M3000M is a high-end, DirectX 12 (FL_12_1) and OpenGL 4.5-compatible graphics card for mobile workstations. It is a Maxwell-based GPU built on the GM204 chip with 1024 of the 1536 shader cores activated and is manufactured in 28 nm at TSMC. Therefore, the GPU is similar to the consumer Nvidia GeForce GTX 965M . The Quadro M3000M is built for the Intel Skylake generation and is a successor to the Quadro K3100M (Kepler-based). The M3000M usually comes with 4 GB GDDR5 VRAM clocked at 1250 MHz (5000 MHz effective, 160 GB/s opposed to 102.4 GB/s of the K5100M).
The Quadro series offers certified drivers that are optimized for stability and performance in professional applications like CAD or DCC. OpenGL performance, for example, should be significantly better compared to GeForce graphics cards of similar specifications.
Performance
As the exact clock speed of the M3000M is still not known, we can only speculate on the performance of the card. However, it is the mid-range model of the mobile Quadro line in 2015 and based on the same chip as the GeForce GTX 965M. Therefore, it should be clearly faster than the old Quadro K3100M.
Using CUDA (Compute Capability 5.2) or OpenCL 1.2 , the cores of the Quadro M3000M can be used for general calculations.
Power Consumption
The power consumption of the Quadro M3000M is rated at the same TGP of 75 Watt as the K3100M (including the board and memory components). Therefore, the card is suited for large notebooks with 17-inch displays or greater and 25 Watt less than the M4000M and M5000M.
NVIDIA Quadro M1200 ► remove from comparison
The 28 nm Nvidia Quadro M1200 is a mid-range DirectX 12 (FL 11_0) and OpenGL 4.5-compatible graphics card for mobile workstations. It is a (first generation) Maxwell-based GPU built on the GM107 chip with 640 shader cores. Therefore, the GPU is similar to the consumer Nvidia GeForce GTX 960M . The Quadro M1200M is built for the Intel Skylake generation and is the successor to the Quadro M1000M (950M based) .
The Quadro series offers certified drivers that are optimized for stability and performance in professional applications like CAD or DCC. OpenGL performance, for example, should be significantly better compared to GeForce graphics cards of similar specifications.
Performance
The performance of the Quadro M1200 is on a level to the previous generation M2000M which is also based on the 960M. In games it is comparable to the GTX 960M although the driver support is not optimized for gaming.
Using CUDA (Compute Capability 5.0) or OpenCL 1.2 , the cores of the Quadro M2000M can be used for general calculations.
Power Consumption
The power consumption of the Quadro M1200 is rated for the same TGP of 45 Watt (32.5 Watt TDP) and therefore a bit lower than the M2000M with 55 Watt TGP.
NVIDIA Quadro M5500 NVIDIA Quadro M3000M NVIDIA Quadro M1200 Quadro M Series Architecture Maxwell Maxwell Maxwell Pipelines 2048 - unified 1024 - unified 640 - unified Core Speed 1139 - 1140 (Boost) MHz 1050 MHz 991 - 1150 (Boost) MHz Memory Speed 6606 MHz 5000 MHz 5000 MHz Memory Bus Width 256 Bit 256 Bit 128 Bit Memory Type GDDR5 GDDR5 GDDR5 Max. Amount of Memory 8 GB 4 GB 4 GB Shared Memory no no no API DirectX 12_1, OpenGL 4.5 DirectX 12_1, Shader 5.0, OpenGL 4.5 DirectX 12 (FL 11_0), Shader 5.0, OpenGL 4.5 Power Consumption 150 Watt 75 Watt 45 Watt Transistors 5.2 Billion 5.2 Billion 1.9 Billion technology 28 nm 28 nm 28 nm Features CUDA, 3D Vision, PhysX, GeForce Experience, Surround, GameStream, GPU Boost 2.0, Adaptive Vertical Sync, G-SYNC, SLI Optimus,
PhysX, 3D Vision Pro, nView, Optimus Optimus,
PhysX, 3D Vision Pro, nView, Optimus Notebook Size large large large Date of Announcement 04.04.2016 02.10.2015 13.01.2017 Link to Manufacturer Page www.nvidia.com www.nvidia.de Codename N17P-Q1
Benchmarks Performance Rating - 3DMark 11 + Fire Strike + Time Spy - Quadro M3000M
3 pt (9%)
...
...
max:
Performance Rating - 3DMark 11 + Fire Strike + Time Spy - Quadro M1200
1.9 pt (6%)
...
...
max:
3DMark - 3DMark Time Spy Score
1290 Points (4%)
3DMark - 3DMark Ice Storm Unlimited Graphics
240298 Points (27%)
3DMark - 3DMark Ice Storm Extreme Graphics
42129 Points (5%)
3DMark - 3DMark Cloud Gate Score
min: 19732 avg: 21408 median: 21407.5 (23%) max: 23083 Points
min: 12632 avg: 14705 median: 13600 (15%) max: 17884 Points
3DMark - 3DMark Cloud Gate Graphics
min: 38539 avg: 44603 median: 44602.5 (12%) max: 50666 Points
min: 26860 avg: 27557 median: 27557 (7%) max: 28254 Points
3DMark - 3DMark Fire Strike Standard Score
min: 5835 avg: 5972 median: 5971.5 (11%) max: 6108 Points
min: 3759 avg: 3846 median: 3878 (7%) max: 3900 Points
3DMark - 3DMark Fire Strike Standard Graphics
min: 6415 avg: 6537 median: 6536.5 (7%) max: 6658 Points
min: 4118 avg: 4142 median: 4141.5 (5%) max: 4165 Points
3DMark - 3DMark Ice Storm Graphics
min: 42957 avg: 84310 median: 84309.5 (10%) max: 125662 Points
63463 Points (8%)
3DMark 11 - 3DM11 Performance Score
14413 Points (20%)
min: 8493 avg: 8540 median: 8539.5 (12%) max: 8586 Points
min: 5513 avg: 5515 median: 5514.5 (8%) max: 5516 Points
3DMark 11 - 3DM11 Performance GPU
min: 8264 avg: 8289 median: 8288.5 (7%) max: 8313 Points
min: 5105 avg: 5310 median: 5310 (5%) max: 5515 Points
3DMark Vantage + NVIDIA Quadro M3000M 3DMark Vantage - 3DM Vant. Perf. total
27405 Points (8%)
3DM Vant. Perf. GPU no PhysX + NVIDIA Quadro M3000M 3DMark Vantage - 3DM Vant. Perf. GPU no PhysX
27921 Points (16%)
3DMark 06 3DMark 06 - Standard 1280x1024 + NVIDIA Quadro M3000M
min: 26746 avg: 27321 median: 27320.5 (36%) max: 27895 Points
3DMark 06 - Standard 1280x1024 + NVIDIA Quadro M1200
26109 Points (34%)
Unigine Valley 1.0 - Unigine Valley 1.0 DX
min: 37.8 avg: 38.2 median: 38.2 (13%) max: 38.5 fps
27.7 fps (9%)
Unigine Heaven 3.0 - Unigine Heaven 3.0 DX 11
min: 79.3 avg: 80 median: 80 (26%) max: 80.6 fps
30.1 fps (10%)
Unigine Heaven 3.0 - Unigine Heaven 3.0 OpenGL
min: 43.4 avg: 59.8 median: 59.8 (27%) max: 76.2 fps
28.9 fps (13%)
Unigine Heaven 2.1 - Heaven 2.1 high
min: 112.7 avg: 114.5 median: 114.5 (22%) max: 116.2 fps
28.1 fps (5%)
SPECviewperf 11 + NVIDIA Quadro M3000M SPECviewperf 11 - specvp11 snx-01
min: 49.91 avg: 55.8 median: 50 (30%) max: 67.4 fps
specvp11 snx-01 + NVIDIA Quadro M1200
43.9 fps (26%)
specvp11 tcvis-02 + NVIDIA Quadro M3000M SPECviewperf 11 - specvp11 tcvis-02
min: 41.16 avg: 50.2 median: 53 (30%) max: 56.3 fps
specvp11 tcvis-02 + NVIDIA Quadro M1200
44.2 fps (25%)
specvp11 sw-02 + NVIDIA Quadro M3000M SPECviewperf 11 - specvp11 sw-02
min: 35.28 avg: 45.1 median: 48 (37%) max: 52 fps
specvp11 sw-02 + NVIDIA Quadro M1200
56.4 fps (43%)
specvp11 proe-05 + NVIDIA Quadro M3000M SPECviewperf 11 - specvp11 proe-05
min: 16.08 avg: 19.5 median: 20 (24%) max: 22.46 fps
specvp11 proe-05 + NVIDIA Quadro M1200
22 fps (26%)
specvp11 maya-03 + NVIDIA Quadro M3000M SPECviewperf 11 - specvp11 maya-03
min: 57 avg: 66.9 median: 57.8 (44%) max: 86 fps
specvp11 maya-03 + NVIDIA Quadro M1200
57.2 fps (43%)
specvp11 lightwave-01 + NVIDIA Quadro M3000M SPECviewperf 11 - specvp11 lightwave-01
min: 35.34 avg: 47.4 median: 51.9 (56%) max: 55 fps
specvp11 lightwave-01 + NVIDIA Quadro M1200
57.8 fps (62%)
specvp11 ensight-04 + NVIDIA Quadro M3000M SPECviewperf 11 - specvp11 ensight-04
min: 59 avg: 59.2 median: 59.1 (28%) max: 59.5 fps
specvp11 ensight-04 + NVIDIA Quadro M1200
46.7 fps (22%)
specvp11 catia-03 + NVIDIA Quadro M3000M SPECviewperf 11 - specvp11 catia-03
min: 43.12 avg: 49.5 median: 52 (27%) max: 53.4 fps
specvp11 catia-03 + NVIDIA Quadro M1200
53.3 fps (28%)
SPECviewperf 12 + NVIDIA Quadro M5500 SPECviewperf 12 - specvp12 sw-03
144 fps (36%)
specvp12 sw-03 + NVIDIA Quadro M3000M
min: 52.3 avg: 76.4 median: 84.8 (21%) max: 92 fps
specvp12 sw-03 + NVIDIA Quadro M1200
min: 69 avg: 72.5 median: 70 (17%) max: 78.4 fps
specvp12 snx-02 + NVIDIA Quadro M5500 SPECviewperf 12 - specvp12 snx-02
120 fps (18%)
specvp12 snx-02 + NVIDIA Quadro M3000M
min: 39.84 avg: 52.5 median: 52 (8%) max: 65.8 fps
specvp12 snx-02 + NVIDIA Quadro M1200
min: 34.18 avg: 35 median: 34.7 (5%) max: 36 fps
specvp12 showcase-01 + NVIDIA Quadro M5500 SPECviewperf 12 - specvp12 showcase-01
60.3 fps (13%)
specvp12 showcase-01 + NVIDIA Quadro M3000M
min: 37 avg: 40.2 median: 39.8 (9%) max: 43.81 fps
specvp12 showcase-01 + NVIDIA Quadro M1200
min: 22.17 avg: 24.8 median: 26 (6%) max: 26.2 fps
specvp12 mediacal-01 + NVIDIA Quadro M5500 SPECviewperf 12 - specvp12 mediacal-01
53.8 fps (14%)
specvp12 mediacal-01 + NVIDIA Quadro M3000M
min: 17.46 avg: 20.6 median: 22 (6%) max: 22.34 fps
specvp12 mediacal-01 + NVIDIA Quadro M1200
min: 17.49 avg: 17.8 median: 17.8 (5%) max: 18 fps
specvp12 maya-04 + NVIDIA Quadro M5500 SPECviewperf 12 - specvp12 maya-04
95 fps (26%)
specvp12 maya-04 + NVIDIA Quadro M3000M
min: 23.08 avg: 44.8 median: 50.4 (14%) max: 61 fps
specvp12 maya-04 + NVIDIA Quadro M1200
min: 32.07 avg: 34.4 median: 33.7 (9%) max: 37.29 fps
specvp12 energy-01 + NVIDIA Quadro M5500 SPECviewperf 12 - specvp12 energy-01
12.2 fps (11%)
specvp12 energy-01 + NVIDIA Quadro M3000M
min: 4.68 avg: 4.8 median: 4.8 (4%) max: 4.85 fps
specvp12 energy-01 + NVIDIA Quadro M1200
min: 3.78 avg: 3.8 median: 3.9 (3%) max: 3.9 fps
specvp12 creo-01 + NVIDIA Quadro M5500 SPECviewperf 12 - specvp12 creo-01
110 fps (44%)
specvp12 creo-01 + NVIDIA Quadro M3000M
min: 42.17 avg: 57.7 median: 64.8 (26%) max: 66 fps
specvp12 creo-01 + NVIDIA Quadro M1200
min: 45 avg: 46 median: 46.1 (18%) max: 46.97 fps
specvp12 catia-04 + NVIDIA Quadro M5500 SPECviewperf 12 - specvp12 catia-04
137 fps (23%)
specvp12 catia-04 + NVIDIA Quadro M3000M
min: 45.24 avg: 66.7 median: 77 (13%) max: 77.9 fps
specvp12 catia-04 + NVIDIA Quadro M1200
min: 45.75 avg: 46.2 median: 45.9 (8%) max: 47 fps
specvp12 3dsmax-05 + NVIDIA Quadro M1200 SPECviewperf 12 - specvp12 3dsmax-05
46 fps (8%)
Cinebench R10 Cinebench R10 Shading (32bit) + NVIDIA Quadro M3000M Cinebench R10 - Cinebench R10 Shading (32bit)
min: 4455 avg: 5650 median: 5649.5 (4%) max: 6844 Points
Cinebench R11.5 Cinebench R11.5 OpenGL 64 Bit + NVIDIA Quadro M3000M Cinebench R11.5 - Cinebench R11.5 OpenGL 64 Bit
min: 42.4 avg: 71.1 median: 71.1 (25%) max: 99.7 fps
Cinebench R11.5 OpenGL 64 Bit + NVIDIA Quadro M1200
102.2 fps (35%)
Cinebench R15 + NVIDIA Quadro M5500 Cinebench R15 - Cinebench R15 OpenGL 64 Bit
106.7 fps (6%)
Cinebench R15 OpenGL 64 Bit + NVIDIA Quadro M3000M
min: 68 avg: 92.1 median: 92.1 (5%) max: 116.1 fps
Cinebench R15 OpenGL 64 Bit + NVIDIA Quadro M1200
min: 102.8 avg: 108.2 median: 108.2 (6%) max: 113.5 fps
Cinebench R15 OpenGL Ref. Match 64 Bit + NVIDIA Quadro M3000M Cinebench R15 - Cinebench R15 OpenGL Ref. Match 64 Bit
99.6 % (100%)
Cinebench R15 OpenGL Ref. Match 64 Bit + NVIDIA Quadro M1200
99.6 % (100%)
GFXBench 3.0 - GFXBench 3.0 Manhattan Offscreen
249.9 fps (15%)
LuxMark v2.0 64Bit - LuxMark v2.0 Room GPU
min: 1258 avg: 1273 median: 1273 (6%) max: 1288 Samples/s
min: 656 avg: 818 median: 817.5 (4%) max: 979 Samples/s
LuxMark v2.0 64Bit - LuxMark v2.0 Sala GPU
min: 2234 avg: 2261 median: 2261 (4%) max: 2288 Samples/s
min: 852 avg: 1207 median: 1207 (2%) max: 1562 Samples/s
ComputeMark v2.1 - ComputeMark v2.1 Result
4737 Points (5%)
388 Points (0%)
Power Consumption - Witcher 3 Power Consumption *
min: 74.8 avg: 87.5 median: 87.5 (19%) max: 100.2 Watt
Power Consumption - Witcher 3 ultra Power Efficiency
0.2 fps per Watt (17%)
Emissions Witcher 3 Fan Noise + NVIDIA Quadro M1200 Emissions - Witcher 3 Fan Noise
min: 42.3 avg: 43.9 median: 43.9 (70%) max: 45.5 dB(A)
Average Benchmarks NVIDIA Quadro M5500 → 100% n=10 Average Benchmarks NVIDIA Quadro M3000M → 56% n=10 Average Benchmarks NVIDIA Quadro M1200 → 44% n=10
- Range of benchmark values for this graphics card
- Average benchmark values for this graphics card
* Smaller numbers mean a higher performance
1 This benchmark is not used for the average calculation
Game Benchmarks The following benchmarks stem from our benchmarks of review laptops. The performance depends on the used graphics memory, clock rate, processor, system settings, drivers, and operating systems. So the results don't have to be representative for all laptops with this GPU. For detailed information on the benchmark results, click on the fps number.
Quadro M3000M:
179 [X] SCHENKER W706 Intel Core i7-6700 3.4GHz
Quadro M3000M
fps
Quadro M3000M:
123 [X] SCHENKER W706 Intel Core i7-6700 3.4GHz
Quadro M3000M
fps
Quadro M3000M:
58 [X] SCHENKER W706 Intel Core i7-6700 3.4GHz
Quadro M3000M
fps
Quadro M3000M:
21 [X] SCHENKER W706 Intel Core i7-6700 3.4GHz
Quadro M3000M
fps
Quadro M3000M:
122 [X] SCHENKER W706 Intel Core i7-6700 3.4GHz
Quadro M3000M
fps
Quadro M3000M:
122 [X] SCHENKER W706 Intel Core i7-6700 3.4GHz
Quadro M3000M
fps
Quadro M3000M:
122 [X] SCHENKER W706 Intel Core i7-6700 3.4GHz
Quadro M3000M
fps
Quadro M3000M:
120 [X] SCHENKER W706 Intel Core i7-6700 3.4GHz
Quadro M3000M
fps
Quadro M3000M:
94 [X] SCHENKER W706 Intel Core i7-6700 3.4GHz
Quadro M3000M
fps
Quadro M3000M:
87 [X] SCHENKER W706 Intel Core i7-6700 3.4GHz
Quadro M3000M
fps
Quadro M3000M:
69 [X] SCHENKER W706 Intel Core i7-6700 3.4GHz
Quadro M3000M
fps
Quadro M3000M:
45 [X] SCHENKER W706 Intel Core i7-6700 3.4GHz
Quadro M3000M
fps
Quadro M3000M:
200 [X] SCHENKER W706 Intel Core i7-6700 3.4GHz
Quadro M3000M
fps
Quadro M3000M:
125 [X] SCHENKER W706 Intel Core i7-6700 3.4GHz
Quadro M3000M
fps
Quadro M3000M:
68 [X] SCHENKER W706 Intel Core i7-6700 3.4GHz
Quadro M3000M
fps
Quadro M3000M:
54 [X] SCHENKER W706 Intel Core i7-6700 3.4GHz
Quadro M3000M
fps
Quadro M3000M:
380 [X] SCHENKER W706 Intel Core i7-6700 3.4GHz
Quadro M3000M
fps
Quadro M3000M:
186 [X] SCHENKER W706 Intel Core i7-6700 3.4GHz
Quadro M3000M
fps
Quadro M3000M:
151 [X] SCHENKER W706 Intel Core i7-6700 3.4GHz
Quadro M3000M
fps
Quadro M3000M:
81 [X] SCHENKER W706 Intel Core i7-6700 3.4GHz
Quadro M3000M
fps
Quadro M3000M:
349 [X] SCHENKER W706 Intel Core i7-6700 3.4GHz
Quadro M3000M
fps
Quadro M3000M:
271 [X] SCHENKER W706 Intel Core i7-6700 3.4GHz
Quadro M3000M
fps
Quadro M3000M:
217 [X] SCHENKER W706 Intel Core i7-6700 3.4GHz
Quadro M3000M
fps
Quadro M3000M:
40 [X] SCHENKER W706 Intel Core i7-6700 3.4GHz
Quadro M3000M
fps
Quadro M3000M:
66 [X] SCHENKER W706 Intel Core i7-6700 3.4GHz
Quadro M3000M
fps
Quadro M3000M:
66 [X] SCHENKER W706 Intel Core i7-6700 3.4GHz
Quadro M3000M
fps
Quadro M3000M:
57 [X] SCHENKER W706 Intel Core i7-6700 3.4GHz
Quadro M3000M
fps
Quadro M3000M:
25 [X] SCHENKER W706 Intel Core i7-6700 3.4GHz
Quadro M3000M
fps
NVIDIA Quadro M1200 low med. high ultra QHD 4K Doom 79 66 37 34 12 Rise of the Tomb Raider 88.1 49.15 28.36 23.92 9.88 Batman: Arkham Knight 74 63 35 29 11 The Witcher 3 73.6 45.9 28 13 Thief 93.3 58.9 50.1 26.2 BioShock Infinite 207 134 119 45 < 30 fps < 60 fps < 120 fps ≥ 120 fps 5 1 3 2 1 2 3 1 4 2 3
NVIDIA Quadro M3000M low med. high ultra QHD 4K Rise of the Tomb Raider 114.9 69.9 40.2 33.4 Rainbow Six Siege 146.8 76.8 54.5 23.8 Just Cause 3 85.6 50.4 43.7 17.8 Star Wars Battlefront 124.5 59.4 50.9 17.8 Anno 2205 179 123 58 21 The Witcher 3 122.7 74 42 22 14.1 Dirt Rally 108.6 89.6 53.6 39.2 GTA V 136.1 69.1 29.7 35.3 F1 2014 122 122 122 120 Ryse: Son of Rome 94 87 69 45 Middle-earth: Shadow of Mordor 200 125 68 54 GRID: Autosport 380 186 151 81 Thief 88.6 77.4 43.1 Total War: Rome II 349 271 217 40 Company of Heroes 2 66 66 57 25 Metro: Last Light 124.5 82.9 44.6 BioShock Infinite 226.3 179 165 70 Tomb Raider 255.1 185 82.1 < 30 fps < 60 fps < 120 fps ≥ 120 fps 3 7 7 11 6 7 5 4 10 3 1 4 2
For more games that might be playable and a list of all games and graphics cards visit our Gaming List
v1.26
log 25. 00:32:34
#0 checking url part for id 7282 +0s ... 0s
#1 checking url part for id 6507 +0s ... 0s
#2 checking url part for id 7704 +0s ... 0s
#3 not redirecting to Ajax server +0s ... 0s
#4 did not recreate cache, as it is less than 5 days old! Created at Mon, 22 Apr 2024 05:40:21 +0200 +0.001s ... 0.001s
#5 composed specs +0.155s ... 0.156s
#6 did output specs +0s ... 0.156s
#7 start showIntegratedCPUs +0s ... 0.156s
#8 getting avg benchmarks for device 7282 +0.035s ... 0.191s
#9 got single benchmarks 7282 +0.008s ... 0.199s
#10 getting avg benchmarks for device 6507 +0.019s ... 0.218s
#11 got single benchmarks 6507 +0.012s ... 0.23s
#12 getting avg benchmarks for device 7704 +0.019s ... 0.249s
#13 got single benchmarks 7704 +0.016s ... 0.266s
#14 got avg benchmarks for devices +0s ... 0.266s
#15 min, max, avg, median took s +0.327s ... 0.592s
#16 before gaming benchmark output +0s ... 0.592s
#17 Got 108 rows for game benchmarks. +0.011s ... 0.603s
#18 composed SQL query for gamebenchmarks +0s ... 0.603s
#19 got data and put it in $dataArray +0.016s ... 0.619s
#20 benchmarks composed for output. +0.048s ... 0.667s
#21 calculated avg scores. +0s ... 0.667s
#22 return log +0.002s ... 0.669s
Please share our article, every link counts!
Redaktion, 2017-09- 8 (Update: 2023-07- 1)
 Deutsch
 English
 Español
 Français
 Italiano
 Nederlands
 Polski
 Português
 Русский
 Türkçe
 Svenska
 Chinese
 Magyar