Notebookcheck Logo

NVIDIA Quadro M4000M vs NVIDIA Quadro M2200 vs NVIDIA Quadro 2000M

NVIDIA Quadro M4000M

► remove from comparison NVIDIA Quadro M4000M

The Nvidia Quadro M4000M is a high-end, DirectX 12 (FL_12_1) and OpenGL 4.5-compatible graphics card for mobile workstations. It is a Maxwell-based GPU built on the GM204 chip with all 1280 of the 1536 shader cores activated and is manufactured in 28 nm at TSMC. Therefore, the GPU is similar to the consumer Nvidia GeForce GTX 970M. The Quadro M4000M is built for the Intel Skylake generation and is a successor to the Quadro K4100M (Kepler-based). The M4000M usually comes with 4 GB GDDR5 VRAM clocked at 1250 MHz (5000 MHz effective, 160 GB/s opposed to 102.4 GB/s of the K4100M). 

The Quadro series offers certified drivers that are optimized for stability and performance in professional applications like CAD or DCC. OpenGL performance, for example, should be significantly better compared to GeForce graphics cards of similar specifications.

Performance

The clock speeds of the Quadro M4000M are very similar to the GTX 970M based on the same chip. The base clock is slightly higher with 975 versus 924 MHz but the Boost speed is lower at 1013 versus 1038 MHz. Therefore, with good cooling the GTX 970M should be slightly faster. Compared to the Quadro line-up, it is the second fastest Quadro card in 2015 and therefore clearly faster than the old Quadro K4100M.

Using CUDA (Compute Capability 5.2) or OpenCL 1.2, the cores of the Quadro M4000M can be used for general calculations.

Power Consumption

The power consumption of the Quadro M4000M is rated at the same TGP of 100 Watt as the M5000M and older K5100M/K4100M (including the board and memory components). Therefore, the card is suited for large notebooks with 17-inch displays or greater.

NVIDIA Quadro M2200

► remove from comparison NVIDIA Quadro M2200

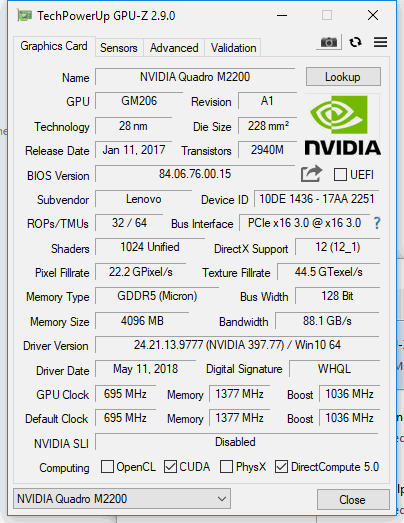
The Nvidia Quadro M2200 is a mid-range DirectX 12 (FL 12_1) and OpenGL 4.5-compatible graphics card for mobile workstations. It is a Maxwell-based GPU built most likely on the GM206 chip with 1024 shader cores. Therefore, the GPU is similar to the consumer Nvidia GeForce GTX 965M (second generation). The Quadro M2200M is built for the Intel Kaby Lake generation.

The Quadro series offers certified drivers that are optimized for stability and performance in professional applications like CAD or DCC. OpenGL performance, for example, should be significantly better compared to GeForce graphics cards of similar specifications.

Performance

The maximum core clock of the Quadro M2200 is 1038 MHz. The performance is between the old Quadro M2000M and Quadro M3000M, but generally closer to the latter (sometimes even on par). It is not surprising that the gaming performance is comparable to the Nvidia GeForce GTX 965M (Ti) and it is just behind the new GeForce GTX 1050 (Pascal).

Using CUDA (Compute Capability 5.0) or OpenCL 1.2, the cores of the Quadro M2200 can be used for general calculations.

Power Consumption

The power consumption of the Quadro M2200 is rated at a TGP of 55 Watt (39.1 Watt TDP) – similar to the previous Quadro M2000M – and therefore best suited for 15-inch laptops and up.

NVIDIA Quadro 2000M

► remove from comparison

The NVIDIA Quadro 2000M is a professional workstation graphics card based on the Fermi architecture (likely the GF104 or GF106). It offers the same amount of shaders like the GeForce GTX 460M, but only a 128 Bit memory bus for DDR3 memory. The slow DDR3 memory in particular could be a bottleneck to the GPU

The Quadro series offers certified drivers that are optimized for stability and performance in professional applications like CAD, DCC, medicine, or visualisation areas. OpenGL performance, for example, should be significantly better than GeForce graphics cards of similar specifications.

The shader/CUDA cores can be accessed using DirectX 11 or OpenGL 4.1 for graphics rendering and DirectCompute, OpenCL, AXE, and CUDA for general purpose calculations. Due to the new Fermi core, the 2000M should offer high performance in general purpose calculations.

Furthermore, the Nvidia Quadro 2000M is compatible with the new stereoscopic solution by Nvidia, NVIDIA 3D Vision Pro.

To automatically switch between the processor graphics card and the Quadro, the 2000M supports Nvidia Optimus. The implementation of the technology into specific notebook models is dependent on the laptop vendor.

The Quadro 2000M is specified at 55 Watt TDP and is therefore best suited for 15.6" or greater laptops.

NVIDIA Quadro M4000MNVIDIA Quadro M2200NVIDIA Quadro 2000M
Quadro M Series
Quadro M5500 2048 @ 1.14 - 1.14 GHz256 Bit @ 6606 MHz
Quadro M5000M 1536 @ 0.96 - 1.05 GHz256 Bit @ 5000 MHz
Quadro M4000M 1280 @ 0.98 - 1.01 GHz256 Bit @ 5012 MHz
Quadro M3000M 1024 @ 1.05 GHz256 Bit @ 5000 MHz
Quadro M2200 1024 @ 0.69 - 1.04 GHz128 Bit @ 5508 MHz
Quadro M1200 640 @ 0.99 - 1.15 GHz128 Bit @ 5000 MHz
Quadro M2000M 640 @ 1.04 - 1.2 GHz128 Bit @ 5000 MHz
Quadro M1000M 512 @ 0.99 - 1.07 GHz128 Bit @ 5000 MHz
Quadro M620 512 @ 1.02 GHz128 Bit @ 5012 MHz
Quadro 5010M 384 @ 0.45 GHz256 Bit @ 1300 MHz
Quadro 4000M 336 @ 0.48 GHz256 Bit @ 1200 MHz
Quadro M520 384 @ 0.76 - 1.02 GHz64 Bit
Quadro M600M 384 @ 0.84 - 0.88 GHz128 Bit @ 5012 MHz
Quadro M500M 384 @ 1.03 - 1.12 GHz64 Bit @ 4004 MHz
Quadro 5000M 320 @ 0.41 GHz256 Bit @ 1200 MHz
Quadro 3000M 240 @ 0.45 GHz256 Bit @ 625 MHz
Quadro 2000M 192 @ 0.55 GHz128 Bit @ 900 MHz
Quadro 1000M 96 @ 0.7 GHz128 Bit @ 900 MHz
ArchitectureMaxwellMaxwellFermi
Pipelines1280 - unified1024 - unified192 - unified
Core Speed975 - 1013 (Boost) MHz694 - 1038 (Boost) MHz550 MHz
Memory Speed5012 MHz5508 MHz900 MHz
Memory Bus Width256 Bit128 Bit128 Bit
Memory TypeGDDR5GDDR5DDR3
Max. Amount of Memory4 GB4 GB2048 MB
Shared Memorynonono
APIDirectX 12_1, Shader 5.0, OpenGL 4.5DirectX 12_1, Shader 5.0, OpenGL 4.5DirectX 11, Shader 5.0
Power Consumption100 Watt55 Watt55 Watt
Transistors5.2 Billion4.9 Billion
technology28 nm28 nm40 nm
FeaturesOptimus, PhysX, 3D Vision Pro, nView, OptimusOptimus, PhysX, 3D Vision Pro, nView, OptimusOpenGl 4.1, FP32
Notebook Sizelargelargemedium sized
Date of Announcement02.10.2015 13.01.2017 22.02.2011
Link to Manufacturer Pagewww.nvidia.comwww.nvidia.de
CodenameN17P-Q3Fermi
Shader Speed1100 MHz

Benchmarks

Performance Rating - 3DMark 11 + Fire Strike + Time Spy - Quadro M4000M
3.5 pt (11%)
Performance Rating - 3DMark 11 + Fire Strike + Time Spy - Quadro M2200
2.7 pt (8%)
3DMark - 3DMark Time Spy Score
min: 1845     avg: 1889     median: 1903 (5%)     max: 1920 Points
3DMark - 3DMark Time Spy Graphics
min: 1699     avg: 1724     median: 1724 (5%)     max: 1750 Points
3DMark - 3DMark Ice Storm Unlimited Graphics
min: 280203     avg: 289176     median: 289176 (33%)     max: 298148 Points
3DMark - 3DMark Ice Storm Extreme Graphics
176003 Points (23%)
3DMark - 3DMark Cloud Gate Score
min: 13452     avg: 17686     median: 17686 (19%)     max: 21920 Points
min: 20388     avg: 21012     median: 20644 (22%)     max: 22003 Points
3DMark - 3DMark Cloud Gate Graphics
49204 Points (13%)
min: 36877     avg: 37505     median: 37796 (10%)     max: 37841 Points
3DMark - 3DMark Fire Strike Standard Score
6937 Points (12%)
min: 5232     avg: 5253     median: 5252 (9%)     max: 5275 Points
3DMark - 3DMark Fire Strike Standard Graphics
7723 Points (9%)
min: 5786     avg: 5835     median: 5850 (7%)     max: 5869 Points
3DMark - 3DMark Ice Storm Graphics
218874 Points (26%)
min: 127867     avg: 195445     median: 195444 (23%)     max: 263022 Points
3DMark 11 - 3DM11 Performance Score
min: 9042     avg: 9296     median: 9295.5 (13%)     max: 9549 Points
min: 7453     avg: 7581     median: 7581 (11%)     max: 7709 Points
min: 1416     avg: 1422     median: 1421 (2%)     max: 1428 Points
3DMark 11 - 3DM11 Performance GPU
10259 Points (9%)
min: 7319     avg: 7372     median: 7372 (6%)     max: 7425 Points
min: 1259     avg: 1261     median: 1261 (1%)     max: 1263 Points
3DMark Vantage
3DM Vant. Perf. total + NVIDIA Quadro M2200
3DMark Vantage - 3DM Vant. Perf. total
24622 Points (7%)
3DM Vant. Perf. total + NVIDIA Quadro 2000M
min: 6608     avg: 6634     median: 6633.5 (2%)     max: 6659 Points
3DM Vant. Perf. GPU no PhysX + NVIDIA Quadro M2200
3DMark Vantage - 3DM Vant. Perf. GPU no PhysX
24915 Points (14%)
3DM Vant. Perf. GPU no PhysX + NVIDIA Quadro 2000M
min: 5391     avg: 5411     median: 5410.5 (3%)     max: 5430 Points
3DMark 05 - 3DMark 05 - Standard
21287 Points (23%)
3DMark 06 3DMark 06 - Standard 1280x1024 + NVIDIA Quadro M2200
3DMark 06
min: 26834     avg: 28150     median: 28149.5 (37%)     max: 29465 Points
3DMark 06 - Standard 1280x1024 + NVIDIA Quadro 2000M
min: 11575     avg: 11659     median: 11656 (15%)     max: 11747 Points
Unigine Valley 1.0 - Unigine Valley 1.0 DX
min: 23.2     avg: 26.4     median: 27.9 (9%)     max: 28.1 fps
Unigine Heaven 2.1 - Heaven 2.1 high
min: 14.1     avg: 17     median: 17 (3%)     max: 19.8 fps
SPECviewperf 11
specvp11 snx-01 + NVIDIA Quadro M4000M
SPECviewperf 11 - specvp11 snx-01
111.4 fps (66%)
specvp11 snx-01 + NVIDIA Quadro M2200
min: 48.26     avg: 48.9     median: 48.9 (29%)     max: 49.48 fps
specvp11 snx-01 + NVIDIA Quadro 2000M
min: 19.28     avg: 19.3     median: 19.3 (12%)     max: 19.32 fps
specvp11 tcvis-02 + NVIDIA Quadro M4000M
SPECviewperf 11 - specvp11 tcvis-02
58.1 fps (33%)
specvp11 tcvis-02 + NVIDIA Quadro M2200
min: 49.11     avg: 51     median: 51 (29%)     max: 52.9 fps
specvp11 tcvis-02 + NVIDIA Quadro 2000M
min: 22.13     avg: 22.3     median: 22.3 (13%)     max: 22.52 fps
specvp11 sw-02 + NVIDIA Quadro M4000M
SPECviewperf 11 - specvp11 sw-02
61.3 fps (47%)
specvp11 sw-02 + NVIDIA Quadro M2200
min: 42.66     avg: 49.7     median: 49.7 (38%)     max: 56.8 fps
specvp11 sw-02 + NVIDIA Quadro 2000M
min: 32.8     avg: 33.1     median: 33.1 (25%)     max: 33.4 fps
specvp11 proe-05 + NVIDIA Quadro M4000M
SPECviewperf 11 - specvp11 proe-05
18.8 fps (22%)
specvp11 proe-05 + NVIDIA Quadro M2200
min: 16.23     avg: 19.2     median: 19.2 (23%)     max: 22.18 fps
specvp11 proe-05 + NVIDIA Quadro 2000M
min: 9.45     avg: 9.6     median: 9.6 (11%)     max: 9.83 fps
specvp11 maya-03 + NVIDIA Quadro M4000M
SPECviewperf 11 - specvp11 maya-03
109.2 fps (82%)
specvp11 maya-03 + NVIDIA Quadro M2200
min: 56.6     avg: 57.2     median: 57.2 (43%)     max: 57.7 fps
specvp11 maya-03 + NVIDIA Quadro 2000M
min: 45.28     avg: 45.6     median: 45.6 (34%)     max: 45.96 fps
specvp11 lightwave-01 + NVIDIA Quadro M4000M
SPECviewperf 11 - specvp11 lightwave-01
76.3 fps (82%)
specvp11 lightwave-01 + NVIDIA Quadro M2200
min: 47.95     avg: 52.7     median: 52.7 (57%)     max: 57.5 fps
specvp11 lightwave-01 + NVIDIA Quadro 2000M
min: 40.8     avg: 41.9     median: 41.9 (45%)     max: 42.93 fps
specvp11 ensight-04 + NVIDIA Quadro M4000M
SPECviewperf 11 - specvp11 ensight-04
110.2 fps (53%)
specvp11 ensight-04 + NVIDIA Quadro M2200
min: 55.7     avg: 57.1     median: 57.1 (27%)     max: 58.5 fps
specvp11 ensight-04 + NVIDIA Quadro 2000M
min: 17.84     avg: 17.9     median: 17.9 (9%)     max: 17.96 fps
specvp11 catia-03 + NVIDIA Quadro M4000M
SPECviewperf 11 - specvp11 catia-03
82.3 fps (43%)
specvp11 catia-03 + NVIDIA Quadro M2200
min: 48.49     avg: 50.6     median: 50.6 (27%)     max: 52.7 fps
specvp11 catia-03 + NVIDIA Quadro 2000M
min: 27.08     avg: 27.4     median: 27.4 (14%)     max: 27.69 fps
SPECviewperf 12
specvp12 sw-03 + NVIDIA Quadro M4000M
SPECviewperf 12 - specvp12 sw-03
min: 80     avg: 88.6     median: 88.6 (22%)     max: 97.1 fps
specvp12 sw-03 + NVIDIA Quadro M2200
min: 85.3     avg: 90.3     median: 86.2 (21%)     max: 99.5 fps
specvp12 snx-02 + NVIDIA Quadro M4000M
SPECviewperf 12 - specvp12 snx-02
min: 92     avg: 109.9     median: 109.9 (16%)     max: 127.8 fps
specvp12 snx-02 + NVIDIA Quadro M2200
min: 57.7     avg: 58.3     median: 58.1 (9%)     max: 59 fps
specvp12 showcase-01 + NVIDIA Quadro M4000M
SPECviewperf 12 - specvp12 showcase-01
min: 40.33     avg: 44.5     median: 44.5 (10%)     max: 48.6 fps
specvp12 showcase-01 + NVIDIA Quadro M2200
min: 31.14     avg: 32.2     median: 32.8 (7%)     max: 32.8 fps
specvp12 mediacal-01 + NVIDIA Quadro M4000M
SPECviewperf 12 - specvp12 mediacal-01
min: 26.06     avg: 27.2     median: 27.2 (7%)     max: 28.4 fps
specvp12 mediacal-01 + NVIDIA Quadro M2200
min: 20.34     avg: 23.6     median: 24.6 (6%)     max: 25.66 fps
specvp12 maya-04 + NVIDIA Quadro M4000M
SPECviewperf 12 - specvp12 maya-04
min: 47.6     avg: 55.8     median: 55.8 (15%)     max: 64 fps
specvp12 maya-04 + NVIDIA Quadro M2200
min: 46.93     avg: 47.4     median: 46.9 (13%)     max: 48.34 fps
specvp12 energy-01 + NVIDIA Quadro M4000M
SPECviewperf 12 - specvp12 energy-01
min: 6.04     avg: 6.5     median: 6.5 (6%)     max: 6.9 fps
specvp12 energy-01 + NVIDIA Quadro M2200
min: 4.28     avg: 4.9     median: 5.2 (5%)     max: 5.26 fps
specvp12 creo-01 + NVIDIA Quadro M4000M
SPECviewperf 12 - specvp12 creo-01
min: 58.3     avg: 68.4     median: 68.4 (27%)     max: 78.4 fps
specvp12 creo-01 + NVIDIA Quadro M2200
min: 68.2     avg: 69.3     median: 68.5 (27%)     max: 71.2 fps
specvp12 catia-04 + NVIDIA Quadro M4000M
SPECviewperf 12 - specvp12 catia-04
min: 71     avg: 79.6     median: 79.6 (13%)     max: 88.1 fps
specvp12 catia-04 + NVIDIA Quadro M2200
min: 71.4     avg: 72.2     median: 72 (12%)     max: 73.2 fps
Windows 7 Experience Index - Win7 Gaming graphics
6.9 Points (87%)
Windows 7 Experience Index - Win7 Graphics
6.9 Points (87%)
Cinebench R10 Cinebench R10 Shading (32bit) + NVIDIA Quadro M2200
Cinebench R10 - Cinebench R10 Shading (32bit)
6833 Points (5%)
Cinebench R10 Shading (32bit) + NVIDIA Quadro 2000M
5671 Points (4%)
Cinebench R11.5 Cinebench R11.5 OpenGL 64 Bit + NVIDIA Quadro M4000M
Cinebench R11.5 - Cinebench R11.5 OpenGL 64 Bit
89.3 fps (31%)
Cinebench R11.5 OpenGL 64 Bit + NVIDIA Quadro M2200
88.6 fps (31%)
Cinebench R11.5 OpenGL 64 Bit + NVIDIA Quadro 2000M
min: 38.3     avg: 38.4     median: 38.4 (13%)     max: 38.44 fps
Cinebench R15
Cinebench R15 OpenGL 64 Bit + NVIDIA Quadro M4000M
Cinebench R15 - Cinebench R15 OpenGL 64 Bit
93.2 fps (5%)
Cinebench R15 OpenGL 64 Bit + NVIDIA Quadro M2200
min: 102.9     avg: 107.4     median: 103.9 (6%)     max: 115.5 fps
Cinebench R15 OpenGL Ref. Match 64 Bit + NVIDIA Quadro M4000M
Cinebench R15 - Cinebench R15 OpenGL Ref. Match 64 Bit
99.6 % (100%)
Cinebench R15 OpenGL Ref. Match 64 Bit + NVIDIA Quadro M2200
99.6 % (100%)
GFXBench - GFXBench Car Chase Offscreen
110.7 fps (12%)
GFXBench 3.1 - GFXBench Manhattan ES 3.1 Offscreen
163.7 fps (3%)
GFXBench 3.0 - GFXBench 3.0 Manhattan Offscreen
219.1 fps (13%)
GFXBench (DX / GLBenchmark) 2.7
GFXBench T-Rex HD Offscreen C24Z16 + NVIDIA Quadro M2200
GFXBench (DX / GLBenchmark) 2.7 - GFXBench T-Rex HD Offscreen C24Z16
432 fps (3%)
LuxMark v2.0 64Bit - LuxMark v2.0 Room GPU
min: 1204     avg: 1276     median: 1306 (6%)     max: 1318 Samples/s
LuxMark v2.0 64Bit - LuxMark v2.0 Sala GPU
min: 2086     avg: 2097     median: 2099 (4%)     max: 2107 Samples/s
ComputeMark v2.1 - ComputeMark v2.1 Result
5686 Points (6%)
4332 Points (5%)
Power Consumption - Furmark Stress Test Power Consumption - external Monitor *
68.5 Watt (10%)
Power Consumption - The Witcher 3 Power Consumption - external Monitor *
89.2 Watt (12%)
Power Consumption - Witcher 3 Power Consumption *
87.7 Watt (19%)
Power Consumption - Witcher 3 ultra Power Efficiency
0.2 fps per Watt (20%)
Power Consumption - Witcher 3 ultra Power Efficiency - external Monitor
0.2 fps per Watt (19%)
Emissions Witcher 3 Fan Noise + NVIDIA Quadro M2200
Emissions - Witcher 3 Fan Noise
39.5 dB(A) (63%)

Average Benchmarks NVIDIA Quadro M4000M → 100% n=11

Average Benchmarks NVIDIA Quadro M2200 → 73% n=11

Average Benchmarks NVIDIA Quadro 2000M → 34% n=11

- Range of benchmark values for this graphics card
- Average benchmark values for this graphics card
* Smaller numbers mean a higher performance
1 This benchmark is not used for the average calculation

Game Benchmarks

The following benchmarks stem from our benchmarks of review laptops. The performance depends on the used graphics memory, clock rate, processor, system settings, drivers, and operating systems. So the results don't have to be representative for all laptops with this GPU. For detailed information on the benchmark results, click on the fps number.

low 1280x720
Quadro M2200:
83.4  fps
med. 1920x1080
Quadro M2200:
37.1  fps
high 1920x1080
Quadro M2200:
33.7  fps
ultra 1920x1080
Quadro M2200:
17.6  fps
For Honor

For Honor

2017
low 1280x720
Quadro M2200:
78  fps
med. 1920x1080
Quadro M2200:
52.3 54.8 ~ 54 fps
high 1920x1080
Quadro M2200:
50.5 51.9 ~ 51 fps
ultra 1920x1080
Quadro M2200:
36.2 37.5 ~ 37 fps
4K 3840x2160
Quadro M2200:
14.6  fps
low 1280x720
Quadro M2200:
139.4  fps
med. 1366x768
Quadro M2200:
105.3  fps
high 1920x1080
Quadro M2200:
47.1  fps
ultra 1920x1080
Quadro M2200:
42  fps
low 1024x768
Quadro M2200:
123 128.7 ~ 126 fps
med. 1366x768
100%
Quadro M4000M:
90  fps
79%
Quadro M2200:
68.5 71.6 72.8 ~ 71 fps
high 1920x1080
100%
Quadro M4000M:
55  fps
73%
Quadro M2200:
37.4 40.7 41.6 ~ 40 fps
ultra 1920x1080
100%
Quadro M4000M:
48  fps
71%
Quadro M2200:
33 34.4 35.2 ~ 34 fps
4K 3840x2160
100%
Quadro M4000M:
20  fps
69%
Quadro M2200:
13.7  fps
low 1024x768
Quadro M2200:
214.2  fps
med. 1366x768
Quadro M2200:
131.2  fps
high 1920x1080
Quadro M2200:
70.4  fps
ultra 1920x1080
Quadro M2200:
52.4  fps
low 1024x768
Quadro M2200:
148.8  fps
med. 1366x768
Quadro M2200:
119  fps
high 1920x1080
Quadro M2200:
56.4  fps
ultra 1920x1080
Quadro M2200:
48.2  fps
low 1024x768
Quadro M2200:
104.6 116.6 ~ 111 fps
med. 1366x768
Quadro M2200:
63.4 66.6 68.4 ~ 66 fps
high 1920x1080
Quadro M2200:
30.3 37.2 37.8 ~ 35 fps
ultra 1920x1080
Quadro M2200:
18 20 20.3 ~ 19 fps
4K 3840x2160
Quadro M2200:
12.7  fps
Thief

Thief

2014
low 1024x768
Quadro M2200:
108.8  fps
med. 1366x768
Quadro M2200:
88.6  fps
high 1366x768
Quadro M2200:
74.8  fps
ultra 1920x1080
Quadro M2200:
39.6  fps
low 1024x768
Quadro M2200:
171.5  fps
med. 1366x768
Quadro M2200:
148.3  fps
high 1366x768
Quadro M2200:
115.9  fps
ultra 1920x1080
Quadro M2200:
47.8  fps
low 1280x720
Quadro M2200:
229.4 270.9 ~ 250 fps
med. 1366x768
100%
Quadro M4000M:
196  fps
90%
Quadro M2200:
174.1 177.2 ~ 176 fps
high 1366x768
100%
Quadro M4000M:
181  fps
84%
Quadro M2200:
149.1 155.5 ~ 152 fps
ultra 1920x1080
100%
Quadro M4000M:
85  fps
68%
Quadro M2200:
56.8 58.6 ~ 58 fps
low 1024x768
Quadro M2200:
381.4  fps
med. 1366x768
Quadro M2200:
238.8  fps
high 1366x768
Quadro M2200:
149.3  fps
ultra 1920x1080
Quadro M2200:
70.2  fps
low 800x600
Quadro 2000M:
86.7  fps
med. 1024x768
Quadro 2000M:
75  fps
high 1360x768
Quadro 2000M:
71.7  fps
ultra 1920x1080
Quadro 2000M:
41.7  fps
Fifa 11

Fifa 11

2010
high 1360x768
Quadro 2000M:
92  fps
ultra 1920x1080
Quadro 2000M:
59  fps
Mafia 2

Mafia 2

2010
low 800x600
Quadro 2000M:
92  fps
med. 1024x768
Quadro 2000M:
71  fps
high 1360x768
Quadro 2000M:
59.1  fps
ultra 1920x1080
Quadro 2000M:
35.1  fps
low 1024x768
Quadro 2000M:
165 243 ~ 204 fps
med. 1360x768
Quadro 2000M:
82  fps
high 1360x768
Quadro 2000M:
45  fps
ultra 1920x1080
Quadro 2000M:
23 37 ~ 30 fps
med. 1366x768
Quadro 2000M:
64.6  fps
high 1366x768
Quadro 2000M:
46.9  fps
ultra 1920x1080
Quadro 2000M:
22.8  fps
low 800x600
Quadro 2000M:
200.3  fps
med. 1024x768
Quadro 2000M:
74.8  fps
high 1366x768
Quadro 2000M:
59.5  fps
ultra 1920x1080
Quadro 2000M:
37.6  fps
Anno 1404

Anno 1404

2009
low 1024x768
Quadro 2000M:
62  fps
ultra 1280x1024
Quadro 2000M:
36 43 ~ 40 fps
Sims 3

Sims 3

2009
low 800x600
Quadro 2000M:
269  fps
med. 1024x768
Quadro 2000M:
93  fps
high 1280x1024
Quadro 2000M:
47.9  fps

Average Gaming NVIDIA Quadro M4000M → 100%

Average Gaming 30-70 fps → 100%

Average Gaming NVIDIA Quadro M2200 → 76%

Average Gaming 30-70 fps → 71%

NVIDIA Quadro M2200lowmed.highultraQHD4K
Ghost Recon Wildlands83.437.133.717.6
For Honor7854513714.6
Battlefield 1139.4105.347.142
Rise of the Tomb Raider12671403413.7
Rainbow Six Siege214.2131.270.452.4
Star Wars Battlefront148.811956.448.2
The Witcher 311166351912.7
Thief108.888.674.839.6
Battlefield 4171.5148.3115.947.8
BioShock Infinite25017615258
Tomb Raider381.4238.8149.370.2
< 30 fps
< 60 fps
< 120 fps
≥ 120 fps


4
7

2
5
4

6
3
2
2
8
1


3


NVIDIA Quadro M4000Mlowmed.highultraQHD4K
Rise of the Tomb Raider90554820
BioShock Infinite19618185
< 30 fps
< 60 fps
< 120 fps
≥ 120 fps


1
1

1

1

1
1


1


NVIDIA Quadro 2000Mlowmed.highultraQHD4K
Call of Duty: Black Ops86.77571.741.7
Fifa 119259
Mafia 2927159.135.1
StarCraft 2204824530
Battlefield: Bad Company 264.646.922.8
CoD Modern Warfare 2200.374.859.537.6
Anno 14046240
Sims 32699347.89
< 30 fps
< 60 fps
< 120 fps
≥ 120 fps


3
3


6

5
2
1
6


For more games that might be playable and a list of all games and graphics cards visit our Gaming List

v1.26
log 20. 04:47:56

#0 checking url part for id 6506 +0s ... 0s

#1 checking url part for id 7706 +0s ... 0s

#2 checking url part for id 2435 +0s ... 0s

#3 not redirecting to Ajax server +0s ... 0s

#4 did not recreate cache, as it is less than 5 days old! Created at Fri, 19 Apr 2024 05:40:26 +0200 +0.001s ... 0.001s

#5 composed specs +0.277s ... 0.278s

#6 did output specs +0s ... 0.278s

#7 start showIntegratedCPUs +0s ... 0.278s

#8 getting avg benchmarks for device 6506 +0.083s ... 0.361s

#9 got single benchmarks 6506 +0.012s ... 0.373s

#10 getting avg benchmarks for device 7706 +0.024s ... 0.397s

#11 got single benchmarks 7706 +0.031s ... 0.428s

#12 getting avg benchmarks for device 2435 +0.002s ... 0.43s

#13 got single benchmarks 2435 +0.014s ... 0.445s

#14 got avg benchmarks for devices +0s ... 0.445s

#15 min, max, avg, median took s +0.464s ... 0.908s

#16 before gaming benchmark output +0s ... 0.908s

#17 Got 104 rows for game benchmarks. +0.025s ... 0.933s

#18 composed SQL query for gamebenchmarks +0s ... 0.933s

#19 got data and put it in $dataArray +0.018s ... 0.951s

#20 benchmarks composed for output. +0.052s ... 1.003s

#21 calculated avg scores. +0s ... 1.003s

#22 return log +0.002s ... 1.006s

Please share our article, every link counts!
> Expert Reviews and News on Laptops, Smartphones and Tech Innovations > Benchmarks / Tech > Graphics Card Comparison - Head 2 Head
Redaktion, 2017-09- 8 (Update: 2023-07- 1)