NVIDIA Quadro M2200 vs NVIDIA Quadro 4000M vs NVIDIA Quadro M1200
NVIDIA Quadro M2200 ► remove from comparison
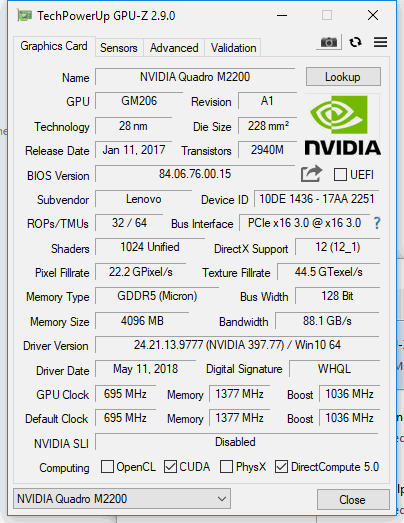
The Nvidia Quadro M2200 is a mid-range DirectX 12 (FL 12_1) and OpenGL 4.5-compatible graphics card for mobile workstations. It is a Maxwell-based GPU built most likely on the GM206 chip with 1024 shader cores. Therefore, the GPU is similar to the consumer Nvidia GeForce GTX 965M (second generation) . The Quadro M2200M is built for the Intel Kaby Lake generation.
The Quadro series offers certified drivers that are optimized for stability and performance in professional applications like CAD or DCC. OpenGL performance, for example, should be significantly better compared to GeForce graphics cards of similar specifications.
Performance
The maximum core clock of the Quadro M2200 is 1038 MHz. The performance is between the old Quadro M2000M and Quadro M3000M , but generally closer to the latter (sometimes even on par). It is not surprising that the gaming performance is comparable to the Nvidia GeForce GTX 965M (Ti) and it is just behind the new GeForce GTX 1050 (Pascal).
Using CUDA (Compute Capability 5.0) or OpenCL 1.2 , the cores of the Quadro M2200 can be used for general calculations.
Power Consumption
The power consumption of the Quadro M2200 is rated at a TGP of 55 Watt (39.1 Watt TDP) – similar to the previous Quadro M2000M – and therefore best suited for 15-inch laptops and up.
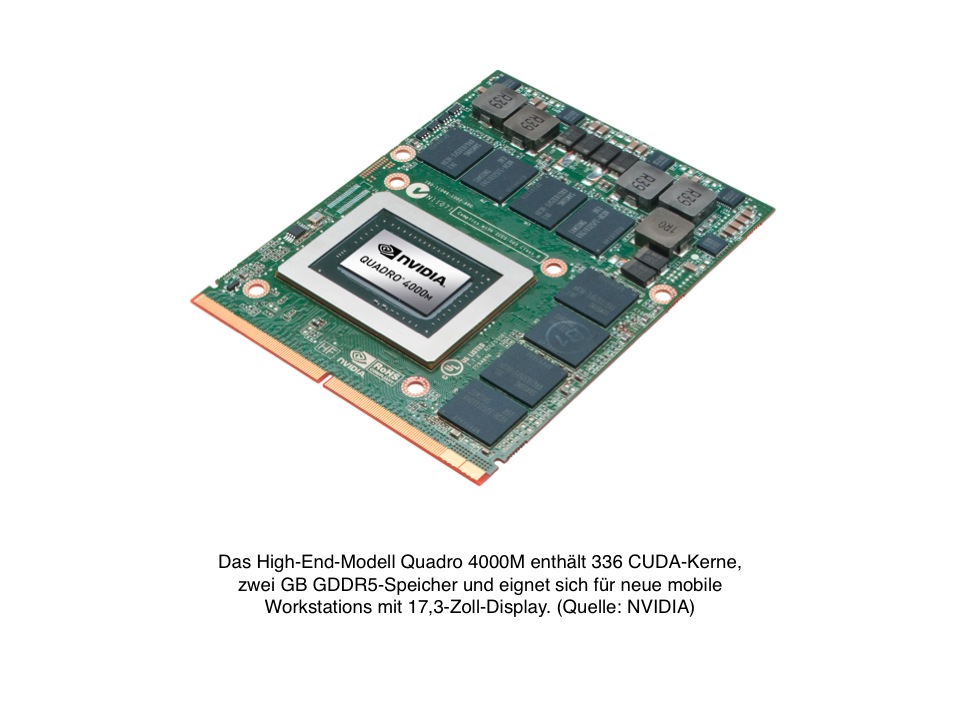
NVIDIA Quadro 4000M ► remove from comparison
The NVIDIA Quadro 4000M is a professional workstation graphics card based on the Fermi architecture (or more specifically, probably the GF104). Unlike the 5010M, the 4000M does not support ECC memory and dual-precision (DP) floating point calculations.
The Quadro series offers certified drivers that are optimized for stability and performance in professional applications such as CAD or DCC. As a result, multiple scientific or business disciplines can make use of the workstation GPU. The OpenGL performance, for example, should be significantly better than consumer-oriented GeForce graphics cards of similar specifications.
The shader / CUDA cores can be accessed using DirectX 11 or OpenGL 4.1 for graphics rendering or DirectCompute, OpenCL, AXE, and CUDA for general purpose calculations. Due to the new Fermi core, the 4000M should offer higher performance in general purpose calculations compared to its predecessors.
Furthermore, the Nvidia Quadro 4000M is compatible with 3D Vision Pro, a new software solution by Nvidia for stereoscopic output.
The 4000M supports Nvidia Optimus in order to automatically switch between the integrated graphics card and the Quadro for power-saving purposes. Whether or not this feature is supported on a laptop, however, is dependent on the laptop manufacturer.
Similar to the GeForce GTX 480M, the Quadro 4000M is specified at 100 Watt TDP and is therefore only found in large laptops such as the Clevo D901F .
NVIDIA Quadro M1200 ► remove from comparison
The 28 nm Nvidia Quadro M1200 is a mid-range DirectX 12 (FL 11_0) and OpenGL 4.5-compatible graphics card for mobile workstations. It is a (first generation) Maxwell-based GPU built on the GM107 chip with 640 shader cores. Therefore, the GPU is similar to the consumer Nvidia GeForce GTX 960M . The Quadro M1200M is built for the Intel Skylake generation and is the successor to the Quadro M1000M (950M based) .
The Quadro series offers certified drivers that are optimized for stability and performance in professional applications like CAD or DCC. OpenGL performance, for example, should be significantly better compared to GeForce graphics cards of similar specifications.
Performance
The performance of the Quadro M1200 is on a level to the previous generation M2000M which is also based on the 960M. In games it is comparable to the GTX 960M although the driver support is not optimized for gaming.
Using CUDA (Compute Capability 5.0) or OpenCL 1.2 , the cores of the Quadro M2000M can be used for general calculations.
Power Consumption
The power consumption of the Quadro M1200 is rated for the same TGP of 45 Watt (32.5 Watt TDP) and therefore a bit lower than the M2000M with 55 Watt TGP.
NVIDIA Quadro M2200 NVIDIA Quadro 4000M NVIDIA Quadro M1200 Quadro M Series Codename N17P-Q3 Fermi N17P-Q1 Architecture Maxwell Fermi Maxwell Pipelines 1024 - unified 336 - unified 640 - unified Core Speed 694 - 1038 (Boost) MHz 475 MHz 991 - 1150 (Boost) MHz Memory Speed 5508 MHz 1200 MHz 5000 MHz Memory Bus Width 128 Bit 256 Bit 128 Bit Memory Type GDDR5 GDDR5 GDDR5 Max. Amount of Memory 4 GB 2048 MB 4 GB Shared Memory no no no API DirectX 12_1, Shader 5.0, OpenGL 4.5 DirectX 11, Shader 5.0 DirectX 12 (FL 11_0), Shader 5.0, OpenGL 4.5 Power Consumption 55 Watt 100 Watt 45 Watt Transistors 4.9 Billion 1.9 Billion technology 28 nm 40 nm 28 nm Features Optimus,
PhysX, 3D Vision Pro, nView, Optimus OpenGl 4.1, FP32 Optimus,
PhysX, 3D Vision Pro, nView, Optimus Notebook Size large large large Date of Announcement 13.01.2017 22.02.2011 13.01.2017 Link to Manufacturer Page www.nvidia.de www.nvidia.com www.nvidia.de Shader Speed 950 MHz
Benchmarks Performance Rating - 3DMark 11 + Fire Strike + Time Spy - Quadro M2200
2.7 pt (8%)
...
...
max:
Performance Rating - 3DMark 11 + Fire Strike + Time Spy - Quadro M1200
1.9 pt (6%)
...
...
max:
3DMark - 3DMark Time Spy Score
min: 1845 avg: 1889 median: 1903 (5%) max: 1920 Points
1290 Points (4%)
3DMark - 3DMark Time Spy Graphics
min: 1699 avg: 1724 median: 1724 (5%) max: 1750 Points
3DMark - 3DMark Ice Storm Unlimited Graphics
min: 280203 avg: 289176 median: 289176 (33%) max: 298148 Points
240298 Points (27%)
3DMark - 3DMark Ice Storm Extreme Graphics
42129 Points (5%)
3DMark - 3DMark Cloud Gate Score
min: 20388 avg: 21012 median: 20644 (22%) max: 22003 Points
min: 12632 avg: 14705 median: 13600 (15%) max: 17884 Points
3DMark - 3DMark Cloud Gate Graphics
min: 36877 avg: 37505 median: 37796 (10%) max: 37841 Points
min: 26860 avg: 27557 median: 27557 (7%) max: 28254 Points
3DMark - 3DMark Fire Strike Standard Score
min: 5232 avg: 5253 median: 5252 (9%) max: 5275 Points
min: 3759 avg: 3846 median: 3878 (7%) max: 3900 Points
3DMark - 3DMark Fire Strike Standard Graphics
min: 5786 avg: 5835 median: 5850 (7%) max: 5869 Points
min: 4118 avg: 4142 median: 4141.5 (5%) max: 4165 Points
3DMark - 3DMark Ice Storm Graphics
min: 127867 avg: 195445 median: 195444 (23%) max: 263022 Points
63463 Points (8%)
3DMark 11 - 3DM11 Performance Score
min: 7453 avg: 7581 median: 7581 (11%) max: 7709 Points
min: 2229 avg: 2335 median: 2334.5 (3%) max: 2440 Points
min: 5513 avg: 5515 median: 5514.5 (8%) max: 5516 Points
3DMark 11 - 3DM11 Performance GPU
min: 7319 avg: 7372 median: 7372 (6%) max: 7425 Points
min: 2025 avg: 2092 median: 2092 (2%) max: 2159 Points
min: 5105 avg: 5310 median: 5310 (5%) max: 5515 Points
3DMark Vantage + NVIDIA Quadro M2200 3DMark Vantage - 3DM Vant. Perf. total
24622 Points (7%)
3DM Vant. Perf. total + NVIDIA Quadro 4000M
10722 Points (3%)
3DM Vant. Perf. GPU no PhysX + NVIDIA Quadro M2200 3DMark Vantage - 3DM Vant. Perf. GPU no PhysX
24915 Points (14%)
3DM Vant. Perf. GPU no PhysX + NVIDIA Quadro 4000M
9184 Points (5%)
3DMark 06 3DMark 06 - Standard 1280x1024 + NVIDIA Quadro M2200
min: 26834 avg: 28150 median: 28149.5 (37%) max: 29465 Points
3DMark 06 - Standard 1280x1024 + NVIDIA Quadro 4000M
17727 Points (23%)
3DMark 06 - Standard 1280x1024 + NVIDIA Quadro M1200
26109 Points (34%)
Unigine Valley 1.0 - Unigine Valley 1.0 DX
min: 23.2 avg: 26.4 median: 27.9 (9%) max: 28.1 fps
27.7 fps (9%)
Unigine Heaven 3.0 - Unigine Heaven 3.0 DX 11
30.1 fps (10%)
Unigine Heaven 3.0 - Unigine Heaven 3.0 OpenGL
28.9 fps (13%)
Unigine Heaven 2.1 - Heaven 2.1 high
31.4 fps (6%)
28.1 fps (5%)
SPECviewperf 11 + NVIDIA Quadro M2200 SPECviewperf 11 - specvp11 snx-01
min: 48.26 avg: 48.9 median: 48.9 (29%) max: 49.48 fps
specvp11 snx-01 + NVIDIA Quadro 4000M
26.4 fps (16%)
specvp11 snx-01 + NVIDIA Quadro M1200
43.9 fps (26%)
specvp11 tcvis-02 + NVIDIA Quadro M2200 SPECviewperf 11 - specvp11 tcvis-02
min: 49.11 avg: 51 median: 51 (29%) max: 52.9 fps
specvp11 tcvis-02 + NVIDIA Quadro 4000M
29.2 fps (17%)
specvp11 tcvis-02 + NVIDIA Quadro M1200
44.2 fps (25%)
specvp11 sw-02 + NVIDIA Quadro M2200 SPECviewperf 11 - specvp11 sw-02
min: 42.66 avg: 49.7 median: 49.7 (38%) max: 56.8 fps
specvp11 sw-02 + NVIDIA Quadro 4000M
39.1 fps (30%)
specvp11 sw-02 + NVIDIA Quadro M1200
56.4 fps (43%)
specvp11 proe-05 + NVIDIA Quadro M2200 SPECviewperf 11 - specvp11 proe-05
min: 16.23 avg: 19.2 median: 19.2 (23%) max: 22.18 fps
specvp11 proe-05 + NVIDIA Quadro 4000M
10.6 fps (12%)
specvp11 proe-05 + NVIDIA Quadro M1200
22 fps (26%)
specvp11 maya-03 + NVIDIA Quadro M2200 SPECviewperf 11 - specvp11 maya-03
min: 56.6 avg: 57.2 median: 57.2 (43%) max: 57.7 fps
specvp11 maya-03 + NVIDIA Quadro 4000M
51.4 fps (39%)
specvp11 maya-03 + NVIDIA Quadro M1200
57.2 fps (43%)
specvp11 lightwave-01 + NVIDIA Quadro M2200 SPECviewperf 11 - specvp11 lightwave-01
min: 47.95 avg: 52.7 median: 52.7 (57%) max: 57.5 fps
specvp11 lightwave-01 + NVIDIA Quadro 4000M
42.1 fps (45%)
specvp11 lightwave-01 + NVIDIA Quadro M1200
57.8 fps (62%)
specvp11 ensight-04 + NVIDIA Quadro M2200 SPECviewperf 11 - specvp11 ensight-04
min: 55.7 avg: 57.1 median: 57.1 (27%) max: 58.5 fps
specvp11 ensight-04 + NVIDIA Quadro 4000M
24.9 fps (12%)
specvp11 ensight-04 + NVIDIA Quadro M1200
46.7 fps (22%)
specvp11 catia-03 + NVIDIA Quadro M2200 SPECviewperf 11 - specvp11 catia-03
min: 48.49 avg: 50.6 median: 50.6 (27%) max: 52.7 fps
specvp11 catia-03 + NVIDIA Quadro 4000M
36.5 fps (19%)
specvp11 catia-03 + NVIDIA Quadro M1200
53.3 fps (28%)
SPECviewperf 12 + NVIDIA Quadro M2200 SPECviewperf 12 - specvp12 sw-03
min: 85.3 avg: 90.3 median: 86.2 (21%) max: 99.5 fps
specvp12 sw-03 + NVIDIA Quadro M1200
min: 69 avg: 72.5 median: 70 (17%) max: 78.4 fps
specvp12 snx-02 + NVIDIA Quadro M2200 SPECviewperf 12 - specvp12 snx-02
min: 57.7 avg: 58.3 median: 58.1 (9%) max: 59 fps
specvp12 snx-02 + NVIDIA Quadro M1200
min: 34.18 avg: 35 median: 34.7 (5%) max: 36 fps
specvp12 showcase-01 + NVIDIA Quadro M2200 SPECviewperf 12 - specvp12 showcase-01
min: 31.14 avg: 32.2 median: 32.8 (7%) max: 32.8 fps
specvp12 showcase-01 + NVIDIA Quadro M1200
min: 22.17 avg: 24.8 median: 26 (6%) max: 26.2 fps
specvp12 mediacal-01 + NVIDIA Quadro M2200 SPECviewperf 12 - specvp12 mediacal-01
min: 20.34 avg: 23.6 median: 24.6 (6%) max: 25.66 fps
specvp12 mediacal-01 + NVIDIA Quadro M1200
min: 17.49 avg: 17.8 median: 17.8 (5%) max: 18 fps
specvp12 maya-04 + NVIDIA Quadro M2200 SPECviewperf 12 - specvp12 maya-04
min: 46.93 avg: 47.4 median: 46.9 (13%) max: 48.34 fps
specvp12 maya-04 + NVIDIA Quadro M1200
min: 32.07 avg: 34.4 median: 33.7 (9%) max: 37.29 fps
specvp12 energy-01 + NVIDIA Quadro M2200 SPECviewperf 12 - specvp12 energy-01
min: 4.28 avg: 4.9 median: 5.2 (5%) max: 5.26 fps
specvp12 energy-01 + NVIDIA Quadro M1200
min: 3.78 avg: 3.8 median: 3.9 (3%) max: 3.9 fps
specvp12 creo-01 + NVIDIA Quadro M2200 SPECviewperf 12 - specvp12 creo-01
min: 68.2 avg: 69.3 median: 68.5 (27%) max: 71.2 fps
specvp12 creo-01 + NVIDIA Quadro M1200
min: 45 avg: 46 median: 46.1 (18%) max: 46.97 fps
specvp12 catia-04 + NVIDIA Quadro M2200 SPECviewperf 12 - specvp12 catia-04
min: 71.4 avg: 72.2 median: 72 (12%) max: 73.2 fps
specvp12 catia-04 + NVIDIA Quadro M1200
min: 45.75 avg: 46.2 median: 45.9 (8%) max: 47 fps
specvp12 3dsmax-05 + NVIDIA Quadro M1200 SPECviewperf 12 - specvp12 3dsmax-05
46 fps (8%)
Windows 7 Experience Index - Win7 Gaming graphics
7.1 Points (90%)
Windows 7 Experience Index - Win7 Graphics
7.1 Points (90%)
Cinebench R10 Cinebench R10 Shading (32bit) + NVIDIA Quadro M2200 Cinebench R10 - Cinebench R10 Shading (32bit)
6833 Points (5%)
Cinebench R10 Shading (32bit) + NVIDIA Quadro 4000M
6638 Points (5%)
Cinebench R11.5 Cinebench R11.5 OpenGL 64 Bit + NVIDIA Quadro M2200 Cinebench R11.5 - Cinebench R11.5 OpenGL 64 Bit
88.6 fps (31%)
Cinebench R11.5 OpenGL 64 Bit + NVIDIA Quadro 4000M
46 fps (16%)
Cinebench R11.5 OpenGL 64 Bit + NVIDIA Quadro M1200
102.2 fps (35%)
Cinebench R15 + NVIDIA Quadro M2200 Cinebench R15 - Cinebench R15 OpenGL 64 Bit
min: 102.9 avg: 107.4 median: 103.9 (6%) max: 115.5 fps
Cinebench R15 OpenGL 64 Bit + NVIDIA Quadro M1200
min: 102.8 avg: 108.2 median: 108.2 (6%) max: 113.5 fps
Cinebench R15 OpenGL Ref. Match 64 Bit + NVIDIA Quadro M2200 Cinebench R15 - Cinebench R15 OpenGL Ref. Match 64 Bit
99.6 % (100%)
Cinebench R15 OpenGL Ref. Match 64 Bit + NVIDIA Quadro M1200
99.6 % (100%)
GFXBench - GFXBench Car Chase Offscreen
110.7 fps (12%)
GFXBench 3.1 - GFXBench Manhattan ES 3.1 Offscreen
163.7 fps (3%)
GFXBench 3.0 - GFXBench 3.0 Manhattan Offscreen
219.1 fps (13%)
GFXBench (DX / GLBenchmark) 2.7 + NVIDIA Quadro M2200 GFXBench (DX / GLBenchmark) 2.7 - GFXBench T-Rex HD Offscreen C24Z16
432 fps (3%)
LuxMark v2.0 64Bit - LuxMark v2.0 Room GPU
min: 1204 avg: 1276 median: 1306 (6%) max: 1318 Samples/s
min: 656 avg: 818 median: 817.5 (4%) max: 979 Samples/s
LuxMark v2.0 64Bit - LuxMark v2.0 Sala GPU
min: 2086 avg: 2097 median: 2099 (4%) max: 2107 Samples/s
min: 852 avg: 1207 median: 1207 (2%) max: 1562 Samples/s
ComputeMark v2.1 - ComputeMark v2.1 Result
4332 Points (5%)
388 Points (0%)
Power Consumption - Furmark Stress Test Power Consumption - external Monitor *
68.5 Watt (10%)
Power Consumption - The Witcher 3 Power Consumption - external Monitor *
89.2 Watt (12%)
Power Consumption - Witcher 3 Power Consumption *
87.7 Watt (19%)
min: 74.8 avg: 87.5 median: 87.5 (19%) max: 100.2 Watt
Power Consumption - Witcher 3 ultra Power Efficiency
0.2 fps per Watt (20%)
0.2 fps per Watt (17%)
Power Consumption - Witcher 3 ultra Power Efficiency - external Monitor
0.2 fps per Watt (19%)
Emissions Witcher 3 Fan Noise + NVIDIA Quadro M2200 Emissions - Witcher 3 Fan Noise
39.5 dB(A) (63%)
Witcher 3 Fan Noise + NVIDIA Quadro M1200
min: 42.3 avg: 43.9 median: 43.9 (70%) max: 45.5 dB(A)
Average Benchmarks NVIDIA Quadro M2200 → 100% n=12 Average Benchmarks NVIDIA Quadro 4000M → 59% n=12 Average Benchmarks NVIDIA Quadro M1200 → 96% n=12
- Range of benchmark values for this graphics card
- Average benchmark values for this graphics card
* Smaller numbers mean a higher performance
1 This benchmark is not used for the average calculation
Game Benchmarks The following benchmarks stem from our benchmarks of review laptops. The performance depends on the used graphics memory, clock rate, processor, system settings, drivers, and operating systems. So the results don't have to be representative for all laptops with this GPU. For detailed information on the benchmark results, click on the fps number.
100%
Quadro M2200:
83.4 fps
100%
Quadro M2200:
37.1 fps
100%
Quadro M2200:
33.7 fps
100%
Quadro M2200:
17.6 fps
100%
Quadro M2200:
14.6 fps
100%
Quadro M2200:
139.4 fps
100%
Quadro M2200:
105.3 fps
100%
Quadro M2200:
47.1 fps
70%
Quadro M1200:
88.1 fps
69%
Quadro M1200:
49.2 fps
71%
Quadro M1200:
28.4 fps
70%
Quadro M1200:
23.9 fps
100%
Quadro M2200:
13.7 fps
100%
Quadro M2200:
214.2 fps
100%
Quadro M2200:
131.2 fps
100%
Quadro M2200:
70.4 fps
100%
Quadro M2200:
52.4 fps
100%
Quadro M2200:
148.8 fps
100%
Quadro M2200:
119 fps
100%
Quadro M2200:
56.4 fps
100%
Quadro M2200:
48.2 fps
66%
Quadro M1200:
73.6 fps
70%
Quadro M1200:
45.9 fps
80%
Quadro M1200:
26.3 29 ~ 28 fps
100%
Quadro M2200:
12.7 fps
100%
Quadro M2200:
108.8 fps
86%
Quadro M1200:
93.3 fps
100%
Quadro M2200:
88.6 fps
66%
Quadro M1200:
58.9 fps
100%
Quadro M2200:
74.8 fps
67%
Quadro M1200:
50.1 fps
100%
Quadro M2200:
39.6 fps
66%
Quadro M1200:
26.2 fps
100%
Quadro M2200:
171.5 fps
100%
Quadro M2200:
148.3 fps
100%
Quadro M2200:
115.9 fps
100%
Quadro M2200:
47.8 fps
78%
Quadro M1200:
42.6 47 ~ 45 fps
100%
Quadro M2200:
381.4 fps
100%
Quadro M2200:
238.8 fps
100%
Quadro M2200:
149.3 fps
100%
Quadro M2200:
70.2 fps
Average Gaming NVIDIA Quadro M2200 → 100% Average Gaming 30-70 fps → 100%
Average Gaming NVIDIA Quadro M1200 → 73% Average Gaming 30-70 fps → 70%
NVIDIA Quadro M2200 low med. high ultra QHD 4K Ghost Recon Wildlands 83.4 37.1 33.7 17.6 For Honor 78 54 51 37 14.6 Battlefield 1 139.4 105.3 47.1 42 Rise of the Tomb Raider 126 71 40 34 13.7 Rainbow Six Siege 214.2 131.2 70.4 52.4 Star Wars Battlefront 148.8 119 56.4 48.2 The Witcher 3 111 66 35 19 12.7 Thief 108.8 88.6 74.8 39.6 Battlefield 4 171.5 148.3 115.9 47.8 BioShock Infinite 250 176 152 58 Tomb Raider 381.4 238.8 149.3 70.2 < 30 fps < 60 fps < 120 fps ≥ 120 fps 4 7 2 5 4 6 3 2 2 8 1 3
NVIDIA Quadro M1200 low med. high ultra QHD 4K Doom 79 66 37 34 12 Rise of the Tomb Raider 88.1 49.15 28.36 23.92 9.88 Batman: Arkham Knight 74 63 35 29 11 The Witcher 3 73.6 45.9 28 13 Thief 93.3 58.9 50.1 26.2 BioShock Infinite 207 134 119 45 < 30 fps < 60 fps < 120 fps ≥ 120 fps 5 1 3 2 1 2 3 1 4 2 3
NVIDIA Quadro 4000M low med. high ultra QHD 4K StarCraft 2 180 112 79 71 Anno 1404 173 62 Sims 3 279 165 79 Racedriver: GRID 188 148 117 < 30 fps < 60 fps < 120 fps ≥ 120 fps 4 1 2 3 2
For more games that might be playable and a list of all games and graphics cards visit our Gaming List
v1.26
log 19. 04:20:14
#0 checking url part for id 7706 +0s ... 0s
#1 checking url part for id 2431 +0s ... 0s
#2 checking url part for id 7704 +0s ... 0s
#3 not redirecting to Ajax server +0s ... 0s
#4 did not recreate cache, as it is less than 5 days old! Created at Tue, 16 Apr 2024 05:39:00 +0200 +0.001s ... 0.001s
#5 composed specs +0.148s ... 0.149s
#6 did output specs +0s ... 0.149s
#7 start showIntegratedCPUs +0s ... 0.149s
#8 getting avg benchmarks for device 7706 +0.055s ... 0.204s
#9 got single benchmarks 7706 +0.021s ... 0.225s
#10 getting avg benchmarks for device 2431 +0.002s ... 0.227s
#11 got single benchmarks 2431 +0.01s ... 0.237s
#12 getting avg benchmarks for device 7704 +0.017s ... 0.253s
#13 got single benchmarks 7704 +0.015s ... 0.268s
#14 got avg benchmarks for devices +0s ... 0.268s
#15 min, max, avg, median took s +0.386s ... 0.655s
#16 before gaming benchmark output +0s ... 0.655s
#17 Got 112 rows for game benchmarks. +0.018s ... 0.673s
#18 composed SQL query for gamebenchmarks +0s ... 0.673s
#19 got data and put it in $dataArray +0.012s ... 0.685s
#20 benchmarks composed for output. +0.04s ... 0.725s
#21 calculated avg scores. +0s ... 0.725s
#22 return log +0.002s ... 0.727s
Please share our article, every link counts!
Redaktion, 2017-09- 8 (Update: 2023-07- 1)
 Deutsch
 English
 Español
 Français
 Italiano
 Nederlands
 Polski
 Português
 Русский
 Türkçe
 Svenska
 Chinese
 Magyar