Notebookcheck Logo

NVIDIA Quadro FX 770M vs NVIDIA Quadro FX 3600M

NVIDIA Quadro FX 770M

► remove from comparison NVIDIA Quadro FX 770M

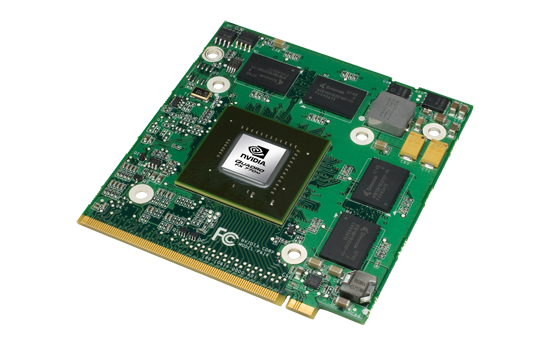
The Quadro FX 770M is a professional midrange graphics adapter for laptops / mobile workstations. The GPU is optimized for professional 2D and 3D applications like CAD, DCC, and visualization software. The FX770M solutions contains certified graphics drivers for the most popular applications.

The GPU chip of the Quadro FX770M is based on the GeForce 9600M GT consumer card for notebooks. Therefore, the Quadro has the same features (like the PureVideo HD video-processor) as the 9600M GT.

The performance of the card should be compareable to the 9600M GT. Still some games may run slower, as the drivers are optimized for applications and OpenGL. Especially the OpenGL performance is way better than with an 9600M GT. The Cinebench R10 OpenGL test shows up to twize the performance with a FX 770M compared to a GeForce 9600M GT.

As all cards of the GeForce 9000M series, the 770M support CUDA.

NVIDIA Quadro FX 3600M

► remove from comparison NVIDIA Quadro FX 3600M

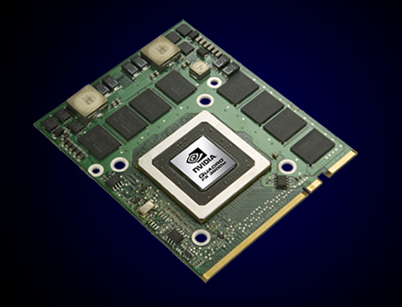
The NVIDIA Quadro FX 3600M is a professional graphics card for CAD, DCC and other modeling applications based upon the 8800M GTX consumer card (G92 architecture). It was a high-end card at the time of announcement. Certified drivers grant error-free and faster performance in professional applications. The FX 3600M was later succeeded by the more efficient 55nm FX 2800M and FX 3800M, both of which still utilize the G92 architecture.

The most important aspect of the Quadro FX 3600M is its use "Unified Shaders". There no longer exist any dedicated pixel or vertex shaders. Instead, the FX 3600M uses 64 so-called stream processors to handle most of the graphics work previously processed by pixel and vertex shaders. Furthermore, the shader units are clocked higher than the GPU core (1250 MHz).

The performance of the FX 3600M shoul be higher than the 1600M due to the 256 bit wide memory bus and the high number of Unified Shaders. According to Nvidia, the GPU is best suited for modelling large 3D scenes and complex models.

NVIDIA Quadro FX 770MNVIDIA Quadro FX 3600M
Quadro FX Series
Quadro FX 3800M compare 128 @ 0.68 GHz256 Bit @ 1000 MHz
Quadro FX 3700M compare 128 @ 0.55 GHz256 Bit @ 800 MHz
Quadro FX 2800M compare 96 @ 0.6 GHz256 Bit @ 1000 MHz
Quadro FX 3600M 96 @ 0.5 GHz256 Bit @ 800 MHz
Quadro FX 1800M compare 72 @ 0.56 GHz128 Bit @ 1100 MHz
Quadro FX 2700M compare 48 @ 0.53 GHz256 Bit @ 800 MHz
Quadro FX 880M compare 48 @ 0.55 GHz128 Bit @ 790 MHz
Quadro FX 3500M compare 24/8 cores @ 0.58 GHz256 Bit @ 700 MHz
Quadro FX 2500M compare 24/8 cores @ 0.5 GHz256 Bit @ 600 MHz
Quadro FX 1700M compare 32 @ 0.63 GHz128 Bit @ 800 MHz
Quadro FX 1600M compare 32 @ 0.63 GHz128 Bit @ 800 MHz
Quadro FX 1500M compare 20/7 cores @ 0.38 GHz256 Bit @ 500 MHz
Quadro FX 770M 32 @ 0.5 GHz128 Bit @ 800 MHz
Quadro FX 570M compare 32 @ 0.48 GHz128 Bit @ 700 MHz
Quadro FX 380M compare 16 @ 0.63 GHz64 Bit @ 800 MHz
Quadro FX 370M compare 8 @ 0.58 GHz64 Bit @ 700 MHz
Quadro FX 360M compare 16 @ 0.4 GHz64 Bit @ 600 MHz
Quadro FX 350M compare 4/3 cores @ 0.45 GHz64 Bit @ 350 MHz
CodenameNB9P-GLMNB8E-GLM
ArchitectureG9xG9x
Pipelines32 - unified96 - unified
Core Speed500 MHz500 MHz
Shader Speed1250 MHz1250 MHz
Memory Speed800 MHz800 MHz
Memory Bus Width128 Bit256 Bit
Memory TypeGDDR2 / GDDR3GDDR3
Max. Amount of Memory512 MB512 MB
Shared Memorynono
APIDirectX 10, Shader 4.0DirectX 10, Shader 4.0
Power Consumption35 Watt70 Watt
Transistors314 Million754 Million
technology65 nm65 nm
Features OpenGL 2.1, PowerMizer 8.0, 12-Bit subpixel precision, 128 Bit graphics pipeline precisionPureVideo technology (H.264, VC-1, MPEG2, WMV9 decoding acceleration), HDCP-capable, PowerMizer 7.0 energy administration (dynamic switching between performance and energy saving), HDR (High Dynamic-Range Lighting), designed for Windows Vista, supports Dual-Link DVI-D exits for TFT resolutions up to 2560x1600, LVDS, VGA, HDTV, HDCP, HDMI, PCI-E 16x, OpenGL 2.1, Gigathread technology
Notebook Sizemedium sizedlarge
Date of Announcement14.08.2008 23.02.2008
Link to Manufacturer Pagewww.nvidia.comwww.nvidia.com
InformationMXM Factor III

Benchmarks

3DMark 2001SE - 3DMark 2001 - Standard
34871 Points (36%)
41502 Points (43%)
3DMark 03 - 3DMark 03 - Standard
17192 Points (9%)
26705 Points (14%)
3DMark 05 - 3DMark 05 - Standard
11161 Points (12%)
min: 13176     avg: 13950     median: 13949.5 (15%)     max: 14723 Points
3DMark 06 3DMark 06 - Standard 1280x1024 + NVIDIA Quadro FX 770M
3DMark 06
min: 5230     avg: 5297     median: 5296.5 (7%)     max: 5363 Points
3DMark 06 - Standard 1280x1024 + NVIDIA Quadro FX 3600M
min: 8035     avg: 8136     median: 8135.5 (11%)     max: 8236 Points
3DMark 06 - Score Unknown Settings + NVIDIA Quadro FX 3600M
3DMark 06
7799 Points (10%)
SPEC Viewperf 10.0 - SPEC Viewperf 10.0 - 3dsmax
33.1 Points (69%)
SPEC Viewperf 10.0 - SPEC Viewperf 10.0 - Catia
40.1 Points (84%)
SPEC Viewperf 10.0 - SPEC Viewperf 10.0 - EnSight
31.7 Points (67%)
SPEC Viewperf 10.0 - SPEC Viewperf 10.0 - Maya
85.1 Points (46%)
SPEC Viewperf 10.0 - SPEC Viewperf 10.0 - Pro/Engeneer
36.1 Points (71%)
SPEC Viewperf 10.0 - SPEC Viewperf 10.0 - SolidWorks
55 Points (81%)
SPEC Viewperf 10.0 - SPEC Viewperf 10.0 - UGS Teamcenter
19 Points (49%)
SPEC Viewperf 10.0 - SPEC Viewperf 10.0 - UGS NX
17.5 Points (36%)
Cinebench R10 Cinebench R10 Shading (32bit) + NVIDIA Quadro FX 770M
Cinebench R10 - Cinebench R10 Shading (32bit)
6180 Points (4%)
Cinebench R10 Shading (32bit) + NVIDIA Quadro FX 3600M
6193 Points (4%)

Average Benchmarks NVIDIA Quadro FX 770M → 100% n=5

Average Benchmarks NVIDIA Quadro FX 3600M → 131% n=5

- Range of benchmark values for this graphics card
- Average benchmark values for this graphics card
* Smaller numbers mean a higher performance
1 This benchmark is not used for the average calculation

Game Benchmarks

The following benchmarks stem from our benchmarks of review laptops. The performance depends on the used graphics memory, clock rate, processor, system settings, drivers, and operating systems. So the results don't have to be representative for all laptops with this GPU. For detailed information on the benchmark results, click on the fps number.

Crysis - GPU Benchmark

Crysis - GPU Benchmark

2007
low 1024x768
100%
Quadro FX 770M:
94.2  fps
104%
Quadro FX 3600M:
98.1  fps
med. 1024x768
100%
Quadro FX 770M:
39  fps
153%
Quadro FX 3600M:
59.5  fps
high 1024x768
100%
Quadro FX 770M:
19.5  fps
Crysis - CPU Benchmark

Crysis - CPU Benchmark

2007
low 1024x768
100%
Quadro FX 770M:
84.7  fps
141%
Quadro FX 3600M:
119.5  fps
med. 1024x768
100%
Quadro FX 770M:
35.4  fps
150%
Quadro FX 3600M:
53.2  fps
high 1024x768
100%
Quadro FX 770M:
18.1  fps
160%
Quadro FX 3600M:
29  fps
World in Conflict - Benchmark

World in Conflict - Benchmark

2007
med. 1024x768
Quadro FX 3600M:
63  fps
high 1024x768
Quadro FX 3600M:
41  fps
F.E.A.R.

F.E.A.R.

2005
low 640x480
Quadro FX 3600M:
503  fps
med. 800x600
Quadro FX 3600M:
230  fps
high 1024x768
Quadro FX 3600M:
103  fps
Doom 3

Doom 3

2004
low 640x480
100%
Quadro FX 770M:
165.2  fps
107%
Quadro FX 3600M:
176.5  fps
med. 640x480
100%
Quadro FX 770M:
171.3  fps
104%
Quadro FX 3600M:
177.3  fps
high 800x600
100%
Quadro FX 770M:
158.7  fps
110%
Quadro FX 3600M:
175.1  fps
ultra 1024x768
100%
Quadro FX 770M:
126.1  fps
133%
Quadro FX 3600M:
167.8  fps

Average Gaming NVIDIA Quadro FX 770M → 100%

Average Gaming 30-70 fps → 100%

Average Gaming NVIDIA Quadro FX 3600M → 129%

Average Gaming 30-70 fps → 151%

NVIDIA Quadro FX 770Mlowmed.highultraQHD4K
Crysis - GPU Benchmark94.23919.5
Crysis - CPU Benchmark84.735.418.1
Doom 3165.2171.3158.7126.1
< 30 fps
< 60 fps
< 120 fps
≥ 120 fps


2
1

2

1
2


1


1


NVIDIA Quadro FX 3600Mlowmed.highultraQHD4K
Crysis - GPU Benchmark98.159.5
Crysis - CPU Benchmark119.553.228.98
World in Conflict - Benchmark6341
F.E.A.R.503230103
Doom 3176.5177.3175.1167.8
< 30 fps
< 60 fps
< 120 fps
≥ 120 fps


2
2

2
1
2
1
1
1
1


1


For more games that might be playable and a list of all games and graphics cards visit our Gaming List

Add one or more devices and compare

In the following list you can select (and also search for) devices that should be added to the comparison. You can select more than one device.

restrict list:

show all (including archived), 2024, 2023
v1.26
log 19. 11:05:27

#0 checking url part for id 884 +0s ... 0s

#1 checking url part for id 695 +0s ... 0s

#2 not redirecting to Ajax server +0s ... 0s

#3 did not recreate cache, as it is less than 5 days old! Created at Tue, 19 Mar 2024 05:33:38 +0100 +0.001s ... 0.001s

#4 composed specs +0.106s ... 0.107s

#5 did output specs +0s ... 0.107s

#6 start showIntegratedCPUs +0s ... 0.108s

#7 getting avg benchmarks for device 884 +0.023s ... 0.131s

#8 got single benchmarks 884 +0.011s ... 0.141s

#9 getting avg benchmarks for device 695 +0.002s ... 0.143s

#10 got single benchmarks 695 +0.008s ... 0.151s

#11 got avg benchmarks for devices +0s ... 0.151s

#12 min, max, avg, median took s +0.161s ... 0.312s

#13 before gaming benchmark output +0s ... 0.312s

#14 Got 24 rows for game benchmarks. +0.003s ... 0.315s

#15 composed SQL query for gamebenchmarks +0s ... 0.315s

#16 got data and put it in $dataArray +0.003s ... 0.318s

#17 benchmarks composed for output. +0.012s ... 0.329s

#18 calculated avg scores. +0s ... 0.329s

#19 return log +0.042s ... 0.371s

Please share our article, every link counts!
> Expert Reviews and News on Laptops, Smartphones and Tech Innovations > Benchmarks / Tech > Graphics Card Comparison - Head 2 Head
Redaktion, 2017-09- 8 (Update: 2023-07- 1)