 Deutsch
 English
 Español
 Français
 Italiano
 Nederlands
 Polski
 Português
 Русский
 Türkçe
 Svenska
 Chinese
 Magyar
NVIDIA Quadro FX 770M vs NVIDIA Quadro FX 350M
NVIDIA Quadro FX 770M
► remove from comparison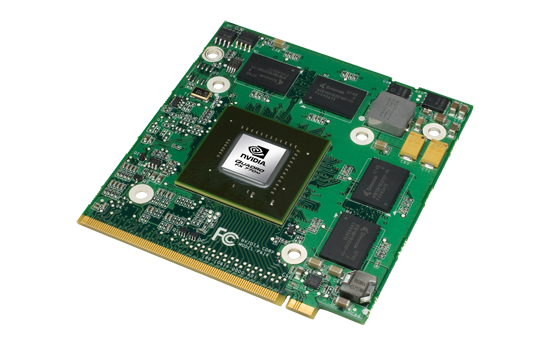
The Quadro FX 770M is a professional midrange graphics adapter for laptops / mobile workstations. The GPU is optimized for professional 2D and 3D applications like CAD, DCC, and visualization software. The FX770M solutions contains certified graphics drivers for the most popular applications.
The GPU chip of the Quadro FX770M is based on the GeForce 9600M GT consumer card for notebooks. Therefore, the Quadro has the same features (like the PureVideo HD video-processor) as the 9600M GT.
The performance of the card should be compareable to the 9600M GT. Still some games may run slower, as the drivers are optimized for applications and OpenGL. Especially the OpenGL performance is way better than with an 9600M GT. The Cinebench R10 OpenGL test shows up to twize the performance with a FX 770M compared to a GeForce 9600M GT.
As all cards of the GeForce 9000M series, the 770M support CUDA.
NVIDIA Quadro FX 350M
► remove from comparison
The NVIDIA Quadro FX 350M is a professional workstation graphics card based on the old entry level NVIDIA GeForce Go 7300. Due to certified drivers, the FX 350M is suited for CAD and DCC applications. Still the 3D performance is not very good (even at the time of launch), therefore the card is better suited for 2D CAD applications.
| NVIDIA Quadro FX 770M | NVIDIA Quadro FX 350M | |||||||||||||||||||||||||||||||||||||||||||||||||||||||||||||||||||||||||||||||||||||||||||||||||||||||||||||
| Quadro FX Series |
|
| ||||||||||||||||||||||||||||||||||||||||||||||||||||||||||||||||||||||||||||||||||||||||||||||||||||||||||||
| Codename | NB9P-GLM | G72M | ||||||||||||||||||||||||||||||||||||||||||||||||||||||||||||||||||||||||||||||||||||||||||||||||||||||||||||
| Architecture | G9x | |||||||||||||||||||||||||||||||||||||||||||||||||||||||||||||||||||||||||||||||||||||||||||||||||||||||||||||
| Pipelines | 32 - unified | 4 / 3 Pixel- / Vertexshader | ||||||||||||||||||||||||||||||||||||||||||||||||||||||||||||||||||||||||||||||||||||||||||||||||||||||||||||
| Core Speed | 500 MHz | 450 MHz | ||||||||||||||||||||||||||||||||||||||||||||||||||||||||||||||||||||||||||||||||||||||||||||||||||||||||||||
| Shader Speed | 1250 MHz | |||||||||||||||||||||||||||||||||||||||||||||||||||||||||||||||||||||||||||||||||||||||||||||||||||||||||||||
| Memory Speed | 800 MHz | 350 MHz | ||||||||||||||||||||||||||||||||||||||||||||||||||||||||||||||||||||||||||||||||||||||||||||||||||||||||||||
| Memory Bus Width | 128 Bit | 64 Bit | ||||||||||||||||||||||||||||||||||||||||||||||||||||||||||||||||||||||||||||||||||||||||||||||||||||||||||||
| Memory Type | GDDR2 / GDDR3 | DDR-3 | ||||||||||||||||||||||||||||||||||||||||||||||||||||||||||||||||||||||||||||||||||||||||||||||||||||||||||||
| Max. Amount of Memory | 512 MB | 64 MB | ||||||||||||||||||||||||||||||||||||||||||||||||||||||||||||||||||||||||||||||||||||||||||||||||||||||||||||
| Shared Memory | no | no | ||||||||||||||||||||||||||||||||||||||||||||||||||||||||||||||||||||||||||||||||||||||||||||||||||||||||||||
| API | DirectX 10, Shader 4.0 | DirectX 9c, Shader 3.0 | ||||||||||||||||||||||||||||||||||||||||||||||||||||||||||||||||||||||||||||||||||||||||||||||||||||||||||||
| Power Consumption | 35 Watt | 15 Watt | ||||||||||||||||||||||||||||||||||||||||||||||||||||||||||||||||||||||||||||||||||||||||||||||||||||||||||||
| Transistors | 314 Million | 112 Million | ||||||||||||||||||||||||||||||||||||||||||||||||||||||||||||||||||||||||||||||||||||||||||||||||||||||||||||
| technology | 65 nm | 90 nm | ||||||||||||||||||||||||||||||||||||||||||||||||||||||||||||||||||||||||||||||||||||||||||||||||||||||||||||
| Features | OpenGL 2.1, PowerMizer 8.0, 12-Bit subpixel precision, 128 Bit graphics pipeline precision | PureVideo, UltraShadow II, Intellisample 4.0, CineFX 4.0, PowerMizer 6.0, High Dynamic-Range (HDR) Lighning | ||||||||||||||||||||||||||||||||||||||||||||||||||||||||||||||||||||||||||||||||||||||||||||||||||||||||||||
| Notebook Size | medium sized | |||||||||||||||||||||||||||||||||||||||||||||||||||||||||||||||||||||||||||||||||||||||||||||||||||||||||||||
| Date of Announcement | 14.08.2008 | 31.03.2006 | ||||||||||||||||||||||||||||||||||||||||||||||||||||||||||||||||||||||||||||||||||||||||||||||||||||||||||||
| Link to Manufacturer Page | www.nvidia.com | www.nvidia.de | ||||||||||||||||||||||||||||||||||||||||||||||||||||||||||||||||||||||||||||||||||||||||||||||||||||||||||||
| Information | 90nm, 112 Mio Transistoren, PCI-E |


