NVIDIA Quadro FX 370M vs NVIDIA Quadro FX 3800M
NVIDIA Quadro FX 370M ► remove
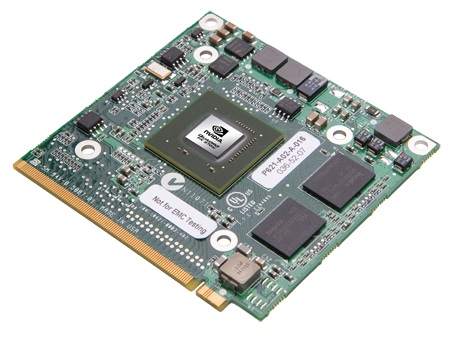
The NVIDIA Quadro FX 370M is an entry level graphics card for mobile workstations (laptops). It is based on the same core as the Quadro NVS 160M and the GeForce 9200M / 9300M GS . The drivers are optimized for OpenGL applications and professional 3D applications like CAD, DCC, and visualization applications. Furthermore, the drivers are certified to work with the most popular apps without problems.
The gaming performance is a bit below the similar 9200M / 9300M chip because of the professional drivers and therefore the GPU is only capable of displaying low end games fluently. Modern intensive 3D games wont run fluently or only with very low detail settings.
As the 9300M series, the Quadro FX 370M supports PureVideo HD to decode (HD) videos in the GPU.
The performance of the chip also depends on the used graphics memory. Either fast GDDR3 memory (clocked at 700 MHz) or slow GDDR2 (with 400MHz) can be used by the laptop manufacturer.
In the Dell Precision M2400, only GDDR2 graphics memory is used, leading to a slow performance (e.g. Doom3 - ultra 40fps). According to Dell the graphics card needs 20 Watt.
NVIDIA Quadro FX 3800M ► remove
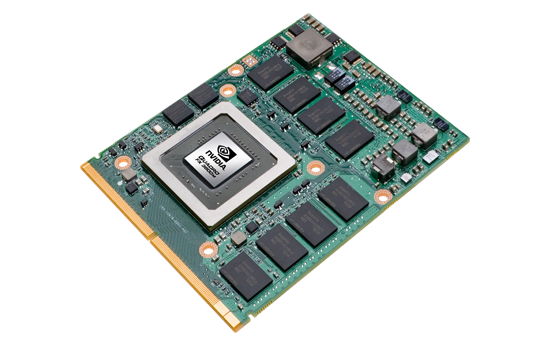
The NVIDIA Quadro FX 3800M is a mobile workstation graphics card for high end laptops. It is based on the Geforce GTX 280M core (G92 core) and features 128 CUDA cores (unified shaders).
Compared to the Quadro FX 3700M, the Quadro FX 3800M features a higher clock speed and is manufacturered in 55nm (compared to 65nm of the 3700M). In fact, the FX3800M is clocked even higher than the consumer GeForce GTX 280M and performs notably better as a result.
The Quadro FX series of cards are optimized for professional applications like CAD or DCC. Notably, OpenGL performance should be much improved compared to consumer GeForce cards of similar specifications.
At the time its announcement (December 2009), the FX 3800M was the fastest workstation graphics card for laptops.
NVIDIA Quadro FX 370M NVIDIA Quadro FX 3800M Manufacturer NVIDIA NVIDIA Quadro FX Series Codename NB9M-GLM N10E-GLM4 8 - 128 - Core 580 MHz 675 MHz Shader 1450 MHz 1688 MHz Memory 700 MHz 1000 MHz Bus 64 Bit 256 Bit Memory GDDR2, GDDR3 GDDR3 Max. Memory 256 MB 1024 MB no no DirectX DirectX 10, 4.0 DirectX 10, 4.0 Technology 65 nm 55 nm Introduced 15.08.2008 20.12.2009 OpenGL 2.1, max. 1920x1200 (digital) bzw 2048x1536 (analog), max. 2 unabhängige Displays, PCI-Express x16, optionale Interfaces (des Chips): DP, VGA, DVI, LVDS, HDMI Manufacturer http://www.nvidia.com/object/product_qua... http://www.nvidia.com/object/product_qua... Architecture G9x Transistors 754 Million Features OpenGL 2.1, CUDA, PowerMizer 8.0 Size
min: 6584 avg: 6951.3 median: 6779 (9%) max: 7491 Points
Dell Precision M6500 920XM 675/1688 / 1000 MHz 1024 GDDR3 6584
Lenovo ThinkPad W701ds NTV5FPB164 820QM 16384 675 / 1650 MHz 1024 GDDR3 ForceWare 188.98 6779
HP EliteBook 8740w (WD942EA) 740QM 8192 675 / 1000 MHz 1024 GDDR3 ForceWare 59.47 7491
P GPU no PhysX 1280x1024 + NVIDIA Quadro FX 3800M 3DMark Vantage - P GPU no PhysX 1280x1024
min: 5758 avg: 5926.3 median: 6002 (8%) max: 6019 Points
Dell Precision M6500 920XM 675/1688 / 1000 MHz 1024 GDDR3 5758
HP EliteBook 8740w (WD942EA) 740QM 8192 675 / 1000 MHz 1024 GDDR3 ForceWare 59.47 6002
Lenovo ThinkPad W701ds NTV5FPB164 820QM 16384 675 / 1650 MHz 1024 GDDR3 ForceWare 188.98 6019
3DMark 2001SE - Standard 1024x768
13622 Points (14%)
min: 32886 avg: 34790 median: 34790 (36%) max: 36694 Points
Lenovo ThinkPad W701ds NTV5FPB164 820QM 16384 675 / 1650 MHz 1024 GDDR3 ForceWare 188.98 32886
HP EliteBook 8740w (WD942EA) 740QM 8192 675 / 1000 MHz 1024 GDDR3 ForceWare 59.47 36694
3DMark 03 - Standard 1024x768
5532 Points (3%)
min: 33146 avg: 37082 median: 38191 (20%) max: 39909 Points
Lenovo ThinkPad W701ds NTV5FPB164 820QM 16384 675 / 1650 MHz 1024 GDDR3 ForceWare 188.98 33146
HP EliteBook 8740w (WD942EA) 740QM 8192 675 / 1000 MHz 1024 GDDR3 ForceWare 59.47 38191
Dell Precision M6500 920XM 4096 1024 GDDR3 39909
3DMark 05 - Standard 1024x768
3290 Points (7%)
min: 16593 avg: 18198.7 median: 18043 (39%) max: 19960 Points
Lenovo ThinkPad W701ds NTV5FPB164 820QM 16384 675 / 1650 MHz 1024 GDDR3 ForceWare 188.98 16593
HP EliteBook 8740w (WD942EA) 740QM 8192 675 / 1000 MHz 1024 GDDR3 ForceWare 59.47 18043
Dell Precision M6500 920XM 4096 1024 GDDR3 19960
3DMark 06 Standard 1280x1024 + NVIDIA Quadro FX 370M 1595 Points (3%)
+ NVIDIA Quadro FX 3800M
min: 12050 avg: 12765.3 median: 12923 (28%) max: 13323 Points
Dell Precision M6500 920XM 4096 1024 GDDR3 13232 Standard 1280x1024
Lenovo ThinkPad W701ds NTV5FPB164 820QM 16384 675 / 1650 MHz 1024 GDDR3 ForceWare 188.98 12050
HP EliteBook 8740w (WD942EA) 740QM 8192 675 / 1000 MHz 1024 GDDR3 ForceWare 59.47 12923
Dell Precision M6500 920XM 675/1688 / 1000 MHz 1024 GDDR3 13323
SPEC Viewperf 10.0 - 3ds Max 1280x1024
12.3 fps (26%)
32.8 fps (68%)
Dell Precision M6500 920XM 675/1688 / 1000 MHz 1024 GDDR3 32.8
SPEC Viewperf 10.0 - Catia 1280x1024
16.8 fps (35%)
45.8 fps (96%)
Dell Precision M6500 920XM 675/1688 / 1000 MHz 1024 GDDR3 45.75
SPEC Viewperf 10.0 - EnSight 1280x1024
12 fps (25%)
47.4 fps (100%)
Dell Precision M6500 920XM 675/1688 / 1000 MHz 1024 GDDR3 47.37
SPEC Viewperf 10.0 - Maya 1280x1024
27.3 fps (15%)
59.7 fps (32%)
Dell Precision M6500 920XM 675/1688 / 1000 MHz 1024 GDDR3 59.74
SPEC Viewperf 10.0 - Pro/Engeneer 1280x1024
13.7 fps (27%)
51.1 fps (100%)
Dell Precision M6500 920XM 675/1688 / 1000 MHz 1024 GDDR3 51.12
SPEC Viewperf 10.0 - SolidWorks 1280x1024
21.8 fps (32%)
59.7 fps (89%)
Dell Precision M6500 920XM 675/1688 / 1000 MHz 1024 GDDR3 59.72
SPEC Viewperf 10.0 - UGS Teamcenter 1280x1024
6.8 fps (18%)
Dell Precision M6500 920XM 675/1688 / 1000 MHz 1024 GDDR3 38.52
SPEC Viewperf 10.0 - UGS NX 1280x1024
5.1 fps (10%)
35.3 fps (72%)
Dell Precision M6500 920XM 675/1688 / 1000 MHz 1024 GDDR3 35.3
SPECviewperf 11 Siemens NX 1920x1080 + NVIDIA Quadro FX 3800M SPECviewperf 11 - Siemens NX 1920x1080
18.8 fps (13%)
HP EliteBook 8740w (WD942EA) 740QM 8192 675 / 1000 MHz 1024 GDDR3 ForceWare 59.47 18.82
Tcvis 1920x1080 + NVIDIA Quadro FX 3800M SPECviewperf 11 - Tcvis 1920x1080
18.7 fps (31%)
HP EliteBook 8740w (WD942EA) 740QM 8192 675 / 1000 MHz 1024 GDDR3 ForceWare 59.47 18.68
SolidWorks 1920x1080 + NVIDIA Quadro FX 3800M SPECviewperf 11 - SolidWorks 1920x1080
30.6 fps (37%)
HP EliteBook 8740w (WD942EA) 740QM 8192 675 / 1000 MHz 1024 GDDR3 ForceWare 59.47 30.57
Pro/ENGINEER 1920x1080 + NVIDIA Quadro FX 3800M SPECviewperf 11 - Pro/ENGINEER 1920x1080
6.9 fps (29%)
HP EliteBook 8740w (WD942EA) 740QM 8192 675 / 1000 MHz 1024 GDDR3 ForceWare 59.47 6.9
Maya 1920x1080 + NVIDIA Quadro FX 3800M SPECviewperf 11 - Maya 1920x1080
16.6 fps (12%)
HP EliteBook 8740w (WD942EA) 740QM 8192 675 / 1000 MHz 1024 GDDR3 ForceWare 59.47 16.55
Lightwave 1920x1080 + NVIDIA Quadro FX 3800M SPECviewperf 11 - Lightwave 1920x1080
38.4 fps (41%)
HP EliteBook 8740w (WD942EA) 740QM 8192 675 / 1000 MHz 1024 GDDR3 ForceWare 59.47 38.4
Ensight 1920x1080 + NVIDIA Quadro FX 3800M SPECviewperf 11 - Ensight 1920x1080
16.2 fps (8%)
HP EliteBook 8740w (WD942EA) 740QM 8192 675 / 1000 MHz 1024 GDDR3 ForceWare 59.47 16.17
Catia 1920x1080 + NVIDIA Quadro FX 3800M SPECviewperf 11 - Catia 1920x1080
23.4 fps (28%)
HP EliteBook 8740w (WD942EA) 740QM 8192 675 / 1000 MHz 1024 GDDR3 ForceWare 59.47 23.38
Windows 7 Experience Index - Gaming graphics
6.9 points (87%)
Dell Precision M6500 920XM 4096 1024 GDDR3 6.9
Windows 7 Experience Index - Graphics
6.9 points (87%)
Dell Precision M6500 920XM 4096 1024 GDDR3 6.9
Cinebench R10 Shading 32Bit + NVIDIA Quadro FX 370M Cinebench R10 - Shading 32Bit
3031 Points (15%)
Shading 32Bit + NVIDIA Quadro FX 3800M
min: 4429 avg: 4928 median: 4928 (25%) max: 5427 Points
Lenovo ThinkPad W701ds NTV5FPB164 820QM 16384 675 / 1650 MHz 1024 GDDR3 ForceWare 188.98 4429
HP EliteBook 8740w (WD942EA) 740QM 8192 675 / 1000 MHz 1024 GDDR3 ForceWare 59.47 5427
Cinebench R11.5 OpenGL 64Bit + NVIDIA Quadro FX 3800M Cinebench R11.5 - OpenGL 64Bit
min: 32.07 avg: 32.7 median: 32.7 (19%) max: 33.29 Points
Lenovo ThinkPad W701ds NTV5FPB164 820QM 16384 675 / 1650 MHz 1024 GDDR3 ForceWare 188.98 32.07
HP EliteBook 8740w (WD942EA) 740QM 8192 675 / 1000 MHz 1024 GDDR3 ForceWare 59.47 33.29
Average Benchmarks NVIDIA Quadro FX 370M → 100% Average Benchmarks NVIDIA Quadro FX 3800M → 263%
-
-
* Smaller numbers mean a higher performance
1 This benchmark is not used for the average calculation
Quadro FX 3800M:
230.6 [X] HP EliteBook 8740w (WD942EA) Intel Core i7-740QM 1.7GHz
Quadro FX 3800M
fps
Quadro FX 3800M:
124.2 [X] HP EliteBook 8740w (WD942EA) Intel Core i7-740QM 1.7GHz
Quadro FX 3800M
fps
Quadro FX 3800M:
»
Quadro FX 3800M:
64.9 [X] HP EliteBook 8740w (WD942EA) Intel Core i7-740QM 1.7GHz
Quadro FX 3800M
fps
Quadro FX 3800M:
31.8 [X] HP EliteBook 8740w (WD942EA) Intel Core i7-740QM 1.7GHz
Quadro FX 3800M
fps
Quadro FX 3800M:
»
Quadro FX 3800M:
78.5 [X] HP EliteBook 8740w (WD942EA) Intel Core i7-740QM 1.7GHz
Quadro FX 3800M
fps
Quadro FX 3800M:
40.9 [X] HP EliteBook 8740w (WD942EA) Intel Core i7-740QM 1.7GHz
Quadro FX 3800M
fps
Quadro FX 3800M:
»
Quadro FX 3800M:
97 [X] HP EliteBook 8740w (WD942EA) Intel Core i7-740QM 1.7GHz
Quadro FX 3800M
fps
Quadro FX 3800M:
82 [X] HP EliteBook 8740w (WD942EA) Intel Core i7-740QM 1.7GHz
Quadro FX 3800M
fps
Quadro FX 3800M:
29.9 [X] HP EliteBook 8740w (WD942EA) Intel Core i7-740QM 1.7GHz
Quadro FX 3800M
fps
Quadro FX 3800M:
»
Quadro FX 3800M:
142.8 [X] HP EliteBook 8740w (WD942EA) Intel Core i7-740QM 1.7GHz
Quadro FX 3800M
fps
Quadro FX 3800M:
61.9 [X] HP EliteBook 8740w (WD942EA) Intel Core i7-740QM 1.7GHz
Quadro FX 3800M
fps
Quadro FX 3800M:
»
100%
Quadro FX 370M:
97 fps
100%
Quadro FX 370M:
97.1 fps
100%
Quadro FX 370M:
65.4 fps
100%
Quadro FX 370M:
39.9 fps
Quadro FX 370M:
»
Average Gaming NVIDIA Quadro FX 370M → 100%
v1.8.1a
#0 checking url part for id 1054 +0s ... 0s
#1 checking url part for id 1541 +0s ... 0s
#2 Did not recreate cache, as it is less than 5 days old! Created at Mon, 18 Feb 2019 12:12:07 +0100 +0.001s ... 0.001s
#3 start showIntegratedCPUs +0.023s ... 0.024s
#4 got avg benchmarks for devices +0.063s ... 0.087s
#5 min, max, avg, median took s +0.313s ... 0.4s
#6 Before gaming benchmark output +0s ... 0.401s
#7 Got 15 rows for game benchmarks. +0.033s ... 0.434s
#8 composed SQL query for gamebenchmarks +0s ... 0.434s
#9 got data and put it in $dataArray +0.002s ... 0.435s
#10 return log +0.023s ... 0.458s
Please share our article, every link counts!
Redaktion, 2017-09- 8 (Update: 2017-09-11)
Quality journalism is made possible by advertising. We show the least amount of ads whenever possible. We intentionally show more ads when an adblocker is used. Please, switch off ad blockers.