 Deutsch
 English
 Español
 Français
 Italiano
 Nederlands
 Polski
 Português
 Русский
 Türkçe
 Svenska
 Chinese
 Magyar
NVIDIA Quadro FX 370M vs NVIDIA Quadro FX 2700M vs NVIDIA Quadro FX 2500M
NVIDIA Quadro FX 370M
► remove from comparison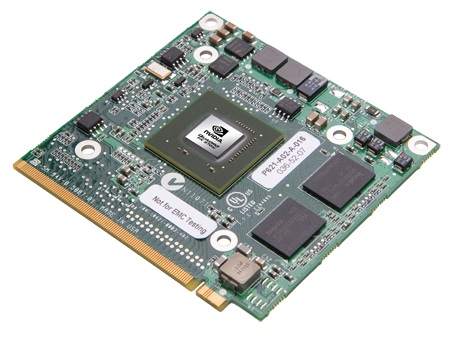
The NVIDIA Quadro FX 370M is an entry level graphics card for mobile workstations (laptops). It is based on the same core as the Quadro NVS 160M and the GeForce 9200M / 9300M GS. The drivers are optimized for OpenGL applications and professional 3D applications like CAD, DCC, and visualization applications. Furthermore, the drivers are certified to work with the most popular apps without problems.
The gaming performance is a bit below the similar 9200M / 9300M chip because of the professional drivers and therefore the GPU is only capable of displaying low end games fluently. Modern intensive 3D games wont run fluently or only with very low detail settings.
As the 9300M series, the Quadro FX 370M supports PureVideo HD to decode (HD) videos in the GPU.
The performance of the chip also depends on the used graphics memory. Either fast GDDR3 memory (clocked at 700 MHz) or slow GDDR2 (with 400MHz) can be used by the laptop manufacturer.
In the Dell Precision M2400, only GDDR2 graphics memory is used, leading to a slow performance (e.g. Doom3 - ultra 40fps). According to Dell the graphics card needs 20 Watt.
NVIDIA Quadro FX 2700M
► remove from comparison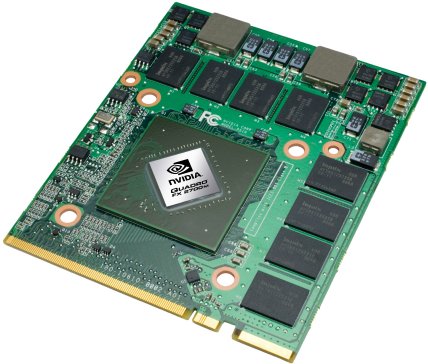
The Nvidia Quadro FX 2700M is a professional graphics card for laptops. It features certified drivers that are optimized for CAD (e.g., AutoCad, Inventor, Solidstation, Solid Edge, ..), DCC (e.g., Maya, 3DS Max, Lightwave 3D, ...), and visualization applications. The FX 2700M is based on the G94 core and therefore similar to the GeForce 9700M GTS.
The Quadro FX series of cards are optimized for professional applications like CAD or DCC. Especially the OpenGL performance should be noticeable better than with consumer GeForce cards. The certified drivers, that come with the Quadro cards guarantee a frictionless work with applications like AutoCad, Inventor, Solidstation, Maya, 3DS Max, Lightwave 3d and others. Furthermore they offer 12-Bit precision for subpixels, fullscreen anti-aliasing, hardware accelerated antialiasing for points and lines and other CAD and DCC optimizations.
NVIDIA Quadro FX 2500M
► remove from comparison
This is a professional video card for notebooks from NVidia It is based on 7900GTX.
The application performance is very good due to special professional drivers (3D rendering, CAD), but the gaming performance is weaker. With modded drivers, it should work like a 7900 GTX.
| NVIDIA Quadro FX 370M | NVIDIA Quadro FX 2700M | NVIDIA Quadro FX 2500M | |||||||||||||||||||||||||||||||||||||||||||||||||||||||||||||||||||||||||||||||||||||||||||||||||||||||||||||||||||||||||||||||||||||||||||||||||||||||||||||||||||
| Quadro FX Series |
|
|
| ||||||||||||||||||||||||||||||||||||||||||||||||||||||||||||||||||||||||||||||||||||||||||||||||||||||||||||||||||||||||||||||||||||||||||||||||||||||||||||||||||
| Codename | NB9M-GLM | NB9E-GLM2 | G71glm | ||||||||||||||||||||||||||||||||||||||||||||||||||||||||||||||||||||||||||||||||||||||||||||||||||||||||||||||||||||||||||||||||||||||||||||||||||||||||||||||||||
| Pipelines | 8 - unified | 48 - unified | 24 / 8 Pixel- / Vertexshader | ||||||||||||||||||||||||||||||||||||||||||||||||||||||||||||||||||||||||||||||||||||||||||||||||||||||||||||||||||||||||||||||||||||||||||||||||||||||||||||||||||
| Core Speed | 580 MHz | 530 MHz | 500 MHz | ||||||||||||||||||||||||||||||||||||||||||||||||||||||||||||||||||||||||||||||||||||||||||||||||||||||||||||||||||||||||||||||||||||||||||||||||||||||||||||||||||
| Shader Speed | 1450 MHz | 1325 MHz | |||||||||||||||||||||||||||||||||||||||||||||||||||||||||||||||||||||||||||||||||||||||||||||||||||||||||||||||||||||||||||||||||||||||||||||||||||||||||||||||||||
| Memory Speed | 700 MHz | 800 MHz | 600 MHz | ||||||||||||||||||||||||||||||||||||||||||||||||||||||||||||||||||||||||||||||||||||||||||||||||||||||||||||||||||||||||||||||||||||||||||||||||||||||||||||||||||
| Memory Bus Width | 64 Bit | 256 Bit | 256 Bit | ||||||||||||||||||||||||||||||||||||||||||||||||||||||||||||||||||||||||||||||||||||||||||||||||||||||||||||||||||||||||||||||||||||||||||||||||||||||||||||||||||
| Memory Type | GDDR2, GDDR3 | GDDR3 | GDDR3 | ||||||||||||||||||||||||||||||||||||||||||||||||||||||||||||||||||||||||||||||||||||||||||||||||||||||||||||||||||||||||||||||||||||||||||||||||||||||||||||||||||
| Max. Amount of Memory | 256 MB | 1024 MB | 512 MB | ||||||||||||||||||||||||||||||||||||||||||||||||||||||||||||||||||||||||||||||||||||||||||||||||||||||||||||||||||||||||||||||||||||||||||||||||||||||||||||||||||
| Shared Memory | no | no | no | ||||||||||||||||||||||||||||||||||||||||||||||||||||||||||||||||||||||||||||||||||||||||||||||||||||||||||||||||||||||||||||||||||||||||||||||||||||||||||||||||||
| API | DirectX 10, Shader 4.0 | DirectX 10, Shader 4.0 | DirectX 9c, Shader 3.0 | ||||||||||||||||||||||||||||||||||||||||||||||||||||||||||||||||||||||||||||||||||||||||||||||||||||||||||||||||||||||||||||||||||||||||||||||||||||||||||||||||||
| Power Consumption | 20 Watt | 65 Watt | 45 Watt | ||||||||||||||||||||||||||||||||||||||||||||||||||||||||||||||||||||||||||||||||||||||||||||||||||||||||||||||||||||||||||||||||||||||||||||||||||||||||||||||||||
| technology | 65 nm | 65 nm | 90 nm | ||||||||||||||||||||||||||||||||||||||||||||||||||||||||||||||||||||||||||||||||||||||||||||||||||||||||||||||||||||||||||||||||||||||||||||||||||||||||||||||||||
| Date of Announcement | 15.08.2008 | 14.08.2008 | 29.09.2005 | ||||||||||||||||||||||||||||||||||||||||||||||||||||||||||||||||||||||||||||||||||||||||||||||||||||||||||||||||||||||||||||||||||||||||||||||||||||||||||||||||||
| Information | OpenGL 2.1, max. 1920x1200 (digital) bzw 2048x1536 (analog), max. 2 unabhängige Displays, PCI-Express x16, optionale Interfaces (des Chips): DP, VGA, DVI, LVDS, HDMI | ||||||||||||||||||||||||||||||||||||||||||||||||||||||||||||||||||||||||||||||||||||||||||||||||||||||||||||||||||||||||||||||||||||||||||||||||||||||||||||||||||||
| Link to Manufacturer Page | www.nvidia.com | www.nvidia.com | www.nvidia.de | ||||||||||||||||||||||||||||||||||||||||||||||||||||||||||||||||||||||||||||||||||||||||||||||||||||||||||||||||||||||||||||||||||||||||||||||||||||||||||||||||||
| Architecture | G9x | G7x | |||||||||||||||||||||||||||||||||||||||||||||||||||||||||||||||||||||||||||||||||||||||||||||||||||||||||||||||||||||||||||||||||||||||||||||||||||||||||||||||||||
| Transistors | 504 Million | 278 Million | |||||||||||||||||||||||||||||||||||||||||||||||||||||||||||||||||||||||||||||||||||||||||||||||||||||||||||||||||||||||||||||||||||||||||||||||||||||||||||||||||||
| Features | OpenGL 2.1, PowerMizer 8.0, PureVideo HD | 90nm | |||||||||||||||||||||||||||||||||||||||||||||||||||||||||||||||||||||||||||||||||||||||||||||||||||||||||||||||||||||||||||||||||||||||||||||||||||||||||||||||||||
| Notebook Size | large | large |
