Notebookcheck Logo

NVIDIA Quadro FX 360M vs NVIDIA Quadro FX 880M vs NVIDIA Quadro FX 2700M

NVIDIA Quadro FX 360M

► remove from comparison

For CAD and professional applications certified GPU based on the 8400M GS. The higher power consumption of 17 Watt versus 11 Watt of the 8400M GS indicates a higher performance.

NVIDIA Quadro FX 880M

► remove from comparison NVIDIA Quadro FX 880M

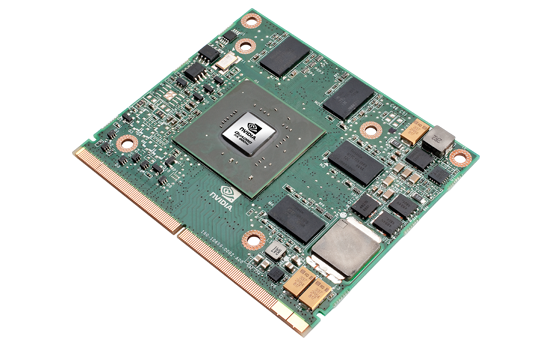
The NVIDIA Quadro FX 880M is a professional middle class graphics card for mobile workstations (about 15"). It is based on the GeForce GT 330M graphics card with slower clock rates and therefore is a DirectX 10.1 chip that is produced in 40nm. 

Due to a special BIOS and professional drivers, the FX 880M should perform noticeably better than a 330M in professional applications (like CAD, DCC, Rendering). Another advantage for professional users are the certified drivers that should ensure a bug free experience with the most common professional applications. Futhermore, the Quadro FX drivers contain profiles for these applications to ensure the best settings (similar to the game profiles in GeForce cards).

The Quadro FX 880M is also based on the GT216 core in 40nm. The shaders are based on the desktop GTX 200 architecture and therefore a bit improved compared to the previous generation cards.

Without load, the Quadro FX 880M is able to downclock to 135 / 270 / 135 MHz (chip / shader / memory clock).

The gaming performance of the FX 880M should be beyond the GT 330M, because of the different drivers. Gamers should choose a GeForce card because of the better game support.

The chip supports Optimus for automatic switching between dedicated and integrated graphics card (e.g. in the new Core i5 CPUs). Still Optimus was for example not integrated in the Lenovo Thinkpad W510.

NVIDIA Quadro FX 2700M

► remove from comparison NVIDIA Quadro FX 2700M

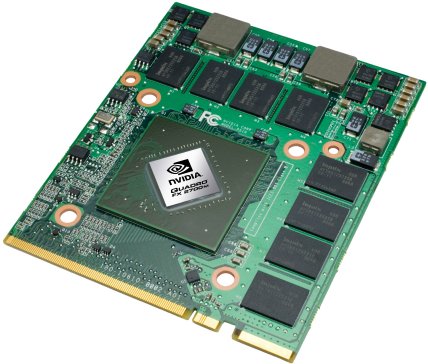
The Nvidia Quadro FX 2700M is a professional graphics card for laptops. It features certified drivers that are optimized for CAD (e.g., AutoCad, Inventor, Solidstation, Solid Edge, ..), DCC (e.g., Maya, 3DS Max, Lightwave 3D, ...), and visualization applications. The FX 2700M is based on the G94 core and therefore similar to the GeForce 9700M GTS.

The Quadro FX series of cards are optimized for professional applications like CAD or DCC. Especially the OpenGL performance should be noticeable better than with consumer GeForce cards. The certified drivers, that come with the Quadro cards guarantee a frictionless work with applications like AutoCad, Inventor, Solidstation, Maya, 3DS Max, Lightwave 3d and others. Furthermore they offer 12-Bit precision for subpixels, fullscreen anti-aliasing, hardware accelerated antialiasing for points and lines and other CAD and DCC optimizations.


NVIDIA Quadro FX 360MNVIDIA Quadro FX 880MNVIDIA Quadro FX 2700M
Quadro FX Series
Quadro FX 3800M 128 @ 0.68 GHz256 Bit @ 1000 MHz
Quadro FX 3700M 128 @ 0.55 GHz256 Bit @ 800 MHz
Quadro FX 2800M 96 @ 0.6 GHz256 Bit @ 1000 MHz
Quadro FX 3600M 96 @ 0.5 GHz256 Bit @ 800 MHz
Quadro FX 1800M 72 @ 0.56 GHz128 Bit @ 1100 MHz
Quadro FX 2700M 48 @ 0.53 GHz256 Bit @ 800 MHz
Quadro FX 880M 48 @ 0.55 GHz128 Bit @ 790 MHz
Quadro FX 3500M 24/8 cores @ 0.58 GHz256 Bit @ 700 MHz
Quadro FX 2500M 24/8 cores @ 0.5 GHz256 Bit @ 600 MHz
Quadro FX 1700M 32 @ 0.63 GHz128 Bit @ 800 MHz
Quadro FX 1600M 32 @ 0.63 GHz128 Bit @ 800 MHz
Quadro FX 1500M 20/7 cores @ 0.38 GHz256 Bit @ 500 MHz
Quadro FX 770M 32 @ 0.5 GHz128 Bit @ 800 MHz
Quadro FX 570M 32 @ 0.48 GHz128 Bit @ 700 MHz
Quadro FX 380M 16 @ 0.63 GHz64 Bit @ 800 MHz
Quadro FX 370M 8 @ 0.58 GHz64 Bit @ 700 MHz
Quadro FX 360M 16 @ 0.4 GHz64 Bit @ 600 MHz
Quadro FX 350M 4/3 cores @ 0.45 GHz64 Bit @ 350 MHz
CodenameNB8M-GLMN10P-GLMNB9E-GLM2
Pipelines16 - unified48 - unified48 - unified
Core Speed400 MHz550 MHz530 MHz
Shader Speed800 MHz1210 MHz1325 MHz
Memory Speed600 MHz790 MHz800 MHz
Memory Bus Width64 Bit128 Bit256 Bit
Memory TypeGDDR3GDDR3, DDR3GDDR3
Max. Amount of Memory256 MB1024 MB1024 MB
Shared Memorynonono
APIDirectX 10, Shader 4.0DirectX 10.1, Shader 4.1DirectX 10, Shader 4.0
Power Consumption17 Watt35 Watt65 Watt
Transistors210 Million504 Million
technology80 nm40 nm65 nm
FeaturesPowerMizer 7.0, HDR, designed for Vista, 128 Bit HDR, OpenGl 2.1OpenGL 2.1, PowerMizer 8.0, PureVideo HD
Date of Announcement09.05.2007 07.01.2010 14.08.2008
Link to Manufacturer Pagewww.nvidia.dewww.nvidia.comwww.nvidia.com
ArchitectureGT2xxG9x
Notebook Sizemedium sizedlarge

Benchmarks

3DMark Vantage
3DM Vant. Perf. total + NVIDIA Quadro FX 880M
3DMark Vantage - 3DM Vant. Perf. total
min: 2558     avg: 2643     median: 2638.5 (1%)     max: 2735 Points
3DM Vant. Perf. total + NVIDIA Quadro FX 2700M
2799 Points (1%)
3DM Vant. Perf. GPU no PhysX + NVIDIA Quadro FX 880M
3DMark Vantage - 3DM Vant. Perf. GPU no PhysX
min: 2128     avg: 2203     median: 2149.5 (1%)     max: 2385 Points
3DM Vant. Perf. GPU no PhysX + NVIDIA Quadro FX 2700M
2392 Points (1%)
3DMark 2001SE - 3DMark 2001 - Standard
min: 13650     avg: 15054     median: 15053.5 (16%)     max: 16457 Points
min: 28169     avg: 32291     median: 33331 (35%)     max: 34331 Points
36280 Points (38%)
3DMark 03 - 3DMark 03 - Standard
min: 5580     avg: 6010     median: 6010 (3%)     max: 6440 Points
min: 18796     avg: 18980     median: 19002 (10%)     max: 19137 Points
min: 23330     avg: 23842     median: 23841.5 (12%)     max: 24353 Points
3DMark 05 - 3DMark 05 - Standard
min: 3365     avg: 3372     median: 3372 (4%)     max: 3379 Points
min: 13154     avg: 13217     median: 13185 (14%)     max: 13298 Points
min: 13450     avg: 14224     median: 14224 (16%)     max: 14998 Points
3DMark 06 3DMark 06 - Standard 1280x1024 + NVIDIA Quadro FX 360M
3DMark 06
1490 Points (2%)
3DMark 06 - Standard 1280x1024 + NVIDIA Quadro FX 880M
min: 6366     avg: 6401     median: 6378 (8%)     max: 6473 Points
3DMark 06 - Standard 1280x1024 + NVIDIA Quadro FX 2700M
7660 Points (10%)
3DMark 06 - Standard 1280x800 + NVIDIA Quadro FX 360M
3DMark 06
1572 Points (2%)
3DMark 06 - Standard 1280x768 + NVIDIA Quadro FX 880M
3DMark 06
6392 Points (8%)
3DMark 06 - Score Unknown Settings + NVIDIA Quadro FX 2700M
3DMark 06
7580 Points (10%)
SPEC Viewperf 10.0 - SPEC Viewperf 10.0 - 3dsmax
47.8 Points (99%)
SPEC Viewperf 10.0 - SPEC Viewperf 10.0 - Catia
47.6 Points (100%)
SPEC Viewperf 10.0 - SPEC Viewperf 10.0 - Maya
60.1 Points (32%)
SPEC Viewperf 10.0 - SPEC Viewperf 10.0 - SolidWorks
58 Points (86%)
SPEC Viewperf 10.0 - SPEC Viewperf 10.0 - UGS Teamcenter
24.4 Points (63%)
SPECviewperf 11
specvp11 snx-01 + NVIDIA Quadro FX 880M
SPECviewperf 11 - specvp11 snx-01
min: 9.18     avg: 9.7     median: 9.7 (6%)     max: 10.27 fps
specvp11 tcvis-02 + NVIDIA Quadro FX 880M
SPECviewperf 11 - specvp11 tcvis-02
min: 11.04     avg: 11.2     median: 11.2 (6%)     max: 11.32 fps
specvp11 sw-02 + NVIDIA Quadro FX 880M
SPECviewperf 11 - specvp11 sw-02
min: 7.56     avg: 16     median: 16 (12%)     max: 24.45 fps
specvp11 proe-05 + NVIDIA Quadro FX 880M
SPECviewperf 11 - specvp11 proe-05
min: 4.28     avg: 5.2     median: 5.2 (6%)     max: 6.21 fps
specvp11 maya-03 + NVIDIA Quadro FX 880M
SPECviewperf 11 - specvp11 maya-03
min: 6.94     avg: 8     median: 8 (6%)     max: 9.09 fps
specvp11 lightwave-01 + NVIDIA Quadro FX 880M
SPECviewperf 11 - specvp11 lightwave-01
min: 9.81     avg: 23.8     median: 23.8 (26%)     max: 37.84 fps
specvp11 ensight-04 + NVIDIA Quadro FX 880M
SPECviewperf 11 - specvp11 ensight-04
min: 10     avg: 10.3     median: 10.3 (5%)     max: 10.59 fps
specvp11 catia-03 + NVIDIA Quadro FX 880M
SPECviewperf 11 - specvp11 catia-03
min: 8.63     avg: 12.3     median: 12.3 (6%)     max: 15.92 fps
Windows 7 Experience Index - Win7 Gaming graphics
6.4 Points (81%)
Windows 7 Experience Index - Win7 Graphics
6.4 Points (81%)
Cinebench R10 Cinebench R10 Shading (32bit) + NVIDIA Quadro FX 360M
Cinebench R10 - Cinebench R10 Shading (32bit)
2985 Points (2%)
Cinebench R10 Shading (32bit) + NVIDIA Quadro FX 880M
min: 4809     avg: 4886     median: 4846 (3%)     max: 5002 Points
Cinebench R10 Shading (32bit) + NVIDIA Quadro FX 2700M
4394 Points (3%)
Cinebench R11.5 Cinebench R11.5 OpenGL 64 Bit + NVIDIA Quadro FX 880M
Cinebench R11.5 - Cinebench R11.5 OpenGL 64 Bit
min: 15.84     avg: 16     median: 16 (6%)     max: 16.14 fps

Average Benchmarks NVIDIA Quadro FX 360M → 100% n=5

Average Benchmarks NVIDIA Quadro FX 880M → 304% n=5

Average Benchmarks NVIDIA Quadro FX 2700M → 344% n=5

- Range of benchmark values for this graphics card
- Average benchmark values for this graphics card
* Smaller numbers mean a higher performance
1 This benchmark is not used for the average calculation

Game Benchmarks

The following benchmarks stem from our benchmarks of review laptops. The performance depends on the used graphics memory, clock rate, processor, system settings, drivers, and operating systems. So the results don't have to be representative for all laptops with this GPU. For detailed information on the benchmark results, click on the fps number.

Fifa 11

Fifa 11

2010
med. 1024x768
Quadro FX 880M:
129.2  fps
high 1360x768
Quadro FX 880M:
90.5  fps
ultra 1920x1080
Quadro FX 880M:
50.4  fps
low 1024x768
Quadro FX 880M:
155  fps
med. 1360x768
Quadro FX 880M:
42  fps
high 1360x768
Quadro FX 880M:
29  fps
ultra 1920x1080
Quadro FX 880M:
12  fps
low 1024x768
Quadro FX 880M:
58.8  fps
med. 1366x768
Quadro FX 880M:
30.4  fps
high 1366x768
Quadro FX 880M:
16.1  fps
ultra 1920x1080
Quadro FX 880M:
9.7  fps
low 800x600
Quadro FX 880M:
124.1  fps
med. 1024x768
Quadro FX 880M:
42.2  fps
high 1366x768
Quadro FX 880M:
35.4  fps
ultra 1920x1080
Quadro FX 880M:
21  fps
Risen

Risen

2009
low 800x600
Quadro FX 880M:
75.4  fps
med. 1024x768
Quadro FX 880M:
29.8 33.4 ~ 32 fps
high 1366x768
Quadro FX 880M:
18.2 20.6 ~ 19 fps
ultra 1920x1080
Quadro FX 880M:
12.7  fps
Colin McRae: DIRT 2

Colin McRae: DIRT 2

2009
low 800x600
Quadro FX 880M:
79.3  fps
med. 1024x768
Quadro FX 880M:
45.7 47.8 ~ 47 fps
high 1360x768
Quadro FX 880M:
20 39 ~ 30 fps
ultra 1920x1080
Quadro FX 880M:
12.8  fps
Anno 1404

Anno 1404

2009
low 1024x768
Quadro FX 880M:
59.7 60 131 147.3 ~ 100 fps
ultra 1280x1024
Quadro FX 880M:
19 19.1 20.5 23 ~ 20 fps
F.E.A.R. 2

F.E.A.R. 2

2009
low 800x600
Quadro FX 880M:
179.6  fps
med. 1024x768
Quadro FX 880M:
65.9  fps
high 1280x1024
Quadro FX 880M:
42.3  fps
Far Cry 2

Far Cry 2

2008
low 640x480
Quadro FX 880M:
93.3  fps
high 1024x768
Quadro FX 880M:
32.4  fps
Racedriver: GRID

Racedriver: GRID

2008
med. 1024x768
Quadro FX 880M:
48.7  fps
high 1280x1024
Quadro FX 880M:
28.9  fps
Call of Duty 4 - Modern Warfare

Call of Duty 4 - Modern Warfare

2007
low 800x600
Quadro FX 880M:
225.7  fps
med. 1024x768
Quadro FX 880M:
60  fps
high 1280x1024
Quadro FX 880M:
59.9  fps
Supreme Commander - FA Bench

Supreme Commander - FA Bench

2007
med. 1024x768
Quadro FX 880M:
29.9  fps
high 1024x768
Quadro FX 880M:
28.2  fps
Crysis - GPU Benchmark

Crysis - GPU Benchmark

2007
med. 1024x768
100%
Quadro FX 360M:
10.1  fps
Crysis - CPU Benchmark

Crysis - CPU Benchmark

2007
med. 1024x768
100%
Quadro FX 360M:
7.4  fps
F.E.A.R.

F.E.A.R.

2005
low 640x480
100%
Quadro FX 360M:
328  fps
med. 800x600
100%
Quadro FX 360M:
62  fps
high 1024x768
100%
Quadro FX 360M:
17  fps
Quake 3 Arena - Timedemo

Quake 3 Arena - Timedemo

1999
high 1024x768
100%
Quadro FX 360M:
242.7  fps

Average Gaming NVIDIA Quadro FX 360M → 100%

Average Gaming 30-70 fps → 100%

NVIDIA Quadro FX 880Mlowmed.highultraQHD4K
Fifa 11129.290.550.4
StarCraft 2155422912
Battlefield: Bad Company 258.830.416.19.7
CoD Modern Warfare 2124.142.235.421
Risen75.4321912.7
Colin McRae: DIRT 279.3473012.8
Anno 140410020
F.E.A.R. 2179.665.942.3
Far Cry 293.332.39
Racedriver: GRID48.728.9
Call of Duty 4 - Modern Warfare225.76059.9
Supreme Commander - FA Bench29.9228.18
< 30 fps
< 60 fps
< 120 fps
≥ 120 fps

1
4
4
1
6
2
1
5
5
1
6
1


NVIDIA Quadro FX 360Mlowmed.highultraQHD4K
Crysis - GPU Benchmark10.07
Crysis - CPU Benchmark7.39
F.E.A.R.3286217
Quake 3 Arena - Timedemo242.7
< 30 fps
< 60 fps
< 120 fps
≥ 120 fps


1
2

1
1


1


For more games that might be playable and a list of all games and graphics cards visit our Gaming List

v1.26
log 16. 21:09:05

#0 checking url part for id 513 +0s ... 0s

#1 checking url part for id 1621 +0s ... 0s

#2 checking url part for id 883 +0s ... 0s

#3 not redirecting to Ajax server +0s ... 0s

#4 did not recreate cache, as it is less than 5 days old! Created at Tue, 16 Apr 2024 05:39:00 +0200 +0.001s ... 0.001s

#5 composed specs +0.201s ... 0.202s

#6 did output specs +0s ... 0.202s

#7 start showIntegratedCPUs +0s ... 0.202s

#8 getting avg benchmarks for device 513 +0.043s ... 0.245s

#9 got single benchmarks 513 +0.01s ... 0.256s

#10 getting avg benchmarks for device 1621 +0.002s ... 0.258s

#11 got single benchmarks 1621 +0.021s ... 0.279s

#12 getting avg benchmarks for device 883 +0.002s ... 0.281s

#13 got single benchmarks 883 +0.01s ... 0.291s

#14 got avg benchmarks for devices +0s ... 0.291s

#15 min, max, avg, median took s +0.377s ... 0.668s

#16 before gaming benchmark output +0s ... 0.668s

#17 Got 53 rows for game benchmarks. +0.007s ... 0.675s

#18 composed SQL query for gamebenchmarks +0s ... 0.675s

#19 got data and put it in $dataArray +0.008s ... 0.683s

#20 benchmarks composed for output. +0.038s ... 0.721s

#21 calculated avg scores. +0s ... 0.721s

#22 return log +0.002s ... 0.723s

Please share our article, every link counts!
> Expert Reviews and News on Laptops, Smartphones and Tech Innovations > Benchmarks / Tech > Graphics Card Comparison - Head 2 Head
Redaktion, 2017-09- 8 (Update: 2023-07- 1)