Notebookcheck Logo

NVIDIA Quadro FX 3500M vs NVIDIA Quadro FX 350M vs NVIDIA Quadro FX 2800M

NVIDIA Quadro FX 3500M

► remove from comparison NVIDIA Quadro FX 3500M

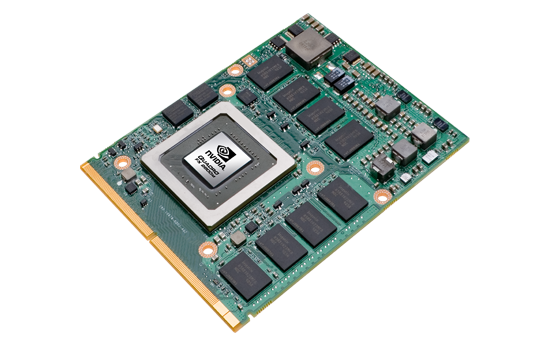
The NVIDIA Quadro FX 3500M was the top professional graphic solution for the mobile use in 2007. The Quadro FX 3500M is especially suitable for CAD, digital image-, video editing and scientifical visualizations (according NVIDIA). It is based upon the NVIDIA GeForce Go 7950GTX. Therefore also a good gaming performance can be expected (for 2007 and if modded drivers are used). The card is shipped with certified drivers for professional applications, which are not optimized for games (inofficially the manual installation of Forceware drivers should be possible).

The drivers of the Quadro FX series are certified for CAD applications (e.g. AutoCad, Inventor, Solidstation, Solud Edge, ...) and DCC applictions (e.g. Maya, 3DS Max, Lightwave 3D, ...) and offers a 12-Bit precision for Subpixel, full image Antialiasing, hardware accelerated Antialiasing for dots and lines and additional optimized settings, which are optimized for CAD and DCC.

Nvidia describes the 3000 series as a power package for big laptops and data structures.

NVIDIA Quadro FX 350M

► remove from comparison NVIDIA Quadro FX 350M

The NVIDIA Quadro FX 350M is a professional workstation graphics card based on the old entry level NVIDIA GeForce Go 7300. Due to certified drivers, the FX 350M is suited for CAD and DCC applications. Still the 3D performance is not very good (even at the time of launch), therefore the card is better suited for 2D CAD applications.

NVIDIA Quadro FX 2800M

► remove from comparison NVIDIA Quadro FX 2800M

The NVIDIA Quadro FX 2800M is a mobile workstation graphics card for high-end laptops. It is based on the Geforce 9800M GT / G92 core but features a higher clock rate and is produced in a 55nm fabrication process versus 65nm of the 9800M GT.

The Quadro FX series of cards are optimized for professional applications like CAD or DCC. OpenGL performance especially should be noticeably better compared to consumer GeForce cards.

The Quadro FX2800M is found in mobile workstations like the Dell M6500 and supports DirectX 10.0 and OpenGL 2.1. In the Dell laptops, the card is able to output up to two displays simultaneously (DisplayPort up to 2560x1600, DVI/HDMI up to 1920x1200). Dell claims a thermal power draw of 65 Watts while Nvidia rates the GPU at 75 Watt TDP.

Due to the relatively high power consumption of 65 to 75 Watts (TDP) and a 10 Watt idle mode, the Quadro FX 2800M is normally only foud in medium to large laptops with powerful cooling solutions.

NVIDIA Quadro FX 3500MNVIDIA Quadro FX 350MNVIDIA Quadro FX 2800M
Quadro FX Series
Quadro FX 3800M 128 @ 0.68 GHz256 Bit @ 1000 MHz
Quadro FX 3700M 128 @ 0.55 GHz256 Bit @ 800 MHz
Quadro FX 2800M 96 @ 0.6 GHz256 Bit @ 1000 MHz
Quadro FX 3600M 96 @ 0.5 GHz256 Bit @ 800 MHz
Quadro FX 1800M 72 @ 0.56 GHz128 Bit @ 1100 MHz
Quadro FX 2700M 48 @ 0.53 GHz256 Bit @ 800 MHz
Quadro FX 880M 48 @ 0.55 GHz128 Bit @ 790 MHz
Quadro FX 3500M 24/8 cores @ 0.58 GHz256 Bit @ 700 MHz
Quadro FX 2500M 24/8 cores @ 0.5 GHz256 Bit @ 600 MHz
Quadro FX 1700M 32 @ 0.63 GHz128 Bit @ 800 MHz
Quadro FX 1600M 32 @ 0.63 GHz128 Bit @ 800 MHz
Quadro FX 1500M 20/7 cores @ 0.38 GHz256 Bit @ 500 MHz
Quadro FX 770M 32 @ 0.5 GHz128 Bit @ 800 MHz
Quadro FX 570M 32 @ 0.48 GHz128 Bit @ 700 MHz
Quadro FX 380M 16 @ 0.63 GHz64 Bit @ 800 MHz
Quadro FX 370M 8 @ 0.58 GHz64 Bit @ 700 MHz
Quadro FX 360M 16 @ 0.4 GHz64 Bit @ 600 MHz
Quadro FX 350M 4/3 cores @ 0.45 GHz64 Bit @ 350 MHz
CodenameG71GLMG72MNB10-GLM3
ArchitectureG7xG9x
Pipelines24 / 8 Pixel- / Vertexshader4 / 3 Pixel- / Vertexshader96 - unified
Core Speed575 MHz450 MHz600 MHz
Memory Speed700 MHz350 MHz1000 MHz
Memory Bus Width256 Bit64 Bit256 Bit
Memory TypeGDDR3DDR-3GDDR3
Max. Amount of Memory512 MB64 MB1024 MB
Shared Memorynonono
APIDirectX 9c, Shader 3.0DirectX 9c, Shader 3.0DirectX 10, Shader 4.0
Power Consumption45 Watt15 Watt75 Watt
Transistors278 Million112 Million754 Million
technology90 nm90 nm55 nm
Features12-bit-sub-pixel, 32-bit-floating-point precision, 32-bit floating point precision, 128 bit graphic pipeline, hardware 3D window clipping, high precision dynamic-range (DPDR) technology, unified memory architecture, nView multi-display (for multi-monitor support), PowerMizer options for energy saving, architecture which is optimized for workstations, rotated-grid full-scene antialiasing (RG FSAA), unified driver architecture, NVIDIA PureVideo technologyPureVideo, UltraShadow II, Intellisample 4.0, CineFX 4.0, PowerMizer 6.0, High Dynamic-Range (HDR) LighningOpenGL 2.1, CUDA, PowerMizer 8.0
Notebook Sizelargelarge
Date of Announcement01.03.2007 31.03.2006 01.12.2009
Link to Manufacturer Pagewww.nvidia.comwww.nvidia.dewww.nvidia.com
Information90nm, 112 Mio Transistoren, PCI-E
Shader Speed1500 MHz

Benchmarks

3DMark Vantage
3DM Vant. Perf. total + NVIDIA Quadro FX 2800M
3DMark Vantage - 3DM Vant. Perf. total
min: 5779     avg: 5783     median: 5783 (2%)     max: 5787 Points
3DM Vant. Perf. GPU no PhysX + NVIDIA Quadro FX 2800M
3DMark Vantage - 3DM Vant. Perf. GPU no PhysX
min: 5000     avg: 5037     median: 5037 (3%)     max: 5074 Points
3DMark 2001SE - 3DMark 2001 - Standard
34844 Points (36%)
3DMark 03 - 3DMark 03 - Standard
20736 Points (11%)
3963 Points (2%)
33900 Points (18%)
3DMark 05 - 3DMark 05 - Standard
9295 Points (10%)
1954 Points (2%)
min: 16310     avg: 16936     median: 16935.5 (19%)     max: 17561 Points
3DMark 06 3DMark 06 - Score Unknown Settings + NVIDIA Quadro FX 3500M
3DMark 06
5254 Points (7%)
3DMark 06 - Score Unknown Settings + NVIDIA Quadro FX 350M
680 Points (1%)
3DMark 06 - Standard 1280x1024 + NVIDIA Quadro FX 2800M
3DMark 06
min: 11162     avg: 11359     median: 11358.5 (15%)     max: 11555 Points
SPEC Viewperf 10.0 - SPEC Viewperf 10.0 - 3dsmax
32.3 Points (67%)
SPEC Viewperf 10.0 - SPEC Viewperf 10.0 - Catia
39 Points (82%)
SPEC Viewperf 10.0 - SPEC Viewperf 10.0 - EnSight
44 Points (93%)
SPEC Viewperf 10.0 - SPEC Viewperf 10.0 - Maya
59.6 Points (32%)
SPEC Viewperf 10.0 - SPEC Viewperf 10.0 - Pro/Engeneer
42.6 Points (83%)
SPEC Viewperf 10.0 - SPEC Viewperf 10.0 - SolidWorks
59.5 Points (88%)
SPEC Viewperf 10.0 - SPEC Viewperf 10.0 - UGS Teamcenter
35.2 Points (91%)
SPEC Viewperf 10.0 - SPEC Viewperf 10.0 - UGS NX
31.3 Points (64%)
SPECviewperf 11
specvp11 snx-01 + NVIDIA Quadro FX 2800M
SPECviewperf 11 - specvp11 snx-01
min: 13.58     avg: 14.7     median: 13.9 (8%)     max: 16.55 fps
specvp11 tcvis-02 + NVIDIA Quadro FX 2800M
SPECviewperf 11 - specvp11 tcvis-02
min: 15.1     avg: 16     median: 15.3 (9%)     max: 17.4 fps
specvp11 sw-02 + NVIDIA Quadro FX 2800M
SPECviewperf 11 - specvp11 sw-02
min: 6.73     avg: 14.1     median: 7.5 (6%)     max: 28 fps
specvp11 proe-05 + NVIDIA Quadro FX 2800M
SPECviewperf 11 - specvp11 proe-05
min: 4.67     avg: 5.1     median: 4.7 (6%)     max: 5.89 fps
specvp11 maya-03 + NVIDIA Quadro FX 2800M
SPECviewperf 11 - specvp11 maya-03
min: 6.2     avg: 7     median: 7.4 (6%)     max: 7.5 fps
specvp11 lightwave-01 + NVIDIA Quadro FX 2800M
SPECviewperf 11 - specvp11 lightwave-01
min: 7.99     avg: 16.2     median: 8.5 (9%)     max: 32 fps
specvp11 ensight-04 + NVIDIA Quadro FX 2800M
SPECviewperf 11 - specvp11 ensight-04
min: 10.8     avg: 11.9     median: 11.1 (5%)     max: 13.7 fps
specvp11 catia-03 + NVIDIA Quadro FX 2800M
SPECviewperf 11 - specvp11 catia-03
min: 9.53     avg: 13.4     median: 9.7 (5%)     max: 20.92 fps
Windows Vista Experience Index - Windows Vista Leistungsindex - Grafik (Spiele)
6.8 Points (100%)
Windows Vista Experience Index - Windows Vista Leistungsindex - Grafik
6.8 Points (100%)
Cinebench R11.5 Cinebench R11.5 OpenGL 64 Bit + NVIDIA Quadro FX 2800M
Cinebench R11.5 - Cinebench R11.5 OpenGL 64 Bit
min: 28.16     avg: 28.8     median: 28.8 (10%)     max: 29.36 fps

Average Benchmarks NVIDIA Quadro FX 3500M → 100% n=2

Average Benchmarks NVIDIA Quadro FX 350M → 20% n=2

Average Benchmarks NVIDIA Quadro FX 2800M → 173% n=2

- Range of benchmark values for this graphics card
- Average benchmark values for this graphics card
* Smaller numbers mean a higher performance
1 This benchmark is not used for the average calculation

Game Benchmarks

The following benchmarks stem from our benchmarks of review laptops. The performance depends on the used graphics memory, clock rate, processor, system settings, drivers, and operating systems. So the results don't have to be representative for all laptops with this GPU. For detailed information on the benchmark results, click on the fps number.

Mafia 2

Mafia 2

2010
low 800x600
Quadro FX 2800M:
63.2  fps
med. 1024x768
Quadro FX 2800M:
56.1  fps
high 1360x768
Quadro FX 2800M:
48.9  fps
ultra 1920x1080
Quadro FX 2800M:
30.8  fps
low 1024x768
Quadro FX 2800M:
158  fps
med. 1360x768
Quadro FX 2800M:
60  fps
high 1360x768
Quadro FX 2800M:
52  fps
ultra 1920x1080
Quadro FX 2800M:
29.6  fps
med. 1366x768
Quadro FX 2800M:
58.9  fps
high 1366x768
Quadro FX 2800M:
41.5  fps
ultra 1920x1080
Quadro FX 2800M:
23.1  fps
low 800x600
Quadro FX 2800M:
158.1  fps
med. 1024x768
Quadro FX 2800M:
78.9  fps
high 1366x768
Quadro FX 2800M:
66.7  fps
ultra 1920x1080
Quadro FX 2800M:
41.2  fps
Colin McRae: DIRT 2

Colin McRae: DIRT 2

2009
low 800x600
Quadro FX 2800M:
96.3  fps
med. 1024x768
Quadro FX 2800M:
89.5  fps
high 1360x768
Quadro FX 2800M:
62.6  fps
ultra 1920x1080
Quadro FX 2800M:
30.7  fps
NVIDIA Quadro FX 2800Mlowmed.highultraQHD4K
Mafia 263.256.148.930.8
StarCraft 2158605229.6
Battlefield: Bad Company 258.941.5323.07
CoD Modern Warfare 2158.178.966.741.2
Colin McRae: DIRT 296.389.562.630.7
< 30 fps
< 60 fps
< 120 fps
≥ 120 fps


2
2

2
3

3
2
2
3


For more games that might be playable and a list of all games and graphics cards visit our Gaming List

v1.26
log 19. 18:20:53

#0 checking url part for id 61 +0s ... 0s

#1 checking url part for id 70 +0s ... 0s

#2 checking url part for id 1544 +0s ... 0s

#3 not redirecting to Ajax server +0s ... 0s

#4 did not recreate cache, as it is less than 5 days old! Created at Fri, 19 Apr 2024 05:40:26 +0200 +0.001s ... 0.001s

#5 composed specs +0.118s ... 0.119s

#6 did output specs +0s ... 0.119s

#7 start showIntegratedCPUs +0s ... 0.119s

#8 getting avg benchmarks for device 61 +0.036s ... 0.155s

#9 got single benchmarks 61 +0.006s ... 0.161s

#10 getting avg benchmarks for device 70 +0.002s ... 0.163s

#11 got single benchmarks 70 +0.006s ... 0.169s

#12 getting avg benchmarks for device 1544 +0.002s ... 0.17s

#13 got single benchmarks 1544 +0.01s ... 0.18s

#14 got avg benchmarks for devices +0s ... 0.18s

#15 min, max, avg, median took s +0.17s ... 0.35s

#16 before gaming benchmark output +0s ... 0.35s

#17 Got 19 rows for game benchmarks. +0.004s ... 0.354s

#18 composed SQL query for gamebenchmarks +0s ... 0.354s

#19 got data and put it in $dataArray +0.004s ... 0.358s

#20 benchmarks composed for output. +0.012s ... 0.37s

#21 calculated avg scores. +0s ... 0.37s

#22 return log +0.002s ... 0.372s

Please share our article, every link counts!
> Expert Reviews and News on Laptops, Smartphones and Tech Innovations > Benchmarks / Tech > Graphics Card Comparison - Head 2 Head
Redaktion, 2017-09- 8 (Update: 2023-07- 1)