 Deutsch
 English
 Español
 Français
 Italiano
 Nederlands
 Polski
 Português
 Русский
 Türkçe
 Svenska
 Chinese
 Magyar
NVIDIA Quadro FX 2700M vs NVIDIA Quadro FX 1700M vs NVIDIA Quadro FX 3700M
NVIDIA Quadro FX 2700M
► remove from comparison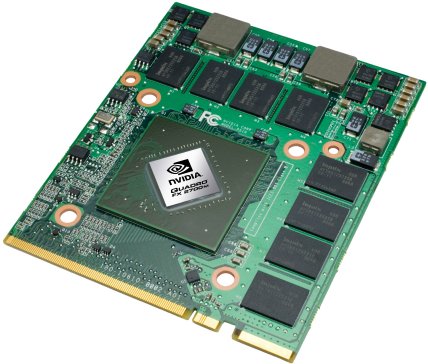
The Nvidia Quadro FX 2700M is a professional graphics card for laptops. It features certified drivers that are optimized for CAD (e.g., AutoCad, Inventor, Solidstation, Solid Edge, ..), DCC (e.g., Maya, 3DS Max, Lightwave 3D, ...), and visualization applications. The FX 2700M is based on the G94 core and therefore similar to the GeForce 9700M GTS.
The Quadro FX series of cards are optimized for professional applications like CAD or DCC. Especially the OpenGL performance should be noticeable better than with consumer GeForce cards. The certified drivers, that come with the Quadro cards guarantee a frictionless work with applications like AutoCad, Inventor, Solidstation, Maya, 3DS Max, Lightwave 3d and others. Furthermore they offer 12-Bit precision for subpixels, fullscreen anti-aliasing, hardware accelerated antialiasing for points and lines and other CAD and DCC optimizations.
NVIDIA Quadro FX 1700M
► remove from comparison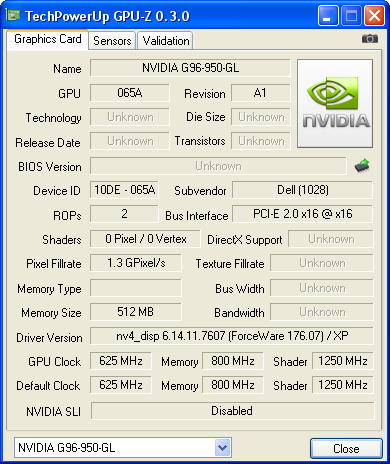
The Nvidia Quadro FX 1700M is a professional graphics adapter for CAD and 3D applications. It is based on the G96 core (GeForce 9650M e.g.) but with different drivers, that are optimized for OpenGL and professional applications. The drivers are zertified to work flawlessly with different applications.
Compared to the Quadro FX 1600M, the FX 1700M GPU supports Powermizer 8.0.
NVIDIA Quadro FX 3700M
► remove from comparisonThe Nvidia GeForce FX 3700M is a professional high-end workstation graphics card for laptops. It is manufactured in 65nm and is based on the G92 core with all 128 shaders enabled. The GPU is most comparable to the consumer GeForce GTX 280M with the largest difference being the manufacturing process (65nm of the 3700M vs 55nm of the 280M). The immediate successor to the 3700M is the Quadro FX 3800M, which is based on the GeForce GTX 285M but with higher clock rates and relatively similar power consumption demands.
| NVIDIA Quadro FX 2700M | NVIDIA Quadro FX 1700M | NVIDIA Quadro FX 3700M | |||||||||||||||||||||||||||||||||||||||||||||||||||||||||||||||||||||||||||||||||||||||||||||||||||||||||||||||||||||||||||||||||||||||||||||||||||||||||||||||||||
| Quadro FX Series |
|
|
| ||||||||||||||||||||||||||||||||||||||||||||||||||||||||||||||||||||||||||||||||||||||||||||||||||||||||||||||||||||||||||||||||||||||||||||||||||||||||||||||||||
| Codename | NB9E-GLM2 | NB9P-GLM | NB9E-GLM3 | ||||||||||||||||||||||||||||||||||||||||||||||||||||||||||||||||||||||||||||||||||||||||||||||||||||||||||||||||||||||||||||||||||||||||||||||||||||||||||||||||||
| Architecture | G9x | G9x | G9x | ||||||||||||||||||||||||||||||||||||||||||||||||||||||||||||||||||||||||||||||||||||||||||||||||||||||||||||||||||||||||||||||||||||||||||||||||||||||||||||||||||
| Pipelines | 48 - unified | 32 - unified | 128 - unified | ||||||||||||||||||||||||||||||||||||||||||||||||||||||||||||||||||||||||||||||||||||||||||||||||||||||||||||||||||||||||||||||||||||||||||||||||||||||||||||||||||
| Core Speed | 530 MHz | 625 MHz | 550 MHz | ||||||||||||||||||||||||||||||||||||||||||||||||||||||||||||||||||||||||||||||||||||||||||||||||||||||||||||||||||||||||||||||||||||||||||||||||||||||||||||||||||
| Shader Speed | 1325 MHz | 1250 MHz | 1375 MHz | ||||||||||||||||||||||||||||||||||||||||||||||||||||||||||||||||||||||||||||||||||||||||||||||||||||||||||||||||||||||||||||||||||||||||||||||||||||||||||||||||||
| Memory Speed | 800 MHz | 800 MHz | 800 MHz | ||||||||||||||||||||||||||||||||||||||||||||||||||||||||||||||||||||||||||||||||||||||||||||||||||||||||||||||||||||||||||||||||||||||||||||||||||||||||||||||||||
| Memory Bus Width | 256 Bit | 128 Bit | 256 Bit | ||||||||||||||||||||||||||||||||||||||||||||||||||||||||||||||||||||||||||||||||||||||||||||||||||||||||||||||||||||||||||||||||||||||||||||||||||||||||||||||||||
| Memory Type | GDDR3 | GDDR3 | GDDR3 | ||||||||||||||||||||||||||||||||||||||||||||||||||||||||||||||||||||||||||||||||||||||||||||||||||||||||||||||||||||||||||||||||||||||||||||||||||||||||||||||||||
| Max. Amount of Memory | 1024 MB | 256 MB | 1024 MB | ||||||||||||||||||||||||||||||||||||||||||||||||||||||||||||||||||||||||||||||||||||||||||||||||||||||||||||||||||||||||||||||||||||||||||||||||||||||||||||||||||
| Shared Memory | no | no | no | ||||||||||||||||||||||||||||||||||||||||||||||||||||||||||||||||||||||||||||||||||||||||||||||||||||||||||||||||||||||||||||||||||||||||||||||||||||||||||||||||||
| API | DirectX 10, Shader 4.0 | DirectX 10, Shader 4.0 | DirectX 10, Shader 4.0 | ||||||||||||||||||||||||||||||||||||||||||||||||||||||||||||||||||||||||||||||||||||||||||||||||||||||||||||||||||||||||||||||||||||||||||||||||||||||||||||||||||
| Power Consumption | 65 Watt | 50 Watt | 75 Watt | ||||||||||||||||||||||||||||||||||||||||||||||||||||||||||||||||||||||||||||||||||||||||||||||||||||||||||||||||||||||||||||||||||||||||||||||||||||||||||||||||||
| Transistors | 504 Million | 289 Million | 754 Million | ||||||||||||||||||||||||||||||||||||||||||||||||||||||||||||||||||||||||||||||||||||||||||||||||||||||||||||||||||||||||||||||||||||||||||||||||||||||||||||||||||
| technology | 65 nm | 65 nm | 65 nm | ||||||||||||||||||||||||||||||||||||||||||||||||||||||||||||||||||||||||||||||||||||||||||||||||||||||||||||||||||||||||||||||||||||||||||||||||||||||||||||||||||
| Features | OpenGL 2.1, PowerMizer 8.0, PureVideo HD | OpenGL 2.1, PureVideo HD, Powermizer 8.0, possible interfaces: LVDS, DVI, VGA, HDTV, HDCP, HDMI | OpenGL 2.1, CUDA, PowerMizer 8.0 | ||||||||||||||||||||||||||||||||||||||||||||||||||||||||||||||||||||||||||||||||||||||||||||||||||||||||||||||||||||||||||||||||||||||||||||||||||||||||||||||||||
| Notebook Size | large | large | large | ||||||||||||||||||||||||||||||||||||||||||||||||||||||||||||||||||||||||||||||||||||||||||||||||||||||||||||||||||||||||||||||||||||||||||||||||||||||||||||||||||
| Date of Announcement | 14.08.2008 | 01.10.2008 | 14.08.2008 | ||||||||||||||||||||||||||||||||||||||||||||||||||||||||||||||||||||||||||||||||||||||||||||||||||||||||||||||||||||||||||||||||||||||||||||||||||||||||||||||||||
| Link to Manufacturer Page | www.nvidia.com | www.nvidia.com | www.nvidia.com | ||||||||||||||||||||||||||||||||||||||||||||||||||||||||||||||||||||||||||||||||||||||||||||||||||||||||||||||||||||||||||||||||||||||||||||||||||||||||||||||||||
| Information | CG shading language, 32 Bit floating point precision, 12 Bit subpixel precision, 128 Bit precision of the graphics pipeline, FSAA with rotated raster, nView Mutlidisplay Support, High-Precision-Dynamic-Range (HPDR), Hardware 3D Clipping on window recognision, full screen AA |


