NVIDIA Quadro FX 2500M vs NVIDIA Quadro FX 1700M vs NVIDIA Quadro FX 3800M
NVIDIA Quadro FX 2500M ► remove from comparison
This is a professional video card for notebooks from NVidia It is based on 7900GTX.
The application performance is very good due to special professional drivers (3D rendering, CAD), but the gaming performance is weaker. With modded drivers, it should work like a 7900 GTX .
NVIDIA Quadro FX 1700M ► remove from comparison
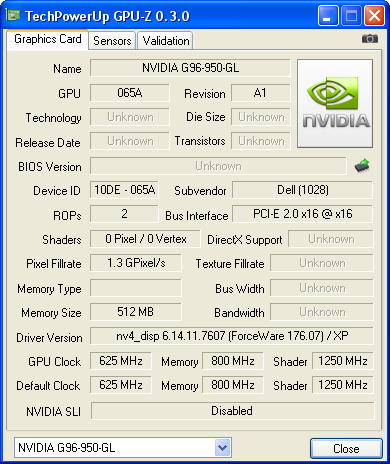
The Nvidia Quadro FX 1700M is a professional graphics adapter for CAD and 3D applications. It is based on the G96 core (GeForce 9650M e.g.) but with different drivers, that are optimized for OpenGL and professional applications. The drivers are zertified to work flawlessly with different applications.
Compared to the Quadro FX 1600M, the FX 1700M GPU supports Powermizer 8.0.
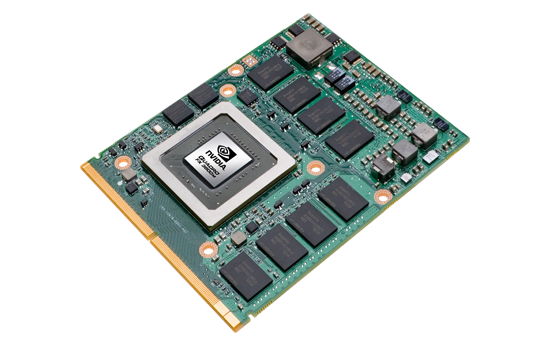
NVIDIA Quadro FX 3800M ► remove from comparison
The NVIDIA Quadro FX 3800M is a mobile workstation graphics card for high end laptops. It is based on the Geforce GTX 280M core (G92 core) and features 128 CUDA cores (unified shaders).
Compared to the Quadro FX 3700M, the Quadro FX 3800M features a higher clock speed and is manufacturered in 55nm (compared to 65nm of the 3700M). In fact, the FX3800M is clocked even higher than the consumer GeForce GTX 280M and performs notably better as a result.
The Quadro FX series of cards are optimized for professional applications like CAD or DCC. Notably, OpenGL performance should be much improved compared to consumer GeForce cards of similar specifications.
At the time its announcement (December 2009), the FX 3800M was the fastest workstation graphics card for laptops.
NVIDIA Quadro FX 2500M NVIDIA Quadro FX 1700M NVIDIA Quadro FX 3800M Quadro FX Series Codename G71glm NB9P-GLM N10E-GLM4 Architecture G7x G9x G9x Pipelines 24 / 8 Pixel- / Vertexshader 32 - unified 128 - unified Core Speed 500 MHz 625 MHz 675 MHz Memory Speed 600 MHz 800 MHz 1000 MHz Memory Bus Width 256 Bit 128 Bit 256 Bit Memory Type GDDR3 GDDR3 GDDR3 Max. Amount of Memory 512 MB 256 MB 1024 MB Shared Memory no no no API DirectX 9c, Shader 3.0 DirectX 10, Shader 4.0 DirectX 10, Shader 4.0 Power Consumption 45 Watt 50 Watt 100 Watt Transistors 278 Million 289 Million 754 Million technology 90 nm 65 nm 55 nm Features 90nm OpenGL 2.1, PureVideo HD, Powermizer 8.0, possible interfaces: LVDS, DVI, VGA, HDTV, HDCP, HDMI OpenGL 2.1, CUDA, PowerMizer 8.0 Notebook Size large large large Date of Announcement 29.09.2005 01.10.2008 20.12.2009 Link to Manufacturer Page www.nvidia.de www.nvidia.com www.nvidia.com Shader Speed 1250 MHz 1688 MHz Information CG shading language, 32 Bit floating point precision, 12 Bit subpixel precision, 128 Bit precision of the graphics pipeline, FSAA with rotated raster, nView Mutlidisplay Support, High-Precision-Dynamic-Range (HPDR), Hardware 3D Clipping on window recognision, full screen AA
Benchmarks min: 6584 avg: 6951 median: 6779 (2%) max: 7491 Points
3DM Vant. Perf. GPU no PhysX + NVIDIA Quadro FX 3800M 3DMark Vantage - 3DM Vant. Perf. GPU no PhysX
min: 5758 avg: 5926 median: 6002 (3%) max: 6019 Points
3DMark 2001SE - 3DMark 2001 - Standard
27600 Points (29%)
35734 Points (37%)
min: 32886 avg: 34790 median: 34790 (36%) max: 36694 Points
3DMark 03 - 3DMark 03 - Standard
min: 18100 avg: 18342 median: 18341.5 (10%) max: 18583 Points
18212 Points (10%)
min: 33146 avg: 37082 median: 38191 (20%) max: 39909 Points
3DMark 05 - 3DMark 05 - Standard
min: 8400 avg: 8450 median: 8450 (9%) max: 8500 Points
11550 Points (13%)
min: 16593 avg: 18199 median: 18043 (20%) max: 19960 Points
3DMark 06 3DMark 06 - Score Unknown Settings + NVIDIA Quadro FX 2500M
min: 4690 avg: 4695 median: 4695 (6%) max: 4700 Points
Model CPU GPU RAM Value 3DMark 06 - Score Unknown Settings (3DMark 06 - Score Unknown Settings) Quadro FX 2500M 4690 (3DMark 06 - Score Unknown Settings) T2600 Quadro FX 2500M 0.5 GB 4700
3DMark 06 - Score Unknown Settings + NVIDIA Quadro FX 3800M
13232 Points (17%)
Model CPU GPU RAM Value 3DMark 06 - Score Unknown Settings Dell Precision M6500 920XM Quadro FX 3800M 1 GB 4 GB 13232
3DMark 06 - Standard 1280x800 + NVIDIA Quadro FX 1700M
6302 Points (8%)
Model CPU GPU RAM Value 3DMark 06 - Standard 1280x800 Dell Precision M4400 (3DMark 06 - Standard 1280x800) T9400 Quadro FX 1700M 0.5 GB 4 GB 6302
3DMark 06 - Standard 1280x1024 + NVIDIA Quadro FX 3800M
min: 12050 avg: 12765 median: 12923 (17%) max: 13323 Points
Model CPU GPU RAM Value 3DMark 06 - Standard 1280x1024 Lenovo ThinkPad W701ds NTV5FPB164 (3DMark 06 - Standard 1280x1024) 820QM Quadro FX 3800M 675 / 1650 MHz 1 GB 16 GB 12050 HP EliteBook 8740w (WD942EA) (3DMark 06 - Standard 1280x1024) 740QM Quadro FX 3800M 675 / 1000 MHz 1 GB 8 GB 12923 Dell Precision M6500 920XM Quadro FX 3800M 675/1688 / 1000 MHz 1 GB 13323
SPEC Viewperf 10.0 - SPEC Viewperf 10.0 - 3dsmax
32.8 Points (68%)
SPEC Viewperf 10.0 - SPEC Viewperf 10.0 - Catia
45.8 Points (96%)
SPEC Viewperf 10.0 - SPEC Viewperf 10.0 - EnSight
47.4 Points (100%)
SPEC Viewperf 10.0 - SPEC Viewperf 10.0 - Maya
59.7 Points (32%)
SPEC Viewperf 10.0 - SPEC Viewperf 10.0 - Pro/Engeneer
51.1 Points (100%)
SPEC Viewperf 10.0 - SPEC Viewperf 10.0 - SolidWorks
59.7 Points (88%)
SPEC Viewperf 10.0 - SPEC Viewperf 10.0 - UGS Teamcenter
38.5 Points (100%)
SPEC Viewperf 10.0 - SPEC Viewperf 10.0 - UGS NX
35.3 Points (72%)
SPECviewperf 11 + NVIDIA Quadro FX 3800M SPECviewperf 11 - specvp11 snx-01
18.8 fps (11%)
specvp11 tcvis-02 + NVIDIA Quadro FX 3800M SPECviewperf 11 - specvp11 tcvis-02
18.7 fps (11%)
specvp11 sw-02 + NVIDIA Quadro FX 3800M SPECviewperf 11 - specvp11 sw-02
30.6 fps (23%)
specvp11 proe-05 + NVIDIA Quadro FX 3800M SPECviewperf 11 - specvp11 proe-05
6.9 fps (8%)
specvp11 maya-03 + NVIDIA Quadro FX 3800M SPECviewperf 11 - specvp11 maya-03
16.6 fps (12%)
specvp11 lightwave-01 + NVIDIA Quadro FX 3800M SPECviewperf 11 - specvp11 lightwave-01
38.4 fps (41%)
specvp11 ensight-04 + NVIDIA Quadro FX 3800M SPECviewperf 11 - specvp11 ensight-04
16.2 fps (8%)
specvp11 catia-03 + NVIDIA Quadro FX 3800M SPECviewperf 11 - specvp11 catia-03
23.4 fps (12%)
Windows 7 Experience Index - Win7 Gaming graphics
6.9 Points (87%)
Windows 7 Experience Index - Win7 Graphics
6.9 Points (87%)
Cinebench R10 Cinebench R10 Shading (32bit) + NVIDIA Quadro FX 1700M Cinebench R10 - Cinebench R10 Shading (32bit)
6159 Points (4%)
Cinebench R10 Shading (32bit) + NVIDIA Quadro FX 3800M
min: 4429 avg: 4928 median: 4928 (4%) max: 5427 Points
Cinebench R11.5 Cinebench R11.5 OpenGL 64 Bit + NVIDIA Quadro FX 3800M Cinebench R11.5 - Cinebench R11.5 OpenGL 64 Bit
min: 32.07 avg: 32.7 median: 32.7 (11%) max: 33.29 fps
Average Benchmarks NVIDIA Quadro FX 2500M → 100% n=3 Average Benchmarks NVIDIA Quadro FX 1700M → 122% n=3 Average Benchmarks NVIDIA Quadro FX 3800M → 183% n=3
- Range of benchmark values for this graphics card
- Average benchmark values for this graphics card
* Smaller numbers mean a higher performance
1 This benchmark is not used for the average calculation
Game Benchmarks The following benchmarks stem from our benchmarks of review laptops. The performance depends on the used graphics memory, clock rate, processor, system settings, drivers, and operating systems. So the results don't have to be representative for all laptops with this GPU. For detailed information on the benchmark results, click on the fps number.
Quadro FX 3800M:
230.6 [X] HP EliteBook 8740w (WD942EA) Intel Core i7-740QM 1.7GHz
Quadro FX 3800M
fps
Quadro FX 3800M:
124.2 [X] HP EliteBook 8740w (WD942EA) Intel Core i7-740QM 1.7GHz
Quadro FX 3800M
fps
Quadro FX 3800M:
64.9 [X] HP EliteBook 8740w (WD942EA) Intel Core i7-740QM 1.7GHz
Quadro FX 3800M
fps
Quadro FX 3800M:
31.8 [X] HP EliteBook 8740w (WD942EA) Intel Core i7-740QM 1.7GHz
Quadro FX 3800M
fps
Quadro FX 3800M:
78.5 [X] HP EliteBook 8740w (WD942EA) Intel Core i7-740QM 1.7GHz
Quadro FX 3800M
fps
Quadro FX 3800M:
40.9 [X] HP EliteBook 8740w (WD942EA) Intel Core i7-740QM 1.7GHz
Quadro FX 3800M
fps
Quadro FX 3800M:
97 [X] HP EliteBook 8740w (WD942EA) Intel Core i7-740QM 1.7GHz
Quadro FX 3800M
fps
Quadro FX 3800M:
82 [X] HP EliteBook 8740w (WD942EA) Intel Core i7-740QM 1.7GHz
Quadro FX 3800M
fps
Quadro FX 3800M:
29.9 [X] HP EliteBook 8740w (WD942EA) Intel Core i7-740QM 1.7GHz
Quadro FX 3800M
fps
Quadro FX 3800M:
142.8 [X] HP EliteBook 8740w (WD942EA) Intel Core i7-740QM 1.7GHz
Quadro FX 3800M
fps
Quadro FX 3800M:
61.9 [X] HP EliteBook 8740w (WD942EA) Intel Core i7-740QM 1.7GHz
Quadro FX 3800M
fps
Quadro FX 1700M:
33.3 [X] Dell Precision M4400 Intel Core 2 Duo T9400 2.5GHz
Quadro FX 1700M
fps
Quadro FX 1700M:
19.1 [X] Dell Precision M4400 Intel Core 2 Duo T9400 2.5GHz
Quadro FX 1700M
fps
Quadro FX 1700M:
29.3 [X] Dell Precision M4400 Intel Core 2 Duo T9400 2.5GHz
Quadro FX 1700M
fps
Quadro FX 1700M:
17.1 [X] Dell Precision M4400 Intel Core 2 Duo T9400 2.5GHz
Quadro FX 1700M
fps
Quadro FX 1700M:
378 [X] Dell Precision M4400 Intel Core 2 Duo T9400 2.5GHz
Quadro FX 1700M
fps
Quadro FX 1700M:
152 [X] Dell Precision M4400 Intel Core 2 Duo T9400 2.5GHz
Quadro FX 1700M
fps
Quadro FX 1700M:
59 [X] Dell Precision M4400 Intel Core 2 Duo T9400 2.5GHz
Quadro FX 1700M
fps
Quadro FX 1700M:
610 [X] Dell Precision M4400 Intel Core 2 Duo T9400 2.5GHz
Quadro FX 1700M
fps
NVIDIA Quadro FX 3800M low med. high ultra QHD 4K Fifa 11 230.6 124.2 Risen 64.9 31.8 Need for Speed Shift 78.5 40.9 Colin McRae: DIRT 2 97 82 29.9 Anno 1404 142.8 61.9 < 30 fps < 60 fps < 120 fps ≥ 120 fps 1 1 3 1 1 1 2 1
NVIDIA Quadro FX 1700M low med. high ultra QHD 4K Crysis - GPU Benchmark 33.31 19.06 Crysis - CPU Benchmark 29.3 17.07 F.E.A.R. 378 152 59 Quake 3 Arena - Timedemo 610 < 30 fps < 60 fps < 120 fps ≥ 120 fps 1 1 1 1 2 1 1
For more games that might be playable and a list of all games and graphics cards visit our Gaming List
v1.26
log 20. 06:29:58
#0 checking url part for id 5 +0s ... 0s
#1 checking url part for id 1087 +0s ... 0s
#2 checking url part for id 1541 +0s ... 0s
#3 not redirecting to Ajax server +0s ... 0s
#4 did not recreate cache, as it is less than 5 days old! Created at Fri, 19 Apr 2024 05:40:26 +0200 +0.001s ... 0.001s
#5 composed specs +0.139s ... 0.14s
#6 did output specs +0s ... 0.14s
#7 start showIntegratedCPUs +0s ... 0.14s
#8 getting avg benchmarks for device 5 +0.039s ... 0.179s
#9 got single benchmarks 5 +0.009s ... 0.188s
#10 getting avg benchmarks for device 1087 +0.002s ... 0.19s
#11 got single benchmarks 1087 +0.008s ... 0.198s
#12 getting avg benchmarks for device 1541 +0.002s ... 0.2s
#13 got single benchmarks 1541 +0.019s ... 0.219s
#14 got avg benchmarks for devices +0s ... 0.219s
#15 min, max, avg, median took s +0.236s ... 0.455s
#16 before gaming benchmark output +0s ... 0.455s
#17 Got 19 rows for game benchmarks. +0.006s ... 0.462s
#18 composed SQL query for gamebenchmarks +0s ... 0.462s
#19 got data and put it in $dataArray +0.005s ... 0.466s
#20 benchmarks composed for output. +0.02s ... 0.486s
#21 calculated avg scores. +0s ... 0.486s
#22 return log +0.002s ... 0.488s
Please share our article, every link counts!
Redaktion, 2017-09- 8 (Update: 2023-07- 1)
 Deutsch
 English
 Español
 Français
 Italiano
 Nederlands
 Polski
 Português
 Русский
 Türkçe
 Svenska
 Chinese
 Magyar