Notebookcheck Logo

NVIDIA Quadro FX 1600M vs NVIDIA Quadro FX 2800M vs NVIDIA Quadro FX 1800M

NVIDIA Quadro FX 1600M

► remove from comparison

This is a highend workstation graphic chip (for CAD and 3D programs optimized) with DirectX 10 and good OpenGL support - probably based on the GeForce 8700M GT graphic card. It is intended for digital content creators, engineers, earthscientists and other professional 3D applications. Certified drivers grant thecorrect and faster (compared to 8700M) representation of professional programs (CAD, CCD, visualisation software).

NVIDIA Quadro FX 2800M

► remove from comparison NVIDIA Quadro FX 2800M

The NVIDIA Quadro FX 2800M is a mobile workstation graphics card for high-end laptops. It is based on the Geforce 9800M GT / G92 core but features a higher clock rate and is produced in a 55nm fabrication process versus 65nm of the 9800M GT.

The Quadro FX series of cards are optimized for professional applications like CAD or DCC. OpenGL performance especially should be noticeably better compared to consumer GeForce cards.

The Quadro FX2800M is found in mobile workstations like the Dell M6500 and supports DirectX 10.0 and OpenGL 2.1. In the Dell laptops, the card is able to output up to two displays simultaneously (DisplayPort up to 2560x1600, DVI/HDMI up to 1920x1200). Dell claims a thermal power draw of 65 Watts while Nvidia rates the GPU at 75 Watt TDP.

Due to the relatively high power consumption of 65 to 75 Watts (TDP) and a 10 Watt idle mode, the Quadro FX 2800M is normally only foud in medium to large laptops with powerful cooling solutions.

NVIDIA Quadro FX 1800M

► remove from comparison NVIDIA Quadro FX 1800M

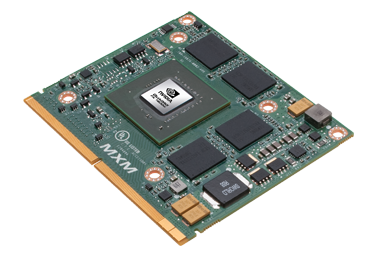
The NVIDIA Quadro FX 1800M is a upper mid-range professional graphics card for mobile workstations with about 15" displays. It is based on the same chip as the GeForce GT 335M but can be also equipped with fast GDDR5 graphics memory. The FX1800M is shipped with professional drivers and a special BIOS that improves the performance and stability in applications like CAD and DCC.

The certified drivers guarantee flawless and fast working with professional applications like Premiere, Photoshop, After Effect, AutoCAD, 3ds Max, trueSpace, Blender, Catia, IronCAD, Cinema 4D, Lightwave 3D, Softimage, Mathematica ... A list of all 
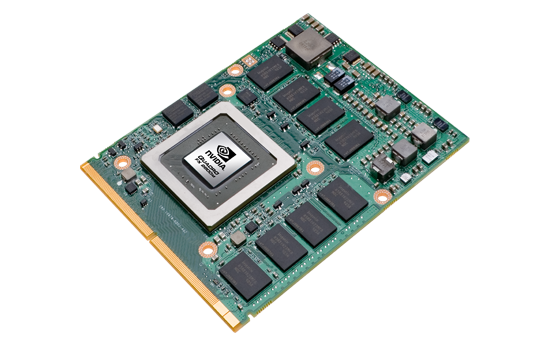
certified applications can be found on the Nvidia.com homepage. Compared to GeForce products, the Quadro FX cards offer a significantly better performance, especially for OpenGL based apps.

The gaming performance should be similar to the GeForce GT 335M, altough gamers should choose a GeForce graphics card because of the optimized driver support (that leads to a better performance and less problems in games). Still all modern and demanding games of 2009 should at least run in medium detail settings (see the GeForce GT 335M page for more gaming results).

The chip is manufactured in 40nm and offers 72 1-dimensional unified shaders. These can be compared to about 300-400 5-dimensional shaders in graphics cards by AMD. These processing cores can also be accessed with CUDA, OpenCL, and DirectCompute to use the calculation power for other tasks than rendering images (for example transcoding videos). 

The QuadroFX 1800M also supports PureVideo HD with the new VideoProcessor (VP4) to decode HD videos on the graphics card. This helps reducing CPU load and increasing battery runtimes.

The Quadro FX 1800M also supports the automatic switching between the integrated and dedicated graphics card using Optimus. First mobile workstations do not offer Optimus, as the development cycles of these laptops are very long.

NVIDIA Quadro FX 1600MNVIDIA Quadro FX 2800MNVIDIA Quadro FX 1800M
Quadro FX Series
Quadro FX 3800M 128 @ 0.68 GHz256 Bit @ 1000 MHz
Quadro FX 3700M 128 @ 0.55 GHz256 Bit @ 800 MHz
Quadro FX 2800M 96 @ 0.6 GHz256 Bit @ 1000 MHz
Quadro FX 3600M 96 @ 0.5 GHz256 Bit @ 800 MHz
Quadro FX 1800M 72 @ 0.56 GHz128 Bit @ 1100 MHz
Quadro FX 2700M 48 @ 0.53 GHz256 Bit @ 800 MHz
Quadro FX 880M 48 @ 0.55 GHz128 Bit @ 790 MHz
Quadro FX 3500M 24/8 cores @ 0.58 GHz256 Bit @ 700 MHz
Quadro FX 2500M 24/8 cores @ 0.5 GHz256 Bit @ 600 MHz
Quadro FX 1700M 32 @ 0.63 GHz128 Bit @ 800 MHz
Quadro FX 1600M 32 @ 0.63 GHz128 Bit @ 800 MHz
Quadro FX 1500M 20/7 cores @ 0.38 GHz256 Bit @ 500 MHz
Quadro FX 770M 32 @ 0.5 GHz128 Bit @ 800 MHz
Quadro FX 570M 32 @ 0.48 GHz128 Bit @ 700 MHz
Quadro FX 380M 16 @ 0.63 GHz64 Bit @ 800 MHz
Quadro FX 370M 8 @ 0.58 GHz64 Bit @ 700 MHz
Quadro FX 360M 16 @ 0.4 GHz64 Bit @ 600 MHz
Quadro FX 350M 4/3 cores @ 0.45 GHz64 Bit @ 350 MHz
CodenameNB8P-GLMNB10-GLM3
ArchitectureG8xG9xGT2xx
Pipelines32 - unified96 - unified72 - unified
Core Speed625 MHz600 MHz560 MHz
Shader Speed1250 MHz1500 MHz1125 MHz
Memory Speed800 MHz1000 MHz1100 MHz
Memory Bus Width128 Bit256 Bit128 Bit
Memory TypeGDDR3GDDR3DDR3, GDDR5
Max. Amount of Memory512 MB1024 MB1024 MB
Shared Memorynonono
APIDirectX 10, Shader 4.0DirectX 10, Shader 4.0DirectX 10.1, Shader 4.1
Power Consumption50 Watt75 Watt45 Watt
Transistors289 Million754 Million
technology80 nm55 nm40 nm
FeaturesPureVideo, video scaling, LCDs with 1920x1200 pixel, PCI-Express, connection for ext. graphic cardOpenGL 2.1, CUDA, PowerMizer 8.0PowerMizer 9.0, EnergyStar (3.8W), 16x FSAA Support, CUDA, NVIEW, OpenGL 3.2
Notebook Sizelargelargemedium sized
Date of Announcement01.06.2007 01.12.2009 01.02.2010
InformationCG shading language, 32 bit floating point precision, 12 bit subpixel precision, 128 bit precision of the graphic pipeline, vertex and pixelshader programmability, PCI-E inferface, FSAA with turned grid, nView multidisplay support, high-precision dynamic-range (HPDR) technology, hardware 3D clipping, full screen antialiasing
Link to Manufacturer Pagewww.nvidia.comwww.nvidia.comwww.nvidia.com

Benchmarks

3DMark Vantage
3DM Vant. Perf. total + NVIDIA Quadro FX 2800M
3DMark Vantage - 3DM Vant. Perf. total
min: 5779     avg: 5783     median: 5783 (2%)     max: 5787 Points
3DM Vant. Perf. total + NVIDIA Quadro FX 1800M
min: 3444     avg: 3452     median: 3451.5 (1%)     max: 3459 Points
3DM Vant. Perf. GPU no PhysX + NVIDIA Quadro FX 2800M
3DMark Vantage - 3DM Vant. Perf. GPU no PhysX
min: 5000     avg: 5037     median: 5037 (3%)     max: 5074 Points
3DM Vant. Perf. GPU no PhysX + NVIDIA Quadro FX 1800M
min: 2774     avg: 2801     median: 2800.5 (2%)     max: 2827 Points
3DMark 2001SE - 3DMark 2001 - Standard
min: 27822     avg: 32843     median: 35198 (37%)     max: 35509 Points
34844 Points (36%)
3DMark 03 - 3DMark 03 - Standard
min: 15060     avg: 16009     median: 15915 (8%)     max: 17144 Points
33900 Points (18%)
3DMark 05 - 3DMark 05 - Standard
min: 9344     avg: 9963     median: 9873 (11%)     max: 10375 Points
min: 16310     avg: 16936     median: 16935.5 (19%)     max: 17561 Points
15249 Points (17%)
3DMark 06 3DMark 06 - Score Unknown Settings + NVIDIA Quadro FX 1600M
3DMark 06
min: 4535     avg: 4623     median: 4622.5 (6%)     max: 4710 Points
3DMark 06 - Standard 1280x1024 + NVIDIA Quadro FX 1600M
3DMark 06
min: 4798     avg: 4916     median: 4915.5 (6%)     max: 5033 Points
3DMark 06 - Standard 1280x1024 + NVIDIA Quadro FX 2800M
min: 11162     avg: 11359     median: 11358.5 (15%)     max: 11555 Points
3DMark 06 - Standard 1280x1024 + NVIDIA Quadro FX 1800M
min: 7416     avg: 7573     median: 7572.5 (10%)     max: 7729 Points
3DMark 06 - Standard 1280x800 + NVIDIA Quadro FX 1600M
3DMark 06
5608 Points (7%)
SPEC Viewperf 10.0 - SPEC Viewperf 10.0 - 3dsmax
32.3 Points (67%)
SPEC Viewperf 10.0 - SPEC Viewperf 10.0 - Catia
39 Points (82%)
SPEC Viewperf 10.0 - SPEC Viewperf 10.0 - EnSight
44 Points (93%)
SPEC Viewperf 10.0 - SPEC Viewperf 10.0 - Maya
59.6 Points (32%)
SPEC Viewperf 10.0 - SPEC Viewperf 10.0 - Pro/Engeneer
42.6 Points (83%)
SPEC Viewperf 10.0 - SPEC Viewperf 10.0 - SolidWorks
59.5 Points (88%)
SPEC Viewperf 10.0 - SPEC Viewperf 10.0 - UGS Teamcenter
35.2 Points (91%)
SPEC Viewperf 10.0 - SPEC Viewperf 10.0 - UGS NX
31.3 Points (64%)
SPECviewperf 11
specvp11 snx-01 + NVIDIA Quadro FX 2800M
SPECviewperf 11 - specvp11 snx-01
min: 13.58     avg: 14.7     median: 13.9 (8%)     max: 16.55 fps
specvp11 snx-01 + NVIDIA Quadro FX 1800M
12.4 fps (7%)
specvp11 tcvis-02 + NVIDIA Quadro FX 2800M
SPECviewperf 11 - specvp11 tcvis-02
min: 15.1     avg: 16     median: 15.3 (9%)     max: 17.4 fps
specvp11 tcvis-02 + NVIDIA Quadro FX 1800M
13 fps (7%)
specvp11 sw-02 + NVIDIA Quadro FX 2800M
SPECviewperf 11 - specvp11 sw-02
min: 6.73     avg: 14.1     median: 7.5 (6%)     max: 28 fps
specvp11 sw-02 + NVIDIA Quadro FX 1800M
28.1 fps (21%)
specvp11 proe-05 + NVIDIA Quadro FX 2800M
SPECviewperf 11 - specvp11 proe-05
min: 4.67     avg: 5.1     median: 4.7 (6%)     max: 5.89 fps
specvp11 proe-05 + NVIDIA Quadro FX 1800M
7.5 fps (9%)
specvp11 maya-03 + NVIDIA Quadro FX 2800M
SPECviewperf 11 - specvp11 maya-03
min: 6.2     avg: 7     median: 7.4 (6%)     max: 7.5 fps
specvp11 maya-03 + NVIDIA Quadro FX 1800M
16.6 fps (13%)
specvp11 lightwave-01 + NVIDIA Quadro FX 2800M
SPECviewperf 11 - specvp11 lightwave-01
min: 7.99     avg: 16.2     median: 8.5 (9%)     max: 32 fps
specvp11 lightwave-01 + NVIDIA Quadro FX 1800M
39 fps (42%)
specvp11 ensight-04 + NVIDIA Quadro FX 2800M
SPECviewperf 11 - specvp11 ensight-04
min: 10.8     avg: 11.9     median: 11.1 (5%)     max: 13.7 fps
specvp11 ensight-04 + NVIDIA Quadro FX 1800M
12.3 fps (6%)
specvp11 catia-03 + NVIDIA Quadro FX 2800M
SPECviewperf 11 - specvp11 catia-03
min: 9.53     avg: 13.4     median: 9.7 (5%)     max: 20.92 fps
specvp11 catia-03 + NVIDIA Quadro FX 1800M
17.5 fps (9%)
Windows 7 Experience Index - Win7 Gaming graphics
6.6 Points (84%)
Windows 7 Experience Index - Win7 Graphics
5 Points (63%)
Windows Vista Experience Index - Windows Vista Leistungsindex - Grafik (Spiele)
6.8 Points (100%)
Windows Vista Experience Index - Windows Vista Leistungsindex - Grafik
6.8 Points (100%)
Cinebench R10 Cinebench R10 Shading (32bit) + NVIDIA Quadro FX 1600M
Cinebench R10 - Cinebench R10 Shading (32bit)
min: 3899     avg: 4670     median: 4885 (3%)     max: 5226 Points
Cinebench R11.5 Cinebench R11.5 OpenGL 64 Bit + NVIDIA Quadro FX 2800M
Cinebench R11.5 - Cinebench R11.5 OpenGL 64 Bit
min: 28.16     avg: 28.8     median: 28.8 (10%)     max: 29.36 fps
Cinebench R11.5 OpenGL 64 Bit + NVIDIA Quadro FX 1800M
20 fps (7%)

Average Benchmarks NVIDIA Quadro FX 1600M → 100% n=2

Average Benchmarks NVIDIA Quadro FX 2800M → 201% n=2

Average Benchmarks NVIDIA Quadro FX 1800M → 154% n=2

- Range of benchmark values for this graphics card
- Average benchmark values for this graphics card
* Smaller numbers mean a higher performance
1 This benchmark is not used for the average calculation

Game Benchmarks

The following benchmarks stem from our benchmarks of review laptops. The performance depends on the used graphics memory, clock rate, processor, system settings, drivers, and operating systems. So the results don't have to be representative for all laptops with this GPU. For detailed information on the benchmark results, click on the fps number.

Mafia 2

Mafia 2

2010
low 800x600
Quadro FX 2800M:
63.2  fps
med. 1024x768
Quadro FX 2800M:
56.1  fps
high 1360x768
Quadro FX 2800M:
48.9  fps
ultra 1920x1080
Quadro FX 2800M:
30.8  fps
low 1024x768
Quadro FX 2800M:
158  fps
med. 1360x768
Quadro FX 2800M:
60  fps
high 1360x768
Quadro FX 2800M:
52  fps
ultra 1920x1080
Quadro FX 2800M:
29.6  fps
med. 1366x768
Quadro FX 2800M:
58.9  fps
high 1366x768
Quadro FX 2800M:
41.5  fps
ultra 1920x1080
Quadro FX 2800M:
23.1  fps
low 800x600
Quadro FX 2800M:
158.1  fps
med. 1024x768
Quadro FX 2800M:
78.9  fps
high 1366x768
Quadro FX 2800M:
66.7  fps
ultra 1920x1080
Quadro FX 2800M:
41.2  fps
Colin McRae: DIRT 2

Colin McRae: DIRT 2

2009
low 800x600
Quadro FX 2800M:
96.3  fps
med. 1024x768
Quadro FX 2800M:
89.5  fps
high 1360x768
Quadro FX 2800M:
62.6  fps
ultra 1920x1080
Quadro FX 2800M:
30.7  fps
Crysis - GPU Benchmark

Crysis - GPU Benchmark

2007
low 1024x768
100%
Quadro FX 1600M:
83.2 84.2 ~ 84 fps
med. 1024x768
100%
Quadro FX 1600M:
31.5 33.3 ~ 32 fps
high 1024x768
100%
Quadro FX 1600M:
13.6 14.4 15.9 ~ 15 fps
Crysis - CPU Benchmark

Crysis - CPU Benchmark

2007
low 1024x768
100%
Quadro FX 1600M:
12.7 72.2 73.1 ~ 53 fps
med. 1024x768
100%
Quadro FX 1600M:
23.5 29.6 ~ 27 fps
high 1024x768
100%
Quadro FX 1600M:
13.2 15.6 ~ 14 fps
World in Conflict - Benchmark

World in Conflict - Benchmark

2007
med. 1024x768
100%
Quadro FX 1600M:
36 37 ~ 37 fps
high 1024x768
100%
Quadro FX 1600M:
21 23 ~ 22 fps
F.E.A.R.

F.E.A.R.

2005
low 640x480
100%
Quadro FX 1600M:
444 476 493 ~ 471 fps
med. 800x600
100%
Quadro FX 1600M:
153 162 167 ~ 161 fps
high 1024x768
100%
Quadro FX 1600M:
56 56 59 ~ 57 fps
Doom 3

Doom 3

2004
low 640x480
100%
Quadro FX 1600M:
160.8 173.6 ~ 167 fps
med. 640x480
100%
Quadro FX 1600M:
164.3 174 ~ 169 fps
high 800x600
100%
Quadro FX 1600M:
160.6 165 ~ 163 fps
ultra 1024x768
100%
Quadro FX 1600M:
129.1 129.2 ~ 129 fps
Quake 3 Arena - Timedemo

Quake 3 Arena - Timedemo

1999
high 1024x768
100%
Quadro FX 1600M:
549  fps

Average Gaming NVIDIA Quadro FX 1600M → 100%

Average Gaming 30-70 fps → 100%

NVIDIA Quadro FX 2800Mlowmed.highultraQHD4K
Mafia 263.256.148.930.8
StarCraft 2158605229.6
Battlefield: Bad Company 258.941.5323.07
CoD Modern Warfare 2158.178.966.741.2
Colin McRae: DIRT 296.389.562.630.7
< 30 fps
< 60 fps
< 120 fps
≥ 120 fps


2
2

2
3

3
2
2
3


NVIDIA Quadro FX 1600Mlowmed.highultraQHD4K
Crysis - GPU Benchmark843215
Crysis - CPU Benchmark532714
World in Conflict - Benchmark3722
F.E.A.R.47116157
Doom 3167169163129
Quake 3 Arena - Timedemo549
< 30 fps
< 60 fps
< 120 fps
≥ 120 fps

1
1
2
1
2

2
3
1

2


1


For more games that might be playable and a list of all games and graphics cards visit our Gaming List

v1.26
log 19. 18:18:07

#0 checking url part for id 183 +0s ... 0s

#1 checking url part for id 1544 +0s ... 0s

#2 checking url part for id 1649 +0s ... 0s

#3 not redirecting to Ajax server +0s ... 0s

#4 did not recreate cache, as it is less than 5 days old! Created at Fri, 19 Apr 2024 05:40:26 +0200 +0.001s ... 0.001s

#5 composed specs +0.12s ... 0.121s

#6 did output specs +0s ... 0.121s

#7 start showIntegratedCPUs +0s ... 0.121s

#8 getting avg benchmarks for device 183 +0.043s ... 0.164s

#9 got single benchmarks 183 +0.013s ... 0.176s

#10 getting avg benchmarks for device 1544 +0.002s ... 0.178s

#11 got single benchmarks 1544 +0.013s ... 0.191s

#12 getting avg benchmarks for device 1649 +0.002s ... 0.193s

#13 got single benchmarks 1649 +0.01s ... 0.204s

#14 got avg benchmarks for devices +0s ... 0.204s

#15 min, max, avg, median took s +0.412s ... 0.616s

#16 before gaming benchmark output +0s ... 0.616s

#17 Got 55 rows for game benchmarks. +0.009s ... 0.625s

#18 composed SQL query for gamebenchmarks +0s ... 0.625s

#19 got data and put it in $dataArray +0.008s ... 0.633s

#20 benchmarks composed for output. +0.029s ... 0.661s

#21 calculated avg scores. +0s ... 0.661s

#22 return log +0.002s ... 0.664s

Please share our article, every link counts!
> Expert Reviews and News on Laptops, Smartphones and Tech Innovations > Benchmarks / Tech > Graphics Card Comparison - Head 2 Head
Redaktion, 2017-09- 8 (Update: 2023-07- 1)