 Deutsch
 English
 Español
 Français
 Italiano
 Nederlands
 Polski
 Português
 Русский
 Türkçe
 Svenska
 Chinese
 Magyar
NVIDIA Quadro FX 1500M vs NVIDIA Quadro FX 770M vs NVIDIA Quadro FX 1700M
NVIDIA Quadro FX 1500M
► remove from comparison
NVIDIA Quadro FX 1500M is the version of 7900 GS video card for notebooks, which is optimized for CAD and professional 3D-applications. Technically, it has the same or similar chip (G71 architecture), but with other Bios and support for professional drivers.
The gaming performance is clearly worse than the 7900 GS (because of the application optimizing). Nonetheless, the most modded drivers can be used, so the Quadro FX 1500M is more a 7900 GS (for the operating system).
NVIDIA Quadro FX 770M
► remove from comparison
The Quadro FX 770M is a professional midrange graphics adapter for laptops / mobile workstations. The GPU is optimized for professional 2D and 3D applications like CAD, DCC, and visualization software. The FX770M solutions contains certified graphics drivers for the most popular applications.
The GPU chip of the Quadro FX770M is based on the GeForce 9600M GT consumer card for notebooks. Therefore, the Quadro has the same features (like the PureVideo HD video-processor) as the 9600M GT.
The performance of the card should be compareable to the 9600M GT. Still some games may run slower, as the drivers are optimized for applications and OpenGL. Especially the OpenGL performance is way better than with an 9600M GT. The Cinebench R10 OpenGL test shows up to twize the performance with a FX 770M compared to a GeForce 9600M GT.
As all cards of the GeForce 9000M series, the 770M support CUDA.
NVIDIA Quadro FX 1700M
► remove from comparison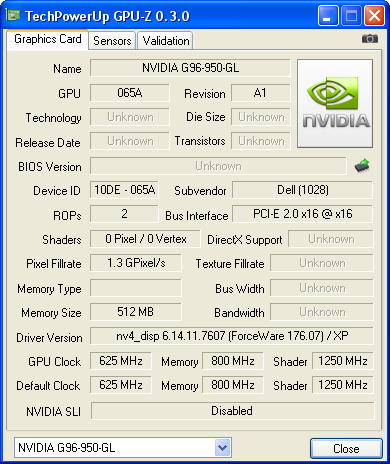
The Nvidia Quadro FX 1700M is a professional graphics adapter for CAD and 3D applications. It is based on the G96 core (GeForce 9650M e.g.) but with different drivers, that are optimized for OpenGL and professional applications. The drivers are zertified to work flawlessly with different applications.
Compared to the Quadro FX 1600M, the FX 1700M GPU supports Powermizer 8.0.
| NVIDIA Quadro FX 1500M | NVIDIA Quadro FX 770M | NVIDIA Quadro FX 1700M | |||||||||||||||||||||||||||||||||||||||||||||||||||||||||||||||||||||||||||||||||||||||||||||||||||||||||||||||||||||||||||||||||||||||||||||||||||||||||||||||||||
| Quadro FX Series |
|
|
| ||||||||||||||||||||||||||||||||||||||||||||||||||||||||||||||||||||||||||||||||||||||||||||||||||||||||||||||||||||||||||||||||||||||||||||||||||||||||||||||||||
| Codename | G71GLM | NB9P-GLM | NB9P-GLM | ||||||||||||||||||||||||||||||||||||||||||||||||||||||||||||||||||||||||||||||||||||||||||||||||||||||||||||||||||||||||||||||||||||||||||||||||||||||||||||||||||
| Architecture | G7x | G9x | G9x | ||||||||||||||||||||||||||||||||||||||||||||||||||||||||||||||||||||||||||||||||||||||||||||||||||||||||||||||||||||||||||||||||||||||||||||||||||||||||||||||||||
| Pipelines | 20 / 7 Pixel- / Vertexshader | 32 - unified | 32 - unified | ||||||||||||||||||||||||||||||||||||||||||||||||||||||||||||||||||||||||||||||||||||||||||||||||||||||||||||||||||||||||||||||||||||||||||||||||||||||||||||||||||
| Core Speed | 375 MHz | 500 MHz | 625 MHz | ||||||||||||||||||||||||||||||||||||||||||||||||||||||||||||||||||||||||||||||||||||||||||||||||||||||||||||||||||||||||||||||||||||||||||||||||||||||||||||||||||
| Memory Speed | 500 MHz | 800 MHz | 800 MHz | ||||||||||||||||||||||||||||||||||||||||||||||||||||||||||||||||||||||||||||||||||||||||||||||||||||||||||||||||||||||||||||||||||||||||||||||||||||||||||||||||||
| Memory Bus Width | 256 Bit | 128 Bit | 128 Bit | ||||||||||||||||||||||||||||||||||||||||||||||||||||||||||||||||||||||||||||||||||||||||||||||||||||||||||||||||||||||||||||||||||||||||||||||||||||||||||||||||||
| Memory Type | GDDR3 | GDDR2 / GDDR3 | GDDR3 | ||||||||||||||||||||||||||||||||||||||||||||||||||||||||||||||||||||||||||||||||||||||||||||||||||||||||||||||||||||||||||||||||||||||||||||||||||||||||||||||||||
| Max. Amount of Memory | 512 MB | 512 MB | 256 MB | ||||||||||||||||||||||||||||||||||||||||||||||||||||||||||||||||||||||||||||||||||||||||||||||||||||||||||||||||||||||||||||||||||||||||||||||||||||||||||||||||||
| Shared Memory | no | no | no | ||||||||||||||||||||||||||||||||||||||||||||||||||||||||||||||||||||||||||||||||||||||||||||||||||||||||||||||||||||||||||||||||||||||||||||||||||||||||||||||||||
| API | DirectX 9c, Shader 3.0 | DirectX 10, Shader 4.0 | DirectX 10, Shader 4.0 | ||||||||||||||||||||||||||||||||||||||||||||||||||||||||||||||||||||||||||||||||||||||||||||||||||||||||||||||||||||||||||||||||||||||||||||||||||||||||||||||||||
| Power Consumption | 20 Watt | 35 Watt | 50 Watt | ||||||||||||||||||||||||||||||||||||||||||||||||||||||||||||||||||||||||||||||||||||||||||||||||||||||||||||||||||||||||||||||||||||||||||||||||||||||||||||||||||
| Transistors | 278 Million | 314 Million | 289 Million | ||||||||||||||||||||||||||||||||||||||||||||||||||||||||||||||||||||||||||||||||||||||||||||||||||||||||||||||||||||||||||||||||||||||||||||||||||||||||||||||||||
| technology | 90 nm | 65 nm | 65 nm | ||||||||||||||||||||||||||||||||||||||||||||||||||||||||||||||||||||||||||||||||||||||||||||||||||||||||||||||||||||||||||||||||||||||||||||||||||||||||||||||||||
| Features | 90nm | OpenGL 2.1, PowerMizer 8.0, 12-Bit subpixel precision, 128 Bit graphics pipeline precision | OpenGL 2.1, PureVideo HD, Powermizer 8.0, possible interfaces: LVDS, DVI, VGA, HDTV, HDCP, HDMI | ||||||||||||||||||||||||||||||||||||||||||||||||||||||||||||||||||||||||||||||||||||||||||||||||||||||||||||||||||||||||||||||||||||||||||||||||||||||||||||||||||
| Notebook Size | large | medium sized | large | ||||||||||||||||||||||||||||||||||||||||||||||||||||||||||||||||||||||||||||||||||||||||||||||||||||||||||||||||||||||||||||||||||||||||||||||||||||||||||||||||||
| Date of Announcement | 18.04.2006 | 14.08.2008 | 01.10.2008 | ||||||||||||||||||||||||||||||||||||||||||||||||||||||||||||||||||||||||||||||||||||||||||||||||||||||||||||||||||||||||||||||||||||||||||||||||||||||||||||||||||
| Information | PCI-E, 90nm | CG shading language, 32 Bit floating point precision, 12 Bit subpixel precision, 128 Bit precision of the graphics pipeline, FSAA with rotated raster, nView Mutlidisplay Support, High-Precision-Dynamic-Range (HPDR), Hardware 3D Clipping on window recognision, full screen AA | |||||||||||||||||||||||||||||||||||||||||||||||||||||||||||||||||||||||||||||||||||||||||||||||||||||||||||||||||||||||||||||||||||||||||||||||||||||||||||||||||||
| Link to Manufacturer Page | www.nvidia.de | www.nvidia.com | www.nvidia.com | ||||||||||||||||||||||||||||||||||||||||||||||||||||||||||||||||||||||||||||||||||||||||||||||||||||||||||||||||||||||||||||||||||||||||||||||||||||||||||||||||||
| Shader Speed | 1250 MHz | 1250 MHz |


