Notebookcheck Logo

NVIDIA Quadro 5010M vs NVIDIA Quadro M5500 vs NVIDIA Quadro 3000M

NVIDIA Quadro 5010M

► remove from comparison NVIDIA Quadro 5010M

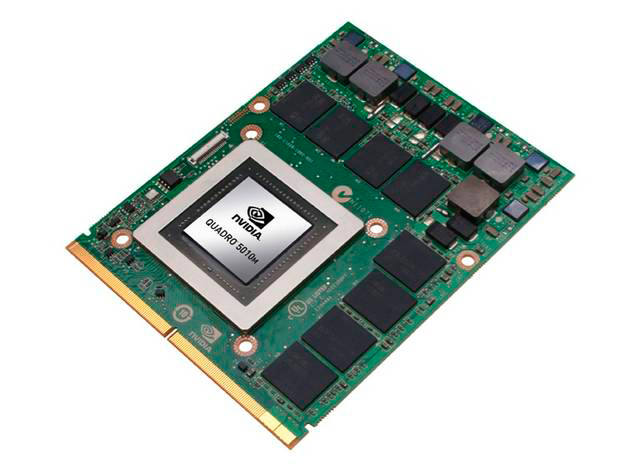
The NVIDIA Quadro 5010M is a professional workstation graphics card based on the Fermi architecture (GF100 chip). Therefore, the 5010M is closely related to the  consumer GeForce GTX 480M. The Quadro 5010M is the successor to the Quadro 5000M and also offers ECC RAM and double-precision floating point cores.

The Quadro series offers certified drivers that are optimized for stability and performance in professional applications like CAD, DCC, medicine, or visualisation areas. The OpenGL performance, for example, should be significantly better than GeForce graphics cards with similar specifications.

The shader / CUDA cores can be accessed using DirectX 11 or OpenGL 4.1 for graphics rendering and DirectCompute, OpenCL, AXE, and CUDA for general purpose calculations. Due to the new Fermi architecture, the 5010M should offer higher levels of performance in general purpose calculations compared to its predecessors.

Furthermore, the Nvidia Quadro 5010M is compatible with the new stereoscopic solution by Nvidia called 3D Vision Pro.

To automatically switch between the integrated graphics card and the Quadro, the 5010M supports Nvidia Optimus. Note, however, that whether this feature is integrated or not depends on the notebook manufacturer.

Similar to the GeForce GTX 480M, the Quadro 5010M is specified at 100 Watt TDP. As a result, only very large laptops, such as the Clevo D901F, are able to house this high-end card.

At the time of arrival (Feb. 2011), the Quadro 5010M succeeds the older Quadrio FX 5000M as the fastest professional workstation graphic card for laptops.

NVIDIA Quadro M5500

► remove from comparison NVIDIA Quadro M5500

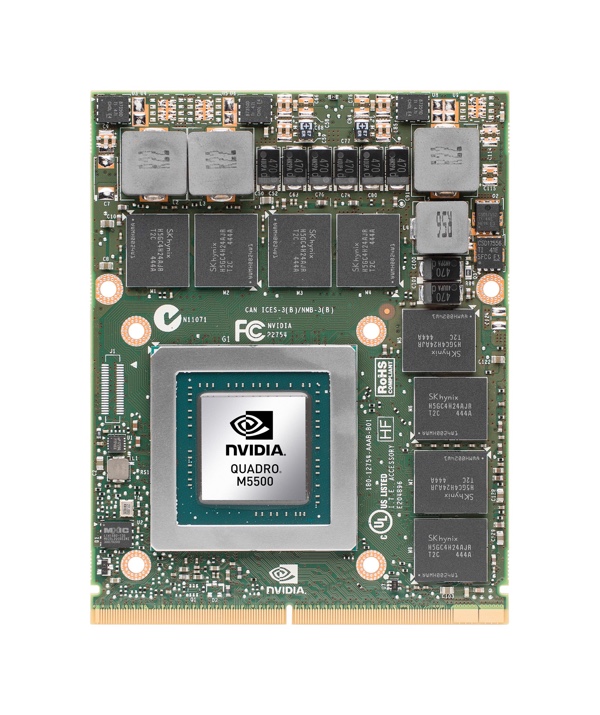
The Nvidia Quadro M5500 is a high-end, DirectX 12 (FL_12_1) and OpenGL 4.5-compatible graphics card for mobile workstations. It is a Maxwell-based GPU built on the GM204 chip with all 2048 shader cores activated and is manufactured in 28 nm at TSMC. Therefore, the GPU is similar to the consumer Nvidia GeForce GTX 980 (Notebook). Compared to the slower and less power hungry Quadro M5000M, the M5500 offers 512 more shaders which should result in 30-40% more performance according to Nvidia.

The Quadro series offers certified drivers that are optimized for stability and performance in professional applications like CAD or DCC. OpenGL performance, for example, should be significantly better compared to GeForce graphics cards of similar specifications.

Using CUDA (Compute Capability 5.2) or OpenCL 1.2, the cores of the Quadro M5000M can be used for general calculations.

The power consumption of the Quadro M5000M is rated at the same TGP of 150 Watt. Therefore, the card is suited for very large notebooks with 17-inch displays or greater.

The first laptop with the M5500 in it is the MSI WT72 Workstation.

NVIDIA Quadro 3000M

► remove from comparison

The NVIDIA Quadro 3000M is a professional workstation graphics card based on the Fermi architecture (probably GF104 like the GeForce GTX 470M). Compared to the 5010M, the 3000M does not support ECC memory and DP floating point calculations.

The Quadro series offers certified drivers that are optimized for stability and performance in professional applications like CAD, DCC, medicine, or visualisation areas. The OpenGL performance for example should be significantly better than similar specified GeForce graphics cards.

The shader / CUDA cores can be accessed using DirectX 11, OpenGL 4.1 for graphic rendering and DirectCompute, OpenCL, AXE, and CUDA for general purpose calculations. Due to the new Fermi core, the 3000M should offer a high performance in general purpose calculations.

Furthermore, the Nvidia Quadro 3000M is compatible with the new stereoscopic solution by Nvidia called: NVIDIA 3D Vision Pro.

To automatically switch between the processor graphics card and the Quadro, the 3000M supports Nvidia Optimus (if the laptop vendor chooses to integrate it).

As the GeForce GTX 470M, the Quadro 3000M is specified at 75 Watt TDP and therefore only suited for large laptops with 17 inch displays.

NVIDIA Quadro 5010MNVIDIA Quadro M5500NVIDIA Quadro 3000M
Quadro M Series
Quadro M5500 2048 @ 1.14 - 1.14 GHz256 Bit @ 6606 MHz
Quadro M5000M 1536 @ 0.96 - 1.05 GHz256 Bit @ 5000 MHz
Quadro M4000M 1280 @ 0.98 - 1.01 GHz256 Bit @ 5012 MHz
Quadro M3000M 1024 @ 1.05 GHz256 Bit @ 5000 MHz
Quadro M2200 1024 @ 0.69 - 1.04 GHz128 Bit @ 5508 MHz
Quadro M1200 640 @ 0.99 - 1.15 GHz128 Bit @ 5000 MHz
Quadro M2000M 640 @ 1.04 - 1.2 GHz128 Bit @ 5000 MHz
Quadro M1000M 512 @ 0.99 - 1.07 GHz128 Bit @ 5000 MHz
Quadro M620 512 @ 1.02 GHz128 Bit @ 5012 MHz
Quadro 5010M 384 @ 0.45 GHz256 Bit @ 1300 MHz
Quadro 4000M 336 @ 0.48 GHz256 Bit @ 1200 MHz
Quadro M520 384 @ 0.76 - 1.02 GHz64 Bit
Quadro M600M 384 @ 0.84 - 0.88 GHz128 Bit @ 5012 MHz
Quadro M500M 384 @ 1.03 - 1.12 GHz64 Bit @ 4004 MHz
Quadro 5000M 320 @ 0.41 GHz256 Bit @ 1200 MHz
Quadro 3000M 240 @ 0.45 GHz256 Bit @ 625 MHz
Quadro 2000M 192 @ 0.55 GHz128 Bit @ 900 MHz
Quadro 1000M 96 @ 0.7 GHz128 Bit @ 900 MHz
CodenameN12E-Q5Fermi
ArchitectureFermiMaxwellFermi
Pipelines384 - unified2048 - unified240 - unified
Core Speed450 MHz1139 - 1140 (Boost) MHz450 MHz
Shader Speed900 MHz900 MHz
Memory Speed1300 MHz6606 MHz625 MHz
Memory Bus Width256 Bit256 Bit256 Bit
Memory TypeGDDR5 ECCGDDR5GDDR5
Max. Amount of Memory4 GB8 GB2048 MB
Shared Memorynonono
APIDirectX 11, Shader 5.0DirectX 12_1, OpenGL 4.5DirectX 11, Shader 5.0
Power Consumption100 Watt150 Watt75 Watt
Transistors3 Billion5.2 Billion
technology40 nm28 nm40 nm
FeaturesOpenGl 4.1, ECC Memory, FP64 IEEE 754CUDA, 3D Vision, PhysX, GeForce Experience, Surround, GameStream, GPU Boost 2.0, Adaptive Vertical Sync, G-SYNC, SLIOpenGl 4.1, FP32
Notebook Sizelargelargelarge
Date of Announcement22.02.2011 04.04.2016 22.02.2011
Link to Manufacturer Pagewww.nvidia.com

Benchmarks

3DMark 11 - 3DM11 Performance Score
min: 3032     avg: 3066     median: 3066 (4%)     max: 3100 Points
14413 Points (20%)
1742 Points (2%)
3DMark 11 - 3DM11 Performance GPU
2693 Points (2%)
1539 Points (1%)
3DMark Vantage
3DM Vant. Perf. total + NVIDIA Quadro 5010M
3DMark Vantage - 3DM Vant. Perf. total
12991 Points (4%)
3DM Vant. Perf. total + NVIDIA Quadro 3000M
7941 Points (2%)
3DM Vant. Perf. GPU no PhysX + NVIDIA Quadro 5010M
3DMark Vantage - 3DM Vant. Perf. GPU no PhysX
11047 Points (6%)
3DM Vant. Perf. GPU no PhysX + NVIDIA Quadro 3000M
min: 6604     avg: 6661     median: 6660.5 (4%)     max: 6717 Points
3DMark 03 - 3DMark 03 - Standard
52873 Points (28%)
3DMark 05 - 3DMark 05 - Standard
24769 Points (27%)
3DMark 06 3DMark 06 - Standard 1280x1024 + NVIDIA Quadro 5010M
3DMark 06
min: 18617     avg: 19544     median: 19036 (25%)     max: 20979 Points
3DMark 06 - Standard 1280x1024 + NVIDIA Quadro 3000M
min: 14054     avg: 14221     median: 14220.5 (19%)     max: 14387 Points
Unigine Heaven 2.1 - Heaven 2.1 high
41.7 fps (8%)
SPECviewperf 11
specvp11 snx-01 + NVIDIA Quadro 5010M
SPECviewperf 11 - specvp11 snx-01
min: 34.9     avg: 38.2     median: 38.2 (23%)     max: 41.4 fps
specvp11 snx-01 + NVIDIA Quadro 3000M
20.4 fps (12%)
specvp11 tcvis-02 + NVIDIA Quadro 5010M
SPECviewperf 11 - specvp11 tcvis-02
min: 37.6     avg: 39.8     median: 39.8 (23%)     max: 41.9 fps
specvp11 tcvis-02 + NVIDIA Quadro 3000M
22.9 fps (13%)
specvp11 sw-02 + NVIDIA Quadro 5010M
SPECviewperf 11 - specvp11 sw-02
min: 37.93     avg: 46.1     median: 46.1 (35%)     max: 54.2 fps
specvp11 sw-02 + NVIDIA Quadro 3000M
30.1 fps (23%)
specvp11 proe-05 + NVIDIA Quadro 5010M
SPECviewperf 11 - specvp11 proe-05
min: 7.99     avg: 8.8     median: 8.8 (10%)     max: 9.7 fps
specvp11 proe-05 + NVIDIA Quadro 3000M
7.6 fps (9%)
specvp11 maya-03 + NVIDIA Quadro 5010M
SPECviewperf 11 - specvp11 maya-03
min: 53.6     avg: 72.4     median: 72.4 (55%)     max: 91.1 fps
specvp11 maya-03 + NVIDIA Quadro 3000M
42.5 fps (32%)
specvp11 lightwave-01 + NVIDIA Quadro 5010M
SPECviewperf 11 - specvp11 lightwave-01
min: 40.01     avg: 47.5     median: 47.5 (51%)     max: 54.9 fps
specvp11 lightwave-01 + NVIDIA Quadro 3000M
34.7 fps (37%)
specvp11 ensight-04 + NVIDIA Quadro 5010M
SPECviewperf 11 - specvp11 ensight-04
min: 36.73     avg: 37.9     median: 37.9 (18%)     max: 39.1 fps
specvp11 ensight-04 + NVIDIA Quadro 3000M
18.3 fps (9%)
specvp11 catia-03 + NVIDIA Quadro 5010M
SPECviewperf 11 - specvp11 catia-03
min: 33.89     avg: 38.2     median: 38.1 (20%)     max: 42.4 fps
specvp11 catia-03 + NVIDIA Quadro 3000M
24.6 fps (13%)
SPECviewperf 12
specvp12 sw-03 + NVIDIA Quadro M5500
SPECviewperf 12 - specvp12 sw-03
144 fps (36%)
specvp12 snx-02 + NVIDIA Quadro M5500
SPECviewperf 12 - specvp12 snx-02
120 fps (18%)
specvp12 showcase-01 + NVIDIA Quadro M5500
SPECviewperf 12 - specvp12 showcase-01
60.3 fps (13%)
specvp12 mediacal-01 + NVIDIA Quadro M5500
SPECviewperf 12 - specvp12 mediacal-01
53.8 fps (14%)
specvp12 maya-04 + NVIDIA Quadro M5500
SPECviewperf 12 - specvp12 maya-04
95 fps (26%)
specvp12 energy-01 + NVIDIA Quadro M5500
SPECviewperf 12 - specvp12 energy-01
12.2 fps (11%)
specvp12 creo-01 + NVIDIA Quadro M5500
SPECviewperf 12 - specvp12 creo-01
110 fps (44%)
specvp12 catia-04 + NVIDIA Quadro M5500
SPECviewperf 12 - specvp12 catia-04
137 fps (23%)
Windows 7 Experience Index - Win7 Gaming graphics
7.5 Points (95%)
Windows 7 Experience Index - Win7 Graphics
7.5 Points (95%)
Cinebench R10 Cinebench R10 Shading (32bit) + NVIDIA Quadro 5010M
Cinebench R10 - Cinebench R10 Shading (32bit)
6620 Points (5%)
Cinebench R10 Shading (32bit) + NVIDIA Quadro 3000M
6519 Points (5%)
Cinebench R11.5 Cinebench R11.5 OpenGL 64 Bit + NVIDIA Quadro 5010M
Cinebench R11.5 - Cinebench R11.5 OpenGL 64 Bit
min: 65.1     avg: 67.5     median: 67.5 (23%)     max: 69.9 fps
Cinebench R11.5 OpenGL 64 Bit + NVIDIA Quadro 3000M
min: 45.4     avg: 45.5     median: 45.5 (16%)     max: 45.65 fps
Cinebench R15
Cinebench R15 OpenGL 64 Bit + NVIDIA Quadro M5500
Cinebench R15 - Cinebench R15 OpenGL 64 Bit
106.7 fps (6%)

Average Benchmarks NVIDIA Quadro 5010M → 100% n=1

Average Benchmarks NVIDIA Quadro M5500 → 470% n=1

Average Benchmarks NVIDIA Quadro 3000M → 57% n=1

- Range of benchmark values for this graphics card
- Average benchmark values for this graphics card
* Smaller numbers mean a higher performance
1 This benchmark is not used for the average calculation

Game Benchmarks

The following benchmarks stem from our benchmarks of review laptops. The performance depends on the used graphics memory, clock rate, processor, system settings, drivers, and operating systems. So the results don't have to be representative for all laptops with this GPU. For detailed information on the benchmark results, click on the fps number.

Dirt 3

Dirt 3

2011
high 1360x768
100%
Quadro 5010M:
105.4  fps
ultra 1920x1080
100%
Quadro 5010M:
35.3  fps
Crysis 2

Crysis 2

2011
high 1366x768
100%
Quadro 5010M:
81.6  fps
ultra 1920x1080
100%
Quadro 5010M:
28.2  fps
high 1360x768
100%
Quadro 5010M:
105  fps
ultra 1920x1080
100%
Quadro 5010M:
72.8  fps
Fifa 11

Fifa 11

2010
high 1360x768
100%
Quadro 5010M:
268.6  fps
77%
Quadro 3000M:
206.2  fps
ultra 1920x1080
100%
Quadro 5010M:
162.3  fps
78%
Quadro 3000M:
127.3  fps
Mafia 2

Mafia 2

2010
high 1360x768
100%
Quadro 5010M:
86.6  fps
ultra 1920x1080
100%
Quadro 5010M:
51.9  fps
high 1360x768
100%
Quadro 5010M:
98.4  fps
ultra 1920x1080
100%
Quadro 5010M:
52.7  fps
med. 1360x768
Quadro 3000M:
53.8  fps
high 1600x900
100%
Quadro 5010M:
37.9  fps
ultra 1920x1080
100%
Quadro 5010M:
14.6  fps
79%
Quadro 3000M:
11.5  fps
high 1366x768
100%
Quadro 5010M:
88.9  fps
ultra 1920x1080
100%
Quadro 5010M:
45.3  fps
high 1366x768
100%
Quadro 5010M:
93.4  fps
ultra 1920x1080
100%
Quadro 5010M:
62.5  fps
Risen

Risen

2009
med. 1024x768
Quadro 3000M:
66.7  fps
high 1366x768
100%
Quadro 5010M:
64.3  fps
62%
Quadro 3000M:
39.6  fps
ultra 1920x1080
100%
Quadro 5010M:
41.9  fps
73%
Quadro 3000M:
30.4  fps
Resident Evil 5

Resident Evil 5

2009
high 1360x768
100%
Quadro 5010M:
120.6  fps
ultra 1920x1080
100%
Quadro 5010M:
73.3  fps
Need for Speed Shift

Need for Speed Shift

2009
med. 1024x768
Quadro 3000M:
104.8  fps
high 1366x768
100%
Quadro 5010M:
108.5  fps
65%
Quadro 3000M:
70.9  fps
ultra 1920x1080
100%
Quadro 5010M:
67  fps
65%
Quadro 3000M:
43.3  fps
Colin McRae: DIRT 2

Colin McRae: DIRT 2

2009
med. 1024x768
Quadro 3000M:
113.5  fps
high 1360x768
Quadro 3000M:
71.4  fps
ultra 1920x1080
Quadro 3000M:
40  fps
Anno 1404

Anno 1404

2009
low 1024x768
Quadro 3000M:
187.6  fps
ultra 1280x1024
Quadro 3000M:
52.4  fps

Average Gaming NVIDIA Quadro 5010M → 100%

Average Gaming 30-70 fps → 100%

Average Gaming NVIDIA Quadro 3000M → 71%

Average Gaming 30-70 fps → 66%

NVIDIA Quadro 5010Mlowmed.highultraQHD4K
Dirt 3105.435.3
Crysis 281.628.2
Call of Duty: Black Ops10572.8
Fifa 11268.6162.3
Mafia 286.651.9
StarCraft 298.452.7
Metro 203337.914.6
Battlefield: Bad Company 288.945.3
CoD Modern Warfare 293.462.5
Risen64.341.9
Resident Evil 5120.673.3
Need for Speed Shift108.567
< 30 fps
< 60 fps
< 120 fps
≥ 120 fps


1
9
2
2
5
4
1


NVIDIA Quadro 3000Mlowmed.highultraQHD4K
Fifa 11206.2127.3
Metro 203353.811.5
Risen66.739.630.4
Need for Speed Shift104.870.943.3
Colin McRae: DIRT 2113.571.440
Anno 1404187.652.4
< 30 fps
< 60 fps
< 120 fps
≥ 120 fps


1

1
3

1
2
1
1
4

1


For more games that might be playable and a list of all games and graphics cards visit our Gaming List

v1.26
log 20. 04:54:15

#0 checking url part for id 2429 +0s ... 0s

#1 checking url part for id 7282 +0s ... 0s

#2 checking url part for id 2433 +0s ... 0s

#3 not redirecting to Ajax server +0s ... 0s

#4 did not recreate cache, as it is less than 5 days old! Created at Fri, 19 Apr 2024 05:40:26 +0200 +0.001s ... 0.001s

#5 composed specs +0.124s ... 0.125s

#6 did output specs +0s ... 0.125s

#7 start showIntegratedCPUs +0s ... 0.125s

#8 getting avg benchmarks for device 2429 +0.036s ... 0.161s

#9 got single benchmarks 2429 +0.009s ... 0.17s

#10 getting avg benchmarks for device 7282 +0.002s ... 0.173s

#11 got single benchmarks 7282 +0.008s ... 0.18s

#12 getting avg benchmarks for device 2433 +0.002s ... 0.182s

#13 got single benchmarks 2433 +0.008s ... 0.19s

#14 got avg benchmarks for devices +0s ... 0.19s

#15 min, max, avg, median took s +0.207s ... 0.396s

#16 before gaming benchmark output +0s ... 0.396s

#17 Got 39 rows for game benchmarks. +0.006s ... 0.402s

#18 composed SQL query for gamebenchmarks +0s ... 0.402s

#19 got data and put it in $dataArray +0.01s ... 0.412s

#20 benchmarks composed for output. +0.035s ... 0.446s

#21 calculated avg scores. +0s ... 0.446s

#22 return log +0.002s ... 0.449s

Please share our article, every link counts!
> Expert Reviews and News on Laptops, Smartphones and Tech Innovations > Benchmarks / Tech > Graphics Card Comparison - Head 2 Head
Redaktion, 2017-09- 8 (Update: 2023-07- 1)