Notebookcheck Logo

NVIDIA GeForce RTX 4070 SUPER vs Apple M2 8-Core GPU vs Apple M2 10-Core GPU

NVIDIA GeForce RTX 4070 SUPER

► remove from comparison NVIDIA NVIDIA GeForce RTX 4070 SUPER

The Nvidia GeForce RTX 4070 SUPER is a high-end desktop graphics card based on the Ada Lovelace architecture. It uses the AD104 chip and offers 7,168 cores and 12 GB GDDR6X graphics memory (192-bit bus with 21 Gbits).

The performance of the RTX 4070S lies between the older RTX 4070 and RTX 4070 Ti in the top class of high-end GPUs in 2024. Compared to AMD GPUs, the 4070 Super is similar fast as the AMD Radeon RX 7800 XT. This makes the GPU best suited for QHD and maximum details of demanding games (such as Avatar Frontiers of Pandora, Allan Wake 2, Cyberpunk 2033 or F1 23). Less demanding games can also be played smoothly in 4K (AC Mirage, Cod MW 3, ...).

The AD104 chip is produced at TSMC in 5 nm (4N with EUV) and is specified with a TGP (Total Graphics Power) of 200 watts.

Apple M2 8-Core GPU

► remove from comparison Apple M2 8-Core GPU

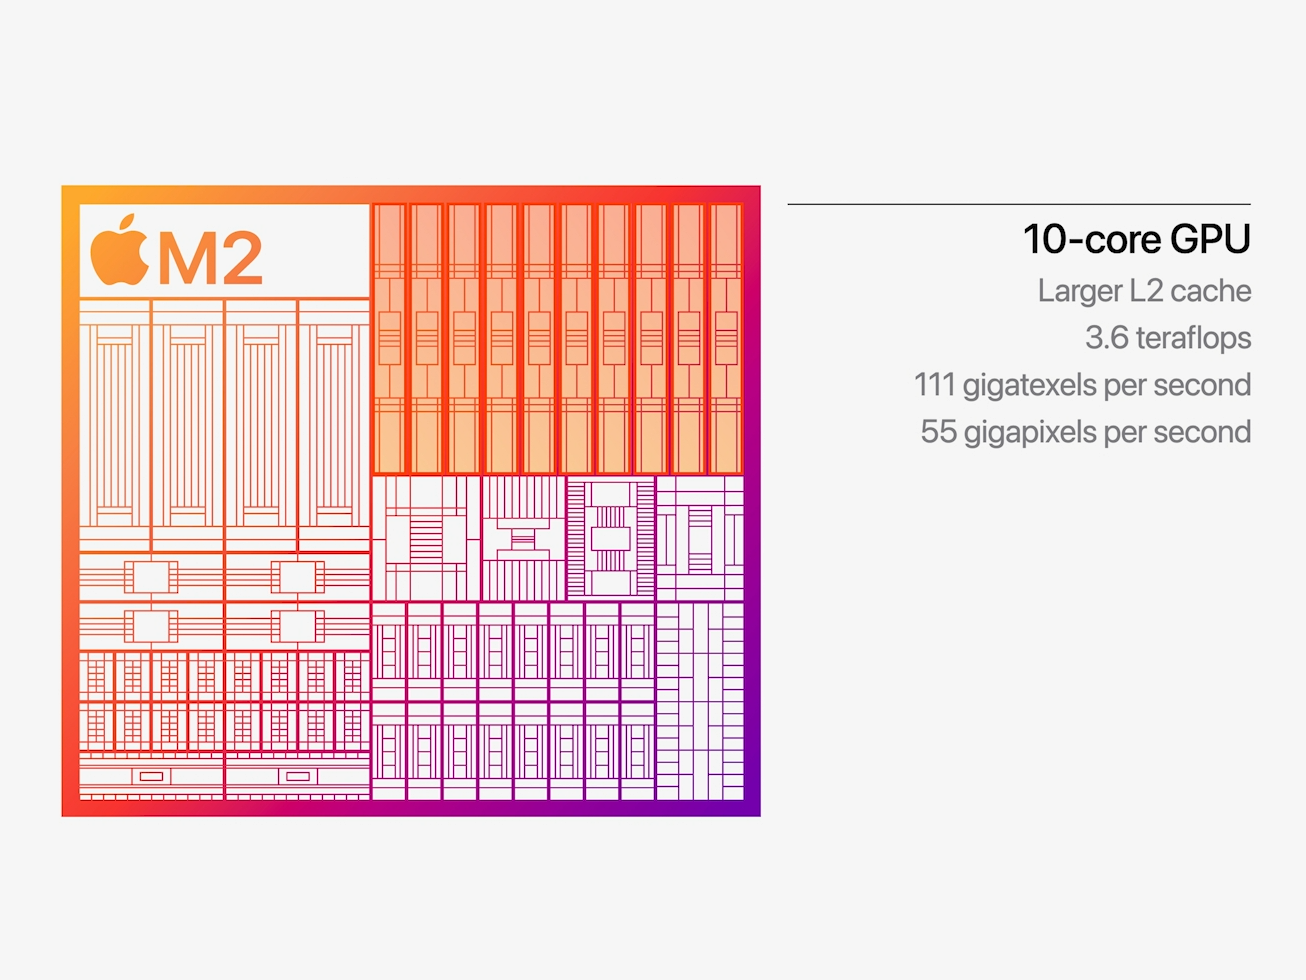
The Apple M2 8-core GPU is an integrated graphics card offering 8 of the 10 cores designed by Apple and integrated in the Apple M2 SoC. It uses the unified memory architecture of the M2 SoC (up to 24 GB LPDDR5-6400 with 100 GB/s bandwidth) and should offer 128 execution units.

The performance is positioned right between the old 8-core model in the M1 GPU and the higher end 10-core model in the M2. The theoretical performance should be around 2.9 Teraflops, as the 8-core version offers the same 1,398 MHz maximum clock rate as the 10-core version. Compared to other iGPUs from AMD and Intel, the M2 benefits greatly from the unified memory architecture and the high bandwidth.

The M2 chip is manufactured in the second generation 5nm process at TSMC (most likely N5P). The power consumption is around 10 Watt (in our tests under load of the MBP13) compared to the 13.5W of the 10-core version.

Apple M2 10-Core GPU

► remove from comparison Apple M2 10-Core GPU

The Apple M2 GPU is an integrated graphics card offering 10 cores designed by Apple and integrated in the Apple M2 SoC. It uses the unified memory architecture of the M2 SoC (up to 24 GB LPDDR5-6400 with 100 GB/s bandwidth) and should offer 160 execution units.

According to Apple it offers a 25% higher performance at slightly higher power consumption. The theoretical performance is rated at 3.6 Teraflops and therefore 1 TFLOP higher than the M1 8-core GPU. In our benchmarks, the GPU was able to top the M1 with up to 40%, but still stays behind the 14-core GPU in the M1 Pro. Compared to other iGPUs from AMD and Intel, the M2 benefits greatly from the unified memory architecture and the high bandwidth.

The M2 chip is manufactured in the second generation 5nm process at TSMC (most likely N5P). The power consumption is around 13.5 Watt (in our tests under load of the MBP13) and up to 15W according to Apple.

NVIDIA GeForce RTX 4070 SUPERApple M2 8-Core GPUApple M2 10-Core GPU
Apple M2 Series
NVIDIA GeForce RTX 4090 16384 @ 2.24 - 2.52 GHz384 Bit @ 21000 MHz
NVIDIA GeForce RTX 4080 Super 10240 @ 2.3 - 2.55 GHz256 Bit @ 23000 MHz
NVIDIA GeForce RTX 4080 9728 @ 2.21 - 2.51 GHz256 Bit @ 22400 MHz
NVIDIA GeForce RTX 4070 Ti SUPER 8448 @ 2.34 - 2.61 GHz256 Bit @ 21000 MHz
NVIDIA GeForce RTX 4070 Ti 7680 @ 2.31 - 2.61 GHz192 Bit @ 21000 MHz
NVIDIA GeForce RTX 4070 SUPER 7168 @ 1.98 - 2.48 GHz192 Bit @ 21000 MHz
NVIDIA GeForce RTX 4070 5888 @ 1.92 - 2.48 GHz192 Bit @ 21000 MHz
NVIDIA GeForce RTX 4060 Ti 16G 4352 @ 2.31 - 2.54 GHz128 Bit @ 18000 MHz
NVIDIA GeForce RTX 4060 Ti 8G 4352 @ 2.31 - 2.54 GHz128 Bit @ 18000 MHz
NVIDIA GeForce RTX 4060 3072 @ 1.83 - 2.46 GHz128 Bit @ 17000 MHz
M2 Max 38-Core GPU 38
M2 Max 30-Core GPU 30
M2 Pro 19-Core GPU 19 @ 0.44 - 1.4 GHz
M2 Pro 16-Core GPU 16
M2 10-Core GPU 10 @ 1.4 GHz
M2 8-Core GPU 8 @ 1.4 GHz
M2 Max 38-Core GPU 38
M2 Max 30-Core GPU 30
M2 Pro 19-Core GPU 19 @ 0.44 - 1.4 GHz
M2 Pro 16-Core GPU 16
M2 10-Core GPU 10 @ 1.4 GHz
M2 8-Core GPU 8 @ 1.4 GHz
CodenameAD104
ArchitectureAda Lovelace
Pipelines7168 - unified8 - unified10 - unified
TMUs224
ROPs80
Raytracing Cores56
Tensor / AI Cores224
Core Speed1980 - 2475 (Boost) MHz1398 (Boost) MHz1398 (Boost) MHz
Theoretical Performance35.5 TFLOPS FP16, 35.5 TFLOPS FP32, 0.55 TFLOPS FP64
CacheL2: 48 MB
Memory Speed21000 effective = 1313 MHz
Memory Bus Width192 Bit
Memory TypeGDDR6XLPDDR5-6400LPDDR5-6400
Max. Amount of Memory12 GB
Shared Memorynonono
Memory Bandwidth504.2 GB/s
APIDirectX 12 Ultimate, Shader 6.7, OpenGL 4.6, OpenCL 3.0, Vulkan 1.3
Power Consumption220 Watt10 Watt15 Watt
Transistors35.8 Billion
Die Size 295 mm²
technology5 nm5 nm5 nm
PCIe4.0 x16
Displays4 Displays (max.), HDMI 2.1, DisplayPort 1.4a
Date of Announcement17.01.2024 06.06.2022 06.06.2022
PredecessorNVIDIA GeForce RTX 4070M1 8-Core GPUM1 8-Core GPU
CPU in M2 10-Core GPUGPU Base SpeedGPU Boost / Turbo
Apple M28 x 2424 MHz, 20 W? MHz1398 MHz

Benchmarks

Performance Rating - 3DMark 11 + Fire Strike + Time Spy - NVIDIA GeForce RTX 4070 SUPER
18.3 pt (55%)
Restrict / Search: Model: Max. age: years
3DMark - 3DMark Time Spy Score
min: 21080     avg: 21186     median: 21186 (56%)     max: 21292 Points
3DMark - 3DMark Time Spy Graphics
min: 20867     avg: 20992     median: 20992 (43%)     max: 21117 Points
3DMark - 3DMark Ice Storm Unlimited Graphics
min: 763636     avg: 766679     median: 766678 (77%)     max: 769721 Points
3DMark - 3DMark Ice Storm Extreme Graphics
min: 515758     avg: 517177     median: 517176 (61%)     max: 518595 Points
3DMark - 3DMark Cloud Gate Score
min: 81504     avg: 81898     median: 81897.5 (77%)     max: 82291 Points
3DMark - 3DMark Cloud Gate Graphics
min: 170014     avg: 171098     median: 171098 (42%)     max: 172182 Points
3DMark - 3DMark Fire Strike Standard Score
min: 39061     avg: 40120     median: 40119.5 (61%)     max: 41178 Points
3DMark - 3DMark Fire Strike Standard Graphics
min: 48043     avg: 48876     median: 48876 (45%)     max: 49709 Points
3DMark - 3DMark Ice Storm Graphics
min: 559629     avg: 564567     median: 564567 (62%)     max: 569505 Points
3DMark - 3DMark Wild Life Unlimited
min: 134699     avg: 135490     median: 135490 (68%)     max: 136280 Points
21009 Points (11%)
min: 21302     avg: 23924     median: 24236 (12%)     max: 25317 Points
3DMark - 3DMark Wild Life Extreme Unlimited
min: 41082     avg: 41368     median: 41368 (48%)     max: 41654 Points
5689 Points (7%)
min: 5328     avg: 6533     median: 6823.5 (8%)     max: 6987 Points
3DMark - 3DMark Night Raid
min: 89236     avg: 89795     median: 89795 (85%)     max: 90354 Points
3DMark - 3DMark Night Raid Graphics Score
min: 195290     avg: 198557     median: 198556 (76%)     max: 201823 Points
3DMark 11 - 3DM11 Performance Score
min: 51107     avg: 51340     median: 51339.5 (62%)     max: 51572 Points
3DMark 11 - 3DM11 Performance GPU
min: 67852     avg: 68373     median: 68373 (52%)     max: 68894 Points
Unigine Valley 1.0 - Unigine Valley 1.0 DX
min: 213.8     avg: 214.6     median: 214.6 (65%)     max: 215.3 fps
Blender - Blender 3.3 Classroom METAL *
min: 205     avg: 221     median: 221 (23%)     max: 237 Seconds
Cinebench R15
Cinebench R15 OpenGL 64 Bit + Apple M2 8-Core GPU
Cinebench R15 - Cinebench R15 OpenGL 64 Bit
128.6 fps (8%)
Cinebench R15 OpenGL 64 Bit + Apple M2 10-Core GPU
min: 128.65     avg: 132.8     median: 131 (8%)     max: 140.5 fps
Cinebench R15 OpenGL Ref. Match 64 Bit + Apple M2 8-Core GPU
Cinebench R15 - Cinebench R15 OpenGL Ref. Match 64 Bit
99.5 % (100%)
Cinebench R15 OpenGL Ref. Match 64 Bit + Apple M2 10-Core GPU
99.5 % (100%)
GFXBench - GFXBench 5.0 4K Aztec Ruins High Tier Offscreen
39.8 fps (15%)
min: 35.6     avg: 43.9     median: 47.9 (18%)     max: 48.6 fps
GFXBench - GFXBench 5.0 Aztec Ruins High Tier Offscreen
91 fps (16%)
min: 68     avg: 96     median: 102.6 (18%)     max: 110 fps
GFXBench - GFXBench 5.0 Aztec Ruins Normal Tier Offscreen
247 fps (18%)
min: 208     avg: 267.5     median: 283.8 (21%)     max: 296 fps
GFXBench - GFXBench Car Chase Offscreen
199.9 fps (19%)
min: 136     avg: 197.6     median: 206.1 (19%)     max: 232 fps
GFXBench 3.1 - GFXBench Manhattan ES 3.1 Offscreen
306.9 fps (6%)
min: 247     avg: 318.6     median: 331.5 (7%)     max: 374.6 fps
GFXBench 3.0 - GFXBench 3.0 Manhattan Offscreen
483.7 fps (20%)
min: 411     avg: 503     median: 509.5 (21%)     max: 557.2 fps
GFXBench (DX / GLBenchmark) 2.7
GFXBench T-Rex HD Offscreen C24Z16 + Apple M2 8-Core GPU
GFXBench (DX / GLBenchmark) 2.7 - GFXBench T-Rex HD Offscreen C24Z16
839 fps (7%)
GFXBench T-Rex HD Offscreen C24Z16 + Apple M2 10-Core GPU
min: 628     avg: 824     median: 891.5 (7%)     max: 931.9 fps
Antutu v9 - AnTuTu v9 GPU
min: 654168     avg: 728087     median: 728086 (73%)     max: 802005 Points
Antutu v10 - AnTuTu v10 GPU
min: 781041     avg: 790061     median: 785809 (63%)     max: 803332 Points
Geekbench 6.4 - Geekbench 6.4 GPU OpenCL
min: 27880     avg: 27900     median: 27900 (7%)     max: 27920 Points
Geekbench 6.4 - Geekbench 6.4 GPU Metal
min: 42013     avg: 44473     median: 45460 (25%)     max: 45946 Points
LuxMark v2.0 64Bit - LuxMark v2.0 Room GPU
min: 8257     avg: 8260     median: 8259.5 (30%)     max: 8262 Samples/s
LuxMark v2.0 64Bit - LuxMark v2.0 Sala GPU
min: 19072     avg: 19102     median: 19101.5 (33%)     max: 19131 Samples/s
ComputeMark v2.1 - ComputeMark v2.1 Result
min: 47808     avg: 47986     median: 47985.5 (40%)     max: 48163 Points
Power Consumption - Furmark Stress Test Power Consumption - external Monitor *
min: 333     avg: 359     median: 345 (46%)     max: 413 Watt
Power Consumption - The Witcher 3 Power Consumption - external Monitor *
min: 372     avg: 381.3     median: 382.5 (53%)     max: 388 Watt
24.4 Watt (3%)
min: 22.8     avg: 27.8     median: 26.9 (4%)     max: 34.4 Watt
Power Consumption - Witcher 3 Power Consumption *
27.4 Watt (6%)
min: 27.8     avg: 32.5     median: 30.8 (7%)     max: 38.9 Watt
Power Consumption - GFXBench Aztec Ruins Normal Tier Offscreen Power Consumption 150cd *
min: 16     avg: 16.5     median: 16.7 (6%)     max: 16.7 Watt
Power Consumption - Power Efficiency - Witcher 3 ultra
min: 1.007     avg: 1     median: 1 (91%)     max: 1.108 fps per Watt
Power Consumption - Power Efficiency - Witcher 3 ultra external Monitor
min: 0.509     avg: 0.5     median: 0.5 (43%)     max: 0.541 fps per Watt
min: 1.116     avg: 1.1     median: 1.1 (92%)     max: 1.207 fps per Watt
Emissions Witcher 3 Fan Noise + Apple M2 10-Core GPU
Emissions - Witcher 3 Fan Noise
34.6 dB(A) (55%)

Average Benchmarks NVIDIA GeForce RTX 4070 SUPER → 100% n=2

Average Benchmarks Apple M2 8-Core GPU → 15% n=2

Average Benchmarks Apple M2 10-Core GPU → 17% n=2

- Range of benchmark values for this graphics card
red legend - Average benchmark values for this graphics card
* Smaller numbers mean a higher performance
1 This benchmark is not used for the average calculation

Game Benchmarks

The following benchmarks stem from our benchmarks of review laptops. The performance depends on the used graphics memory, clock rate, processor, system settings, drivers, and operating systems. So the results don't have to be representative for all laptops with this GPU. For detailed information on the benchmark results, click on the fps number.

med. 1920x1080
100%
NVIDIA GeForce RTX 4070 SUPER:
137.4  fps
high 1920x1080
100%
NVIDIA GeForce RTX 4070 SUPER:
122.1 129.9 ~ 126 fps
ultra 1920x1080
100%
NVIDIA GeForce RTX 4070 SUPER:
96.2 101.2 ~ 99 fps
QHD 2560x1440
100%
NVIDIA GeForce RTX 4070 SUPER:
61.5 67.6 ~ 65 fps
4K 3840x2160
100%
NVIDIA GeForce RTX 4070 SUPER:
33.9 34.6 ~ 34 fps
4K DLSS 3840x2160
100%
NVIDIA GeForce RTX 4070 SUPER:
56.6 60.5 ~ 59 fps
med. 1920x1080
100%
NVIDIA GeForce RTX 4070 SUPER:
226  fps
high 1920x1080
100%
NVIDIA GeForce RTX 4070 SUPER:
179 184 ~ 182 fps
ultra 1920x1080
100%
NVIDIA GeForce RTX 4070 SUPER:
165 166 ~ 166 fps
QHD 2560x1440
100%
NVIDIA GeForce RTX 4070 SUPER:
118 120 ~ 119 fps
4K 3840x2160
100%
NVIDIA GeForce RTX 4070 SUPER:
70 71 ~ 71 fps
4K DLSS 3840x2160
100%
NVIDIA GeForce RTX 4070 SUPER:
99 100 ~ 100 fps
med. 1920x1080
100%
NVIDIA GeForce RTX 4070 SUPER:
112.8  fps
high 1920x1080
100%
NVIDIA GeForce RTX 4070 SUPER:
105.1 114.1 ~ 110 fps
QHD 2560x1440
100%
NVIDIA GeForce RTX 4070 SUPER:
73.8 79.7 ~ 77 fps
4K 3840x2160
100%
NVIDIA GeForce RTX 4070 SUPER:
40 42.7 ~ 41 fps
4K DLSS 3840x2160
100%
NVIDIA GeForce RTX 4070 SUPER:
28.9 44.2 ~ 37 fps
med. 1920x1080
100%
NVIDIA GeForce RTX 4070 SUPER:
205  fps
high 1920x1080
100%
NVIDIA GeForce RTX 4070 SUPER:
193 204 ~ 199 fps
ultra 1920x1080
100%
NVIDIA GeForce RTX 4070 SUPER:
157 169 ~ 163 fps
QHD 2560x1440
100%
NVIDIA GeForce RTX 4070 SUPER:
121 130 ~ 126 fps
4K 3840x2160
100%
NVIDIA GeForce RTX 4070 SUPER:
72 77 ~ 75 fps
4K DLSS 3840x2160
100%
NVIDIA GeForce RTX 4070 SUPER:
99 106 ~ 103 fps
low 1920x1080
100%
NVIDIA GeForce RTX 4070 SUPER:
186  fps
med. 1920x1080
100%
NVIDIA GeForce RTX 4070 SUPER:
181.8  fps
high 1920x1080
100%
NVIDIA GeForce RTX 4070 SUPER:
156.3 162.1 ~ 159 fps
ultra 1920x1080
100%
NVIDIA GeForce RTX 4070 SUPER:
136.2 141.9 ~ 139 fps
QHD 2560x1440
100%
NVIDIA GeForce RTX 4070 SUPER:
83.8 89.6 ~ 87 fps
4K 3840x2160
100%
NVIDIA GeForce RTX 4070 SUPER:
38.4 38.9 ~ 39 fps
med. 1920x1080
100%
NVIDIA GeForce RTX 4070 SUPER:
228  fps
high 1920x1080
100%
NVIDIA GeForce RTX 4070 SUPER:
198.8 203 ~ 201 fps
ultra 1920x1080
100%
NVIDIA GeForce RTX 4070 SUPER:
194.3 203 ~ 199 fps
QHD 2560x1440
100%
NVIDIA GeForce RTX 4070 SUPER:
140.3 142.7 ~ 142 fps
4K 3840x2160
100%
NVIDIA GeForce RTX 4070 SUPER:
71.6 71.7 ~ 72 fps
4K DLSS 3840x2160
100%
NVIDIA GeForce RTX 4070 SUPER:
115.4 119.7 ~ 118 fps
F1 23

F1 23

2023
low 1920x1080
100%
NVIDIA GeForce RTX 4070 SUPER:
380 381 ~ 381 fps
med. 1920x1080
100%
NVIDIA GeForce RTX 4070 SUPER:
398 406 ~ 402 fps
high 1920x1080
100%
NVIDIA GeForce RTX 4070 SUPER:
344 357 ~ 351 fps
ultra 1920x1080
100%
NVIDIA GeForce RTX 4070 SUPER:
122.4 125.9 ~ 124 fps
QHD 2560x1440
100%
NVIDIA GeForce RTX 4070 SUPER:
78 81.2 ~ 80 fps
4K 3840x2160
100%
NVIDIA GeForce RTX 4070 SUPER:
39 40.7 ~ 40 fps
4K DLSS 3840x2160
100%
NVIDIA GeForce RTX 4070 SUPER:
66.8 69.7 ~ 68 fps
med. 1920x1080
100%
NVIDIA GeForce RTX 4070 SUPER:
208  fps
high 1920x1080
100%
NVIDIA GeForce RTX 4070 SUPER:
201.7 216.1 ~ 209 fps
ultra 1920x1080
100%
NVIDIA GeForce RTX 4070 SUPER:
149.6 155.7 ~ 153 fps
QHD 2560x1440
100%
NVIDIA GeForce RTX 4070 SUPER:
118 123.8 ~ 121 fps
4K 3840x2160
100%
NVIDIA GeForce RTX 4070 SUPER:
73.6 78 ~ 76 fps
F1 22

F1 22

2022
low 1920x1080
100%
NVIDIA GeForce RTX 4070 SUPER:
363 381 ~ 372 fps
med. 1920x1080
100%
NVIDIA GeForce RTX 4070 SUPER:
386 403 ~ 395 fps
high 1920x1080
100%
NVIDIA GeForce RTX 4070 SUPER:
321 340 ~ 331 fps
ultra 1920x1080
100%
NVIDIA GeForce RTX 4070 SUPER:
128.7 136.3 ~ 133 fps
QHD 2560x1440
100%
NVIDIA GeForce RTX 4070 SUPER:
83.1 88.8 ~ 86 fps
4K 3840x2160
100%
NVIDIA GeForce RTX 4070 SUPER:
41.9 44.6 ~ 43 fps
Diablo Immortal

Diablo Immortal

2022
ultra Ultra
M2 10-Core GPU:
59.3  fps
med. 1920x1080
100%
NVIDIA GeForce RTX 4070 SUPER:
285  fps
high 1920x1080
100%
NVIDIA GeForce RTX 4070 SUPER:
279 284 ~ 282 fps
ultra 1920x1080
100%
NVIDIA GeForce RTX 4070 SUPER:
278 291 ~ 285 fps
QHD 2560x1440
100%
NVIDIA GeForce RTX 4070 SUPER:
189.6 194.8 ~ 192 fps
4K 3840x2160
100%
NVIDIA GeForce RTX 4070 SUPER:
87.5 92.7 ~ 90 fps
low 1920x1080
100%
NVIDIA GeForce RTX 4070 SUPER:
195.7  fps
med. 1920x1080
100%
NVIDIA GeForce RTX 4070 SUPER:
184.1  fps
high 1920x1080
100%
NVIDIA GeForce RTX 4070 SUPER:
156.5 161.8 ~ 159 fps
ultra 1920x1080
100%
NVIDIA GeForce RTX 4070 SUPER:
141 146 ~ 144 fps
QHD 2560x1440
100%
NVIDIA GeForce RTX 4070 SUPER:
91.3 92.8 ~ 92 fps
4K 3840x2160
100%
NVIDIA GeForce RTX 4070 SUPER:
43.5 44.9 ~ 44 fps
med. 1920x1080
100%
NVIDIA GeForce RTX 4070 SUPER:
201  fps
high 1920x1080
100%
NVIDIA GeForce RTX 4070 SUPER:
150.5 157 ~ 154 fps
QHD 2560x1440
100%
NVIDIA GeForce RTX 4070 SUPER:
108 109.7 ~ 109 fps
4K 3840x2160
100%
NVIDIA GeForce RTX 4070 SUPER:
52.8 54.5 ~ 54 fps
Far Cry 6

Far Cry 6

2021
med. 1920x1080
100%
NVIDIA GeForce RTX 4070 SUPER:
206  fps
high 1920x1080
100%
NVIDIA GeForce RTX 4070 SUPER:
181.8 193.7 ~ 188 fps
ultra 1920x1080
100%
NVIDIA GeForce RTX 4070 SUPER:
143.9 160 173.6 ~ 159 fps
QHD 2560x1440
100%
NVIDIA GeForce RTX 4070 SUPER:
139.4 145.9 ~ 143 fps
4K 3840x2160
100%
NVIDIA GeForce RTX 4070 SUPER:
79 82.7 ~ 81 fps
med. 1920x1080
100%
NVIDIA GeForce RTX 4070 SUPER:
169.2  fps
high 1920x1080
100%
NVIDIA GeForce RTX 4070 SUPER:
159.1  fps
ultra 1920x1080
100%
NVIDIA GeForce RTX 4070 SUPER:
135.5 142.3 ~ 139 fps
QHD 2560x1440
100%
NVIDIA GeForce RTX 4070 SUPER:
106 109.2 ~ 108 fps
4K 3840x2160
100%
NVIDIA GeForce RTX 4070 SUPER:
61.4 63.4 ~ 62 fps
Call of Duty Mobile

Call of Duty Mobile

2020
low
M2 10-Core GPU:
118.8  fps
ultra
M2 10-Core GPU:
58.5  fps
Genshin Impact

Genshin Impact

2020
ultra
M2 10-Core GPU:
65  fps
med. 1920x1080
100%
NVIDIA GeForce RTX 4070 SUPER:
233  fps
high 1920x1080
100%
NVIDIA GeForce RTX 4070 SUPER:
216 226 ~ 221 fps
QHD 2560x1440
100%
NVIDIA GeForce RTX 4070 SUPER:
156.8 161.5 ~ 159 fps
4K 3840x2160
100%
NVIDIA GeForce RTX 4070 SUPER:
80.5 83.2 ~ 82 fps
Armajet

Armajet

2020
high
M2 10-Core GPU:
118.4  fps
low 1280x720
M2 8-Core GPU:
43  fps
M2 10-Core GPU:
53.1 66.8 73 ~ 64 fps
med. 1920x1080
100%
NVIDIA GeForce RTX 4070 SUPER:
193.6  fps
15%
M2 8-Core GPU:
29.7  fps
18%
M2 10-Core GPU:
34 34.2 36 ~ 35 fps
high 1920x1080
100%
NVIDIA GeForce RTX 4070 SUPER:
179.3 184.2 ~ 182 fps
9%
M2 8-Core GPU:
16.6  fps
14%
M2 10-Core GPU:
22 23.8 28 ~ 25 fps
ultra 1920x1080
100%
NVIDIA GeForce RTX 4070 SUPER:
163.4 166.6 ~ 165 fps
8%
M2 8-Core GPU:
13.4  fps
10%
M2 10-Core GPU:
15 16.4 17.6 ~ 16 fps
QHD 2560x1440
100%
NVIDIA GeForce RTX 4070 SUPER:
125.4 131.2 ~ 128 fps
4K 3840x2160
100%
NVIDIA GeForce RTX 4070 SUPER:
66.2 68.9 ~ 68 fps
Control

Control

2019
med. 1920x1080
100%
NVIDIA GeForce RTX 4070 SUPER:
224  fps
high 1920x1080
100%
NVIDIA GeForce RTX 4070 SUPER:
172.7 180.1 ~ 176 fps
QHD 2560x1440
100%
NVIDIA GeForce RTX 4070 SUPER:
112.6 115.5 ~ 114 fps
4K 3840x2160
100%
NVIDIA GeForce RTX 4070 SUPER:
57.4 58.2 ~ 58 fps
4K DLSS 3840x2160
100%
NVIDIA GeForce RTX 4070 SUPER:
67.1 69 ~ 68 fps
low 1280x720
M2 8-Core GPU:
77  fps
M2 10-Core GPU:
88.6 89 136 138 ~ 113 fps
med. 1920x1080
M2 8-Core GPU:
39  fps
M2 10-Core GPU:
39 45.3 46.3 47 ~ 44 fps
high 1920x1080
M2 8-Core GPU:
18  fps
M2 10-Core GPU:
22 26.3 29 29.5 ~ 27 fps
ultra 1920x1080
M2 8-Core GPU:
14  fps
M2 10-Core GPU:
15.9 16 21 21.3 ~ 19 fps
low 1280x720
100%
NVIDIA GeForce RTX 4070 SUPER:
267  fps
med. 1920x1080
100%
NVIDIA GeForce RTX 4070 SUPER:
224  fps
high 1920x1080
100%
NVIDIA GeForce RTX 4070 SUPER:
178.8 186.1 ~ 182 fps
ultra 1920x1080
100%
NVIDIA GeForce RTX 4070 SUPER:
144.8 150.6 ~ 148 fps
QHD 2560x1440
100%
NVIDIA GeForce RTX 4070 SUPER:
116.1 120.8 ~ 118 fps
4K 3840x2160
100%
NVIDIA GeForce RTX 4070 SUPER:
72.8 76.1 ~ 74 fps
low 1280x720
M2 8-Core GPU:
62  fps
M2 10-Core GPU:
60 76 102 ~ 79 fps
med. 1920x1080
100%
NVIDIA GeForce RTX 4070 SUPER:
265  fps
11%
M2 8-Core GPU:
28  fps
13%
M2 10-Core GPU:
28 31 39 40 ~ 35 fps
high 1920x1080
100%
NVIDIA GeForce RTX 4070 SUPER:
257 260 ~ 259 fps
9%
M2 8-Core GPU:
24  fps
12%
M2 10-Core GPU:
25 27 36 36 ~ 31 fps
ultra 1920x1080
100%
NVIDIA GeForce RTX 4070 SUPER:
244 255 ~ 250 fps
8%
M2 8-Core GPU:
20  fps
11%
M2 10-Core GPU:
21 23 31 32 ~ 27 fps
QHD 2560x1440
100%
NVIDIA GeForce RTX 4070 SUPER:
165.3 188 ~ 177 fps
11%
M2 10-Core GPU:
20  fps
4K 3840x2160
100%
NVIDIA GeForce RTX 4070 SUPER:
91.5 96.7 ~ 94 fps
Strange Brigade

Strange Brigade

2018
low 1280x720
100%
NVIDIA GeForce RTX 4070 SUPER:
570 601 ~ 586 fps
med. 1920x1080
100%
NVIDIA GeForce RTX 4070 SUPER:
398 469 ~ 434 fps
high 1920x1080
100%
NVIDIA GeForce RTX 4070 SUPER:
418 437 ~ 428 fps
ultra 1920x1080
100%
NVIDIA GeForce RTX 4070 SUPER:
376 385 ~ 381 fps
QHD 2560x1440
100%
NVIDIA GeForce RTX 4070 SUPER:
260 270 ~ 265 fps
4K 3840x2160
100%
NVIDIA GeForce RTX 4070 SUPER:
130 134.7 ~ 132 fps
PUBG Mobile

PUBG Mobile

2018
high
M2 10-Core GPU:
39.8  fps
Far Cry 5

Far Cry 5

2018
med. 1920x1080
100%
NVIDIA GeForce RTX 4070 SUPER:
203  fps
high 1920x1080
100%
NVIDIA GeForce RTX 4070 SUPER:
199 201 ~ 200 fps
ultra 1920x1080
100%
NVIDIA GeForce RTX 4070 SUPER:
188 191 ~ 190 fps
QHD 2560x1440
100%
NVIDIA GeForce RTX 4070 SUPER:
181 185 ~ 183 fps
4K 3840x2160
100%
NVIDIA GeForce RTX 4070 SUPER:
101 104 ~ 103 fps
low 1280x720
100%
NVIDIA GeForce RTX 4070 SUPER:
226 233 ~ 230 fps
med. 1920x1080
100%
NVIDIA GeForce RTX 4070 SUPER:
196.3 196.4 ~ 196 fps
high 1920x1080
100%
NVIDIA GeForce RTX 4070 SUPER:
151.9 152.4 ~ 152 fps
4K 3840x2160
100%
NVIDIA GeForce RTX 4070 SUPER:
129.1 131.7 ~ 130 fps
low 1280x720
100%
NVIDIA GeForce RTX 4070 SUPER:
235 244 ~ 240 fps
med. 1920x1080
100%
NVIDIA GeForce RTX 4070 SUPER:
234 235 ~ 235 fps
high 1920x1080
100%
NVIDIA GeForce RTX 4070 SUPER:
194 197.1 ~ 196 fps
QHD 2560x1440
100%
NVIDIA GeForce RTX 4070 SUPER:
148 150.5 ~ 149 fps
4K 3840x2160
100%
NVIDIA GeForce RTX 4070 SUPER:
84.8 85.2 ~ 85 fps
low 1280x720
100%
NVIDIA GeForce RTX 4070 SUPER:
244 250 ~ 247 fps
med. 1366x768
100%
NVIDIA GeForce RTX 4070 SUPER:
228 229 ~ 229 fps
high 1920x1080
100%
NVIDIA GeForce RTX 4070 SUPER:
221 223 ~ 222 fps
ultra 1920x1080
100%
NVIDIA GeForce RTX 4070 SUPER:
208 209 ~ 209 fps
4K 3840x2160
100%
NVIDIA GeForce RTX 4070 SUPER:
192.9 202 ~ 197 fps
med. 1366x768
100%
NVIDIA GeForce RTX 4070 SUPER:
566  fps
high 1920x1080
100%
NVIDIA GeForce RTX 4070 SUPER:
406 418 ~ 412 fps
8%
M2 10-Core GPU:
34  fps
ultra 1920x1080
100%
NVIDIA GeForce RTX 4070 SUPER:
191.9 210 ~ 201 fps
14%
M2 10-Core GPU:
28  fps
QHD 2560x1440
100%
NVIDIA GeForce RTX 4070 SUPER:
148.9 159.1 ~ 154 fps
4K 3840x2160
100%
NVIDIA GeForce RTX 4070 SUPER:
129.4 136.7 ~ 133 fps
GTA V

GTA V

2015
low 1024x768
100%
NVIDIA GeForce RTX 4070 SUPER:
187.7 188.3 ~ 188 fps
med. 1366x768
100%
NVIDIA GeForce RTX 4070 SUPER:
187.6 187.9 ~ 188 fps
high 1920x1080
100%
NVIDIA GeForce RTX 4070 SUPER:
186.9 186.9 ~ 187 fps
ultra 1920x1080
100%
NVIDIA GeForce RTX 4070 SUPER:
158.8 160 ~ 159 fps
QHD 2560x1440
100%
NVIDIA GeForce RTX 4070 SUPER:
147.2 148.2 ~ 148 fps
4K 3840x2160
100%
NVIDIA GeForce RTX 4070 SUPER:
164.6 166.6 ~ 166 fps
Asphalt 8: Airborne

Asphalt 8: Airborne

2013
high
M2 10-Core GPU:
67.7  fps
Asphalt 9: Legends

Asphalt 9: Legends

2013
high
M2 10-Core GPU:
44.2  fps

Average Gaming NVIDIA GeForce RTX 4070 SUPER → 100%

Average Gaming 30-70 fps → 100%

Average Gaming Apple M2 8-Core GPU → 10%

Average Gaming Apple M2 10-Core GPU → 12%

Average Gaming 30-70 fps → 13%

NVIDIA GeForce RTX 4070 SUPERApple M2 8-Core GPUApple M2 10-Core GPU
lowmed.highultraQHD4Klowmed.highultraQHD4Klowmed.highultraQHD4K
Avatar Frontiers of Pandora137.4126996534
Call of Duty Modern Warfare 3 202322618216611971
Alan Wake 2112.81107741
Assassin's Creed Mirage20519916312675
Cyberpunk 2077 2.2 Phantom Liberty186181.81591398739
Baldur's Gate 322820119914272
F1 233814023511248040
The Callisto Protocol207.9720915312176
F1 223723953311338643
Ghostwire Tokyo28528228519290
Cyberpunk 2077 1.6195.7184.11591449244
Dying Light 220115410954
Far Cry 620618815914381
Watch Dogs Legion169.2159.113910862
Mafia Definitive Edition23322115982
Borderlands 3193.6182165128684329.716.613.464352516
Control22417611458
Metro Exodus26722418214811874
Shadow of the Tomb Raider26525925017794622824207935312720
Strange Brigade586434428381265132
Far Cry 5203200190183103
X-Plane 11.11230196152130
Final Fantasy XV Benchmark24023519614985
Dota 2 Reborn247229222209197
The Witcher 35664122011541333428
GTA V188188187159148166
NVIDIA GeForce RTX 4070 SUPERApple M2 8-Core GPUApple M2 10-Core GPU
lowmed.highultraQHD4Klowmed.highultraQHD4Klowmed.highultraQHD4K
< 30 fps
< 60 fps
< 120 fps
≥ 120 fps


10


1
25


1
25


1
19


11
13

8
13
5
< 30 fps
< 60 fps
< 120 fps
≥ 120 fps

1
1
2


2


2


< 30 fps
< 60 fps
< 120 fps
≥ 120 fps


2

2

1
2

3


1


For more games that might be playable and a list of all games and graphics cards visit our Gaming List

v1.33
log 17. 13:29:09

#0 ran 0s before starting gpusingle class +0s ... 0s

#1 checking url part for id 12293 +0s ... 0s

#2 checking url part for id 11375 +0s ... 0s

#3 checking url part for id 11368 +0s ... 0s

#4 redirected to Ajax server, took 1752751749s time from redirect:0 +0s ... 0s

#5 did not recreate cache, as it is less than 5 days old! Created at Wed, 16 Jul 2025 05:20:35 +0200 +0s ... 0s

#6 composed specs +0.02s ... 0.02s

#7 did output specs +0s ... 0.02s

#8 start showIntegratedCPUs +0s ... 0.02s

#9 getting avg benchmarks for device 12293 +0.019s ... 0.04s

#10 got single benchmarks 12293 +0.006s ... 0.045s

#11 getting avg benchmarks for device 11375 +0s ... 0.046s

#12 got single benchmarks 11375 +0s ... 0.046s

#13 getting avg benchmarks for device 11368 +0s ... 0.046s

#14 got single benchmarks 11368 +0.008s ... 0.054s

#15 got avg benchmarks for devices +0s ... 0.054s

#16 min, max, avg, median took s +0.022s ... 0.076s

#17 before gaming benchmark output +0s ... 0.076s

#18 Got 334 rows for game benchmarks. +0.019s ... 0.095s

#19 composed SQL query for gamebenchmarks +0s ... 0.095s

#20 got data and put it in $dataArray +0.003s ... 0.097s

#21 benchmarks composed for output. +0.012s ... 0.11s

#22 calculated avg scores. +0s ... 0.11s

#23 return log +0.001s ... 0.11s

Please share our article, every link counts!
Mail Logo
> Expert Reviews and News on Laptops, Smartphones and Tech Innovations > Benchmarks / Tech > Graphics Card Comparison - Head 2 Head
Redaktion, 2017-09- 8 (Update: 2023-07- 1)