NVIDIA GeForce RTX 3090 vs NVIDIA GeForce RTX 3080 Ti vs NVIDIA GeForce RTX 3080
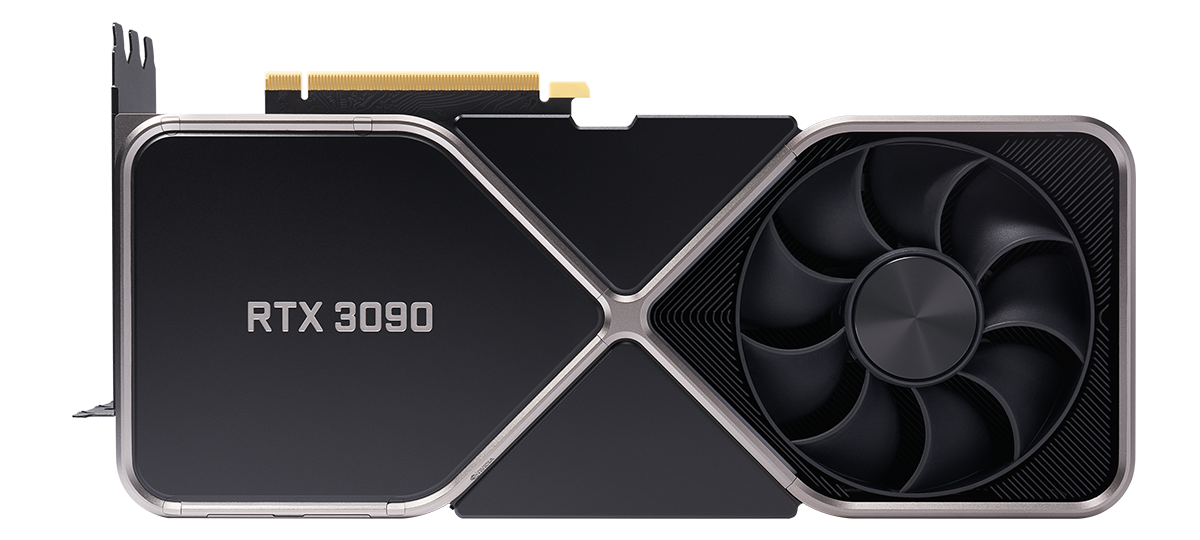
NVIDIA GeForce RTX 3090 ► remove from comparison
The Nvidia GeForce RTX 3090 is high-end desktop graphics card based on the Ampere generation. It uses the big GA102 chip and offers 10,496 shaders and 24 GB GDDR6X graphics memory. Compared to the slower RTX 3080, the 3090 offers 10 - 20% higher gaming performance, but only above 4k. Still it has not enough power for 8k gaming at maximum detail settings. The RTX3090 is rated at 350 Watt but the power efficiency is still quite good.
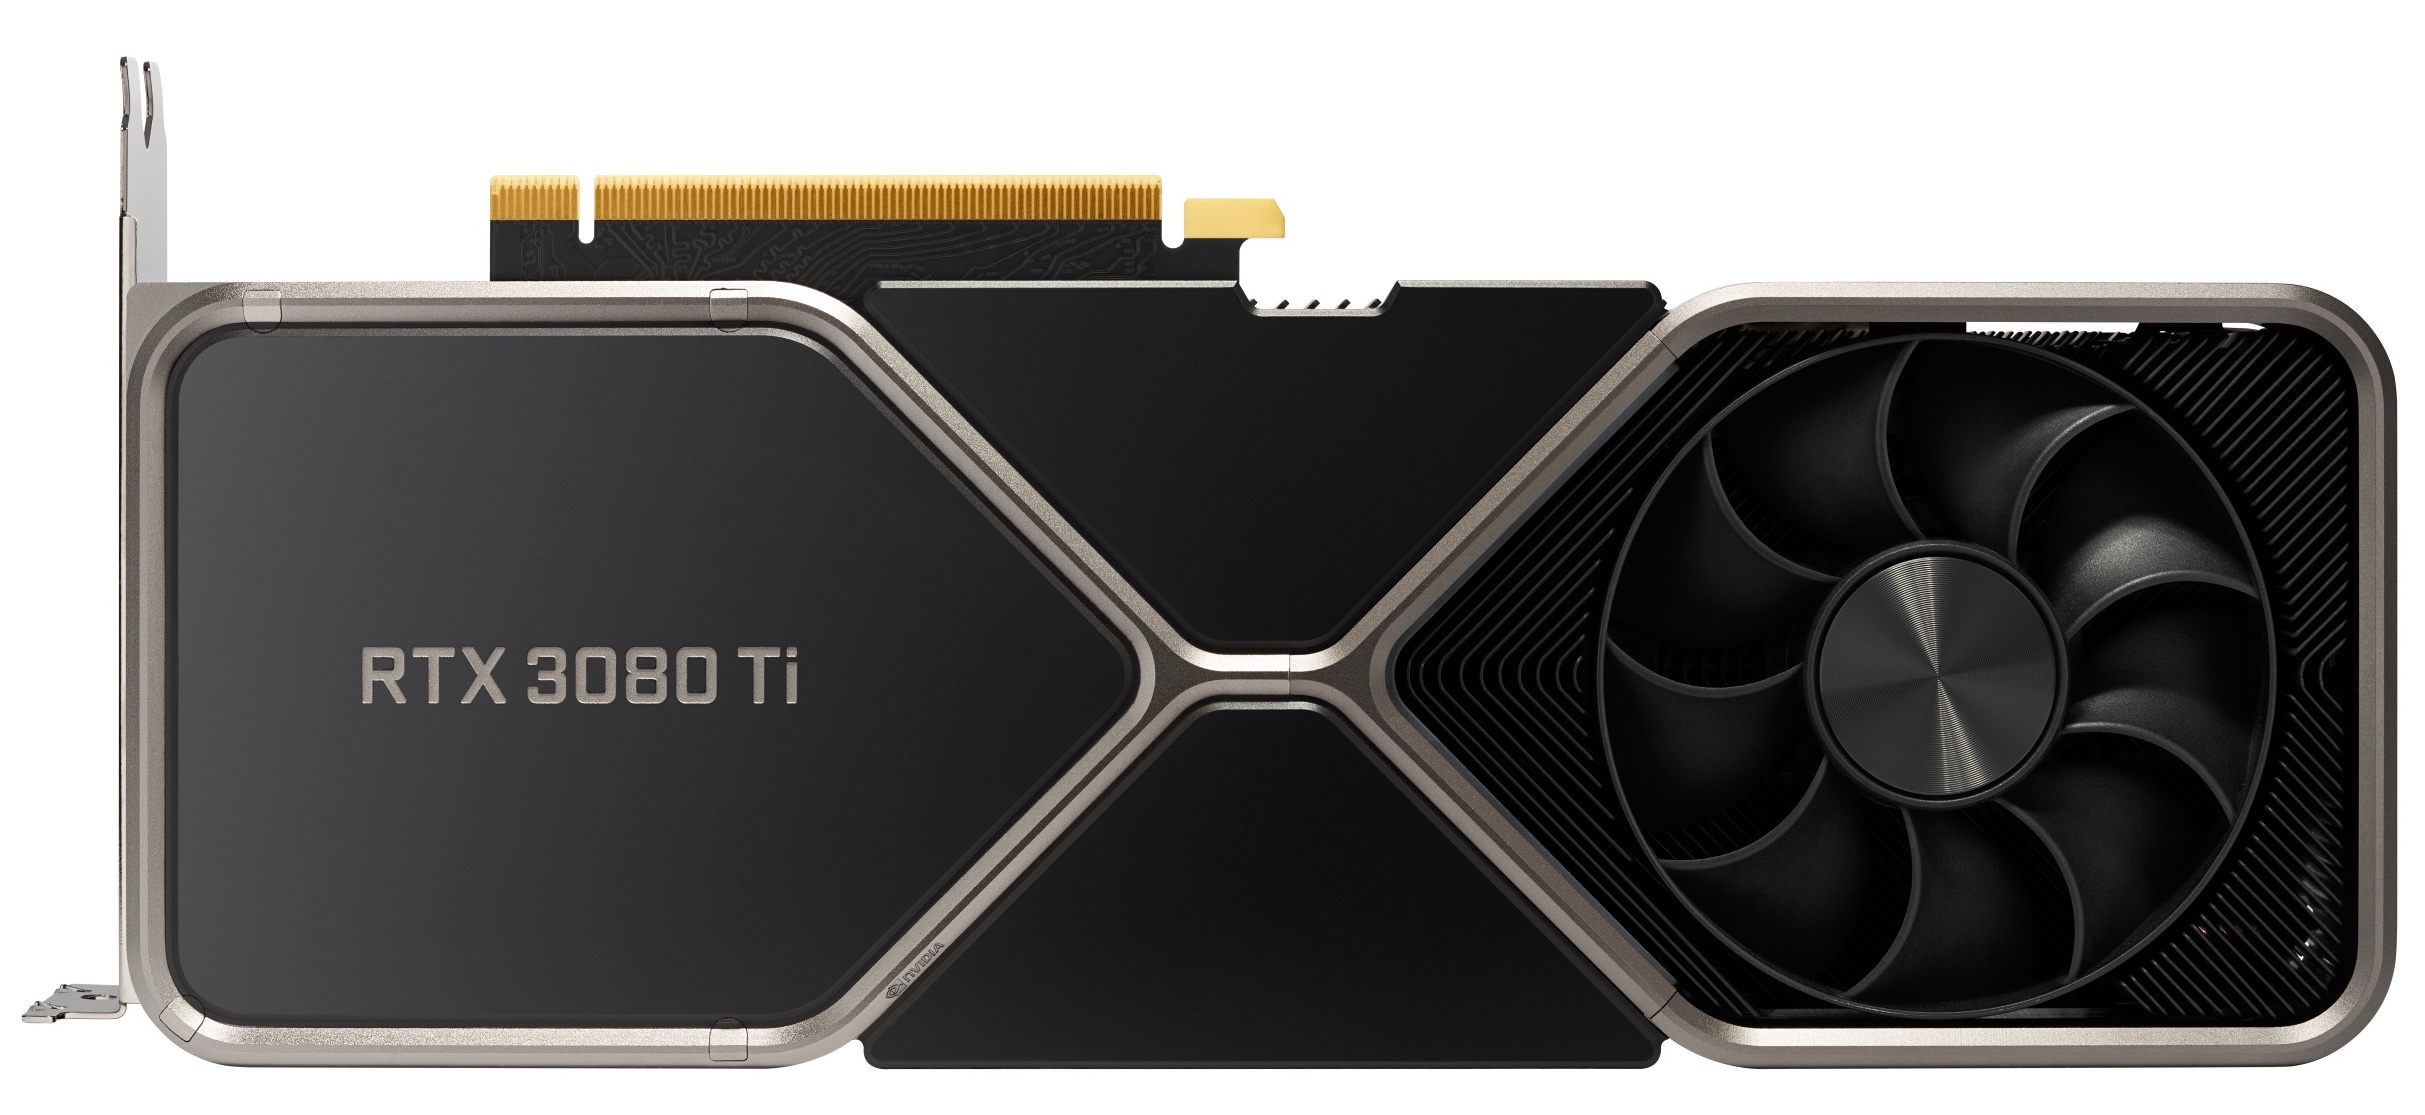
NVIDIA GeForce RTX 3080 Ti ► remove from comparison
The Nvidia GeForce RTX 3080 Ti is high-end desktop graphics card based on the Ampere generation. It uses the big GA102 chip and offers 10,210 shaders and 12 GB GDDR6X graphics memory. The main difference to the expensive RTX 3090 is the reduced VRAM (12 vs. 24 GB and a slight reduction in the shader count (-256 shaders).
Therefore, the gaming performance is quite similar to the RTX 3090 and best suited for 4K gaming with maximum detail settings.
As the RTX 3090, the RTX 3080 Ti is specified with a 350 Watt TDP and therefore quite power hungry (750 Watt power supply recommended).
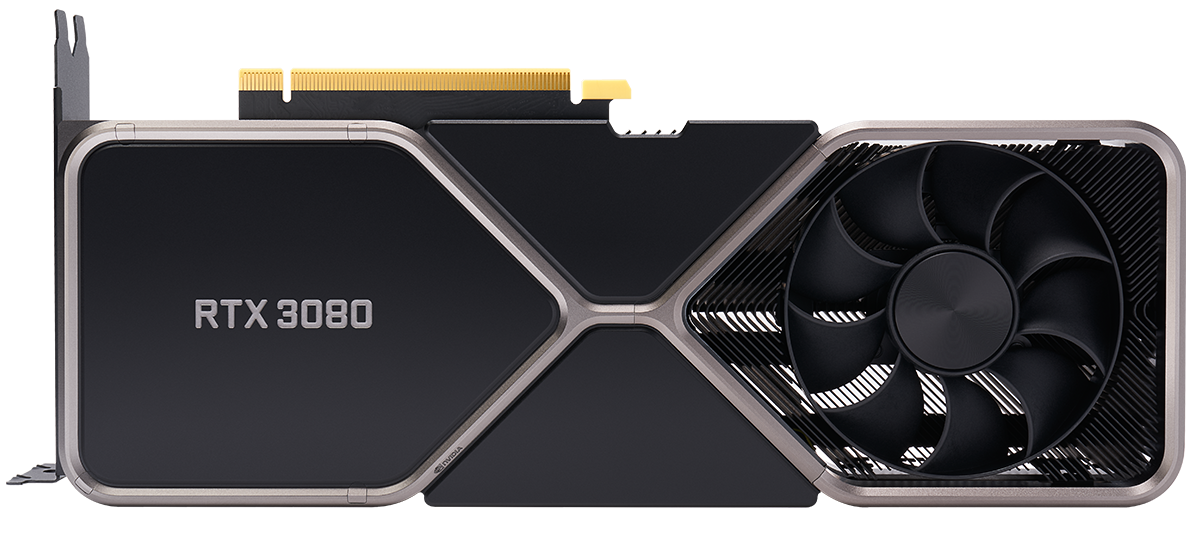
NVIDIA GeForce RTX 3080 ► remove from comparison
The Nvidia GeForce RTX 3080 is high-end desktop graphics card based on the Ampere generation. It uses the big GA102 chip and offers 8,704 shaders and 10 GB GDDR6X graphics memory.
The gaming performance in 4k is clearly better than the old GeForce RTX 2080 Ti (approximately 15% faster). Therefore, even demanding games should run with maximum detail settings in 4k. Enabling raytracing will however reduce the framerate and therefore maximum details won't be playable.
The RTX3080 is produced in 8nm at Samsung and rated at 320 Watt but the power efficiency is still quite good.
NVIDIA GeForce RTX 3090 NVIDIA GeForce RTX 3080 Ti NVIDIA GeForce RTX 3080 GeForce RTX 3000 Series Codename Ampere GA102 Ampere GA102 Ampere GA102 Architecture Ampere Ampere Ampere Pipelines 10496 - unified 10240 - unified 8704 - unified Core Speed 1400 - 1700 (Boost) MHz 1370 - 1667 (Boost) MHz 1450 - 1710 (Boost) MHz Memory Speed 19500 MHz 19000 MHz 19000 MHz Memory Bus Width 384 Bit 384 Bit 320 Bit Memory Type GDDR6X GDDR6X GDDR6X Max. Amount of Memory 24 GB 12 GB 24 GB Shared Memory no no no API DirectX 12_2, Shader 6.7, OpenGL 4.6 DirectX 12_2, Shader 6.7, OpenGL 4.6 DirectX 12_2, Shader 6.7, OpenGL 4.6 Power Consumption 350 Watt 350 Watt 320 Watt Transistors 28 Billion 28 Billion 28 Billion technology 8 nm 8 nm 8 nm Date of Announcement 24.09.2020 24.09.2020 16.09.2020 Link to Manufacturer Page www.nvidia.com
Benchmarks Performance Rating - 3DMark 11 + Fire Strike + Time Spy - NVIDIA GeForce RTX 3090
21.8 pt (65%)
...
...
Performance Rating - 3DMark 11 + Fire Strike + Time Spy - NVIDIA GeForce RTX 3080 Ti
21.5 pt (65%)
...
NVIDIA GeForce RTX 3080 Ti
...
Performance Rating - 3DMark 11 + Fire Strike + Time Spy - NVIDIA GeForce RTX 3080
17.9 pt (54%)
...
...
3DMark - 3DMark Time Spy Score
min: 17196 avg: 18367 median: 18551 (53%) max: 19226 Points
GPU TDP ? TDP 350 W 99% 100%
min: 17433 avg: 18566 median: 18903.5 (55%) max: 19025 Points
GPU TDP ? TDP 350 W 99% 100%
min: 15712 avg: 16134 median: 16133.5 (47%) max: 16555 Points
GPU TDP ? TDP 350 W 97% 100%
3DMark - 3DMark Time Spy Graphics
min: 18685 avg: 19254 median: 19195 (51%) max: 20433 Points
GPU TDP ? TDP 350 W 99% 100%
min: 19041 avg: 19237 median: 19224 (51%) max: 19460 Points
GPU TDP ? TDP 350 W 100% 100%
min: 17467 avg: 17536 median: 17535.5 (46%) max: 17604 Points
GPU TDP ? TDP 350 W 98% 100%
3DMark - 3DMark Ice Storm Unlimited Graphics
min: 496020 avg: 732840 median: 763636 (87%) max: 854867 Points
GPU TDP ? TDP 350 W 89% 100%
min: 750291 avg: 779661 median: 785365 (89%) max: 803326 Points
GPU TDP ? TDP 350 W 91% 100%
min: 470072 avg: 529548 median: 529548 (60%) max: 589024 Points
GPU TDP ? TDP 350 W 87% 100%
3DMark - 3DMark Ice Storm Extreme Graphics
min: 335116 avg: 571257 median: 594530 (76%) max: 689599 Points
GPU TDP ? TDP 350 W 89% 100%
min: 572351 avg: 592563 median: 593730 (76%) max: 611608 Points
GPU TDP ? TDP 350 W 91% 100%
min: 343894 avg: 391512 median: 391512 (50%) max: 439129 Points
GPU TDP ? TDP 350 W 86% 100%
3DMark - 3DMark Cloud Gate Score
min: 68336 avg: 79589 median: 84644 (90%) max: 86946 Points
GPU TDP ? TDP 350 W 100% 98%
min: 76027 avg: 81917 median: 81921 (88%) max: 87802 Points
GPU TDP ? TDP 350 W 100% 97%
min: 65313 avg: 70339 median: 70338.5 (75%) max: 75364 Points
GPU TDP ? TDP 350 W 100% 100%
3DMark - 3DMark Cloud Gate Graphics
min: 181518 avg: 223603 median: 231656 (61%) max: 251267 Points
GPU TDP ? TDP 350 W 91% 100%
min: 161798 avg: 209614 median: 218185 (57%) max: 248858 Points
GPU TDP ? TDP 350 W 98% 100%
min: 173402 avg: 188064 median: 188064 (49%) max: 202725 Points
GPU TDP ? TDP 350 W 96% 100%
3DMark - 3DMark Fire Strike Standard Score
min: 30247 avg: 37206 median: 38748 (68%) max: 43626 Points
GPU TDP ? TDP 350 W 94% 100%
min: 32491 avg: 38344 median: 38628.5 (68%) max: 43628 Points
GPU TDP ? TDP 350 W 95% 100%
min: 29978 avg: 31709 median: 31709 (56%) max: 33440 Points
GPU TDP ? TDP 350 W 93% 100%
3DMark - 3DMark Fire Strike Standard Graphics
min: 41298 avg: 46854 median: 47773.5 (54%) max: 49282 Points
GPU TDP ? TDP 350 W 96% 100%
min: 45785 avg: 47180 median: 47113 (53%) max: 48709 Points
GPU TDP ? TDP 350 W 97% 100%
min: 37604 avg: 39257 median: 39257 (44%) max: 40910 Points
GPU TDP ? TDP 350 W 95% 100%
3DMark - 3DMark Ice Storm Graphics
min: 333592 avg: 623562 median: 648798 (78%) max: 747973 Points
GPU TDP ? TDP 350 W 88% 100%
min: 648792 avg: 672558 median: 682810 (82%) max: 686073 Points
GPU TDP ? TDP 350 W 89% 100%
min: 341116 avg: 408252 median: 408252 (49%) max: 475388 Points
GPU TDP ? TDP 350 W 83% 100%
3DMark - 3DMark Wild Life Unlimited
114111 Points (57%)
101411 Points (51%)
3DMark - 3DMark Night Raid
min: 52438 avg: 65248 median: 61737 (58%) max: 85081 Points
GPU TDP ? TDP 350 W 69% 100%
min: 82972 avg: 86531 median: 86530.5 (82%) max: 90089 Points
GPU TDP ? TDP 350 W 67% 100%
min: 59050 avg: 60282 median: 60281.5 (57%) max: 61513 Points
GPU TDP ? TDP 350 W 70% 100%
3DMark - 3DMark Night Raid Graphics Score
min: 110015 avg: 141990 median: 132351 (51%) max: 193242 Points
GPU TDP ? TDP 350 W 63% 100%
min: 180232 avg: 189351 median: 189351 (73%) max: 198470 Points
GPU TDP ? TDP 350 W 62% 100%
min: 114849 avg: 120402 median: 120402 (46%) max: 125954 Points
GPU TDP ? TDP 350 W 64% 100%
3DMark 11 - 3DM11 Performance Score
min: 37897 avg: 45852 median: 47869.5 (66%) max: 50718 Points
GPU TDP ? TDP 350 W 96% 100%
min: 41396 avg: 46617 median: 46988 (65%) max: 51094 Points
GPU TDP ? TDP 350 W 96% 100%
min: 32211 avg: 36325 median: 35564.5 (49%) max: 41958 Points
GPU TDP ? TDP 350 W 92% 100%
3DMark 11 - 3DM11 Performance GPU
min: 55144 avg: 60854 median: 61569 (53%) max: 66934 Points
GPU TDP ? TDP 350 W 97% 100%
min: 59799 avg: 60987 median: 60980 (52%) max: 62189 Points
GPU TDP ? TDP 350 W 98% 100%
min: 47287 avg: 53094 median: 53713 (46%) max: 57662 Points
GPU TDP ? TDP 350 W 95% 100%
3DMark Vantage + NVIDIA GeForce RTX 3090 3DMark Vantage - 3DM Vant. Perf. total
min: 95374 avg: 117198 median: 121431 (35%) max: 132775 Points
GPU TDP ? TDP 350 W 92% 100%
3DM Vant. Perf. total + NVIDIA GeForce RTX 3080 Ti
min: 118753 avg: 123725 median: 120236 (35%) max: 132187 Points
GPU TDP ? TDP 350 W 96% 100%
3DM Vant. Perf. total + NVIDIA GeForce RTX 3080
min: 90427 avg: 91747 median: 91746.5 (27%) max: 93066 Points
GPU TDP ? TDP 350 W 90% 100%
3DM Vant. Perf. GPU no PhysX + NVIDIA GeForce RTX 3090 3DMark Vantage - 3DM Vant. Perf. GPU no PhysX
min: 102875 avg: 129123 median: 138411 (79%) max: 147389 Points
GPU TDP ? TDP 350 W 90% 100%
3DM Vant. Perf. GPU no PhysX + NVIDIA GeForce RTX 3080 Ti
min: 130100 avg: 136576 median: 135271 (77%) max: 144357 Points
GPU TDP ? TDP 350 W 94% 100%
3DM Vant. Perf. GPU no PhysX + NVIDIA GeForce RTX 3080
min: 96470 avg: 98653 median: 98653 (56%) max: 100836 Points
GPU TDP ? TDP 350 W 88% 100%
3DMark 05 - 3DMark 05 - Standard
min: 37711 avg: 68167 median: 74272 (81%) max: 86644 Points
GPU TDP ? TDP 350 W 86% 100%
min: 63621 avg: 77313 median: 82816 (91%) max: 85501 Points
GPU TDP ? TDP 350 W 94% 100%
min: 46192 avg: 48523 median: 48522.5 (53%) max: 50853 Points
GPU TDP ? TDP 350 W 84% 100%
3DMark 06 3DMark 06 - Standard 1280x1024 + NVIDIA GeForce RTX 3090
min: 41778 avg: 60644 median: 65732 (87%) max: 72067 Points
GPU TDP ? TDP 350 W 89% 100%
3DMark 06 - Standard 1280x1024 + NVIDIA GeForce RTX 3080 Ti
min: 66161 avg: 68191 median: 66856 (88%) max: 71555 Points
GPU TDP ? TDP 350 W 90% 100%
3DMark 06 - Standard 1280x1024 + NVIDIA GeForce RTX 3080
min: 41923 avg: 43089 median: 43089 (57%) max: 44255 Points
GPU TDP ? TDP 350 W 83% 100%
Unigine Valley 1.0 - Unigine Valley 1.0 DX
min: 184.2 avg: 222.7 median: 235.7 (77%) max: 245 fps
GPU TDP ? TDP 350 W 91% 100%
min: 206 avg: 228.3 median: 233.3 (76%) max: 240.4 fps
GPU TDP ? TDP 350 W 92% 100%
min: 176.2 avg: 179 median: 179 (59%) max: 181.8 fps
GPU TDP ? TDP 350 W 89% 100%
Blender - Blender 3.3 Classroom CUDA *
min: 20 avg: 21.4 median: 21 (3%) max: 22 Seconds
GPU TDP ? TDP 350 W 100% 100%
min: 21 avg: 21.5 median: 21.5 (3%) max: 22 Seconds
GPU TDP ? TDP 350 W 100% 100%
Blender - Blender 3.3 Classroom OPTIX *
min: 13 avg: 13.4 median: 13 (5%) max: 14 Seconds
GPU TDP ? TDP 350 W 100% 100%
min: 14 avg: 14.5 median: 14.5 (5%) max: 15 Seconds
GPU TDP ? TDP 350 W 100% 100%
SPECviewperf 12 + NVIDIA GeForce RTX 3090 SPECviewperf 12 - specvp12 sw-03
min: 71.4 avg: 95.3 median: 104.5 (26%) max: 108 fps
GPU TDP ? TDP 350 W 86% 100%
specvp12 sw-03 + NVIDIA GeForce RTX 3080 Ti
min: 100 avg: 103.7 median: 105 (26%) max: 106 fps
GPU TDP ? TDP 350 W 88% 100%
specvp12 sw-03 + NVIDIA GeForce RTX 3080
min: 66 avg: 68.6 median: 68.6 (17%) max: 71.1 fps
GPU TDP ? TDP 350 W 84% 100%
specvp12 snx-02 + NVIDIA GeForce RTX 3090 SPECviewperf 12 - specvp12 snx-02
min: 13.03 avg: 15.9 median: 16.4 (2%) max: 17.1 fps
GPU TDP ? TDP 350 W 93% 100%
specvp12 snx-02 + NVIDIA GeForce RTX 3080 Ti
min: 16.5 avg: 16.7 median: 16.6 (2%) max: 17.1 fps
GPU TDP ? TDP 350 W 94% 100%
specvp12 snx-02 + NVIDIA GeForce RTX 3080
min: 12.85 avg: 13.1 median: 13.1 (2%) max: 13.27 fps
GPU TDP ? TDP 350 W 90% 100%
specvp12 showcase-01 + NVIDIA GeForce RTX 3090 SPECviewperf 12 - specvp12 showcase-01
min: 236 avg: 256.1 median: 262 (57%) max: 269 fps
GPU TDP ? TDP 350 W 94% 100%
specvp12 showcase-01 + NVIDIA GeForce RTX 3080 Ti
min: 252 avg: 256 median: 252 (55%) max: 264 fps
GPU TDP ? TDP 350 W 95% 100%
specvp12 showcase-01 + NVIDIA GeForce RTX 3080
min: 180 avg: 190 median: 190 (41%) max: 199.9 fps
GPU TDP ? TDP 350 W 90% 100%
specvp12 mediacal-01 + NVIDIA GeForce RTX 3090 SPECviewperf 12 - specvp12 mediacal-01
min: 42.91 avg: 87.9 median: 86.1 (22%) max: 142 fps
GPU TDP ? TDP 350 W 65% 100%
specvp12 mediacal-01 + NVIDIA GeForce RTX 3080 Ti
min: 89.4 avg: 124.8 median: 142 (36%) max: 143 fps
GPU TDP ? TDP 350 W 73% 100%
specvp12 mediacal-01 + NVIDIA GeForce RTX 3080
min: 36.93 avg: 43.9 median: 43.9 (11%) max: 50.8 fps
GPU TDP ? TDP 350 W 65% 100%
specvp12 maya-04 + NVIDIA GeForce RTX 3090 SPECviewperf 12 - specvp12 maya-04
min: 170 avg: 263.1 median: 300 (82%) max: 322 fps
GPU TDP ? TDP 350 W 82% 100%
specvp12 maya-04 + NVIDIA GeForce RTX 3080 Ti
min: 283 avg: 294 median: 297 (81%) max: 302 fps
GPU TDP ? TDP 350 W 85% 100%
specvp12 maya-04 + NVIDIA GeForce RTX 3080
min: 146 avg: 165.3 median: 165.3 (45%) max: 184.6 fps
GPU TDP ? TDP 350 W 79% 100%
specvp12 energy-01 + NVIDIA GeForce RTX 3090 SPECviewperf 12 - specvp12 energy-01
min: 20.41 avg: 25 median: 25.6 (23%) max: 27.7 fps
GPU TDP ? TDP 350 W 90% 100%
specvp12 energy-01 + NVIDIA GeForce RTX 3080 Ti
min: 24.9 avg: 26.7 median: 27.5 (25%) max: 27.6 fps
GPU TDP ? TDP 350 W 92% 100%
specvp12 energy-01 + NVIDIA GeForce RTX 3080
min: 16.35 avg: 17.4 median: 17.4 (16%) max: 18.47 fps
GPU TDP ? TDP 350 W 86% 100%
specvp12 creo-01 + NVIDIA GeForce RTX 3090 SPECviewperf 12 - specvp12 creo-01
min: 69.4 avg: 88.6 median: 93.3 (37%) max: 101 fps
GPU TDP ? TDP 350 W 91% 100%
specvp12 creo-01 + NVIDIA GeForce RTX 3080 Ti
min: 94.3 avg: 96.3 median: 94.7 (38%) max: 100 fps
GPU TDP ? TDP 350 W 91% 100%
specvp12 creo-01 + NVIDIA GeForce RTX 3080
min: 65.6 avg: 69.9 median: 69.9 (28%) max: 74.2 fps
GPU TDP ? TDP 350 W 87% 100%
specvp12 catia-04 + NVIDIA GeForce RTX 3090 SPECviewperf 12 - specvp12 catia-04
min: 127 avg: 159.3 median: 169.5 (28%) max: 177 fps
GPU TDP ? TDP 350 W 89% 100%
specvp12 catia-04 + NVIDIA GeForce RTX 3080 Ti
min: 167 avg: 172 median: 171 (28%) max: 178 fps
GPU TDP ? TDP 350 W 90% 100%
specvp12 catia-04 + NVIDIA GeForce RTX 3080
min: 116 avg: 121.1 median: 121.1 (20%) max: 126.1 fps
GPU TDP ? TDP 350 W 86% 100%
specvp12 3dsmax-05 + NVIDIA GeForce RTX 3090 SPECviewperf 12 - specvp12 3dsmax-05
min: 320 avg: 362.4 median: 368 (64%) max: 389 fps
GPU TDP ? TDP 350 W 91% 100%
specvp12 3dsmax-05 + NVIDIA GeForce RTX 3080 Ti
min: 363 avg: 373.3 median: 372 (65%) max: 385 fps
GPU TDP ? TDP 350 W 94% 100%
specvp12 3dsmax-05 + NVIDIA GeForce RTX 3080
min: 275.6 avg: 275.8 median: 275.8 (48%) max: 276 fps
GPU TDP ? TDP 350 W 89% 100%
SPECviewperf 13 specvp13 sw-04 + NVIDIA GeForce RTX 3090 SPECviewperf 13 - specvp13 sw-04
min: 82.9 avg: 133.9 median: 150.5 (40%) max: 155 fps
GPU TDP ? TDP 350 W 83% 100%
specvp13 sw-04 + NVIDIA GeForce RTX 3080 Ti
min: 146 avg: 150.7 median: 153 (41%) max: 153 fps
GPU TDP ? TDP 350 W 85% 100%
specvp13 sw-04 + NVIDIA GeForce RTX 3080
min: 92.4 avg: 94.5 median: 94.5 (25%) max: 96.5 fps
GPU TDP ? TDP 350 W 80% 100%
specvp13 snx-03 + NVIDIA GeForce RTX 3090 SPECviewperf 13 - specvp13 snx-03
min: 15.6 avg: 27.6 median: 29.6 (3%) max: 30.7 fps
GPU TDP ? TDP 350 W 87% 100%
specvp13 snx-03 + NVIDIA GeForce RTX 3080 Ti
min: 29.6 avg: 30.1 median: 29.9 (3%) max: 30.8 fps
GPU TDP ? TDP 350 W 88% 100%
specvp13 snx-03 + NVIDIA GeForce RTX 3080
min: 23.22 avg: 23.7 median: 23.7 (3%) max: 24.26 fps
GPU TDP ? TDP 350 W 86% 100%
specvp13 showcase-02 + NVIDIA GeForce RTX 3090 SPECviewperf 13 - specvp13 showcase-02
min: 114 avg: 243.9 median: 262 (57%) max: 268 fps
GPU TDP ? TDP 350 W 86% 100%
specvp13 showcase-02 + NVIDIA GeForce RTX 3080 Ti
min: 252 avg: 256.7 median: 254 (55%) max: 264 fps
GPU TDP ? TDP 350 W 88% 100%
specvp13 showcase-02 + NVIDIA GeForce RTX 3080
204 fps (44%)
GPU TDP ? TDP 350 W 87% 100%
specvp13 medical-02 + NVIDIA GeForce RTX 3090 SPECviewperf 13 - specvp13 medical-02
min: 49.3 avg: 100.7 median: 106.5 (22%) max: 109 fps
GPU TDP ? TDP 350 W 89% 100%
specvp13 medical-02 + NVIDIA GeForce RTX 3080 Ti
min: 106 avg: 106.3 median: 106 (22%) max: 107 fps
GPU TDP ? TDP 350 W 91% 100%
specvp13 medical-02 + NVIDIA GeForce RTX 3080
min: 91.8 avg: 95.4 median: 95.4 (20%) max: 99 fps
GPU TDP ? TDP 350 W 90% 100%
specvp13 maya-05 + NVIDIA GeForce RTX 3090 SPECviewperf 13 - specvp13 maya-05
min: 253 avg: 515 median: 568 (64%) max: 580 fps
GPU TDP ? TDP 350 W 84% 100%
specvp13 maya-05 + NVIDIA GeForce RTX 3080 Ti
min: 567 avg: 574 median: 569 (65%) max: 586 fps
GPU TDP ? TDP 350 W 86% 100%
specvp13 maya-05 + NVIDIA GeForce RTX 3080
min: 360.2 avg: 400.1 median: 400.1 (45%) max: 440 fps
GPU TDP ? TDP 350 W 82% 100%
specvp13 energy-02 + NVIDIA GeForce RTX 3090 SPECviewperf 13 - specvp13 energy-02
min: 26.6 avg: 42.7 median: 44.3 (14%) max: 45.21 fps
GPU TDP ? TDP 350 W 93% 100%
specvp13 energy-02 + NVIDIA GeForce RTX 3080 Ti
min: 35.8 avg: 41.4 median: 44.1 (14%) max: 44.2 fps
GPU TDP ? TDP 350 W 97% 100%
specvp13 energy-02 + NVIDIA GeForce RTX 3080
min: 36.08 avg: 37 median: 37 (12%) max: 37.87 fps
GPU TDP ? TDP 350 W 95% 100%
specvp13 creo-02 + NVIDIA GeForce RTX 3090 SPECviewperf 13 - specvp13 creo-02
min: 176 avg: 360.9 median: 397.5 (58%) max: 403 fps
GPU TDP ? TDP 350 W 84% 100%
specvp13 creo-02 + NVIDIA GeForce RTX 3080 Ti
min: 389 avg: 398 median: 402 (59%) max: 403 fps
GPU TDP ? TDP 350 W 86% 100%
specvp13 creo-02 + NVIDIA GeForce RTX 3080
min: 281.2 avg: 288.1 median: 288.1 (42%) max: 295 fps
GPU TDP ? TDP 350 W 83% 100%
specvp13 catia-05 + NVIDIA GeForce RTX 3090 SPECviewperf 13 - specvp13 catia-05
min: 111 avg: 228.9 median: 250 (28%) max: 260 fps
GPU TDP ? TDP 350 W 83% 100%
specvp13 catia-05 + NVIDIA GeForce RTX 3080 Ti
min: 241 avg: 251.3 median: 255 (28%) max: 258 fps
GPU TDP ? TDP 350 W 87% 100%
specvp13 catia-05 + NVIDIA GeForce RTX 3080
min: 190 avg: 190.2 median: 190.2 (21%) max: 190.4 fps
GPU TDP ? TDP 350 W 84% 100%
specvp13 3dsmax-06 + NVIDIA GeForce RTX 3090 SPECviewperf 13 - specvp13 3dsmax-06
min: 180 avg: 345.8 median: 369 (64%) max: 387 fps
GPU TDP ? TDP 350 W 85% 100%
specvp13 3dsmax-06 + NVIDIA GeForce RTX 3080 Ti
min: 364 avg: 372.3 median: 371 (65%) max: 382 fps
GPU TDP ? TDP 350 W 88% 100%
specvp13 3dsmax-06 + NVIDIA GeForce RTX 3080
min: 238.2 avg: 266.1 median: 266.1 (46%) max: 294 fps
GPU TDP ? TDP 350 W 84% 100%
SPECviewperf 2020 specvp2020 solidworks-05 4k + NVIDIA GeForce RTX 3090 SPECviewperf 2020 - specvp2020 solidworks-05 4k
min: 93.1 avg: 178 median: 191.5 (56%) max: 194 fps
GPU TDP ? TDP 350 W 88% 100%
specvp2020 solidworks-05 4k + NVIDIA GeForce RTX 3080 Ti
184 fps (54%)
GPU TDP ? TDP 350 W 89% 100%
specvp2020 solidworks-05 4k + NVIDIA GeForce RTX 3080
158 fps (47%)
GPU TDP ? TDP 350 W 88% 100%
specvp2020 snx-04 4k + NVIDIA GeForce RTX 3090 SPECviewperf 2020 - specvp2020 snx-04 4k
min: 13.2 avg: 23.3 median: 24.7 (3%) max: 25.6 fps
GPU TDP ? TDP 350 W 89% 100%
specvp2020 snx-04 4k + NVIDIA GeForce RTX 3080 Ti
min: 24.7 avg: 25.2 median: 24.9 (3%) max: 25.9 fps
GPU TDP ? TDP 350 W 91% 100%
specvp2020 snx-04 4k + NVIDIA GeForce RTX 3080
19.8 fps (2%)
GPU TDP ? TDP 350 W 89% 100%
specvp2020 medical-03 4k + NVIDIA GeForce RTX 3090 SPECviewperf 2020 - specvp2020 medical-03 4k
min: 9.95 avg: 19.6 median: 20.5 (20%) max: 23 fps
GPU TDP ? TDP 350 W 86% 100%
specvp2020 medical-03 4k + NVIDIA GeForce RTX 3080 Ti
min: 19.8 avg: 21.8 median: 22.7 (22%) max: 22.9 fps
GPU TDP ? TDP 350 W 90% 100%
specvp2020 medical-03 4k + NVIDIA GeForce RTX 3080
18.5 fps (18%)
GPU TDP ? TDP 350 W 90% 100%
specvp2020 maya-06 4k + NVIDIA GeForce RTX 3090 SPECviewperf 2020 - specvp2020 maya-06 4k
min: 181 avg: 335.9 median: 356 (58%) max: 369 fps
GPU TDP ? TDP 350 W 87% 100%
specvp2020 maya-06 4k + NVIDIA GeForce RTX 3080 Ti
min: 351 avg: 356.3 median: 352 (57%) max: 366 fps
GPU TDP ? TDP 350 W 91% 100%
specvp2020 maya-06 4k + NVIDIA GeForce RTX 3080
293 fps (48%)
GPU TDP ? TDP 350 W 89% 100%
specvp2020 energy-03 4k + NVIDIA GeForce RTX 3090 SPECviewperf 2020 - specvp2020 energy-03 4k
min: 22.3 avg: 63.7 median: 57.6 (13%) max: 101 fps
GPU TDP ? TDP 350 W 100% 64%
specvp2020 energy-03 4k + NVIDIA GeForce RTX 3080 Ti
min: 38.9 avg: 64.3 median: 57.5 (13%) max: 96.4 fps
GPU TDP ? TDP 350 W 100% 76%
specvp2020 energy-03 4k + NVIDIA GeForce RTX 3080
51.7 fps (11%)
GPU TDP ? TDP 350 W 100% 79%
specvp2020 creo-03 4k + NVIDIA GeForce RTX 3090 SPECviewperf 2020 - specvp2020 creo-03 4k
min: 68.1 avg: 105.5 median: 114 (54%) max: 118 fps
GPU TDP ? TDP 350 W 89% 100%
specvp2020 creo-03 4k + NVIDIA GeForce RTX 3080 Ti
min: 108 avg: 113 median: 114 (54%) max: 117 fps
GPU TDP ? TDP 350 W 91% 100%
specvp2020 creo-03 4k + NVIDIA GeForce RTX 3080
77.6 fps (37%)
GPU TDP ? TDP 350 W 88% 100%
specvp2020 catia-06 4k + NVIDIA GeForce RTX 3090 SPECviewperf 2020 - specvp2020 catia-06 4k
min: 32.3 avg: 56.3 median: 59.5 (39%) max: 60.4 fps
GPU TDP ? TDP 350 W 89% 100%
specvp2020 catia-06 4k + NVIDIA GeForce RTX 3080 Ti
min: 58.4 avg: 59.6 median: 59.9 (39%) max: 60.4 fps
GPU TDP ? TDP 350 W 91% 100%
specvp2020 catia-06 4k + NVIDIA GeForce RTX 3080
50 fps (33%)
GPU TDP ? TDP 350 W 90% 100%
specvp2020 3dsmax-07 4k + NVIDIA GeForce RTX 3090 SPECviewperf 2020 - specvp2020 3dsmax-07 4k
min: 70.2 avg: 133.5 median: 142 (59%) max: 143 fps
GPU TDP ? TDP 350 W 89% 100%
specvp2020 3dsmax-07 4k + NVIDIA GeForce RTX 3080 Ti
min: 139 avg: 139.3 median: 139 (58%) max: 140 fps
GPU TDP ? TDP 350 W 91% 100%
specvp2020 3dsmax-07 4k + NVIDIA GeForce RTX 3080
100 fps (42%)
GPU TDP ? TDP 350 W 88% 100%
Cinebench R10 Cinebench R10 Shading (32bit) + NVIDIA GeForce RTX 3090 Cinebench R10 - Cinebench R10 Shading (32bit)
min: 628 avg: 7172 median: 6829 (5%) max: 16110 Points
GPU TDP ? TDP 350 W 100% 93%
Cinebench R10 Shading (32bit) + NVIDIA GeForce RTX 3080 Ti
min: 6828 avg: 6829 median: 6829 (5%) max: 6830 Points
GPU TDP ? TDP 350 W 100% 93%
Cinebench R11.5 Cinebench R11.5 OpenGL 64 Bit + NVIDIA GeForce RTX 3090 Cinebench R11.5 - Cinebench R11.5 OpenGL 64 Bit
min: 170.14 avg: 207.4 median: 207.2 (72%) max: 232.15 fps
GPU TDP ? TDP 350 W 100% 94%
Cinebench R11.5 OpenGL 64 Bit + NVIDIA GeForce RTX 3080 Ti
min: 198.8 avg: 208.9 median: 208.9 (72%) max: 218.92 fps
GPU TDP ? TDP 350 W 100% 96%
Cinebench R15 + NVIDIA GeForce RTX 3090 Cinebench R15 - Cinebench R15 OpenGL 64 Bit
min: 210 avg: 346.9 median: 368 (21%) max: 389.22 fps
GPU TDP ? TDP 350 W 100% 98%
Cinebench R15 OpenGL 64 Bit + NVIDIA GeForce RTX 3080 Ti
min: 312.84 avg: 326.4 median: 326.4 (19%) max: 339.9 fps
GPU TDP ? TDP 350 W 100% 96%
Cinebench R15 OpenGL Ref. Match 64 Bit + NVIDIA GeForce RTX 3090 Cinebench R15 - Cinebench R15 OpenGL Ref. Match 64 Bit
99.6 % (100%)
GPU TDP ? TDP 350 W 100% 100%
Cinebench R15 OpenGL Ref. Match 64 Bit + NVIDIA GeForce RTX 3080 Ti
99.6 % (100%)
GPU TDP ? TDP 350 W 100% 100%
Geekbench 6.2 - Geekbench 6.2 GPU OpenCL
191605 Points (55%)
Geekbench 6.2 - Geekbench 6.2 GPU Vulkan
165153 Points (54%)
LuxMark v2.0 64Bit - LuxMark v2.0 Room GPU
min: 5727 avg: 5881 median: 5930.5 (27%) max: 5974 Samples/s
GPU TDP ? TDP 350 W 98% 100%
min: 5772 avg: 6138 median: 6158.5 (28%) max: 6464 Samples/s
GPU TDP ? TDP 350 W 95% 100%
min: 5112 avg: 5155 median: 5155 (23%) max: 5198 Samples/s
GPU TDP ? TDP 350 W 93% 100%
LuxMark v2.0 64Bit - LuxMark v2.0 Sala GPU
min: 14590 avg: 14908 median: 15017 (26%) max: 15088 Samples/s
GPU TDP ? TDP 350 W 98% 100%
min: 14871 avg: 15612 median: 15570 (27%) max: 16438 Samples/s
GPU TDP ? TDP 350 W 96% 100%
min: 12797 avg: 12889 median: 12888.5 (23%) max: 12980 Samples/s
GPU TDP ? TDP 350 W 93% 100%
ComputeMark v2.1 - ComputeMark v2.1 Result
min: 44948 avg: 47736 median: 48624.5 (53%) max: 49118 Points
GPU TDP ? TDP 350 W 97% 100%
min: 47377 avg: 48266 median: 48398 (52%) max: 48892 Points
GPU TDP ? TDP 350 W 98% 100%
min: 39924 avg: 40759 median: 40759 (44%) max: 41594 Points
GPU TDP ? TDP 350 W 95% 100%
Power Consumption - Furmark Stress Test Power Consumption - external Monitor *
min: 281 avg: 469.3 median: 494.5 (70%) max: 551 Watt
GPU TDP ? TDP 350 W 100% 140%
min: 427 avg: 464.3 median: 453 (64%) max: 513 Watt
GPU TDP ? TDP 350 W 100% 139%
min: 492 avg: 498.5 median: 498.5 (71%) max: 505 Watt
GPU TDP ? TDP 350 W 100% 137%
Power Consumption - The Witcher 3 Power Consumption - external Monitor *
min: 463.7 avg: 524 median: 524 (73%) max: 597 Watt
GPU TDP ? TDP 350 W 100% 101%
min: 490 avg: 506 median: 499 (70%) max: 528 Watt
GPU TDP ? TDP 350 W 100% 106%
min: 498.3 avg: 502 median: 501.7 (70%) max: 505 Watt
GPU TDP ? TDP 350 W 100% 104%
Power Consumption - Witcher 3 ultra Power Efficiency - external Monitor
min: 0.268 avg: 0.3 median: 0.3 (28%) max: 0.3954 fps per Watt
GPU TDP ? TDP 350 W 92% 100%
min: 0.3496 avg: 0.4 median: 0.4 (30%) max: 0.3735 fps per Watt
GPU TDP ? TDP 350 W 93% 100%
min: 0.291 avg: 0.3 median: 0.3 (25%) max: 0.301 fps per Watt
GPU TDP ? TDP 350 W 91% 100%
Clock Speed - GPU Clock Speed Furmark
min: 1434 avg: 1446 median: 1434 (57%) max: 1470 MHz
min: 1570 avg: 1621 median: 1620.5 (64%) max: 1671 MHz
Average Benchmarks NVIDIA GeForce RTX 3090 → 100% n=47 Average Benchmarks NVIDIA GeForce RTX 3080 Ti → 104% n=47 Average Benchmarks NVIDIA GeForce RTX 3080 → 77% n=47
- Range of benchmark values for this graphics card
- Average benchmark values for this graphics card
* Smaller numbers mean a higher performance
1 This benchmark is not used for the average calculation
Game Benchmarks The following benchmarks stem from our benchmarks of review laptops. The performance depends on the used graphics memory, clock rate, processor, system settings, drivers, and operating systems. So the results don't have to be representative for all laptops with this GPU. For detailed information on the benchmark results, click on the fps number.
100%
NVIDIA GeForce RTX 3090:
100.8 [X] Nvidia GeForce RTX 3090 FE Intel Core i9-14900K 3.2GHz
NVIDIA GeForce RTX 3090
min:
24.3 fps, P0.1:
49.9 fps, P1:
53.4 fps, max:
162.9 fps
fps
100%
NVIDIA GeForce RTX 3090:
100.8 [X] Nvidia GeForce RTX 3090 FE Intel Core i9-14900K 3.2GHz
NVIDIA GeForce RTX 3090
min:
25.1 fps, P0.1:
47.6 fps, P1:
52.8 fps, max:
168.3 fps
fps
100%
NVIDIA GeForce RTX 3090:
98.3 [X] Nvidia GeForce RTX 3090 FE Intel Core i9-14900K 3.2GHz
NVIDIA GeForce RTX 3090
min:
49.7 fps, P0.1:
51.5 fps, P1:
55.4 fps, max:
139.5 fps
fps
100%
NVIDIA GeForce RTX 3090:
65.5 [X] Nvidia GeForce RTX 3090 FE Intel Core i9-14900K 3.2GHz
NVIDIA GeForce RTX 3090
min:
28.9 fps, P0.1:
45.8 fps, P1:
52.7 fps, max:
79.7 fps
fps
100%
NVIDIA GeForce RTX 3090:
65.4 [X] Nvidia GeForce RTX 3090 FE Intel Core i9-14900K 3.2GHz
NVIDIA GeForce RTX 3090
min:
46.7 fps, P0.1:
48 fps, P1:
54.7 fps, max:
75.9 fps
fps
100%
NVIDIA GeForce RTX 3090:
61.4 [X] Nvidia GeForce RTX 3090 FE Intel Core i9-14900K 3.2GHz
NVIDIA GeForce RTX 3090
min:
33.5 fps, P0.1:
44.1 fps, P1:
50.8 fps, max:
72.7 fps
fps
100%
NVIDIA GeForce RTX 3090:
180.8 [X] Nvidia GeForce RTX 3090 FE Intel Core i9-14900K 3.2GHz
NVIDIA GeForce RTX 3090
min:
123.4 fps, P0.1:
137.4 fps, P1:
146.4 fps, max:
303 fps
fps
100%
NVIDIA GeForce RTX 3090:
169.4 [X] Nvidia GeForce RTX 3090 FE Intel Core i9-14900K 3.2GHz
NVIDIA GeForce RTX 3090
min:
80.4 fps, P0.1:
124.9 fps, P1:
136.2 fps, max:
268 fps
fps
100%
NVIDIA GeForce RTX 3090:
120.6 [X] Nvidia GeForce RTX 3090 FE Intel Core i9-14900K 3.2GHz
NVIDIA GeForce RTX 3090
min:
82.1 fps, P0.1:
89.6 fps, P1:
95.1 fps, max:
208 fps
fps
100%
NVIDIA GeForce RTX 3090:
117.1 [X] Nvidia GeForce RTX 3090 FE Intel Core i9-14900K 3.2GHz
NVIDIA GeForce RTX 3090
min:
90.6 fps, P0.1:
93.9 fps, P1:
99.5 fps, max:
189.5 fps
fps
100%
NVIDIA GeForce RTX 3090:
90.5 [X] Nvidia GeForce RTX 3090 FE Intel Core i9-14900K 3.2GHz
NVIDIA GeForce RTX 3090
min:
70.3 fps, P0.1:
72 fps, P1:
75.1 fps, max:
138.3 fps
fps
100%
NVIDIA GeForce RTX 3090:
57.6 [X] Nvidia GeForce RTX 3090 FE Intel Core i9-14900K 3.2GHz
NVIDIA GeForce RTX 3090
min:
45.9 fps, P0.1:
46.4 fps, P1:
49.8 fps, max:
81 fps
fps
100%
NVIDIA GeForce RTX 3090:
75.7 [X] Nvidia GeForce RTX 3090 FE Intel Core i9-14900K 3.2GHz
NVIDIA GeForce RTX 3090
min:
61.2 fps, P0.1:
61.7 fps, P1:
64.8 fps, max:
98.6 fps
fps
100%
NVIDIA GeForce RTX 3090:
75.1 [X] Nvidia GeForce RTX 3090 FE Intel Core i9-14900K 3.2GHz
NVIDIA GeForce RTX 3090
min:
59.8 fps, P0.1:
61.9 fps, P1:
64.9 fps, max:
95.6 fps
fps
100%
NVIDIA GeForce RTX 3090:
333 [X] Nvidia GeForce RTX 3090 FE Intel Core i9-14900K 3.2GHz
NVIDIA GeForce RTX 3090
min:
73.3 fps, P0.1:
172.1 fps, P1:
224 fps, max:
597 fps
fps
100%
NVIDIA GeForce RTX 3090:
311 [X] Nvidia GeForce RTX 3090 FE Intel Core i9-14900K 3.2GHz
NVIDIA GeForce RTX 3090
min:
18.2 fps, P0.1:
110.5 fps, P1:
214 fps, max:
671 fps
fps
100%
NVIDIA GeForce RTX 3090:
296 [X] Nvidia GeForce RTX 3090 FE Intel Core i9-14900K 3.2GHz
NVIDIA GeForce RTX 3090
min:
47.7 fps, P0.1:
133.6 fps, P1:
206 fps, max:
593 fps
fps
100%
NVIDIA GeForce RTX 3090:
209 [X] Nvidia GeForce RTX 3090 FE Intel Core i9-14900K 3.2GHz
NVIDIA GeForce RTX 3090
min:
48.7 fps, P0.1:
108.6 fps, P1:
156.3 fps, max:
415 fps
fps
100%
NVIDIA GeForce RTX 3090:
132.2 [X] Nvidia GeForce RTX 3090 FE Intel Core i9-14900K 3.2GHz
NVIDIA GeForce RTX 3090
min:
76 fps, P0.1:
84.2 fps, P1:
107 fps, max:
321 fps
fps
100%
NVIDIA GeForce RTX 3090:
43.3 [X] Nvidia GeForce RTX 3090 FE Intel Core i9-14900K 3.2GHz
NVIDIA GeForce RTX 3090
min:
30.8 fps, P0.1:
32.3 fps, P1:
36.9 fps, max:
64.8 fps
fps
100%
NVIDIA GeForce RTX 3090:
103.9 [X] Nvidia GeForce RTX 3090 FE Intel Core i9-14900K 3.2GHz
NVIDIA GeForce RTX 3090
min:
39.7 fps, P0.1:
40.8 fps, P1:
44 fps, max:
287 fps
fps
100%
NVIDIA GeForce RTX 3090:
120.2 [X] Nvidia GeForce RTX 3090 FE Intel Core i9-14900K 3.2GHz
NVIDIA GeForce RTX 3090
min:
47 fps, P0.1:
55.3 fps, P1:
61.4 fps, max:
284 fps
fps
100%
NVIDIA GeForce RTX 3090:
297 [X] Nvidia GeForce RTX 3090 FE Intel Core i9-14900K 3.2GHz
NVIDIA GeForce RTX 3090
min:
32.2 fps, P0.1:
191.2 fps, P1:
251 fps, max:
385 fps
fps
100%
NVIDIA GeForce RTX 3090:
294 [X] Nvidia GeForce RTX 3090 FE Intel Core i9-14900K 3.2GHz
NVIDIA GeForce RTX 3090
min:
30.9 fps, P0.1:
176.8 fps, P1:
244 fps, max:
453 fps
fps
100%
NVIDIA GeForce RTX 3090:
293 [X] Nvidia GeForce RTX 3090 FE Intel Core i9-14900K 3.2GHz
NVIDIA GeForce RTX 3090
min:
28.4 fps, P0.1:
176.9 fps, P1:
245 fps, max:
507 fps
fps
100%
NVIDIA GeForce RTX 3090:
282 [X] Nvidia GeForce RTX 3090 FE Intel Core i9-14900K 3.2GHz
NVIDIA GeForce RTX 3090
min:
31.4 fps, P0.1:
179.1 fps, P1:
195.1 fps, max:
621 fps
fps
100%
NVIDIA GeForce RTX 3090:
195.1 [X] Nvidia GeForce RTX 3090 FE Intel Core i9-14900K 3.2GHz
NVIDIA GeForce RTX 3090
min:
31.8 fps, P0.1:
133.2 fps, P1:
139.1 fps, max:
357 fps
fps
100%
NVIDIA GeForce RTX 3090:
101.7 [X] Nvidia GeForce RTX 3090 FE Intel Core i9-14900K 3.2GHz
NVIDIA GeForce RTX 3090
min:
31 fps, P0.1:
76.4 fps, P1:
82.3 fps, max:
289 fps
fps
100%
NVIDIA GeForce RTX 3090:
171 [X] Nvidia GeForce RTX 3090 FE Intel Core i9-14900K 3.2GHz
NVIDIA GeForce RTX 3090
fps
100%
NVIDIA GeForce RTX 3090:
153 [X] Nvidia GeForce RTX 3090 FE Intel Core i9-14900K 3.2GHz
NVIDIA GeForce RTX 3090
fps
100%
NVIDIA GeForce RTX 3090:
130 [X] Nvidia GeForce RTX 3090 FE Intel Core i9-14900K 3.2GHz
NVIDIA GeForce RTX 3090
fps
100%
NVIDIA GeForce RTX 3090:
100 [X] Nvidia GeForce RTX 3090 FE Intel Core i9-14900K 3.2GHz
NVIDIA GeForce RTX 3090
fps
100%
NVIDIA GeForce RTX 3090:
85 [X] Nvidia GeForce RTX 3090 FE Intel Core i9-14900K 3.2GHz
NVIDIA GeForce RTX 3090
fps
100%
NVIDIA GeForce RTX 3090:
58 [X] Nvidia GeForce RTX 3090 FE Intel Core i9-14900K 3.2GHz
NVIDIA GeForce RTX 3090
fps
100%
NVIDIA GeForce RTX 3090:
79 [X] Nvidia GeForce RTX 3090 FE Intel Core i9-14900K 3.2GHz
NVIDIA GeForce RTX 3090
fps
100%
NVIDIA GeForce RTX 3090:
74 [X] Nvidia GeForce RTX 3090 FE Intel Core i9-14900K 3.2GHz
NVIDIA GeForce RTX 3090
fps
100%
NVIDIA GeForce RTX 3090:
225 [X] Nvidia GeForce RTX 3090 FE Intel Core i9-14900K 3.2GHz
NVIDIA GeForce RTX 3090
min:
70.6 fps, P0.1:
160.6 fps, P1:
181.9 fps, max:
272 fps
fps
100%
NVIDIA GeForce RTX 3090:
189.6 [X] Nvidia GeForce RTX 3090 FE Intel Core i9-14900K 3.2GHz
NVIDIA GeForce RTX 3090
min:
55.1 fps, P0.1:
141.9 fps, P1:
158.5 fps, max:
253 fps
fps
100%
NVIDIA GeForce RTX 3090:
169.2 [X] Nvidia GeForce RTX 3090 FE Intel Core i9-14900K 3.2GHz
NVIDIA GeForce RTX 3090
min:
56.2 fps, P0.1:
143.4 fps, P1:
151.9 fps, max:
230 fps
fps
100%
NVIDIA GeForce RTX 3090:
167.4 [X] Nvidia GeForce RTX 3090 FE Intel Core i9-14900K 3.2GHz
NVIDIA GeForce RTX 3090
min:
45 fps, P0.1:
107.3 fps, P1:
147.9 fps, max:
238 fps
fps
100%
NVIDIA GeForce RTX 3090:
129.7 [X] Nvidia GeForce RTX 3090 FE Intel Core i9-14900K 3.2GHz
NVIDIA GeForce RTX 3090
min:
58.2 fps, P0.1:
95.5 fps, P1:
118.5 fps, max:
224 fps
fps
100%
NVIDIA GeForce RTX 3090:
75.7 [X] Nvidia GeForce RTX 3090 FE Intel Core i9-14900K 3.2GHz
NVIDIA GeForce RTX 3090
min:
68.2 fps, P0.1:
68.4 fps, P1:
69.1 fps, max:
87.8 fps
fps
100%
NVIDIA GeForce RTX 3090:
128.5 [X] Nvidia GeForce RTX 3090 FE Intel Core i9-14900K 3.2GHz
NVIDIA GeForce RTX 3090
min:
82.2 fps, P0.1:
89.5 fps, P1:
94.9 fps, max:
269 fps
fps
100%
NVIDIA GeForce RTX 3090:
113.8 [X] Nvidia GeForce RTX 3090 FE Intel Core i9-14900K 3.2GHz
NVIDIA GeForce RTX 3090
min:
77.4 fps, P0.1:
81.3 fps, P1:
85.4 fps, max:
215 fps
fps
100%
NVIDIA GeForce RTX 3090:
99.4 [X] Nvidia GeForce RTX 3090 FE Intel Core i9-14900K 3.2GHz
NVIDIA GeForce RTX 3090
min:
59.4 fps, P0.1:
72 fps, P1:
76 fps, max:
185.5 fps
fps
100%
NVIDIA GeForce RTX 3090:
85.5 [X] Nvidia GeForce RTX 3090 FE Intel Core i9-14900K 3.2GHz
NVIDIA GeForce RTX 3090
min:
61.9 fps, P0.1:
62.9 fps, P1:
65.9 fps, max:
155.9 fps
fps
100%
NVIDIA GeForce RTX 3090:
68.5 [X] Nvidia GeForce RTX 3090 FE Intel Core i9-14900K 3.2GHz
NVIDIA GeForce RTX 3090
min:
47.2 fps, P0.1:
53.5 fps, P1:
56 fps, max:
100.1 fps
fps
100%
NVIDIA GeForce RTX 3090:
43.8 [X] Nvidia GeForce RTX 3090 FE Intel Core i9-14900K 3.2GHz
NVIDIA GeForce RTX 3090
min:
34.6 fps, P0.1:
36.1 fps, P1:
37.4 fps, max:
60.4 fps
fps
100%
NVIDIA GeForce RTX 3090:
61.7 [X] Nvidia GeForce RTX 3090 FE Intel Core i9-14900K 3.2GHz
NVIDIA GeForce RTX 3090
min:
44.6 fps, P0.1:
48 fps, P1:
51.8 fps, max:
92.5 fps
fps
100%
NVIDIA GeForce RTX 3090:
52.8 [X] Nvidia GeForce RTX 3090 FE Intel Core i9-14900K 3.2GHz
NVIDIA GeForce RTX 3090
min:
42.5 fps, P0.1:
43.1 fps, P1:
44.1 fps, max:
75 fps
fps
100%
NVIDIA GeForce RTX 3090:
239 [X] Nvidia GeForce RTX 3090 FE Intel Core i9-14900K 3.2GHz
NVIDIA GeForce RTX 3090
min:
76.7 fps, P0.1:
141.7 fps, P1:
187.2 fps, max:
444 fps
fps
100%
NVIDIA GeForce RTX 3090:
233 [X] Nvidia GeForce RTX 3090 FE Intel Core i9-14900K 3.2GHz
NVIDIA GeForce RTX 3090
min:
33 fps, P0.1:
114 fps, P1:
182.6 fps, max:
395 fps
fps
100%
NVIDIA GeForce RTX 3090:
208 [X] Nvidia GeForce RTX 3090 FE Intel Core i9-14900K 3.2GHz
NVIDIA GeForce RTX 3090
min:
31 fps, P0.1:
97 fps, P1:
147.2 fps, max:
386 fps
fps
100%
NVIDIA GeForce RTX 3090:
157.3 [X] Nvidia GeForce RTX 3090 FE Intel Core i9-14900K 3.2GHz
NVIDIA GeForce RTX 3090
min:
34.5 fps, P0.1:
97.7 fps, P1:
125.8 fps, max:
262 fps
fps
100%
NVIDIA GeForce RTX 3090:
120.4 [X] Nvidia GeForce RTX 3090 FE Intel Core i9-14900K 3.2GHz
NVIDIA GeForce RTX 3090
min:
46 fps, P0.1:
76.2 fps, P1:
103.7 fps, max:
207 fps
fps
100%
NVIDIA GeForce RTX 3090:
71.5 [X] Nvidia GeForce RTX 3090 FE Intel Core i9-14900K 3.2GHz
NVIDIA GeForce RTX 3090
min:
27 fps, P0.1:
50 fps, P1:
63.9 fps, max:
189.6 fps
fps
100%
NVIDIA GeForce RTX 3090:
96.4 [X] Nvidia GeForce RTX 3090 FE Intel Core i9-14900K 3.2GHz
NVIDIA GeForce RTX 3090
min:
9.5 fps, P0.1:
59.8 fps, P1:
83.1 fps, max:
224 fps
fps
100%
NVIDIA GeForce RTX 3090:
348 [X] Nvidia GeForce RTX 3090 FE Intel Core i9-14900K 3.2GHz
NVIDIA GeForce RTX 3090
min:
20.8 fps, P0.1:
238 fps, P1:
278 fps, max:
1092 fps
fps
100%
NVIDIA GeForce RTX 3090:
359 [X] Nvidia GeForce RTX 3090 FE Intel Core i9-14900K 3.2GHz
NVIDIA GeForce RTX 3090
min:
21 fps, P0.1:
264 fps, P1:
328 fps, max:
907 fps
fps
100%
NVIDIA GeForce RTX 3090:
359 [X] Nvidia GeForce RTX 3090 FE Intel Core i9-14900K 3.2GHz
NVIDIA GeForce RTX 3090
min:
22.8 fps, P0.1:
171.7 fps, P1:
325 fps, max:
1500 fps
fps
100%
NVIDIA GeForce RTX 3090:
359 [X] Nvidia GeForce RTX 3090 FE Intel Core i9-14900K 3.2GHz
NVIDIA GeForce RTX 3090
min:
25.5 fps, P0.1:
257 fps, P1:
330 fps, max:
1033 fps
fps
100%
NVIDIA GeForce RTX 3090:
358 [X] Nvidia GeForce RTX 3090 FE Intel Core i9-14900K 3.2GHz
NVIDIA GeForce RTX 3090
min:
24.5 fps, P0.1:
169.1 fps, P1:
326 fps, max:
1438 fps
fps
100%
NVIDIA GeForce RTX 3090:
376 [X] Nvidia GeForce RTX 3090 FE AMD Ryzen 9 7950X 4.5GHz
NVIDIA GeForce RTX 3090
min:
21.1 fps, P0.1:
189 fps, P1:
201 fps, max:
622 fps
fps
100%
NVIDIA GeForce RTX 3090:
338 [X] Nvidia GeForce RTX 3090 FE AMD Ryzen 9 7950X 4.5GHz
NVIDIA GeForce RTX 3090
min:
122.7 fps, P0.1:
154.4 fps, P1:
189.3 fps, max:
565 fps
fps
100%
NVIDIA GeForce RTX 3090:
306 [X] Nvidia GeForce RTX 3090 FE AMD Ryzen 9 7950X 4.5GHz
NVIDIA GeForce RTX 3090
min:
63.5 fps, P0.1:
140.5 fps, P1:
172.7 fps, max:
503 fps
fps
100%
NVIDIA GeForce RTX 3090:
246 [X] Nvidia GeForce RTX 3090 FE AMD Ryzen 9 7950X 4.5GHz
NVIDIA GeForce RTX 3090
min:
97.2 fps, P0.1:
126.2 fps, P1:
140.4 fps, max:
457 fps
fps
100%
NVIDIA GeForce RTX 3090:
160.6 [X] Nvidia GeForce RTX 3090 FE AMD Ryzen 9 7950X 4.5GHz
NVIDIA GeForce RTX 3090
min:
86.5 fps, P0.1:
91.8 fps, P1:
98.6 fps, max:
415 fps
fps
100%
NVIDIA GeForce RTX 3090:
76.8 [X] Nvidia GeForce RTX 3090 FE AMD Ryzen 9 7950X 4.5GHz
NVIDIA GeForce RTX 3090
min:
37.8 fps, P0.1:
39 fps, P1:
40.8 fps, max:
361 fps
fps
100%
NVIDIA GeForce RTX 3090:
143.3 [X] Nvidia GeForce RTX 3090 FE AMD Ryzen 9 7950X 4.5GHz
NVIDIA GeForce RTX 3090
min:
13.1 fps, P0.1:
14.3 fps, P1:
40.2 fps, max:
359 fps
fps
100%
NVIDIA GeForce RTX 3090:
367 [X] Nvidia GeForce RTX 3090 FE AMD Ryzen 9 7950X 4.5GHz
NVIDIA GeForce RTX 3090
min:
121.8 fps, P0.1:
222 fps, P1:
274 fps, max:
564 fps
400 [X] Nvidia GeForce RTX 3090 FE Intel Core i9-14900K 3.2GHz
NVIDIA GeForce RTX 3090
min:
90.1 fps, P0.1:
224 fps, P1:
282 fps, max:
642 fps
~ 384 fps
100%
NVIDIA GeForce RTX 3090:
310 [X] Nvidia GeForce RTX 3090 FE AMD Ryzen 9 7950X 4.5GHz
NVIDIA GeForce RTX 3090
min:
121.8 fps, P0.1:
199.9 fps, P1:
229 fps, max:
562 fps
351 [X] Nvidia GeForce RTX 3090 FE Intel Core i9-14900K 3.2GHz
NVIDIA GeForce RTX 3090
min:
130 fps, P0.1:
209 fps, P1:
250 fps, max:
579 fps
~ 331 fps
100%
NVIDIA GeForce RTX 3090:
280 [X] Nvidia GeForce RTX 3090 FE AMD Ryzen 9 7950X 4.5GHz
NVIDIA GeForce RTX 3090
min:
58.3 fps, P0.1:
167.9 fps, P1:
200 fps, max:
496 fps
313 [X] Nvidia GeForce RTX 3090 FE Intel Core i9-14900K 3.2GHz
NVIDIA GeForce RTX 3090
min:
143.7 fps, P0.1:
199.9 fps, P1:
232 fps, max:
492 fps
~ 297 fps
100%
NVIDIA GeForce RTX 3090:
231 [X] Nvidia GeForce RTX 3090 FE AMD Ryzen 9 7950X 4.5GHz
NVIDIA GeForce RTX 3090
min:
114.2 fps, P0.1:
135.8 fps, P1:
155.9 fps, max:
449 fps
243 [X] Nvidia GeForce RTX 3090 FE Intel Core i9-14900K 3.2GHz
NVIDIA GeForce RTX 3090
min:
122.4 fps, P0.1:
152.2 fps, P1:
177.9 fps, max:
505 fps
~ 237 fps
100%
NVIDIA GeForce RTX 3090:
152.9 [X] Nvidia GeForce RTX 3090 FE AMD Ryzen 9 7950X 4.5GHz
NVIDIA GeForce RTX 3090
min:
72.1 fps, P0.1:
99.7 fps, P1:
109.6 fps, max:
384 fps
157.3 [X] Nvidia GeForce RTX 3090 FE Intel Core i9-14900K 3.2GHz
NVIDIA GeForce RTX 3090
min:
65.9 fps, P0.1:
110.6 fps, P1:
120.8 fps, max:
299 fps
~ 155 fps
100%
NVIDIA GeForce RTX 3090:
76 [X] Nvidia GeForce RTX 3090 FE AMD Ryzen 9 7950X 4.5GHz
NVIDIA GeForce RTX 3090
min:
40.8 fps, P0.1:
53.2 fps, P1:
57 fps, max:
237 fps
78.8 [X] Nvidia GeForce RTX 3090 FE Intel Core i9-14900K 3.2GHz
NVIDIA GeForce RTX 3090
min:
54 fps, P0.1:
58.9 fps, P1:
61.7 fps, max:
120.7 fps
~ 77 fps
100%
NVIDIA GeForce RTX 3090:
137 [X] Nvidia GeForce RTX 3090 FE Intel Core i9-14900K 3.2GHz
NVIDIA GeForce RTX 3090
min:
116 fps, max:
167 fps
141 [X] Nvidia GeForce RTX 3090 FE AMD Ryzen 9 7950X 4.5GHz
NVIDIA GeForce RTX 3090
min:
118 fps, max:
179 fps
~ 139 fps
100%
NVIDIA GeForce RTX 3090:
128 [X] Nvidia GeForce RTX 3090 FE Intel Core i9-14900K 3.2GHz
NVIDIA GeForce RTX 3090
min:
106 fps, max:
162 fps
130 [X] Nvidia GeForce RTX 3090 FE AMD Ryzen 9 7950X 4.5GHz
NVIDIA GeForce RTX 3090
min:
105 fps, max:
166 fps
~ 129 fps
100%
NVIDIA GeForce RTX 3090:
114 [X] Nvidia GeForce RTX 3090 FE Intel Core i9-14900K 3.2GHz
NVIDIA GeForce RTX 3090
min:
92 fps, max:
143 fps
115 [X] Nvidia GeForce RTX 3090 FE AMD Ryzen 9 7950X 4.5GHz
NVIDIA GeForce RTX 3090
min:
90 fps, max:
148 fps
~ 115 fps
100%
NVIDIA GeForce RTX 3090:
90 [X] Nvidia GeForce RTX 3090 FE AMD Ryzen 9 7950X 4.5GHz
NVIDIA GeForce RTX 3090
min:
70 fps, max:
118 fps
90 [X] Nvidia GeForce RTX 3090 FE Intel Core i9-14900K 3.2GHz
NVIDIA GeForce RTX 3090
min:
72 fps, max:
116 fps
~ 90 fps
100%
NVIDIA GeForce RTX 3090:
63 [X] Nvidia GeForce RTX 3090 FE AMD Ryzen 9 7950X 4.5GHz
NVIDIA GeForce RTX 3090
min:
51 fps, max:
84 fps
63 [X] Nvidia GeForce RTX 3090 FE Intel Core i9-14900K 3.2GHz
NVIDIA GeForce RTX 3090
min:
52 fps, max:
82 fps
~ 63 fps
100%
NVIDIA GeForce RTX 3090:
34 [X] Nvidia GeForce RTX 3090 FE AMD Ryzen 9 7950X 4.5GHz
NVIDIA GeForce RTX 3090
min:
28 fps, max:
44 fps
34 [X] Nvidia GeForce RTX 3090 FE Intel Core i9-14900K 3.2GHz
NVIDIA GeForce RTX 3090
min:
29 fps, max:
42 fps
~ 34 fps
100%
NVIDIA GeForce RTX 3090:
57 [X] Nvidia GeForce RTX 3090 FE AMD Ryzen 9 7950X 4.5GHz
NVIDIA GeForce RTX 3090
min:
46 fps, max:
69 fps
57 [X] Nvidia GeForce RTX 3090 FE Intel Core i9-14900K 3.2GHz
NVIDIA GeForce RTX 3090
min:
48 fps, max:
73 fps
~ 57 fps
100%
NVIDIA GeForce RTX 3090:
238 [X] Nvidia GeForce RTX 3090 FE AMD Ryzen 9 7950X 4.5GHz
NVIDIA GeForce RTX 3090
fps
100%
NVIDIA GeForce RTX 3090:
211 [X] Nvidia GeForce RTX 3090 FE AMD Ryzen 9 7950X 4.5GHz
NVIDIA GeForce RTX 3090
fps
100%
NVIDIA GeForce RTX 3090:
169 [X] Nvidia GeForce RTX 3090 FE AMD Ryzen 9 7950X 4.5GHz
NVIDIA GeForce RTX 3090
fps
100%
NVIDIA GeForce RTX 3090:
159 [X] Nvidia GeForce RTX 3090 FE AMD Ryzen 9 7950X 4.5GHz
NVIDIA GeForce RTX 3090
fps
100%
NVIDIA GeForce RTX 3090:
118 [X] Nvidia GeForce RTX 3090 FE AMD Ryzen 9 7950X 4.5GHz
NVIDIA GeForce RTX 3090
fps
100%
NVIDIA GeForce RTX 3090:
77 [X] Nvidia GeForce RTX 3090 FE AMD Ryzen 9 7950X 4.5GHz
NVIDIA GeForce RTX 3090
fps
100%
NVIDIA GeForce RTX 3090:
231 [X] Nvidia GeForce RTX 3090 FE AMD Ryzen 9 7950X 4.5GHz
NVIDIA GeForce RTX 3090
min:
55.8 fps, P0.1:
136.1 fps, P1:
167.9 fps, max:
333 fps
238 [X] Nvidia GeForce RTX 3090 FE Intel Core i9-14900K 3.2GHz
NVIDIA GeForce RTX 3090
min:
16 fps, P0.1:
117.4 fps, P1:
158.3 fps, max:
433 fps
~ 235 fps
100%
NVIDIA GeForce RTX 3090:
161.9 [X] Nvidia GeForce RTX 3090 FE AMD Ryzen 9 7950X 4.5GHz
NVIDIA GeForce RTX 3090
min:
11.8 fps, P0.1:
31.2 fps, P1:
129.6 fps, max:
227 fps
176.6 [X] Nvidia GeForce RTX 3090 FE Intel Core i9-14900K 3.2GHz
NVIDIA GeForce RTX 3090
min:
26.3 fps, P0.1:
94.3 fps, P1:
140.5 fps, max:
267 fps
~ 169 fps
100%
NVIDIA GeForce RTX 3090:
152.8 [X] Nvidia GeForce RTX 3090 FE AMD Ryzen 9 7950X 4.5GHz
NVIDIA GeForce RTX 3090
min:
22.1 fps, P0.1:
100.9 fps, P1:
121.4 fps, max:
210 fps
163.6 [X] Nvidia GeForce RTX 3090 FE Intel Core i9-14900K 3.2GHz
NVIDIA GeForce RTX 3090
min:
23.8 fps, P0.1:
89.6 fps, P1:
131.5 fps, max:
243 fps
~ 158 fps
100%
NVIDIA GeForce RTX 3090:
146.2 [X] Nvidia GeForce RTX 3090 FE AMD Ryzen 9 7950X 4.5GHz
NVIDIA GeForce RTX 3090
min:
11.6 fps, P0.1:
92.7 fps, P1:
116.6 fps, max:
217 fps
149.3 [X] Nvidia GeForce RTX 3090 FE Intel Core i9-14900K 3.2GHz
NVIDIA GeForce RTX 3090
min:
21.5 fps, P0.1:
82.9 fps, P1:
121.5 fps, max:
234 fps
~ 148 fps
100%
NVIDIA GeForce RTX 3090:
114.1 [X] Nvidia GeForce RTX 3090 FE Intel Core i9-14900K 3.2GHz
NVIDIA GeForce RTX 3090
min:
70 fps, P0.1:
78.2 fps, P1:
96.4 fps, max:
188.6 fps
115.5 [X] Nvidia GeForce RTX 3090 FE AMD Ryzen 9 7950X 4.5GHz
NVIDIA GeForce RTX 3090
min:
19.5 fps, P0.1:
76.2 fps, P1:
95.9 fps, max:
186.4 fps
~ 115 fps
100%
NVIDIA GeForce RTX 3090:
67.4 [X] Nvidia GeForce RTX 3090 FE Intel Core i9-14900K 3.2GHz
NVIDIA GeForce RTX 3090
min:
47.8 fps, P0.1:
54.9 fps, P1:
59.1 fps, max:
106.9 fps
67.9 [X] Nvidia GeForce RTX 3090 FE AMD Ryzen 9 7950X 4.5GHz
NVIDIA GeForce RTX 3090
min:
48 fps, P0.1:
54.2 fps, P1:
59.7 fps, max:
105.9 fps
~ 68 fps
100%
NVIDIA GeForce RTX 3090:
96.4 [X] Nvidia GeForce RTX 3090 FE Intel Core i9-14900K 3.2GHz
NVIDIA GeForce RTX 3090
min:
46.2 fps, P0.1:
59.4 fps, P1:
82.6 fps, max:
191.1 fps
97.4 [X] Nvidia GeForce RTX 3090 FE AMD Ryzen 9 7950X 4.5GHz
NVIDIA GeForce RTX 3090
min:
41.8 fps, P0.1:
68.9 fps, P1:
83.6 fps, max:
168.2 fps
~ 97 fps
100%
NVIDIA GeForce RTX 3090:
124.5 [X] Nvidia GeForce RTX 3090 FE AMD Ryzen 9 7950X 4.5GHz
NVIDIA GeForce RTX 3090
min:
23.3 fps, P0.1:
67.5 fps, P1:
85.1 fps, max:
176.7 fps
127.3 [X] Nvidia GeForce RTX 3090 FE Intel Core i9-14900K 3.2GHz
NVIDIA GeForce RTX 3090
min:
68.7 fps, P0.1:
76.6 fps, P1:
93.6 fps, max:
186.8 fps
~ 126 fps
100%
NVIDIA GeForce RTX 3090:
116.6 [X] Nvidia GeForce RTX 3090 FE AMD Ryzen 9 7950X 4.5GHz
NVIDIA GeForce RTX 3090
min:
74.8 fps, P0.1:
75.7 fps, P1:
88.9 fps, max:
166.3 fps
120.2 [X] Nvidia GeForce RTX 3090 FE Intel Core i9-14900K 3.2GHz
NVIDIA GeForce RTX 3090
min:
75.6 fps, P0.1:
80.2 fps, P1:
96.2 fps, max:
181.3 fps
~ 118 fps
100%
NVIDIA GeForce RTX 3090:
109.5 [X] Nvidia GeForce RTX 3090 FE AMD Ryzen 9 7950X 4.5GHz
NVIDIA GeForce RTX 3090
min:
65 fps, P0.1:
68.4 fps, P1:
86.9 fps, max:
164.7 fps
113.4 [X] Nvidia GeForce RTX 3090 FE Intel Core i9-14900K 3.2GHz
NVIDIA GeForce RTX 3090
min:
30 fps, P0.1:
75.4 fps, P1:
93 fps, max:
180.8 fps
~ 111 fps
100%
NVIDIA GeForce RTX 3090:
75.3 [X] Nvidia GeForce RTX 3090 FE AMD Ryzen 9 7950X 4.5GHz
NVIDIA GeForce RTX 3090
min:
48.4 fps, P0.1:
51.4 fps, P1:
60.8 fps, max:
130.7 fps
75.8 [X] Nvidia GeForce RTX 3090 FE Intel Core i9-14900K 3.2GHz
NVIDIA GeForce RTX 3090
min:
51.1 fps, P0.1:
55.8 fps, P1:
63.7 fps, max:
112.3 fps
~ 76 fps
100%
NVIDIA GeForce RTX 3090:
39.8 [X] Nvidia GeForce RTX 3090 FE AMD Ryzen 9 7950X 4.5GHz
NVIDIA GeForce RTX 3090
min:
30.4 fps, P0.1:
32.3 fps, P1:
34.4 fps, max:
51.8 fps
41.2 [X] Nvidia GeForce RTX 3090 FE Intel Core i9-14900K 3.2GHz
NVIDIA GeForce RTX 3090
min:
31.2 fps, P0.1:
31.6 fps, P1:
35.6 fps, max:
54.1 fps
~ 41 fps
100%
NVIDIA GeForce RTX 3090:
148.9 [X] Nvidia GeForce RTX 3090 FE AMD Ryzen 9 7950X 4.5GHz
NVIDIA GeForce RTX 3090
min:
46.1 fps, P0.1:
74 fps, P1:
107.3 fps, max:
216 fps
fps
100%
NVIDIA GeForce RTX 3090:
124.3 [X] Nvidia GeForce RTX 3090 FE AMD Ryzen 9 7950X 4.5GHz
NVIDIA GeForce RTX 3090
min:
48.6 fps, P0.1:
80.2 fps, P1:
95.1 fps, max:
189.7 fps
fps
100%
NVIDIA GeForce RTX 3090:
96.6 [X] Nvidia GeForce RTX 3090 FE AMD Ryzen 9 7950X 4.5GHz
NVIDIA GeForce RTX 3090
min:
55.6 fps, P0.1:
63.5 fps, P1:
76.8 fps, max:
173.3 fps
fps
100%
NVIDIA GeForce RTX 3090:
66.8 [X] Nvidia GeForce RTX 3090 FE AMD Ryzen 9 7950X 4.5GHz
NVIDIA GeForce RTX 3090
min:
44.2 fps, P0.1:
46.3 fps, P1:
55.5 fps, max:
130.6 fps
fps
100%
NVIDIA GeForce RTX 3090:
51.4 [X] Nvidia GeForce RTX 3090 FE AMD Ryzen 9 7950X 4.5GHz
NVIDIA GeForce RTX 3090
min:
34.4 fps, P0.1:
37.4 fps, P1:
41.7 fps, max:
130.4 fps
fps
100%
NVIDIA GeForce RTX 3090:
28.4 [X] Nvidia GeForce RTX 3090 FE AMD Ryzen 9 7950X 4.5GHz
NVIDIA GeForce RTX 3090
min:
23 fps, P0.1:
23.3 fps, P1:
24.8 fps, max:
44.9 fps
fps
100%
NVIDIA GeForce RTX 3090:
51.5 [X] Nvidia GeForce RTX 3090 FE AMD Ryzen 9 7950X 4.5GHz
NVIDIA GeForce RTX 3090
min:
31.6 fps, P0.1:
39.2 fps, P1:
42.8 fps, max:
129.3 fps
fps
100%
NVIDIA GeForce RTX 3090:
558.3 [X] Nvidia GeForce RTX 3090 FE AMD Ryzen 9 7950X 4.5GHz
NVIDIA GeForce RTX 3090
fps
100%
NVIDIA GeForce RTX 3090:
343.4 [X] Nvidia GeForce RTX 3090 FE AMD Ryzen 9 7950X 4.5GHz
NVIDIA GeForce RTX 3090
fps
100%
NVIDIA GeForce RTX 3090:
225.2 [X] Nvidia GeForce RTX 3090 FE AMD Ryzen 9 7950X 4.5GHz
NVIDIA GeForce RTX 3090
fps
100%
NVIDIA GeForce RTX 3090:
182.6 [X] Nvidia GeForce RTX 3090 FE AMD Ryzen 9 7950X 4.5GHz
NVIDIA GeForce RTX 3090
fps
100%
NVIDIA GeForce RTX 3090:
156 [X] Nvidia GeForce RTX 3090 FE AMD Ryzen 9 7950X 4.5GHz
NVIDIA GeForce RTX 3090
fps
100%
NVIDIA GeForce RTX 3090:
86.8 [X] Nvidia GeForce RTX 3090 FE AMD Ryzen 9 7950X 4.5GHz
NVIDIA GeForce RTX 3090
fps
100%
NVIDIA GeForce RTX 3090:
165 [X] Nvidia GeForce RTX 3090 FE AMD Ryzen 9 7950X 4.5GHz
NVIDIA GeForce RTX 3090
min:
96 fps, P0.1:
110 fps, P1:
141 fps, max:
220 fps
185 [X] Nvidia GeForce RTX 3090 FE Intel Core i9-14900K 3.2GHz
NVIDIA GeForce RTX 3090
min:
101 fps, P0.1:
124 fps, P1:
161 fps, max:
233 fps
~ 175 fps
100%
NVIDIA GeForce RTX 3090:
157 [X] Nvidia GeForce RTX 3090 FE AMD Ryzen 9 7950X 4.5GHz
NVIDIA GeForce RTX 3090
min:
84 fps, P0.1:
96 fps, P1:
123 fps, max:
242 fps
174 [X] Nvidia GeForce RTX 3090 FE Intel Core i9-14900K 3.2GHz
NVIDIA GeForce RTX 3090
min:
90 fps, P0.1:
113 fps, P1:
142 fps, max:
268 fps
~ 166 fps
100%
NVIDIA GeForce RTX 3090:
151 [X] Nvidia GeForce RTX 3090 FE AMD Ryzen 9 7950X 4.5GHz
NVIDIA GeForce RTX 3090
min:
37 fps, P0.1:
89 fps, P1:
119 fps, max:
246 fps
167 [X] Nvidia GeForce RTX 3090 FE Intel Core i9-14900K 3.2GHz
NVIDIA GeForce RTX 3090
min:
94 fps, P0.1:
109 fps, P1:
135 fps, max:
260 fps
~ 159 fps
100%
NVIDIA GeForce RTX 3090:
126 [X] Nvidia GeForce RTX 3090 FE AMD Ryzen 9 7950X 4.5GHz
NVIDIA GeForce RTX 3090
min:
41 fps, P0.1:
77 fps, P1:
97 fps, max:
171 fps
138 [X] Nvidia GeForce RTX 3090 FE Intel Core i9-14900K 3.2GHz
NVIDIA GeForce RTX 3090
min:
80 fps, P0.1:
92 fps, P1:
109 fps, max:
190 fps
~ 132 fps
100%
NVIDIA GeForce RTX 3090:
103 [X] Nvidia GeForce RTX 3090 FE AMD Ryzen 9 7950X 4.5GHz
NVIDIA GeForce RTX 3090
min:
58 fps, P0.1:
69 fps, P1:
81 fps, max:
142 fps
111 [X] Nvidia GeForce RTX 3090 FE Intel Core i9-14900K 3.2GHz
NVIDIA GeForce RTX 3090
min:
72 fps, P0.1:
76 fps, P1:
88 fps, max:
144 fps
~ 107 fps
100%
NVIDIA GeForce RTX 3090:
71 [X] Nvidia GeForce RTX 3090 FE AMD Ryzen 9 7950X 4.5GHz
NVIDIA GeForce RTX 3090
min:
45 fps, P0.1:
52 fps, P1:
58 fps, max:
89 fps
73 [X] Nvidia GeForce RTX 3090 FE Intel Core i9-14900K 3.2GHz
NVIDIA GeForce RTX 3090
min:
50 fps, P0.1:
55 fps, P1:
61 fps, max:
89 fps
~ 72 fps
100%
NVIDIA GeForce RTX 3090:
91 [X] Nvidia GeForce RTX 3090 FE AMD Ryzen 9 7950X 4.5GHz
NVIDIA GeForce RTX 3090
min:
57 fps, P0.1:
64 fps, P1:
72 fps, max:
118 fps
95 [X] Nvidia GeForce RTX 3090 FE Intel Core i9-14900K 3.2GHz
NVIDIA GeForce RTX 3090
min:
64 fps, P0.1:
68 fps, P1:
77 fps, max:
129 fps
~ 93 fps
100%
NVIDIA GeForce RTX 3090:
374 [X] Nvidia GeForce RTX 3090 FE AMD Ryzen 9 7950X 4.5GHz
NVIDIA GeForce RTX 3090
min:
88.1 fps, P0.1:
156.9 fps, P1:
267 fps, max:
524 fps
fps
100%
NVIDIA GeForce RTX 3090:
318 [X] Nvidia GeForce RTX 3090 FE AMD Ryzen 9 7950X 4.5GHz
NVIDIA GeForce RTX 3090
min:
82.8 fps, P0.1:
214 fps, P1:
242 fps, max:
414 fps
fps
100%
NVIDIA GeForce RTX 3090:
264 [X] Nvidia GeForce RTX 3090 FE AMD Ryzen 9 7950X 4.5GHz
NVIDIA GeForce RTX 3090
min:
51.6 fps, P0.1:
101.5 fps, P1:
195 fps, max:
360 fps
fps
100%
NVIDIA GeForce RTX 3090:
264 [X] Nvidia GeForce RTX 3090 FE AMD Ryzen 9 7950X 4.5GHz
NVIDIA GeForce RTX 3090
min:
65.3 fps, P0.1:
113.8 fps, P1:
195.3 fps, max:
375 fps
fps
100%
NVIDIA GeForce RTX 3090:
248 [X] Nvidia GeForce RTX 3090 FE AMD Ryzen 9 7950X 4.5GHz
NVIDIA GeForce RTX 3090
min:
61 fps, P0.1:
113.1 fps, P1:
182 fps, max:
316 fps
fps
100%
NVIDIA GeForce RTX 3090:
157.7 [X] Nvidia GeForce RTX 3090 FE AMD Ryzen 9 7950X 4.5GHz
NVIDIA GeForce RTX 3090
min:
42.7 fps, P0.1:
84.4 fps, P1:
123.9 fps, max:
288 fps
fps
100%
NVIDIA GeForce RTX 3090:
342 [X] Nvidia GeForce RTX 3090 FE AMD Ryzen 9 7950X 4.5GHz
NVIDIA GeForce RTX 3090
min:
61.3 fps, P0.1:
137.4 fps, P1:
158.8 fps, max:
982 fps
fps
100%
NVIDIA GeForce RTX 3090:
342 [X] Nvidia GeForce RTX 3090 FE AMD Ryzen 9 7950X 4.5GHz
NVIDIA GeForce RTX 3090
min:
21.6 fps, P0.1:
126 fps, P1:
153.2 fps, max:
889 fps
fps
100%
NVIDIA GeForce RTX 3090:
328 [X] Nvidia GeForce RTX 3090 FE AMD Ryzen 9 7950X 4.5GHz
NVIDIA GeForce RTX 3090
min:
26.4 fps, P0.1:
119 fps, P1:
143.3 fps, max:
953 fps
fps
100%
NVIDIA GeForce RTX 3090:
268 [X] Nvidia GeForce RTX 3090 FE AMD Ryzen 9 7950X 4.5GHz
NVIDIA GeForce RTX 3090
min:
25.9 fps, P0.1:
117.3 fps, P1:
138.3 fps, max:
777 fps
fps
100%
NVIDIA GeForce RTX 3090:
218 [X] Nvidia GeForce RTX 3090 FE AMD Ryzen 9 7950X 4.5GHz
NVIDIA GeForce RTX 3090
min:
72.5 fps, P0.1:
89.6 fps, P1:
102.2 fps, max:
660 fps
fps
100%
NVIDIA GeForce RTX 3090:
110.8 [X] Nvidia GeForce RTX 3090 FE AMD Ryzen 9 7950X 4.5GHz
NVIDIA GeForce RTX 3090
min:
42 fps, P0.1:
59.2 fps, P1:
66.7 fps, max:
430 fps
fps
100%
NVIDIA GeForce RTX 3090:
202 [X] Nvidia GeForce RTX 3090 FE 2.0
AMD Ryzen 9 7950X 4.5GHz
NVIDIA GeForce RTX 3090
min:
62 fps, max:
262 fps
237 [X] Nvidia GeForce RTX 3090 FE 2.11
Intel Core i9-14900K 3.2GHz
NVIDIA GeForce RTX 3090
min:
196.6 fps, max:
285 fps
~ 220 fps
100%
NVIDIA GeForce RTX 3090:
182.5 [X] Nvidia GeForce RTX 3090 FE 2.0
AMD Ryzen 9 7950X 4.5GHz
NVIDIA GeForce RTX 3090
min:
40 fps, max:
253 fps
193.3 [X] Nvidia GeForce RTX 3090 FE 2.11
Intel Core i9-14900K 3.2GHz
NVIDIA GeForce RTX 3090
min:
167.3 fps, max:
223 fps
~ 188 fps
100%
NVIDIA GeForce RTX 3090:
156.4 [X] Nvidia GeForce RTX 3090 FE 2.0
AMD Ryzen 9 7950X 4.5GHz
NVIDIA GeForce RTX 3090
min:
34.2 fps, max:
234 fps
165.4 [X] Nvidia GeForce RTX 3090 FE 2.11
Intel Core i9-14900K 3.2GHz
NVIDIA GeForce RTX 3090
min:
139.5 fps, max:
197.5 fps
~ 161 fps
100%
NVIDIA GeForce RTX 3090:
144.5 [X] Nvidia GeForce RTX 3090 FE 2.0
AMD Ryzen 9 7950X 4.5GHz
NVIDIA GeForce RTX 3090
min:
74.1 fps, max:
213 fps
146.9 [X] Nvidia GeForce RTX 3090 FE 2.11
Intel Core i9-14900K 3.2GHz
NVIDIA GeForce RTX 3090
min:
121.4 fps, max:
183.3 fps
~ 146 fps
100%
NVIDIA GeForce RTX 3090:
94.7 [X] Nvidia GeForce RTX 3090 FE 2.11
Intel Core i9-14900K 3.2GHz
NVIDIA GeForce RTX 3090
min:
79.3 fps, max:
119.8 fps
98.2 [X] Nvidia GeForce RTX 3090 FE 2.0
AMD Ryzen 9 7950X 4.5GHz
NVIDIA GeForce RTX 3090
min:
66.5 fps, max:
151 fps
~ 96 fps
100%
NVIDIA GeForce RTX 3090:
44.4 [X] Nvidia GeForce RTX 3090 FE 2.11
Intel Core i9-14900K 3.2GHz
NVIDIA GeForce RTX 3090
min:
37.8 fps, max:
55 fps
50.3 [X] Nvidia GeForce RTX 3090 FE 2.0
AMD Ryzen 9 7950X 4.5GHz
NVIDIA GeForce RTX 3090
min:
40.8 fps, max:
63.8 fps
~ 47 fps
100%
NVIDIA GeForce RTX 3090:
308 [X] Nvidia GeForce RTX 3090 FE AMD Ryzen 9 7950X 4.5GHz
NVIDIA GeForce RTX 3090
min:
84.2 fps, P0.1:
145.9 fps, P1:
214 fps, max:
447 fps
fps
100%
NVIDIA GeForce RTX 3090:
274 [X] Nvidia GeForce RTX 3090 FE AMD Ryzen 9 7950X 4.5GHz
NVIDIA GeForce RTX 3090
min:
54.6 fps, P0.1:
126 fps, P1:
185.8 fps, max:
403 fps
fps
100%
NVIDIA GeForce RTX 3090:
242 [X] Nvidia GeForce RTX 3090 FE AMD Ryzen 9 7950X 4.5GHz
NVIDIA GeForce RTX 3090
min:
118.9 fps, P0.1:
132 fps, P1:
174.4 fps, max:
367 fps
fps
100%
NVIDIA GeForce RTX 3090:
223 [X] Nvidia GeForce RTX 3090 FE AMD Ryzen 9 7950X 4.5GHz
NVIDIA GeForce RTX 3090
min:
73.6 fps, P0.1:
119.6 fps, P1:
166.8 fps, max:
342 fps
fps
100%
NVIDIA GeForce RTX 3090:
160.9 [X] Nvidia GeForce RTX 3090 FE AMD Ryzen 9 7950X 4.5GHz
NVIDIA GeForce RTX 3090
min:
74.1 fps, P0.1:
93.8 fps, P1:
104.6 fps, max:
340 fps
fps
100%
NVIDIA GeForce RTX 3090:
86.2 [X] Nvidia GeForce RTX 3090 FE AMD Ryzen 9 7950X 4.5GHz
NVIDIA GeForce RTX 3090
min:
42.2 fps, P0.1:
43.3 fps, P1:
46.2 fps, max:
275 fps
fps
100%
NVIDIA GeForce RTX 3090:
132.5 [X] Nvidia GeForce RTX 3090 FE AMD Ryzen 9 7950X 4.5GHz
NVIDIA GeForce RTX 3090
min:
61.8 fps, P0.1:
74.5 fps, P1:
80.4 fps, max:
283 fps
fps
100%
NVIDIA GeForce RTX 3090:
103.1 [X] Nvidia GeForce RTX 3090 FE AMD Ryzen 9 7950X 4.5GHz
NVIDIA GeForce RTX 3090
min:
67.4 fps, P0.1:
73.6 fps, P1:
81.1 fps, max:
167.5 fps
fps
100%
NVIDIA GeForce RTX 3090:
91.6 [X] Nvidia GeForce RTX 3090 FE AMD Ryzen 9 7950X 4.5GHz
NVIDIA GeForce RTX 3090
min:
58.3 fps, P0.1:
62.2 fps, P1:
72.3 fps, max:
143.7 fps
fps
100%
NVIDIA GeForce RTX 3090:
80.5 [X] Nvidia GeForce RTX 3090 FE AMD Ryzen 9 7950X 4.5GHz
NVIDIA GeForce RTX 3090
min:
51.4 fps, P0.1:
54.4 fps, P1:
61.5 fps, max:
129.8 fps
fps
100%
NVIDIA GeForce RTX 3090:
73.7 [X] Nvidia GeForce RTX 3090 FE AMD Ryzen 9 7950X 4.5GHz
NVIDIA GeForce RTX 3090
min:
53.6 fps, P0.1:
54.2 fps, P1:
57.1 fps, max:
137.8 fps
fps
100%
NVIDIA GeForce RTX 3090:
63.5 [X] Nvidia GeForce RTX 3090 FE AMD Ryzen 9 7950X 4.5GHz
NVIDIA GeForce RTX 3090
min:
43.8 fps, P0.1:
45.1 fps, P1:
49.3 fps, max:
97.5 fps
fps
100%
NVIDIA GeForce RTX 3090:
42.1 [X] Nvidia GeForce RTX 3090 FE AMD Ryzen 9 7950X 4.5GHz
NVIDIA GeForce RTX 3090
min:
34 fps, P0.1:
34.4 fps, P1:
35.5 fps, max:
53.8 fps
fps
100%
NVIDIA GeForce RTX 3090:
119.5 [X] Nvidia GeForce RTX 3090 FE AMD Ryzen 9 7950X 4.5GHz
NVIDIA GeForce RTX 3090
min:
47.9 fps, P0.1:
85.5 fps, P1:
96 fps, max:
202 fps
119.7 [X] Nvidia GeForce RTX 3090 FE Intel Core i9-14900K 3.2GHz
NVIDIA GeForce RTX 3090
min:
61.4 fps, P0.1:
69.4 fps, P1:
96.3 fps, max:
172.7 fps
~ 120 fps
100%
NVIDIA GeForce RTX 3090:
119.5 [X] Nvidia GeForce RTX 3090 FE AMD Ryzen 9 7950X 4.5GHz
NVIDIA GeForce RTX 3090
min:
39.2 fps, P0.1:
88.7 fps, P1:
97 fps, max:
197.5 fps
119.9 [X] Nvidia GeForce RTX 3090 FE Intel Core i9-14900K 3.2GHz
NVIDIA GeForce RTX 3090
min:
62.9 fps, P0.1:
85 fps, P1:
97.6 fps, max:
177.9 fps
~ 120 fps
100%
NVIDIA GeForce RTX 3090:
119.6 [X] Nvidia GeForce RTX 3090 FE AMD Ryzen 9 7950X 4.5GHz
NVIDIA GeForce RTX 3090
min:
24.5 fps, P0.1:
92 fps, P1:
96.9 fps, max:
197.1 fps
119.8 [X] Nvidia GeForce RTX 3090 FE Intel Core i9-14900K 3.2GHz
NVIDIA GeForce RTX 3090
min:
28.1 fps, P0.1:
79.5 fps, P1:
95.8 fps, max:
205 fps
~ 120 fps
100%
NVIDIA GeForce RTX 3090:
119.4 [X] Nvidia GeForce RTX 3090 FE AMD Ryzen 9 7950X 4.5GHz
NVIDIA GeForce RTX 3090
min:
62.3 fps, P0.1:
89.2 fps, P1:
95.5 fps, max:
196.9 fps
119.9 [X] Nvidia GeForce RTX 3090 FE Intel Core i9-14900K 3.2GHz
NVIDIA GeForce RTX 3090
min:
72.1 fps, P0.1:
91.2 fps, P1:
99.9 fps, max:
216 fps
~ 120 fps
100%
NVIDIA GeForce RTX 3090:
119.3 [X] Nvidia GeForce RTX 3090 FE AMD Ryzen 9 7950X 4.5GHz
NVIDIA GeForce RTX 3090
min:
51.5 fps, P0.1:
84.1 fps, P1:
95.9 fps, max:
204 fps
119.7 [X] Nvidia GeForce RTX 3090 FE Intel Core i9-14900K 3.2GHz
NVIDIA GeForce RTX 3090
min:
25.6 fps, P0.1:
86.7 fps, P1:
99.3 fps, max:
168.4 fps
~ 120 fps
100%
NVIDIA GeForce RTX 3090:
82.1 [X] Nvidia GeForce RTX 3090 FE Intel Core i9-14900K 3.2GHz
NVIDIA GeForce RTX 3090
min:
56.5 fps, P0.1:
66.2 fps, P1:
69.7 fps, max:
129.4 fps
85.2 [X] Nvidia GeForce RTX 3090 FE AMD Ryzen 9 7950X 4.5GHz
NVIDIA GeForce RTX 3090
min:
19 fps, P0.1:
59.1 fps, P1:
69.5 fps, max:
182.9 fps
~ 84 fps
100%
NVIDIA GeForce RTX 3090:
108.1 [X] Nvidia GeForce RTX 3090 FE Intel Core i9-14900K 3.2GHz
NVIDIA GeForce RTX 3090
min:
38.1 fps, P0.1:
55.5 fps, P1:
78.4 fps, max:
218 fps
108.9 [X] Nvidia GeForce RTX 3090 FE AMD Ryzen 9 7950X 4.5GHz
NVIDIA GeForce RTX 3090
min:
45.8 fps, P0.1:
59.9 fps, P1:
77 fps, max:
203 fps
~ 109 fps
100%
NVIDIA GeForce RTX 3090:
93.9 [X] Nvidia GeForce RTX 3090 FE AMD Ryzen 9 7950X 4.5GHz
NVIDIA GeForce RTX 3090
min:
40.1 fps, P0.1:
51 fps, P1:
64.9 fps, max:
176 fps
97.5 [X] Nvidia GeForce RTX 3090 FE Intel Core i9-14900K 3.2GHz
NVIDIA GeForce RTX 3090
min:
37.2 fps, P0.1:
54.2 fps, P1:
72.6 fps, max:
201 fps
~ 96 fps
100%
NVIDIA GeForce RTX 3090:
79.5 [X] Nvidia GeForce RTX 3090 FE AMD Ryzen 9 7950X 4.5GHz
NVIDIA GeForce RTX 3090
min:
39.3 fps, P0.1:
46.9 fps, P1:
56.7 fps, max:
172.6 fps
86.4 [X] Nvidia GeForce RTX 3090 FE Intel Core i9-14900K 3.2GHz
NVIDIA GeForce RTX 3090
min:
37.7 fps, P0.1:
48.8 fps, P1:
65.2 fps, max:
206 fps
~ 83 fps
100%
NVIDIA GeForce RTX 3090:
56.9 [X] Nvidia GeForce RTX 3090 FE AMD Ryzen 9 7950X 4.5GHz
NVIDIA GeForce RTX 3090
min:
33.8 fps, P0.1:
37.1 fps, P1:
43.7 fps, max:
110.7 fps
64.9 [X] Nvidia GeForce RTX 3090 FE Intel Core i9-14900K 3.2GHz
NVIDIA GeForce RTX 3090
min:
30.4 fps, P0.1:
32.2 fps, P1:
47.3 fps, max:
154.1 fps
~ 61 fps
100%
NVIDIA GeForce RTX 3090:
33.3 [X] Nvidia GeForce RTX 3090 FE AMD Ryzen 9 7950X 4.5GHz
NVIDIA GeForce RTX 3090
min:
21.9 fps, P0.1:
24.6 fps, P1:
27.1 fps, max:
46 fps
36.8 [X] Nvidia GeForce RTX 3090 FE Intel Core i9-14900K 3.2GHz
NVIDIA GeForce RTX 3090
min:
4.67 fps, P0.1:
9.96 fps, P1:
27.8 fps, max:
186.8 fps
~ 35 fps
100%
NVIDIA GeForce RTX 3090:
195 [X] Nvidia GeForce RTX 3090 FE AMD Ryzen 9 7950X 4.5GHz
NVIDIA GeForce RTX 3090
min:
91.1 fps, P0.1:
127.3 fps, P1:
153.8 fps, max:
253 fps
199.6 [X] Nvidia GeForce RTX 3090 FE Intel Core i9-14900K 3.2GHz
NVIDIA GeForce RTX 3090
min:
74.3 fps, P0.1:
115.6 fps, P1:
154 fps, max:
325 fps
~ 197 fps
100%
NVIDIA GeForce RTX 3090:
192.4 [X] Nvidia GeForce RTX 3090 FE AMD Ryzen 9 7950X 4.5GHz
NVIDIA GeForce RTX 3090
min:
92.5 fps, P0.1:
137.7 fps, P1:
152.6 fps, max:
260 fps
199.9 [X] Nvidia GeForce RTX 3090 FE Intel Core i9-14900K 3.2GHz
NVIDIA GeForce RTX 3090
min:
88.5 fps, P0.1:
139.1 fps, P1:
153.6 fps, max:
338 fps
~ 196 fps
100%
NVIDIA GeForce RTX 3090:
187.9 [X] Nvidia GeForce RTX 3090 FE AMD Ryzen 9 7950X 4.5GHz
NVIDIA GeForce RTX 3090
min:
92.5 fps, P0.1:
131.5 fps, P1:
150.1 fps, max:
251 fps
199.7 [X] Nvidia GeForce RTX 3090 FE Intel Core i9-14900K 3.2GHz
NVIDIA GeForce RTX 3090
min:
99.5 fps, P0.1:
133.5 fps, P1:
152.8 fps, max:
319 fps
~ 194 fps
100%
NVIDIA GeForce RTX 3090:
184.3 [X] Nvidia GeForce RTX 3090 FE AMD Ryzen 9 7950X 4.5GHz
NVIDIA GeForce RTX 3090
min:
85.4 fps, P0.1:
114.3 fps, P1:
147.2 fps, max:
239 fps
194.9 [X] Nvidia GeForce RTX 3090 FE Intel Core i9-14900K 3.2GHz
NVIDIA GeForce RTX 3090
min:
101.4 fps, P0.1:
136.7 fps, P1:
151.7 fps, max:
307 fps
~ 190 fps
100%
NVIDIA GeForce RTX 3090:
143.2 [X] Nvidia GeForce RTX 3090 FE Intel Core i9-14900K 3.2GHz
NVIDIA GeForce RTX 3090
min:
99.9 fps, P0.1:
103.6 fps, P1:
111.2 fps, max:
214 fps
144.3 [X] Nvidia GeForce RTX 3090 FE AMD Ryzen 9 7950X 4.5GHz
NVIDIA GeForce RTX 3090
min:
77.4 fps, P0.1:
103.1 fps, P1:
115 fps, max:
218 fps
~ 144 fps
100%
NVIDIA GeForce RTX 3090:
81.8 [X] Nvidia GeForce RTX 3090 FE Intel Core i9-14900K 3.2GHz
NVIDIA GeForce RTX 3090
min:
55.2 fps, P0.1:
57.3 fps, P1:
62.2 fps, max:
104.1 fps
83 [X] Nvidia GeForce RTX 3090 FE AMD Ryzen 9 7950X 4.5GHz
NVIDIA GeForce RTX 3090
min:
65.3 fps, P0.1:
66 fps, P1:
68.8 fps, max:
107.2 fps
~ 82 fps
100%
NVIDIA GeForce RTX 3090:
229 [X] Nvidia GeForce RTX 3090 FE AMD Ryzen 9 7950X 4.5GHz
NVIDIA GeForce RTX 3090
min:
39.1 fps, P0.1:
135.6 fps, P1:
188.7 fps, max:
358 fps
fps
100%
NVIDIA GeForce RTX 3090:
189.8 [X] Nvidia GeForce RTX 3090 FE AMD Ryzen 9 7950X 4.5GHz
NVIDIA GeForce RTX 3090
min:
56.7 fps, P0.1:
93.3 fps, P1:
165.2 fps, max:
312 fps
fps
100%
NVIDIA GeForce RTX 3090:
159.9 [X] Nvidia GeForce RTX 3090 FE AMD Ryzen 9 7950X 4.5GHz
NVIDIA GeForce RTX 3090
min:
31.8 fps, P0.1:
127.4 fps, P1:
141.6 fps, max:
345 fps
fps
100%
NVIDIA GeForce RTX 3090:
158.5 [X] Nvidia GeForce RTX 3090 FE AMD Ryzen 9 7950X 4.5GHz
NVIDIA GeForce RTX 3090
min:
86.3 fps, P0.1:
120.7 fps, P1:
139.9 fps, max:
242 fps
fps
100%
NVIDIA GeForce RTX 3090:
109.4 [X] Nvidia GeForce RTX 3090 FE AMD Ryzen 9 7950X 4.5GHz
NVIDIA GeForce RTX 3090
min:
33.3 fps, P0.1:
81.7 fps, P1:
94.9 fps, max:
175.7 fps
fps
100%
NVIDIA GeForce RTX 3090:
59.5 [X] Nvidia GeForce RTX 3090 FE AMD Ryzen 9 7950X 4.5GHz
NVIDIA GeForce RTX 3090
min:
49.8 fps, P0.1:
49.9 fps, P1:
51.2 fps, max:
77.7 fps
fps
100%
NVIDIA GeForce RTX 3090:
192.8 [X] Nvidia GeForce RTX 3090 FE AMD Ryzen 9 7950X 4.5GHz
NVIDIA GeForce RTX 3090
min:
138.7 fps, P0.1:
148.2 fps, P1:
155.3 fps, max:
253 fps
fps
100%
NVIDIA GeForce RTX 3090:
169.9 [X] Nvidia GeForce RTX 3090 FE AMD Ryzen 9 7950X 4.5GHz
NVIDIA GeForce RTX 3090
min:
109.2 fps, P0.1:
131.7 fps, P1:
139.7 fps, max:
239 fps
fps
100%
NVIDIA GeForce RTX 3090:
134.1 [X] Nvidia GeForce RTX 3090 FE AMD Ryzen 9 7950X 4.5GHz
NVIDIA GeForce RTX 3090
min:
64.5 fps, P0.1:
75.3 fps, P1:
88.1 fps, max:
187.5 fps
fps
100%
NVIDIA GeForce RTX 3090:
114.9 [X] Nvidia GeForce RTX 3090 FE AMD Ryzen 9 7950X 4.5GHz
NVIDIA GeForce RTX 3090
min:
52 fps, P0.1:
55.4 fps, P1:
64.6 fps, max:
165.8 fps
fps
100%
NVIDIA GeForce RTX 3090:
97.9 [X] Nvidia GeForce RTX 3090 FE AMD Ryzen 9 7950X 4.5GHz
NVIDIA GeForce RTX 3090
min:
46.5 fps, P0.1:
49.2 fps, P1:
56.2 fps, max:
157.6 fps
fps
100%
NVIDIA GeForce RTX 3090:
62.3 [X] Nvidia GeForce RTX 3090 FE AMD Ryzen 9 7950X 4.5GHz
NVIDIA GeForce RTX 3090
min:
32.6 fps, P0.1:
36 fps, P1:
39 fps, max:
91.8 fps
fps
100%
NVIDIA GeForce RTX 3090:
491 [X] Nvidia GeForce RTX 3090 FE 1021115
AMD Ryzen 9 7950X 4.5GHz
NVIDIA GeForce RTX 3090
min:
375 fps, P1:
304 fps, max:
588 fps
fps
100%
NVIDIA GeForce RTX 3090:
485 [X] Nvidia GeForce RTX 3090 FE 1021115
AMD Ryzen 9 7950X 4.5GHz
NVIDIA GeForce RTX 3090
min:
379 fps, P1:
337 fps, max:
553 fps
fps
100%
NVIDIA GeForce RTX 3090:
360 [X] Nvidia GeForce RTX 3090 FE 1021115
AMD Ryzen 9 7950X 4.5GHz
NVIDIA GeForce RTX 3090
min:
321 fps, P1:
286 fps, max:
397 fps
fps
100%
NVIDIA GeForce RTX 3090:
121.4 [X] Nvidia GeForce RTX 3090 FE 1021115
AMD Ryzen 9 7950X 4.5GHz
NVIDIA GeForce RTX 3090
min:
97 fps, P1:
96 fps, max:
140 fps
fps
100%
NVIDIA GeForce RTX 3090:
79.5 [X] Nvidia GeForce RTX 3090 FE 1021115
AMD Ryzen 9 7950X 4.5GHz
NVIDIA GeForce RTX 3090
min:
62 fps, P1:
62 fps, max:
94 fps
fps
100%
NVIDIA GeForce RTX 3090:
39.9 [X] Nvidia GeForce RTX 3090 FE 1021115
AMD Ryzen 9 7950X 4.5GHz
NVIDIA GeForce RTX 3090
min:
29 fps, P1:
30 fps, max:
47 fps
fps
100%
NVIDIA GeForce RTX 3090:
68.7 [X] Nvidia GeForce RTX 3090 FE 1021115
AMD Ryzen 9 7950X 4.5GHz
NVIDIA GeForce RTX 3090
min:
53 fps, P1:
53 fps, max:
79 fps
fps
100%
NVIDIA GeForce RTX 3090:
399 [X] Nvidia GeForce RTX 3090 FE AMD Ryzen 9 7950X 4.5GHz
NVIDIA GeForce RTX 3090
min:
76.3 fps, P0.1:
202 fps, P1:
306 fps, max:
649 fps
fps
100%
NVIDIA GeForce RTX 3090:
393 [X] Nvidia GeForce RTX 3090 FE AMD Ryzen 9 7950X 4.5GHz
NVIDIA GeForce RTX 3090
min:
168.3 fps, P0.1:
209 fps, P1:
292 fps, max:
630 fps
fps
100%
NVIDIA GeForce RTX 3090:
371 [X] Nvidia GeForce RTX 3090 FE AMD Ryzen 9 7950X 4.5GHz
NVIDIA GeForce RTX 3090
min:
72.4 fps, P0.1:
190.3 fps, P1:
270 fps, max:
683 fps
fps
100%
NVIDIA GeForce RTX 3090:
326 [X] Nvidia GeForce RTX 3090 FE AMD Ryzen 9 7950X 4.5GHz
NVIDIA GeForce RTX 3090
min:
145.9 fps, P0.1:
183.3 fps, P1:
238 fps, max:
544 fps
fps
100%
NVIDIA GeForce RTX 3090:
225 [X] Nvidia GeForce RTX 3090 FE AMD Ryzen 9 7950X 4.5GHz
NVIDIA GeForce RTX 3090
min:
106.5 fps, P0.1:
131.1 fps, P1:
170.8 fps, max:
508 fps
fps
100%
NVIDIA GeForce RTX 3090:
121.5 [X] Nvidia GeForce RTX 3090 FE AMD Ryzen 9 7950X 4.5GHz
NVIDIA GeForce RTX 3090
min:
74.4 fps, P0.1:
86.1 fps, P1:
100.3 fps, max:
216 fps
fps
100%
NVIDIA GeForce RTX 3090:
158.1 [X] Nvidia GeForce RTX 3090 FE AMD Ryzen 9 7950X 4.5GHz
NVIDIA GeForce RTX 3090
min:
34.3 fps, P0.1:
64.6 fps, P1:
115.6 fps, max:
203 fps
fps
100%
NVIDIA GeForce RTX 3090:
137.1 [X] Nvidia GeForce RTX 3090 FE AMD Ryzen 9 7950X 4.5GHz
NVIDIA GeForce RTX 3090
min:
36.2 fps, P0.1:
66.1 fps, P1:
98.1 fps, max:
176.6 fps
fps
100%
NVIDIA GeForce RTX 3090:
133.4 [X] Nvidia GeForce RTX 3090 FE AMD Ryzen 9 7950X 4.5GHz
NVIDIA GeForce RTX 3090
min:
29.7 fps, P0.1:
64.2 fps, P1:
101.9 fps, max:
182.1 fps
fps
100%
NVIDIA GeForce RTX 3090:
125.8 [X] Nvidia GeForce RTX 3090 FE AMD Ryzen 9 7950X 4.5GHz
NVIDIA GeForce RTX 3090
min:
30 fps, P0.1:
48.2 fps, P1:
91.8 fps, max:
182.5 fps
fps
100%
NVIDIA GeForce RTX 3090:
82.8 [X] Nvidia GeForce RTX 3090 FE AMD Ryzen 9 7950X 4.5GHz
NVIDIA GeForce RTX 3090
min:
22.7 fps, P0.1:
40.8 fps, P1:
62.6 fps, max:
142.1 fps
fps
100%
NVIDIA GeForce RTX 3090:
41.7 [X] Nvidia GeForce RTX 3090 FE AMD Ryzen 9 7950X 4.5GHz
NVIDIA GeForce RTX 3090
min:
25.7 fps, P0.1:
27 fps, P1:
33.1 fps, max:
96.5 fps
fps
100%
NVIDIA GeForce RTX 3090:
333 [X] Nvidia GeForce RTX 3090 FE AMD Ryzen 9 7950X 4.5GHz
NVIDIA GeForce RTX 3090
min:
140.1 fps, P0.1:
188.6 fps, P1:
229 fps, max:
445 fps
377 [X] Nvidia GeForce RTX 3090 FE Intel Core i9-14900K 3.2GHz
NVIDIA GeForce RTX 3090
min:
38.5 fps, P0.1:
216 fps, P1:
268 fps, max:
537 fps
~ 355 fps
100%
NVIDIA GeForce RTX 3090:
328 [X] Nvidia GeForce RTX 3090 FE AMD Ryzen 9 7950X 4.5GHz
NVIDIA GeForce RTX 3090
min:
84.7 fps, P0.1:
208 fps, P1:
239 fps, max:
447 fps
368 [X] Nvidia GeForce RTX 3090 FE Intel Core i9-14900K 3.2GHz
NVIDIA GeForce RTX 3090
min:
27.4 fps, P0.1:
234 fps, P1:
266 fps, max:
530 fps
~ 348 fps
100%
NVIDIA GeForce RTX 3090:
297 [X] Nvidia GeForce RTX 3090 FE AMD Ryzen 9 7950X 4.5GHz
NVIDIA GeForce RTX 3090
min:
131.5 fps, P0.1:
177.2 fps, P1:
205 fps, max:
431 fps
305 [X] Nvidia GeForce RTX 3090 FE Intel Core i9-14900K 3.2GHz
NVIDIA GeForce RTX 3090
min:
137 fps, P0.1:
185.6 fps, P1:
219 fps, max:
468 fps
~ 301 fps
100%
NVIDIA GeForce RTX 3090:
222 [X] Nvidia GeForce RTX 3090 FE AMD Ryzen 9 7950X 4.5GHz
NVIDIA GeForce RTX 3090
min:
24.7 fps, P0.1:
34.3 fps, P1:
155.3 fps, max:
367 fps
234 [X] Nvidia GeForce RTX 3090 FE Intel Core i9-14900K 3.2GHz
NVIDIA GeForce RTX 3090
min:
24.3 fps, P0.1:
40.3 fps, P1:
167.7 fps, max:
419 fps
~ 228 fps
100%
NVIDIA GeForce RTX 3090:
164.2 [X] Nvidia GeForce RTX 3090 FE AMD Ryzen 9 7950X 4.5GHz
NVIDIA GeForce RTX 3090
min:
97.6 fps, P0.1:
100.1 fps, P1:
113.5 fps, max:
321 fps
169.8 [X] Nvidia GeForce RTX 3090 FE Intel Core i9-14900K 3.2GHz
NVIDIA GeForce RTX 3090
min:
104.1 fps, P0.1:
108.4 fps, P1:
120.9 fps, max:
403 fps
~ 167 fps
100%
NVIDIA GeForce RTX 3090:
90.2 [X] Nvidia GeForce RTX 3090 FE AMD Ryzen 9 7950X 4.5GHz
NVIDIA GeForce RTX 3090
min:
45.6 fps, P0.1:
49.2 fps, P1:
55.1 fps, max:
293 fps
92 [X] Nvidia GeForce RTX 3090 FE Intel Core i9-14900K 3.2GHz
NVIDIA GeForce RTX 3090
min:
50.5 fps, P0.1:
52 fps, P1:
55.6 fps, max:
335 fps
~ 91 fps
100%
NVIDIA GeForce RTX 3090:
156.3 [X] Nvidia GeForce RTX 3090 FE AMD Ryzen 9 7950X 4.5GHz
NVIDIA GeForce RTX 3090
min:
52.3 fps, P0.1:
71.5 fps, P1:
104.6 fps, max:
227 fps
fps
95%
NVIDIA GeForce RTX 3080:
148.6 [X] Desktop-PC Intel Core i9-12900K 3.2GHz
NVIDIA GeForce RTX 3080
min:
31.6 fps, P0.1:
70 fps, P1:
93.2 fps, max:
232 fps
fps
100%
NVIDIA GeForce RTX 3090:
137.3 [X] Nvidia GeForce RTX 3090 FE AMD Ryzen 9 7950X 4.5GHz
NVIDIA GeForce RTX 3090
min:
61.3 fps, P0.1:
69.5 fps, P1:
93.5 fps, max:
188.3 fps
fps
94%
NVIDIA GeForce RTX 3080:
128.8 [X] Desktop-PC Intel Core i9-12900K 3.2GHz
NVIDIA GeForce RTX 3080
min:
54.7 fps, P0.1:
69.9 fps, P1:
87.9 fps, max:
193.1 fps
fps
100%
NVIDIA GeForce RTX 3090:
129.1 [X] Nvidia GeForce RTX 3090 FE AMD Ryzen 9 7950X 4.5GHz
NVIDIA GeForce RTX 3090
min:
63.6 fps, P0.1:
72.1 fps, P1:
93.6 fps, max:
185.3 fps
fps
93%
NVIDIA GeForce RTX 3080:
120.2 [X] Desktop-PC Intel Core i9-12900K 3.2GHz
NVIDIA GeForce RTX 3080
min:
57 fps, P0.1:
68.6 fps, P1:
88 fps, max:
177.8 fps
fps
100%
NVIDIA GeForce RTX 3090:
113.3 [X] Nvidia GeForce RTX 3090 FE AMD Ryzen 9 7950X 4.5GHz
NVIDIA GeForce RTX 3090
min:
33.4 fps, P0.1:
65 fps, P1:
86.9 fps, max:
162.2 fps
fps
94%
NVIDIA GeForce RTX 3080:
106.3 [X] Desktop-PC Intel Core i9-12900K 3.2GHz
NVIDIA GeForce RTX 3080
min:
52 fps, P0.1:
58.2 fps, P1:
75.1 fps, max:
159 fps
fps
100%
NVIDIA GeForce RTX 3090:
80.3 [X] Nvidia GeForce RTX 3090 FE AMD Ryzen 9 7950X 4.5GHz
NVIDIA GeForce RTX 3090
min:
57.7 fps, P0.1:
62.7 fps, P1:
67.7 fps, max:
107.3 fps
fps
89%
NVIDIA GeForce RTX 3080:
71.2 [X] Desktop-PC Intel Core i9-12900K 3.2GHz
NVIDIA GeForce RTX 3080
min:
38.4 fps, P0.1:
49.4 fps, P1:
56 fps, max:
113.6 fps
fps
100%
NVIDIA GeForce RTX 3090:
41.5 [X] Nvidia GeForce RTX 3090 FE AMD Ryzen 9 7950X 4.5GHz
NVIDIA GeForce RTX 3090
min:
33.5 fps, P0.1:
34.2 fps, P1:
35.2 fps, max:
54.2 fps
fps
84%
NVIDIA GeForce RTX 3080:
34.9 [X] Desktop-PC Intel Core i9-12900K 3.2GHz
NVIDIA GeForce RTX 3080
min:
7.6 fps, P0.1:
12 fps, P1:
20.2 fps, max:
57.7 fps
fps
100%
NVIDIA GeForce RTX 3090:
65 [X] Nvidia GeForce RTX 3090 FE AMD Ryzen 9 7950X 4.5GHz
NVIDIA GeForce RTX 3090
min:
49.7 fps, P0.1:
51.4 fps, P1:
52.7 fps, max:
86.9 fps
fps
92%
NVIDIA GeForce RTX 3080:
59.6 [X] Desktop-PC Intel Core i9-12900K 3.2GHz
NVIDIA GeForce RTX 3080
min:
30.6 fps, P0.1:
35.4 fps, P1:
46.4 fps, max:
86.6 fps
fps
100%
NVIDIA GeForce RTX 3090:
262 [X] Nvidia GeForce RTX 3090 FE AMD Ryzen 9 7950X 4.5GHz
NVIDIA GeForce RTX 3090
min:
31.4 fps, P0.1:
89.1 fps, P1:
199.5 fps, max:
354 fps
fps
97%
NVIDIA GeForce RTX 3080:
253 [X] Desktop-PC Intel Core i9-12900K 3.2GHz
NVIDIA GeForce RTX 3080
min:
35.5 fps, P0.1:
118.9 fps, P1:
202 fps, max:
316 fps
fps
100%
NVIDIA GeForce RTX 3090:
196.5 [X] Nvidia GeForce RTX 3090 FE AMD Ryzen 9 7950X 4.5GHz
NVIDIA GeForce RTX 3090
min:
17.1 fps, P0.1:
88.5 fps, P1:
167.9 fps, max:
264 fps
fps
96%
NVIDIA GeForce RTX 3080:
188.8 [X] Desktop-PC Intel Core i9-12900K 3.2GHz
NVIDIA GeForce RTX 3080
min:
39 fps, P0.1:
112 fps, P1:
162.4 fps, max:
245 fps
fps
100%
NVIDIA GeForce RTX 3090:
184.2 [X] Nvidia GeForce RTX 3090 FE AMD Ryzen 9 7950X 4.5GHz
NVIDIA GeForce RTX 3090
min:
30.4 fps, P0.1:
86 fps, P1:
157.4 fps, max:
248 fps
fps
94%
NVIDIA GeForce RTX 3080:
173 [X] Desktop-PC Intel Core i9-12900K 3.2GHz
NVIDIA GeForce RTX 3080
min:
35.4 fps, P0.1:
110.5 fps, P1:
149.9 fps, max:
233 fps
fps
100%
NVIDIA GeForce RTX 3090:
132.8 [X] Nvidia GeForce RTX 3090 FE AMD Ryzen 9 7950X 4.5GHz
NVIDIA GeForce RTX 3090
min:
24.5 fps, P0.1:
53.5 fps, P1:
105.2 fps, max:
159.8 fps
fps
96%
NVIDIA GeForce RTX 3080:
127.3 [X] Desktop-PC Intel Core i9-12900K 3.2GHz
NVIDIA GeForce RTX 3080
min:
36.4 fps, P0.1:
60.1 fps, P1:
100.8 fps, max:
160.3 fps
fps
100%
NVIDIA GeForce RTX 3090:
103.5 [X] Nvidia GeForce RTX 3090 FE AMD Ryzen 9 7950X 4.5GHz
NVIDIA GeForce RTX 3090
min:
31.4 fps, P0.1:
51.6 fps, P1:
81.8 fps, max:
139.1 fps
fps
94%
NVIDIA GeForce RTX 3080:
97.6 [X] Desktop-PC Intel Core i9-12900K 3.2GHz
NVIDIA GeForce RTX 3080
min:
35.6 fps, P0.1:
51.3 fps, P1:
77.4 fps, max:
125.3 fps
fps
100%
NVIDIA GeForce RTX 3090:
62.8 [X] Nvidia GeForce RTX 3090 FE AMD Ryzen 9 7950X 4.5GHz
NVIDIA GeForce RTX 3090
min:
33.9 fps, P0.1:
44.8 fps, P1:
54.3 fps, max:
84.9 fps
fps
94%
NVIDIA GeForce RTX 3080:
59.3 [X] Desktop-PC Intel Core i9-12900K 3.2GHz
NVIDIA GeForce RTX 3080
min:
32.8 fps, P0.1:
41 fps, P1:
48.9 fps, max:
80 fps
fps
100%
NVIDIA GeForce RTX 3090:
345.5 [X] Nvidia GeForce RTX 3090 FE AMD Ryzen 9 7950X 4.5GHz
NVIDIA GeForce RTX 3090
fps
100%
NVIDIA GeForce RTX 3090:
305.6 [X] Nvidia GeForce RTX 3090 FE AMD Ryzen 9 7950X 4.5GHz
NVIDIA GeForce RTX 3090
fps
95%
NVIDIA GeForce RTX 3080:
289 [X] Desktop-PC Intel Core i9-12900K 3.2GHz
NVIDIA GeForce RTX 3080
min:
81 fps
fps
100%
NVIDIA GeForce RTX 3090:
240.8 [X] Nvidia GeForce RTX 3090 FE AMD Ryzen 9 7950X 4.5GHz
NVIDIA GeForce RTX 3090
fps
98%
NVIDIA GeForce RTX 3080:
235 [X] Desktop-PC Intel Core i9-12900K 3.2GHz
NVIDIA GeForce RTX 3080
min:
80 fps
fps
100%
NVIDIA GeForce RTX 3090:
235.1 [X] Nvidia GeForce RTX 3090 FE AMD Ryzen 9 7950X 4.5GHz
NVIDIA GeForce RTX 3090
fps
98%
NVIDIA GeForce RTX 3080:
230 [X] Desktop-PC Intel Core i9-12900K 3.2GHz
NVIDIA GeForce RTX 3080
min:
123 fps
fps
100%
NVIDIA GeForce RTX 3090:
186 [X] Nvidia GeForce RTX 3090 FE AMD Ryzen 9 7950X 4.5GHz
NVIDIA GeForce RTX 3090
fps
97%
NVIDIA GeForce RTX 3080:
180 [X] Desktop-PC Intel Core i9-12900K 3.2GHz
NVIDIA GeForce RTX 3080
min:
71 fps
fps
100%
NVIDIA GeForce RTX 3090:
113.5 [X] Nvidia GeForce RTX 3090 FE AMD Ryzen 9 7950X 4.5GHz
NVIDIA GeForce RTX 3090
fps
96%
NVIDIA GeForce RTX 3080:
109 [X] Desktop-PC Intel Core i9-12900K 3.2GHz
NVIDIA GeForce RTX 3080
min:
42 fps
fps
100%
NVIDIA GeForce RTX 3090:
132.4 [X] Nvidia GeForce RTX 3090 FE AMD Ryzen 9 7950X 4.5GHz
NVIDIA GeForce RTX 3090
min:
60.2 fps, P0.1:
96.1 fps, P1:
106.8 fps, max:
199.2 fps
fps
91%
NVIDIA GeForce RTX 3080:
120.9 [X] Desktop-PC Intel Core i9-12900K 3.2GHz
NVIDIA GeForce RTX 3080
min:
79.2 fps, P0.1:
89.9 fps, P1:
98.1 fps, max:
159.1 fps
fps
100%
NVIDIA GeForce RTX 3090:
127.8 [X] Nvidia GeForce RTX 3090 FE AMD Ryzen 9 7950X 4.5GHz
NVIDIA GeForce RTX 3090
min:
51.8 fps, P0.1:
81.4 fps, P1:
102 fps, max:
190 fps
fps
91%
NVIDIA GeForce RTX 3080:
116.5 [X] Desktop-PC Intel Core i9-12900K 3.2GHz
NVIDIA GeForce RTX 3080
min:
83.7 fps, P0.1:
87.3 fps, P1:
95 fps, max:
181.2 fps
fps
100%
NVIDIA GeForce RTX 3090:
123.4 [X] Nvidia GeForce RTX 3090 FE AMD Ryzen 9 7950X 4.5GHz
NVIDIA GeForce RTX 3090
min:
82.9 fps, P0.1:
93.8 fps, P1:
100.2 fps, max:
177.5 fps
fps
92%
NVIDIA GeForce RTX 3080:
114 [X] Desktop-PC Intel Core i9-12900K 3.2GHz
NVIDIA GeForce RTX 3080
min:
70.5 fps, P0.1:
84.7 fps, P1:
90.8 fps, max:
148.3 fps
fps
100%
NVIDIA GeForce RTX 3090:
120.3 [X] Nvidia GeForce RTX 3090 FE AMD Ryzen 9 7950X 4.5GHz
NVIDIA GeForce RTX 3090
min:
77.1 fps, P0.1:
88.9 fps, P1:
97.3 fps, max:
161 fps
fps
93%
NVIDIA GeForce RTX 3080:
112.4 [X] Desktop-PC Intel Core i9-12900K 3.2GHz
NVIDIA GeForce RTX 3080
min:
41.3 fps, P0.1:
73.5 fps, P1:
86.8 fps, max:
160.9 fps
fps
100%
NVIDIA GeForce RTX 3090:
109.4 [X] Nvidia GeForce RTX 3090 FE AMD Ryzen 9 7950X 4.5GHz
NVIDIA GeForce RTX 3090
min:
70.4 fps, P0.1:
74 fps, P1:
80.8 fps, max:
162.7 fps
fps
90%
NVIDIA GeForce RTX 3080:
98.5 [X] Desktop-PC Intel Core i9-12900K 3.2GHz
NVIDIA GeForce RTX 3080
min:
52.2 fps, P0.1:
55.7 fps, P1:
62.4 fps, max:
153.5 fps
fps
100%
NVIDIA GeForce RTX 3090:
72.8 [X] Nvidia GeForce RTX 3090 FE AMD Ryzen 9 7950X 4.5GHz
NVIDIA GeForce RTX 3090
min:
41.6 fps, P0.1:
54.7 fps, P1:
59.2 fps, max:
117.2 fps
fps
95%
NVIDIA GeForce RTX 3080:
69.5 [X] Desktop-PC Intel Core i9-12900K 3.2GHz
NVIDIA GeForce RTX 3080
min:
40.2 fps, P0.1:
48 fps, P1:
51.4 fps, max:
108.4 fps
fps
100%
NVIDIA GeForce RTX 3090:
325 [X] Nvidia GeForce RTX 3090 FE AMD Ryzen 9 7950X 4.5GHz
NVIDIA GeForce RTX 3090
min:
106 fps, P0.1:
227 fps, P1:
279 fps, max:
394 fps
fps
94%
NVIDIA GeForce RTX 3080:
307 [X] Desktop-PC Intel Core i9-12900K 3.2GHz
NVIDIA GeForce RTX 3080
min:
161.6 fps, P0.1:
210 fps, P1:
250 fps, max:
382 fps
fps
100%
NVIDIA GeForce RTX 3090:
262 [X] Nvidia GeForce RTX 3090 FE AMD Ryzen 9 7950X 4.5GHz
NVIDIA GeForce RTX 3090
min:
13.3 fps, P0.1:
177.5 fps, P1:
216 fps, max:
325 fps
fps
91%
NVIDIA GeForce RTX 3080:
239 [X] Desktop-PC Intel Core i9-12900K 3.2GHz
NVIDIA GeForce RTX 3080
min:
135.8 fps, P0.1:
163.4 fps, P1:
192.3 fps, max:
300 fps
fps
100%
NVIDIA GeForce RTX 3090:
156.3 [X] Nvidia GeForce RTX 3090 FE AMD Ryzen 9 7950X 4.5GHz
NVIDIA GeForce RTX 3090
min:
77.7 fps, P0.1:
115.9 fps, P1:
135.1 fps, max:
226 fps
fps
94%
NVIDIA GeForce RTX 3080:
147.4 [X] Desktop-PC Intel Core i9-12900K 3.2GHz
NVIDIA GeForce RTX 3080
min:
92.8 fps, P0.1:
115 fps, P1:
124.8 fps, max:
205 fps
fps
100%
NVIDIA GeForce RTX 3090:
129.3 [X] Nvidia GeForce RTX 3090 FE AMD Ryzen 9 7950X 4.5GHz
NVIDIA GeForce RTX 3090
min:
75.7 fps, P0.1:
102.7 fps, P1:
113.7 fps, max:
184.6 fps
fps
94%
NVIDIA GeForce RTX 3080:
121.4 [X] Desktop-PC Intel Core i9-12900K 3.2GHz
NVIDIA GeForce RTX 3080
min:
86.9 fps, P0.1:
97.7 fps, P1:
102.8 fps, max:
165.3 fps
fps
100%
NVIDIA GeForce RTX 3090:
101.7 [X] Nvidia GeForce RTX 3090 FE AMD Ryzen 9 7950X 4.5GHz
NVIDIA GeForce RTX 3090
min:
58.1 fps, P0.1:
81.8 fps, P1:
90.8 fps, max:
194.9 fps
fps
94%
NVIDIA GeForce RTX 3080:
95.7 [X] Desktop-PC Intel Core i9-12900K 3.2GHz
NVIDIA GeForce RTX 3080
min:
71.3 fps, P0.1:
79.2 fps, P1:
83.3 fps, max:
131.4 fps
fps
100%
NVIDIA GeForce RTX 3090:
63.3 [X] Nvidia GeForce RTX 3090 FE AMD Ryzen 9 7950X 4.5GHz
NVIDIA GeForce RTX 3090
min:
53.9 fps, P0.1:
56.1 fps, P1:
57.8 fps, max:
76.4 fps
fps
95%
NVIDIA GeForce RTX 3080:
60 [X] Desktop-PC Intel Core i9-12900K 3.2GHz
NVIDIA GeForce RTX 3080
min:
47.3 fps, P0.1:
51.6 fps, P1:
53.7 fps, max:
82.9 fps
fps
100%
NVIDIA GeForce RTX 3090:
166 [X] Nvidia GeForce RTX 3090 FE AMD Ryzen 9 7950X 4.5GHz
NVIDIA GeForce RTX 3090
fps
100%
NVIDIA GeForce RTX 3090:
165 [X] Nvidia GeForce RTX 3090 FE AMD Ryzen 9 7950X 4.5GHz
NVIDIA GeForce RTX 3090
fps
98%
NVIDIA GeForce RTX 3080:
161 [X] Desktop-PC Intel Core i9-12900K 3.2GHz
NVIDIA GeForce RTX 3080
min:
78 fps
fps
100%
NVIDIA GeForce RTX 3090:
154 [X] Nvidia GeForce RTX 3090 FE AMD Ryzen 9 7950X 4.5GHz
NVIDIA GeForce RTX 3090
fps
94%
NVIDIA GeForce RTX 3080:
145 [X] Desktop-PC Intel Core i9-12900K 3.2GHz
NVIDIA GeForce RTX 3080
min:
88 fps
fps
100%
NVIDIA GeForce RTX 3090:
136 [X] Nvidia GeForce RTX 3090 FE AMD Ryzen 9 7950X 4.5GHz
NVIDIA GeForce RTX 3090
fps
94%
NVIDIA GeForce RTX 3080:
128 [X] Desktop-PC Intel Core i9-12900K 3.2GHz
NVIDIA GeForce RTX 3080
min:
59 fps
fps
100%
NVIDIA GeForce RTX 3090:
109 [X] Nvidia GeForce RTX 3090 FE AMD Ryzen 9 7950X 4.5GHz
NVIDIA GeForce RTX 3090
fps
94%
NVIDIA GeForce RTX 3080:
103 [X] Desktop-PC Intel Core i9-12900K 3.2GHz
NVIDIA GeForce RTX 3080
min:
58 fps
fps
100%
NVIDIA GeForce RTX 3090:
68 [X] Nvidia GeForce RTX 3090 FE AMD Ryzen 9 7950X 4.5GHz
NVIDIA GeForce RTX 3090
fps
93%
NVIDIA GeForce RTX 3080:
63 [X] Desktop-PC Intel Core i9-12900K 3.2GHz
NVIDIA GeForce RTX 3080
min:
40 fps
fps
100%
NVIDIA GeForce RTX 3090:
164 [X] Nvidia GeForce RTX 3090 FE AMD Ryzen 9 7950X 4.5GHz
NVIDIA GeForce RTX 3090
min:
53.8 fps, P0.1:
85.6 fps, P1:
126 fps, max:
199.9 fps
fps
100%
NVIDIA GeForce RTX 3090:
144.7 [X] Nvidia GeForce RTX 3090 FE AMD Ryzen 9 7950X 4.5GHz
NVIDIA GeForce RTX 3090
min:
47.7 fps, P0.1:
74.7 fps, P1:
103.2 fps, max:
178 fps
fps
93%
NVIDIA GeForce RTX 3080:
134.6 [X] Desktop-PC Intel Core i9-12900K 3.2GHz
NVIDIA GeForce RTX 3080
min:
40.7 fps, P0.1:
73 fps, P1:
89.2 fps, max:
170.2 fps
fps
100%
NVIDIA GeForce RTX 3090:
133.4 [X] Nvidia GeForce RTX 3090 FE AMD Ryzen 9 7950X 4.5GHz
NVIDIA GeForce RTX 3090
min:
38.5 fps, P0.1:
76.8 fps, P1:
103.1 fps, max:
167.8 fps
fps
92%
NVIDIA GeForce RTX 3080:
122.7 [X] Desktop-PC Intel Core i9-12900K 3.2GHz
NVIDIA GeForce RTX 3080
min:
49.9 fps, P0.1:
67 fps, P1:
87.6 fps, max:
156.6 fps
fps
100%
NVIDIA GeForce RTX 3090:
112.2 [X] Nvidia GeForce RTX 3090 FE AMD Ryzen 9 7950X 4.5GHz
NVIDIA GeForce RTX 3090
min:
35.7 fps, P0.1:
50.1 fps, P1:
75.2 fps, max:
151.8 fps
fps
90%
NVIDIA GeForce RTX 3080:
101 [X] Desktop-PC Intel Core i9-12900K 3.2GHz
NVIDIA GeForce RTX 3080
min:
9.58 fps, P0.1:
38.2 fps, P1:
61.9 fps, max:
144.3 fps
fps
100%
NVIDIA GeForce RTX 3090:
92.4 [X] Nvidia GeForce RTX 3090 FE AMD Ryzen 9 7950X 4.5GHz
NVIDIA GeForce RTX 3090
min:
30.2 fps, P0.1:
41 fps, P1:
66.1 fps, max:
134.8 fps
fps
90%
NVIDIA GeForce RTX 3080:
83.5 [X] Desktop-PC Intel Core i9-12900K 3.2GHz
NVIDIA GeForce RTX 3080
min:
33.6 fps, P0.1:
40.6 fps, P1:
52.3 fps, max:
151.9 fps
fps
100%
NVIDIA GeForce RTX 3090:
53.1 [X] Nvidia GeForce RTX 3090 FE AMD Ryzen 9 7950X 4.5GHz
NVIDIA GeForce RTX 3090
min:
24.6 fps, P0.1:
28.2 fps, P1:
43.5 fps, max:
117.5 fps
fps
91%
NVIDIA GeForce RTX 3080:
48.5 [X] Desktop-PC Intel Core i9-12900K 3.2GHz
NVIDIA GeForce RTX 3080
min:
26.6 fps, P0.1:
28.5 fps, P1:
32.9 fps, max:
107 fps
fps
100%
NVIDIA GeForce RTX 3090:
174.2 [X] Nvidia GeForce RTX 3090 FE Intel Core i9-14900K 3.2GHz
NVIDIA GeForce RTX 3090
min:
47.9 fps, P0.1:
87.3 fps, P1:
111.1 fps, max:
713 fps
177 [X] Nvidia GeForce RTX 3090 FE AMD Ryzen 9 7950X 4.5GHz
NVIDIA GeForce RTX 3090
min:
39.6 fps, P0.1:
63.9 fps, P1:
104.7 fps, max:
679 fps
~ 176 fps
71%
NVIDIA GeForce RTX 3080:
124.8 [X] Desktop-PC Intel Core i9-12900K 3.2GHz
NVIDIA GeForce RTX 3080
min:
38.2 fps, P0.1:
49.3 fps, P1:
80.5 fps, max:
429 fps
fps
100%
NVIDIA GeForce RTX 3090:
166.9 [X] Nvidia GeForce RTX 3090 FE Intel Core i9-14900K 3.2GHz
NVIDIA GeForce RTX 3090
min:
38.7 fps, P0.1:
85.7 fps, P1:
105.1 fps, max:
925 fps
170.7 [X] Nvidia GeForce RTX 3090 FE AMD Ryzen 9 7950X 4.5GHz
NVIDIA GeForce RTX 3090
min:
30.9 fps, P0.1:
79.2 fps, P1:
105.1 fps, max:
617 fps
~ 169 fps
72%
NVIDIA GeForce RTX 3080:
121.7 [X] Desktop-PC Intel Core i9-12900K 3.2GHz
NVIDIA GeForce RTX 3080
min:
37.7 fps, P0.1:
69.2 fps, P1:
82.2 fps, max:
442 fps
fps
100%
NVIDIA GeForce RTX 3090:
144 [X] Nvidia GeForce RTX 3090 FE Intel Core i9-14900K 3.2GHz
NVIDIA GeForce RTX 3090
min:
45.9 fps, P0.1:
81.4 fps, P1:
92.1 fps, max:
398 fps
150.8 [X] Nvidia GeForce RTX 3090 FE AMD Ryzen 9 7950X 4.5GHz
NVIDIA GeForce RTX 3090
min:
49.6 fps, P0.1:
67.7 fps, P1:
94.4 fps, max:
514 fps
~ 147 fps
73%
NVIDIA GeForce RTX 3080:
107 [X] Desktop-PC Intel Core i9-12900K 3.2GHz
NVIDIA GeForce RTX 3080
min:
28.7 fps, P0.1:
53.7 fps, P1:
72.8 fps, max:
401 fps
fps
100%
NVIDIA GeForce RTX 3090:
145 [X] Nvidia GeForce RTX 3090 FE Intel Core i9-14900K 3.2GHz
NVIDIA GeForce RTX 3090
min:
42.8 fps, P0.1:
78.7 fps, P1:
92.8 fps, max:
699 fps
150.3 [X] Nvidia GeForce RTX 3090 FE AMD Ryzen 9 7950X 4.5GHz
NVIDIA GeForce RTX 3090
min:
43.5 fps, P0.1:
80.6 fps, P1:
93.8 fps, max:
640 fps
~ 148 fps
68%
NVIDIA GeForce RTX 3080:
100.9 [X] Desktop-PC Intel Core i9-12900K 3.2GHz
NVIDIA GeForce RTX 3080
min:
36.3 fps, P0.1:
49.6 fps, P1:
70.7 fps, max:
303 fps
fps
100%
NVIDIA GeForce RTX 3090:
100.1 [X] Nvidia GeForce RTX 3090 FE Intel Core i9-14900K 3.2GHz
NVIDIA GeForce RTX 3090
min:
46.8 fps, P0.1:
59.1 fps, P1:
70.2 fps, max:
302 fps
104.9 [X] Nvidia GeForce RTX 3090 FE AMD Ryzen 9 7950X 4.5GHz
NVIDIA GeForce RTX 3090
min:
38.6 fps, P0.1:
59.7 fps, P1:
74.6 fps, max:
362 fps
~ 103 fps
70%
NVIDIA GeForce RTX 3080:
72.1 [X] Desktop-PC Intel Core i9-12900K 3.2GHz
NVIDIA GeForce RTX 3080
min:
34 fps, P0.1:
44 fps, P1:
50.4 fps, max:
161 fps
fps
100%
NVIDIA GeForce RTX 3090:
52.6 [X] Nvidia GeForce RTX 3090 FE Intel Core i9-14900K 3.2GHz
NVIDIA GeForce RTX 3090
min:
31.6 fps, P0.1:
38.2 fps, P1:
41.2 fps, max:
204 fps
56.1 [X] Nvidia GeForce RTX 3090 FE AMD Ryzen 9 7950X 4.5GHz
NVIDIA GeForce RTX 3090
min:
37.5 fps, P0.1:
39.4 fps, P1:
43.9 fps, max:
106.1 fps
~ 54 fps
72%
NVIDIA GeForce RTX 3080:
39.1 [X] Desktop-PC Intel Core i9-12900K 3.2GHz
NVIDIA GeForce RTX 3080
min:
21.5 fps, P0.1:
24 fps, P1:
31.8 fps, max:
137.9 fps
fps
100%
NVIDIA GeForce RTX 3090:
296 [X] Nvidia GeForce RTX 3090 FE AMD Ryzen 9 7950X 4.5GHz
NVIDIA GeForce RTX 3090
min:
77.2 fps, P0.1:
138.9 fps, P1:
222 fps, max:
415 fps
fps
100%
NVIDIA GeForce RTX 3090:
260 [X] Nvidia GeForce RTX 3090 FE AMD Ryzen 9 7950X 4.5GHz
NVIDIA GeForce RTX 3090
min:
73.8 fps, P0.1:
136.5 fps, P1:
190.9 fps, max:
380 fps
fps
99%
NVIDIA GeForce RTX 3080:
257 [X] Desktop-PC Intel Core i9-12900K 3.2GHz
NVIDIA GeForce RTX 3080
min:
56.6 fps, P0.1:
145.9 fps, P1:
183.2 fps, max:
375 fps
fps
100%
NVIDIA GeForce RTX 3090:
229 [X] Nvidia GeForce RTX 3090 FE AMD Ryzen 9 7950X 4.5GHz
NVIDIA GeForce RTX 3090
min:
70.5 fps, P0.1:
119.9 fps, P1:
171 fps, max:
344 fps
fps
97%
NVIDIA GeForce RTX 3080:
222 [X] Desktop-PC Intel Core i9-12900K 3.2GHz
NVIDIA GeForce RTX 3080
min:
61.5 fps, P0.1:
141.2 fps, P1:
166.3 fps, max:
335 fps
fps
100%
NVIDIA GeForce RTX 3090:
208 [X] Nvidia GeForce RTX 3090 FE AMD Ryzen 9 7950X 4.5GHz
NVIDIA GeForce RTX 3090
min:
40.6 fps, P0.1:
124.6 fps, P1:
154.4 fps, max:
319 fps
fps
92%
NVIDIA GeForce RTX 3080:
191.6 [X] Desktop-PC Intel Core i9-12900K 3.2GHz
NVIDIA GeForce RTX 3080
min:
97.6 fps, P0.1:
121.2 fps, P1:
132.8 fps, max:
307 fps
fps
100%
NVIDIA GeForce RTX 3090:
169.6 [X] Nvidia GeForce RTX 3090 FE AMD Ryzen 9 7950X 4.5GHz
NVIDIA GeForce RTX 3090
min:
24.4 fps, P0.1:
96.8 fps, P1:
120.4 fps, max:
280 fps
fps
91%
NVIDIA GeForce RTX 3080:
154 [X] Desktop-PC Intel Core i9-12900K 3.2GHz
NVIDIA GeForce RTX 3080
min:
88.1 fps, P0.1:
98.8 fps, P1:
106.1 fps, max:
302 fps
fps
100%
NVIDIA GeForce RTX 3090:
97.8 [X] Nvidia GeForce RTX 3090 FE AMD Ryzen 9 7950X 4.5GHz
NVIDIA GeForce RTX 3090
min:
42 fps, P0.1:
67.4 fps, P1:
76 fps, max:
170.3 fps
fps
90%
NVIDIA GeForce RTX 3080:
87.8 [X] Desktop-PC Intel Core i9-12900K 3.2GHz
NVIDIA GeForce RTX 3080
min:
54.2 fps, P0.1:
63.3 fps, P1:
66.9 fps, max:
158.3 fps
fps
100%
NVIDIA GeForce RTX 3090:
384 [X] Nvidia GeForce RTX 3090 FE AMD Ryzen 9 7950X 4.5GHz
NVIDIA GeForce RTX 3090
min:
87.6 fps, P0.1:
215 fps, P1:
300 fps, max:
561 fps
fps
91%
NVIDIA GeForce RTX 3080:
348 [X] Desktop-PC Intel Core i9-12900K 3.2GHz
NVIDIA GeForce RTX 3080
min:
86.5 fps, P0.1:
165.6 fps, P1:
235 fps, max:
489 fps
fps
100%
NVIDIA GeForce RTX 3090:
303 [X] Nvidia GeForce RTX 3090 FE AMD Ryzen 9 7950X 4.5GHz
NVIDIA GeForce RTX 3090
min:
78.6 fps, P0.1:
141.5 fps, P1:
192.9 fps, max:
456 fps
fps
91%
NVIDIA GeForce RTX 3080:
275 [X] Desktop-PC Intel Core i9-12900K 3.2GHz
NVIDIA GeForce RTX 3080
min:
89.4 fps, P0.1:
128.8 fps, P1:
168.4 fps, max:
428 fps
fps
100%
NVIDIA GeForce RTX 3090:
230 [X] Nvidia GeForce RTX 3090 FE AMD Ryzen 9 7950X 4.5GHz
NVIDIA GeForce RTX 3090
min:
84.5 fps, P0.1:
126.5 fps, P1:
156.5 fps, max:
387 fps
fps
90%
NVIDIA GeForce RTX 3080:
206 [X] Desktop-PC Intel Core i9-12900K 3.2GHz
NVIDIA GeForce RTX 3080
min:
61.4 fps, P0.1:
102.3 fps, P1:
129.9 fps, max:
320 fps
fps
100%
NVIDIA GeForce RTX 3090:
189.7 [X] Nvidia GeForce RTX 3090 FE AMD Ryzen 9 7950X 4.5GHz
NVIDIA GeForce RTX 3090
min:
61.3 fps, P0.1:
110.2 fps, P1:
131.5 fps, max:
325 fps
fps
90%
NVIDIA GeForce RTX 3080:
170.9 [X] Desktop-PC Intel Core i9-12900K 3.2GHz
NVIDIA GeForce RTX 3080
min:
56.5 fps, P0.1:
88.5 fps, P1:
108.8 fps, max:
299 fps
fps
100%
NVIDIA GeForce RTX 3090:
121.4 [X] Nvidia GeForce RTX 3090 FE AMD Ryzen 9 7950X 4.5GHz
NVIDIA GeForce RTX 3090
min:
52.1 fps, P0.1:
55.6 fps, P1:
80.1 fps, max:
253 fps
fps
89%
NVIDIA GeForce RTX 3080:
108.5 [X] Desktop-PC Intel Core i9-12900K 3.2GHz
NVIDIA GeForce RTX 3080
min:
53.5 fps, P0.1:
55.3 fps, P1:
65.9 fps, max:
240 fps
fps
100%
NVIDIA GeForce RTX 3090:
52.7 [X] Nvidia GeForce RTX 3090 FE AMD Ryzen 9 7950X 4.5GHz
NVIDIA GeForce RTX 3090
min:
23.3 fps, P0.1:
23.7 fps, P1:
28.9 fps, max:
233 fps
fps
83%
NVIDIA GeForce RTX 3080:
44 [X] Desktop-PC Intel Core i9-12900K 3.2GHz
NVIDIA GeForce RTX 3080
min:
20 fps, P0.1:
20.2 fps, P1:
22.9 fps, max:
182.5 fps
fps
100%
NVIDIA GeForce RTX 3090:
207 [X] Nvidia GeForce RTX 3090 FE AMD Ryzen 9 7950X 4.5GHz
NVIDIA GeForce RTX 3090
fps
108%
NVIDIA GeForce RTX 3080 Ti:
223 [X] AMD Ryzen 9 7950X 4.5GHz
NVIDIA GeForce RTX 3080 Ti
fps
100%
NVIDIA GeForce RTX 3090:
185 [X] Nvidia GeForce RTX 3090 FE AMD Ryzen 9 7950X 4.5GHz
NVIDIA GeForce RTX 3090
fps
104%
NVIDIA GeForce RTX 3080 Ti:
192 [X] AMD Ryzen 9 7950X 4.5GHz
NVIDIA GeForce RTX 3080 Ti
fps
96%
NVIDIA GeForce RTX 3080:
178 [X] Desktop-PC Intel Core i9-12900K 3.2GHz
NVIDIA GeForce RTX 3080
fps
100%
NVIDIA GeForce RTX 3090:
133 [X] Nvidia GeForce RTX 3090 FE AMD Ryzen 9 7950X 4.5GHz
NVIDIA GeForce RTX 3090
fps
102%
NVIDIA GeForce RTX 3080 Ti:
136 [X] AMD Ryzen 9 7950X 4.5GHz
NVIDIA GeForce RTX 3080 Ti
fps
95%
NVIDIA GeForce RTX 3080:
126 [X] Desktop-PC Intel Core i9-12900K 3.2GHz
NVIDIA GeForce RTX 3080
fps
100%
NVIDIA GeForce RTX 3090:
132 [X] Nvidia GeForce RTX 3090 FE AMD Ryzen 9 7950X 4.5GHz
NVIDIA GeForce RTX 3090
fps
102%
NVIDIA GeForce RTX 3080 Ti:
135 [X] AMD Ryzen 9 7950X 4.5GHz
NVIDIA GeForce RTX 3080 Ti
fps
95%
NVIDIA GeForce RTX 3080:
125 [X] Desktop-PC Intel Core i9-12900K 3.2GHz
NVIDIA GeForce RTX 3080
fps
100%
NVIDIA GeForce RTX 3090:
101 [X] Nvidia GeForce RTX 3090 FE AMD Ryzen 9 7950X 4.5GHz
NVIDIA GeForce RTX 3090
fps
101%
NVIDIA GeForce RTX 3080 Ti:
102 [X] AMD Ryzen 9 7950X 4.5GHz
NVIDIA GeForce RTX 3080 Ti
fps
95%
NVIDIA GeForce RTX 3080:
95.9 [X] Desktop-PC Intel Core i9-12900K 3.2GHz
NVIDIA GeForce RTX 3080
fps
100%
NVIDIA GeForce RTX 3090:
62 [X] Nvidia GeForce RTX 3090 FE AMD Ryzen 9 7950X 4.5GHz
NVIDIA GeForce RTX 3090
fps
102%
NVIDIA GeForce RTX 3080 Ti:
63 [X] AMD Ryzen 9 7950X 4.5GHz
NVIDIA GeForce RTX 3080 Ti
fps
95%
NVIDIA GeForce RTX 3080:
58.6 [X] Desktop-PC Intel Core i9-12900K 3.2GHz
NVIDIA GeForce RTX 3080
fps
100%
NVIDIA GeForce RTX 3090:
184.8 [X] Nvidia GeForce RTX 3090 FE AMD Ryzen 9 7950X 4.5GHz
NVIDIA GeForce RTX 3090
min:
95.6 fps, P0.1:
115.5 fps, P1:
138 fps, max:
227 fps
fps
102%
NVIDIA GeForce RTX 3080 Ti:
187.7 [X] AMD Ryzen 9 7950X 4.5GHz
NVIDIA GeForce RTX 3080 Ti
min:
83.9 fps, P0.1:
118 fps, P1:
142 fps, max:
234 fps
fps
100%
NVIDIA GeForce RTX 3090:
176.9 [X] Nvidia GeForce RTX 3090 FE AMD Ryzen 9 7950X 4.5GHz
NVIDIA GeForce RTX 3090
min:
85.1 fps, P0.1:
114.9 fps, P1:
131 fps, max:
224 fps
fps
99%
NVIDIA GeForce RTX 3080 Ti:
175.2 [X] AMD Ryzen 9 7950X 4.5GHz
NVIDIA GeForce RTX 3080 Ti
min:
80.3 fps, P0.1:
115.1 fps, P1:
129.5 fps, max:
224 fps
fps
101%
NVIDIA GeForce RTX 3080:
178.5 [X] Desktop-PC Intel Core i9-12900K 3.2GHz
NVIDIA GeForce RTX 3080
min:
85.8 fps, P0.1:
113.2 fps, P1:
138 fps, max:
233 fps
fps
100%
NVIDIA GeForce RTX 3090:
158.9 [X] Nvidia GeForce RTX 3090 FE AMD Ryzen 9 7950X 4.5GHz
NVIDIA GeForce RTX 3090
min:
48 fps, P0.1:
83.7 fps, P1:
113.3 fps, max:
208 fps
fps
99%
NVIDIA GeForce RTX 3080 Ti:
156.6 [X] AMD Ryzen 9 7950X 4.5GHz
NVIDIA GeForce RTX 3080 Ti
min:
64.8 fps, P0.1:
100.9 fps, P1:
116.2 fps, max:
204 fps
fps
101%
NVIDIA GeForce RTX 3080:
161 [X] Desktop-PC Intel Core i9-12900K 3.2GHz
NVIDIA GeForce RTX 3080
min:
43 fps, P0.1:
97.3 fps, P1:
120 fps, max:
203 fps
fps
100%
NVIDIA GeForce RTX 3090:
140.2 [X] Nvidia GeForce RTX 3090 FE AMD Ryzen 9 7950X 4.5GHz
NVIDIA GeForce RTX 3090
min:
28 fps, P0.1:
59 fps, P1:
100.3 fps, max:
196.3 fps
fps
100%
NVIDIA GeForce RTX 3080 Ti:
139.9 [X] AMD Ryzen 9 7950X 4.5GHz
NVIDIA GeForce RTX 3080 Ti
min:
80.1 fps, P0.1:
87.7 fps, P1:
103.4 fps, max:
196 fps
fps
101%
NVIDIA GeForce RTX 3080:
141.5 [X] Desktop-PC Intel Core i9-12900K 3.2GHz
NVIDIA GeForce RTX 3080
min:
16.4 fps, P0.1:
71.3 fps, P1:
101.2 fps, max:
208 fps
fps
100%
NVIDIA GeForce RTX 3090:
132.5 [X] Nvidia GeForce RTX 3090 FE AMD Ryzen 9 7950X 4.5GHz
NVIDIA GeForce RTX 3090
min:
39.1 fps, P0.1:
59.5 fps, P1:
95.7 fps, max:
181.6 fps
fps
100%
NVIDIA GeForce RTX 3080 Ti:
132.4 [X] AMD Ryzen 9 7950X 4.5GHz
NVIDIA GeForce RTX 3080 Ti
min:
39.7 fps, P0.1:
62 fps, P1:
95.3 fps, max:
189 fps
fps
99%
NVIDIA GeForce RTX 3080:
131.1 [X] Desktop-PC Intel Core i9-12900K 3.2GHz
NVIDIA GeForce RTX 3080
min:
38.9 fps, P0.1:
79.9 fps, P1:
97.5 fps, max:
180.5 fps
fps
100%
NVIDIA GeForce RTX 3090:
83.5 [X] Nvidia GeForce RTX 3090 FE AMD Ryzen 9 7950X 4.5GHz
NVIDIA GeForce RTX 3090
min:
42.7 fps, P0.1:
55.3 fps, P1:
68.1 fps, max:
141.4 fps
fps
93%
NVIDIA GeForce RTX 3080 Ti:
77.8 [X] AMD Ryzen 9 7950X 4.5GHz
NVIDIA GeForce RTX 3080 Ti
min:
36.7 fps, P0.1:
57.1 fps, P1:
64.5 fps, max:
141.3 fps
fps
93%
NVIDIA GeForce RTX 3080:
77.6 [X] Desktop-PC Intel Core i9-12900K 3.2GHz
NVIDIA GeForce RTX 3080
min:
26.5 fps, P0.1:
53.6 fps, P1:
61.8 fps, max:
127.6 fps
fps
100%
NVIDIA GeForce RTX 3090:
197.6 [X] Nvidia GeForce RTX 3090 FE AMD Ryzen 9 7950X 4.5GHz
NVIDIA GeForce RTX 3090
min:
89.4 fps, P0.1:
98.1 fps, P1:
142.9 fps, max:
254 fps
fps
103%
NVIDIA GeForce RTX 3080 Ti:
203 [X] AMD Ryzen 9 7950X 4.5GHz
NVIDIA GeForce RTX 3080 Ti
min:
87.6 fps, P0.1:
104.8 fps, P1:
147.8 fps, max:
261 fps
fps
100%
NVIDIA GeForce RTX 3090:
185.3 [X] Nvidia GeForce RTX 3090 FE AMD Ryzen 9 7950X 4.5GHz
NVIDIA GeForce RTX 3090
min:
85.7 fps, P0.1:
92.6 fps, P1:
133.6 fps, max:
257 fps
fps
100%
NVIDIA GeForce RTX 3080 Ti:
186.1 [X] AMD Ryzen 9 7950X 4.5GHz
NVIDIA GeForce RTX 3080 Ti
min:
72 fps, P0.1:
95.1 fps, P1:
137.3 fps, max:
256 fps
fps
82%
NVIDIA GeForce RTX 3080:
151.7 [X] Desktop-PC Intel Core i9-12900K 3.2GHz
NVIDIA GeForce RTX 3080
min:
76.8 fps, P0.1:
83.2 fps, P1:
121.1 fps, max:
197.1 fps
fps
100%
NVIDIA GeForce RTX 3090:
179.4 [X] Nvidia GeForce RTX 3090 FE AMD Ryzen 9 7950X 4.5GHz
NVIDIA GeForce RTX 3090
min:
81.1 fps, P0.1:
89.5 fps, P1:
130.4 fps, max:
246 fps
fps
97%
NVIDIA GeForce RTX 3080 Ti:
174.8 [X] AMD Ryzen 9 7950X 4.5GHz
NVIDIA GeForce RTX 3080 Ti
min:
49 fps, P0.1:
91.6 fps, P1:
131 fps, max:
240 fps
fps
84%
NVIDIA GeForce RTX 3080:
150.6 [X] Desktop-PC Intel Core i9-12900K 3.2GHz
NVIDIA GeForce RTX 3080
min:
82.3 fps, P0.1:
88.9 fps, P1:
120.8 fps, max:
178 fps
fps
100%
NVIDIA GeForce RTX 3090:
169.7 [X] Nvidia GeForce RTX 3090 FE AMD Ryzen 9 7950X 4.5GHz
NVIDIA GeForce RTX 3090
min:
57.4 fps, P0.1:
87.1 fps, P1:
125.4 fps, max:
250 fps
fps
100%
NVIDIA GeForce RTX 3080 Ti:
168.9 [X] AMD Ryzen 9 7950X 4.5GHz
NVIDIA GeForce RTX 3080 Ti
min:
75.1 fps, P0.1:
91.1 fps, P1:
125.6 fps, max:
248 fps
fps
88%
NVIDIA GeForce RTX 3080:
149 [X] Desktop-PC Intel Core i9-12900K 3.2GHz
NVIDIA GeForce RTX 3080
min:
77 fps, P0.1:
83.6 fps, P1:
118.4 fps, max:
187.7 fps
fps
100%
NVIDIA GeForce RTX 3090:
133.1 [X] Nvidia GeForce RTX 3090 FE AMD Ryzen 9 7950X 4.5GHz
NVIDIA GeForce RTX 3090
min:
63 fps, P0.1:
86.4 fps, P1:
106 fps, max:
257 fps
fps
101%
NVIDIA GeForce RTX 3080 Ti:
134.6 [X] AMD Ryzen 9 7950X 4.5GHz
NVIDIA GeForce RTX 3080 Ti
min:
57 fps, P0.1:
88.3 fps, P1:
105.2 fps, max:
245 fps
fps
93%
NVIDIA GeForce RTX 3080:
123.7 [X] Desktop-PC Intel Core i9-12900K 3.2GHz
NVIDIA GeForce RTX 3080
min:
44.1 fps, P0.1:
82.5 fps, P1:
103.7 fps, max:
145.9 fps
fps
100%
NVIDIA GeForce RTX 3090:
79.9 [X] Nvidia GeForce RTX 3090 FE AMD Ryzen 9 7950X 4.5GHz
NVIDIA GeForce RTX 3090
min:
60.5 fps, P0.1:
63.5 fps, P1:
67.5 fps, max:
167.8 fps
fps
103%
NVIDIA GeForce RTX 3080 Ti:
82.1 [X] AMD Ryzen 9 7950X 4.5GHz
NVIDIA GeForce RTX 3080 Ti
min:
66.2 fps, P0.1:
68.4 fps, P1:
70.4 fps, max:
159.7 fps
fps
91%
NVIDIA GeForce RTX 3080:
73.1 [X] Desktop-PC Intel Core i9-12900K 3.2GHz
NVIDIA GeForce RTX 3080
min:
60.2 fps, P0.1:
62.4 fps, P1:
65.9 fps, max:
84.7 fps
fps
100%
NVIDIA GeForce RTX 3090:
205 [X] Nvidia GeForce RTX 3090 FE AMD Ryzen 9 7950X 4.5GHz
NVIDIA GeForce RTX 3090
fps
88%
NVIDIA GeForce RTX 3080 Ti:
180 [X] AMD Ryzen 9 7950X 4.5GHz
NVIDIA GeForce RTX 3080 Ti
fps
100%
NVIDIA GeForce RTX 3090:
183 [X] Nvidia GeForce RTX 3090 FE AMD Ryzen 9 7950X 4.5GHz
NVIDIA GeForce RTX 3090
fps
93%
NVIDIA GeForce RTX 3080 Ti:
170 [X] AMD Ryzen 9 7950X 4.5GHz
NVIDIA GeForce RTX 3080 Ti
fps
114%
NVIDIA GeForce RTX 3080:
209 [X] Desktop-PC Intel Core i9-12900K 3.2GHz
NVIDIA GeForce RTX 3080
min:
143 fps
fps
100%
NVIDIA GeForce RTX 3090:
145 [X] Nvidia GeForce RTX 3090 FE AMD Ryzen 9 7950X 4.5GHz
NVIDIA GeForce RTX 3090
fps
97%
NVIDIA GeForce RTX 3080 Ti:
141 [X] AMD Ryzen 9 7950X 4.5GHz
NVIDIA GeForce RTX 3080 Ti
fps
112%
NVIDIA GeForce RTX 3080:
162 [X] Desktop-PC Intel Core i9-12900K 3.2GHz
NVIDIA GeForce RTX 3080
min:
91 fps
fps
100%
NVIDIA GeForce RTX 3090:
139 [X] Nvidia GeForce RTX 3090 FE AMD Ryzen 9 7950X 4.5GHz
NVIDIA GeForce RTX 3090
fps
101%
NVIDIA GeForce RTX 3080 Ti:
140 [X] AMD Ryzen 9 7950X 4.5GHz
NVIDIA GeForce RTX 3080 Ti
fps
115%
NVIDIA GeForce RTX 3080:
160 [X] Desktop-PC Intel Core i9-12900K 3.2GHz
NVIDIA GeForce RTX 3080
min:
91 fps
fps
100%
NVIDIA GeForce RTX 3090:
107 [X] Nvidia GeForce RTX 3090 FE AMD Ryzen 9 7950X 4.5GHz
NVIDIA GeForce RTX 3090
fps
100%
NVIDIA GeForce RTX 3080 Ti:
107 [X] AMD Ryzen 9 7950X 4.5GHz
NVIDIA GeForce RTX 3080 Ti
fps
107%
NVIDIA GeForce RTX 3080:
114 [X] Desktop-PC Intel Core i9-12900K 3.2GHz
NVIDIA GeForce RTX 3080
min:
59 fps
fps
100%
NVIDIA GeForce RTX 3090:
68 [X] Nvidia GeForce RTX 3090 FE AMD Ryzen 9 7950X 4.5GHz
NVIDIA GeForce RTX 3090
fps
103%
NVIDIA GeForce RTX 3080 Ti:
70 [X] AMD Ryzen 9 7950X 4.5GHz
NVIDIA GeForce RTX 3080 Ti
fps
100%
NVIDIA GeForce RTX 3080:
68 [X] Desktop-PC Intel Core i9-12900K 3.2GHz
NVIDIA GeForce RTX 3080
min:
31 fps
fps
100%
NVIDIA GeForce RTX 3090:
105 [X] Nvidia GeForce RTX 3090 FE AMD Ryzen 9 7950X 4.5GHz
NVIDIA GeForce RTX 3090
fps
96%
NVIDIA GeForce RTX 3080 Ti:
101 [X] AMD Ryzen 9 7950X 4.5GHz
NVIDIA GeForce RTX 3080 Ti
fps
100%
NVIDIA GeForce RTX 3090:
122.4 [X] Nvidia GeForce RTX 3090 FE AMD Ryzen 9 7950X 4.5GHz
NVIDIA GeForce RTX 3090
min:
39.9 fps, P0.1:
71.9 fps, P1:
106.1 fps, max:
154.8 fps
fps
100%
NVIDIA GeForce RTX 3080 Ti:
121.8 [X] AMD Ryzen 9 7950X 4.5GHz
NVIDIA GeForce RTX 3080 Ti
min:
78 fps, P0.1:
99.7 fps, P1:
105.2 fps, max:
150.3 fps
fps
100%
NVIDIA GeForce RTX 3090:
119.4 [X] Nvidia GeForce RTX 3090 FE AMD Ryzen 9 7950X 4.5GHz
NVIDIA GeForce RTX 3090
min:
68.8 fps, P0.1:
85.5 fps, P1:
106.1 fps, max:
148.8 fps
fps
99%
NVIDIA GeForce RTX 3080 Ti:
118.4 [X] AMD Ryzen 9 7950X 4.5GHz
NVIDIA GeForce RTX 3080 Ti
min:
35 fps, P0.1:
66.8 fps, P1:
105 fps, max:
146.7 fps
fps
91%
NVIDIA GeForce RTX 3080:
108.2 [X] Desktop-PC Intel Core i9-12900K 3.2GHz
NVIDIA GeForce RTX 3080
min:
81 fps, P0.1:
82.5 fps, P1:
88.4 fps, max:
180 fps
fps
100%
NVIDIA GeForce RTX 3090:
114.8 [X] Nvidia GeForce RTX 3090 FE AMD Ryzen 9 7950X 4.5GHz
NVIDIA GeForce RTX 3090
min:
28.3 fps, P0.1:
71.7 fps, P1:
101.8 fps, max:
135.4 fps
fps
99%
NVIDIA GeForce RTX 3080 Ti:
113.4 [X] AMD Ryzen 9 7950X 4.5GHz
NVIDIA GeForce RTX 3080 Ti
min:
42.8 fps, P0.1:
72.9 fps, P1:
99.5 fps, max:
143.2 fps
fps
93%
NVIDIA GeForce RTX 3080:
106.8 [X] Desktop-PC Intel Core i9-12900K 3.2GHz
NVIDIA GeForce RTX 3080
min:
79.3 fps, P0.1:
82.5 fps, P1:
87.4 fps, max:
153.6 fps
fps
100%
NVIDIA GeForce RTX 3090:
113.1 [X] Nvidia GeForce RTX 3090 FE AMD Ryzen 9 7950X 4.5GHz
NVIDIA GeForce RTX 3090
min:
45.1 fps, P0.1:
87.6 fps, P1:
100 fps, max:
137.8 fps
fps
97%
NVIDIA GeForce RTX 3080 Ti:
109.7 [X] AMD Ryzen 9 7950X 4.5GHz
NVIDIA GeForce RTX 3080 Ti
min:
39.9 fps, P0.1:
63.2 fps, P1:
99.1 fps, max:
122.2 fps
fps
91%
NVIDIA GeForce RTX 3080:
103.4 [X] Desktop-PC Intel Core i9-12900K 3.2GHz
NVIDIA GeForce RTX 3080
min:
77 fps, P0.1:
79.1 fps, P1:
86.3 fps, max:
179.3 fps
fps
100%
NVIDIA GeForce RTX 3090:
92.9 [X] Nvidia GeForce RTX 3090 FE AMD Ryzen 9 7950X 4.5GHz
NVIDIA GeForce RTX 3090
min:
41.7 fps, P0.1:
57 fps, P1:
85.2 fps, max:
151.2 fps
fps
100%
NVIDIA GeForce RTX 3080 Ti:
92.7 [X] AMD Ryzen 9 7950X 4.5GHz
NVIDIA GeForce RTX 3080 Ti
min:
61.6 fps, P0.1:
77.1 fps, P1:
84.2 fps, max:
169.5 fps
fps
95%
NVIDIA GeForce RTX 3080:
88.3 [X] Desktop-PC Intel Core i9-12900K 3.2GHz
NVIDIA GeForce RTX 3080
min:
42.8 fps, P0.1:
60.9 fps, P1:
78.3 fps, max:
182.8 fps
fps
100%
NVIDIA GeForce RTX 3090:
61.4 [X] Nvidia GeForce RTX 3090 FE AMD Ryzen 9 7950X 4.5GHz
NVIDIA GeForce RTX 3090
min:
45.4 fps, P0.1:
55.6 fps, P1:
58.4 fps, max:
67.4 fps
fps
100%
NVIDIA GeForce RTX 3080 Ti:
61.3 [X] AMD Ryzen 9 7950X 4.5GHz
NVIDIA GeForce RTX 3080 Ti
min:
56.5 fps, P0.1:
56.6 fps, P1:
57.7 fps, max:
72.6 fps
fps
93%
NVIDIA GeForce RTX 3080:
57.4 [X] Desktop-PC Intel Core i9-12900K 3.2GHz
NVIDIA GeForce RTX 3080
min:
35.7 fps, P0.1:
52.5 fps, P1:
53.6 fps, max:
106.4 fps
fps
100%
NVIDIA GeForce RTX 3090:
179.4 [X] Nvidia GeForce RTX 3090 FE AMD Ryzen 9 7950X 4.5GHz
NVIDIA GeForce RTX 3090
min:
65.6 fps, P0.1:
83 fps, P1:
128.1 fps, max:
245 fps
fps
100%
NVIDIA GeForce RTX 3080 Ti:
180 [X] AMD Ryzen 9 7950X 4.5GHz
NVIDIA GeForce RTX 3080 Ti
min:
56.7 fps, P0.1:
85.3 fps, P1:
133.1 fps, max:
245 fps
fps
100%
NVIDIA GeForce RTX 3090:
158 [X] Nvidia GeForce RTX 3090 FE AMD Ryzen 9 7950X 4.5GHz
NVIDIA GeForce RTX 3090
min:
69.9 fps, P0.1:
79.9 fps, P1:
118.6 fps, max:
239 fps
fps
100%
NVIDIA GeForce RTX 3080 Ti:
158.5 [X] AMD Ryzen 9 7950X 4.5GHz
NVIDIA GeForce RTX 3080 Ti
min:
71.7 fps, P0.1:
80.7 fps, P1:
120.4 fps, max:
243 fps
fps
73%
NVIDIA GeForce RTX 3080:
114.9 [X] Desktop-PC Intel Core i9-12900K 3.2GHz
NVIDIA GeForce RTX 3080
min:
70.1 fps, P0.1:
80.1 fps, P1:
91.3 fps, max:
177.9 fps
fps
100%
NVIDIA GeForce RTX 3090:
120.9 [X] Nvidia GeForce RTX 3090 FE AMD Ryzen 9 7950X 4.5GHz
NVIDIA GeForce RTX 3090
min:
61.4 fps, P0.1:
76.1 fps, P1:
97 fps, max:
198.5 fps
fps
101%
NVIDIA GeForce RTX 3080 Ti:
122.5 [X] AMD Ryzen 9 7950X 4.5GHz
NVIDIA GeForce RTX 3080 Ti
min:
74.3 fps, P0.1:
83.9 fps, P1:
98.6 fps, max:
202 fps
fps
83%
NVIDIA GeForce RTX 3080:
100.1 [X] Desktop-PC Intel Core i9-12900K 3.2GHz
NVIDIA GeForce RTX 3080
min:
65.2 fps, P0.1:
72.4 fps, P1:
80.6 fps, max:
160 fps
fps
100%
NVIDIA GeForce RTX 3090:
94.4 [X] Nvidia GeForce RTX 3090 FE AMD Ryzen 9 7950X 4.5GHz
NVIDIA GeForce RTX 3090
min:
61.6 fps, P0.1:
65.9 fps, P1:
77.8 fps, max:
177.4 fps
fps
99%
NVIDIA GeForce RTX 3080 Ti:
93.9 [X] AMD Ryzen 9 7950X 4.5GHz
NVIDIA GeForce RTX 3080 Ti
min:
57.3 fps, P0.1:
72 fps, P1:
76.7 fps, max:
148.8 fps
fps
91%
NVIDIA GeForce RTX 3080:
86.3 [X] Desktop-PC Intel Core i9-12900K 3.2GHz
NVIDIA GeForce RTX 3080
min:
57 fps, P0.1:
63.3 fps, P1:
68.6 fps, max:
126.2 fps
fps
100%
NVIDIA GeForce RTX 3090:
70.1 [X] Nvidia GeForce RTX 3090 FE AMD Ryzen 9 7950X 4.5GHz
NVIDIA GeForce RTX 3090
min:
54.5 fps, P0.1:
57 fps, P1:
59.9 fps, max:
95.4 fps
fps
102%
NVIDIA GeForce RTX 3080 Ti:
71.5 [X] AMD Ryzen 9 7950X 4.5GHz
NVIDIA GeForce RTX 3080 Ti
min:
56.7 fps, P0.1:
58 fps, P1:
60.8 fps, max:
129.3 fps
fps
93%
NVIDIA GeForce RTX 3080:
65.1 [X] Desktop-PC Intel Core i9-12900K 3.2GHz
NVIDIA GeForce RTX 3080
min:
48.2 fps, P0.1:
50.5 fps, P1:
53 fps, max:
106.2 fps
fps
100%
NVIDIA GeForce RTX 3090:
41.1 [X] Nvidia GeForce RTX 3090 FE AMD Ryzen 9 7950X 4.5GHz
NVIDIA GeForce RTX 3090
min:
34 fps, P0.1:
34.8 fps, P1:
36.3 fps, max:
50.6 fps
fps
101%
NVIDIA GeForce RTX 3080 Ti:
41.5 [X] AMD Ryzen 9 7950X 4.5GHz
NVIDIA GeForce RTX 3080 Ti
min:
34.3 fps, P0.1:
35.8 fps, P1:
36.5 fps, max:
51 fps
fps
93%
NVIDIA GeForce RTX 3080:
38.3 [X] Desktop-PC Intel Core i9-12900K 3.2GHz
NVIDIA GeForce RTX 3080
min:
25.5 fps, P0.1:
27.6 fps, P1:
32.7 fps, max:
78 fps
fps
100%
NVIDIA GeForce RTX 3090:
343 [X] Nvidia GeForce RTX 3090 FE AMD Ryzen 9 7950X 4.5GHz
NVIDIA GeForce RTX 3090
min:
34.1 fps, P0.1:
227 fps, P1:
268 fps, max:
453 fps
fps
73%
NVIDIA GeForce RTX 3080 Ti:
250 [X] AMD Ryzen 9 7950X 4.5GHz
NVIDIA GeForce RTX 3080 Ti
min:
83.8 fps, P0.1:
173.1 fps, P1:
191.1 fps, max:
308 fps
fps
100%
NVIDIA GeForce RTX 3090:
288 [X] Nvidia GeForce RTX 3090 FE AMD Ryzen 9 7950X 4.5GHz
NVIDIA GeForce RTX 3090
min:
110.7 fps, P0.1:
202 fps, P1:
219 fps, max:
365 fps
fps
86%
NVIDIA GeForce RTX 3080 Ti:
247 [X] AMD Ryzen 9 7950X 4.5GHz
NVIDIA GeForce RTX 3080 Ti
min:
62.7 fps, P0.1:
147.3 fps, P1:
193 fps, max:
296 fps
fps
77%
NVIDIA GeForce RTX 3080:
223 [X] Desktop-PC Intel Core i9-12900K 3.2GHz
NVIDIA GeForce RTX 3080
min:
93.4 fps, P0.1:
137.9 fps, P1:
161.2 fps, max:
280 fps
fps
100%
NVIDIA GeForce RTX 3090:
275 [X] Nvidia GeForce RTX 3090 FE AMD Ryzen 9 7950X 4.5GHz
NVIDIA GeForce RTX 3090
min:
121.1 fps, P0.1:
190.3 fps, P1:
210 fps, max:
341 fps
fps
88%
NVIDIA GeForce RTX 3080 Ti:
243 [X] AMD Ryzen 9 7950X 4.5GHz
NVIDIA GeForce RTX 3080 Ti
min:
33.6 fps, P0.1:
164.8 fps, P1:
189.9 fps, max:
294 fps
fps
74%
NVIDIA GeForce RTX 3080:
203 [X] Desktop-PC Intel Core i9-12900K 3.2GHz
NVIDIA GeForce RTX 3080
min:
57.8 fps, P0.1:
122.4 fps, P1:
144.5 fps, max:
254 fps
fps
100%
NVIDIA GeForce RTX 3090:
263 [X] Nvidia GeForce RTX 3090 FE AMD Ryzen 9 7950X 4.5GHz
NVIDIA GeForce RTX 3090
min:
70.9 fps, P0.1:
177.4 fps, P1:
204 fps, max:
328 fps
fps
92%
NVIDIA GeForce RTX 3080 Ti:
242 [X] AMD Ryzen 9 7950X 4.5GHz
NVIDIA GeForce RTX 3080 Ti
min:
83.3 fps, P0.1:
166.8 fps, P1:
190 fps, max:
295 fps
fps
76%
NVIDIA GeForce RTX 3080:
200 [X] Desktop-PC Intel Core i9-12900K 3.2GHz
NVIDIA GeForce RTX 3080
min:
35.4 fps, P0.1:
123.6 fps, P1:
141.7 fps, max:
254 fps
fps
100%
NVIDIA GeForce RTX 3090:
259 [X] Nvidia GeForce RTX 3090 FE AMD Ryzen 9 7950X 4.5GHz
NVIDIA GeForce RTX 3090
min:
52.6 fps, P0.1:
176.6 fps, P1:
201 fps, max:
327 fps
fps
90%
NVIDIA GeForce RTX 3080 Ti:
234 [X] AMD Ryzen 9 7950X 4.5GHz
NVIDIA GeForce RTX 3080 Ti
min:
35.3 fps, P0.1:
153.4 fps, P1:
177.1 fps, max:
295 fps
fps
74%
NVIDIA GeForce RTX 3080:
191.4 [X] Desktop-PC Intel Core i9-12900K 3.2GHz
NVIDIA GeForce RTX 3080
min:
39.6 fps, P0.1:
114.7 fps, P1:
134.6 fps, max:
254 fps
fps
100%
NVIDIA GeForce RTX 3090:
187 [X] Nvidia GeForce RTX 3090 FE AMD Ryzen 9 7950X 4.5GHz
NVIDIA GeForce RTX 3090
min:
38.3 fps, P0.1:
124 fps, P1:
141.7 fps, max:
293 fps
fps
88%
NVIDIA GeForce RTX 3080 Ti:
165.1 [X] AMD Ryzen 9 7950X 4.5GHz
NVIDIA GeForce RTX 3080 Ti
min:
33.1 fps, P0.1:
111.6 fps, P1:
130.3 fps, max:
236 fps
fps
77%
NVIDIA GeForce RTX 3080:
143.8 [X] Desktop-PC Intel Core i9-12900K 3.2GHz
NVIDIA GeForce RTX 3080
min:
78.4 fps, P0.1:
90.4 fps, P1:
105.5 fps, max:
217 fps
fps
100%
NVIDIA GeForce RTX 3090:
251 [X] Intel Core i5-13400F 2.5GHz
NVIDIA GeForce RTX 3090
min:
48.4 fps, P0.1:
107.8 fps, P1:
169.3 fps, max:
355 fps
270 [X] Intel Core i5-13600K 3.5GHz
NVIDIA GeForce RTX 3090
min:
47.7 fps, P0.1:
127.4 fps, P1:
213 fps, max:
405 fps
279 [X] Intel Core i9-13900K 3GHz
NVIDIA GeForce RTX 3090
min:
59.5 fps, P0.1:
132.6 fps, P1:
226 fps, max:
431 fps
280 [X] NVIDIA GeForce RTX 3090 Founders Edition AMD Ryzen 9 7950X 4.5GHz
NVIDIA GeForce RTX 3090
min:
43.6 fps, P0.1:
143.9 fps, P1:
231 fps, max:
409 fps
282 [X] AMD Ryzen 9 7900X 4.7GHz
NVIDIA GeForce RTX 3090
min:
19.5 fps, P0.1:
110.2 fps, P1:
217 fps, max:
425 fps
285 [X] Nvidia GeForce RTX 3090 FE AMD Ryzen 9 7950X 4.5GHz
NVIDIA GeForce RTX 3090
min:
40.1 fps, P0.1:
115.5 fps, P1:
217 fps, max:
447 fps
~ 275 fps
104%
NVIDIA GeForce RTX 3080 Ti:
285 [X] AMD Ryzen 9 7950X 4.5GHz
NVIDIA GeForce RTX 3080 Ti
min:
25.2 fps, P0.1:
123.6 fps, P1:
220 fps, max:
421 fps
fps
100%
NVIDIA GeForce RTX 3090:
202 [X] Intel Core i5-13400F 2.5GHz
NVIDIA GeForce RTX 3090
min:
53.1 fps, P0.1:
92.8 fps, P1:
139 fps, max:
280 fps
213 [X] Intel Core i5-13600K 3.5GHz
NVIDIA GeForce RTX 3090
min:
59.6 fps, P0.1:
94.1 fps, P1:
164 fps, max:
308 fps
214 [X] NVIDIA GeForce RTX 3090 Founders Edition AMD Ryzen 9 7950X 4.5GHz
NVIDIA GeForce RTX 3090
min:
40.2 fps, P0.1:
88.3 fps, P1:
169.4 fps, max:
356 fps
216 [X] AMD Ryzen 9 7900X 4.7GHz
NVIDIA GeForce RTX 3090
min:
45.8 fps, P0.1:
90.1 fps, P1:
168.1 fps, max:
357 fps
217 [X] Intel Core i9-13900K 3GHz
NVIDIA GeForce RTX 3090
min:
38.2 fps, P0.1:
100.3 fps, P1:
167 fps, max:
339 fps
219 [X] Nvidia GeForce RTX 3090 FE AMD Ryzen 9 7950X 4.5GHz
NVIDIA GeForce RTX 3090
min:
38.1 fps, P0.1:
91.3 fps, P1:
168.5 fps, max:
365 fps
221 [X] Desktop-PC Intel Core i9-12900K 3.2GHz
NVIDIA GeForce RTX 3090
min:
36.9 fps, P0.1:
107.3 fps, P1:
166.8 fps, max:
319 fps
~ 215 fps
102%
NVIDIA GeForce RTX 3080 Ti:
219 [X] AMD Ryzen 9 7950X 4.5GHz
NVIDIA GeForce RTX 3080 Ti
min:
27.4 fps, P0.1:
90.6 fps, P1:
171.5 fps, max:
371 fps
fps
94%
NVIDIA GeForce RTX 3080:
203 [X] Desktop-PC Intel Core i9-12900K 3.2GHz
NVIDIA GeForce RTX 3080
min:
51.5 fps, P0.1:
91.3 fps, P1:
151.9 fps, max:
311 fps
fps
100%
NVIDIA GeForce RTX 3090:
172.4 [X] Intel Core i5-13400F 2.5GHz
NVIDIA GeForce RTX 3090
min:
23.6 fps, P0.1:
74.1 fps, P1:
125.7 fps, max:
251 fps
176.8 [X] NVIDIA GeForce RTX 3090 Founders Edition AMD Ryzen 9 7950X 4.5GHz
NVIDIA GeForce RTX 3090
min:
34.8 fps, P0.1:
71.2 fps, P1:
136.6 fps, max:
289 fps
177.3 [X] Intel Core i9-13900K 3GHz
NVIDIA GeForce RTX 3090
min:
13.6 fps, P0.1:
44 fps, P1:
131.7 fps, max:
454 fps
177.7 [X] AMD Ryzen 9 7900X 4.7GHz
NVIDIA GeForce RTX 3090
min:
25 fps, P0.1:
61.1 fps, P1:
136.6 fps, max:
296 fps
177.9 [X] Intel Core i5-13600K 3.5GHz
NVIDIA GeForce RTX 3090
min:
56.4 fps, P0.1:
90 fps, P1:
137.6 fps, max:
277 fps
180.1 [X] Nvidia GeForce RTX 3090 FE AMD Ryzen 9 7950X 4.5GHz
NVIDIA GeForce RTX 3090
min:
22.5 fps, P0.1:
53.7 fps, P1:
139.8 fps, max:
317 fps
182.7 [X] Desktop-PC Intel Core i9-12900K 3.2GHz
NVIDIA GeForce RTX 3090
min:
26.4 fps, P0.1:
76.2 fps, P1:
139.5 fps, max:
275 fps
~ 178 fps
102%
NVIDIA GeForce RTX 3080 Ti:
181.5 [X] AMD Ryzen 9 7950X 4.5GHz
NVIDIA GeForce RTX 3080 Ti
min:
22.5 fps, P0.1:
65.1 fps, P1:
140.7 fps, max:
296 fps
fps
94%
NVIDIA GeForce RTX 3080:
166.8 [X] Desktop-PC Intel Core i9-12900K 3.2GHz
NVIDIA GeForce RTX 3080
min:
42.5 fps, P0.1:
76.7 fps, P1:
127.6 fps, max:
257 fps
fps
100%
NVIDIA GeForce RTX 3090:
144.4 [X] AMD Ryzen 9 7900X 4.7GHz
NVIDIA GeForce RTX 3090
min:
32.6 fps, P0.1:
65.5 fps, P1:
116.6 fps, max:
281 fps
144.5 [X] NVIDIA GeForce RTX 3090 Founders Edition AMD Ryzen 9 7950X 4.5GHz
NVIDIA GeForce RTX 3090
min:
28.1 fps, P0.1:
46.8 fps, P1:
115.6 fps, max:
278 fps
144.9 [X] Intel Core i5-13400F 2.5GHz
NVIDIA GeForce RTX 3090
min:
45.9 fps, P0.1:
58 fps, P1:
105.7 fps, max:
218 fps
145.9 [X] Intel Core i5-13600K 3.5GHz
NVIDIA GeForce RTX 3090
min:
50.4 fps, P0.1:
72.8 fps, P1:
117 fps, max:
246 fps
146.1 [X] Intel Core i9-13900K 3GHz
NVIDIA GeForce RTX 3090
min:
48.6 fps, P0.1:
83.8 fps, P1:
119.2 fps, max:
288 fps
146.9 [X] Nvidia GeForce RTX 3090 FE AMD Ryzen 9 7950X 4.5GHz
NVIDIA GeForce RTX 3090
min:
40.3 fps, P0.1:
63.8 fps, P1:
119 fps, max:
269 fps
151.1 [X] Desktop-PC Intel Core i9-12900K 3.2GHz
NVIDIA GeForce RTX 3090
min:
32.5 fps, P0.1:
69.6 fps, P1:
121.4 fps, max:
268 fps
~ 146 fps
102%
NVIDIA GeForce RTX 3080 Ti:
149.1 [X] AMD Ryzen 9 7950X 4.5GHz
NVIDIA GeForce RTX 3080 Ti
min:
32.7 fps, P0.1:
58.1 fps, P1:
118.4 fps, max:
273 fps
fps
92%
NVIDIA GeForce RTX 3080:
134.4 [X] Desktop-PC Intel Core i9-12900K 3.2GHz
NVIDIA GeForce RTX 3080
min:
33.5 fps, P0.1:
61.1 fps, P1:
107.5 fps, max:
242 fps
fps
100%
NVIDIA GeForce RTX 3090:
103.6 [X] AMD Ryzen 9 7900X 4.7GHz
NVIDIA GeForce RTX 3090
min:
30.5 fps, P0.1:
39.4 fps, P1:
85.4 fps, max:
259 fps
104.2 [X] NVIDIA GeForce RTX 3090 Founders Edition AMD Ryzen 9 7950X 4.5GHz
NVIDIA GeForce RTX 3090
min:
24.3 fps, P0.1:
44 fps, P1:
87.8 fps, max:
276 fps
104.6 [X] Intel Core i9-13900K 3GHz
NVIDIA GeForce RTX 3090
min:
37.8 fps, P0.1:
52.3 fps, P1:
88.1 fps, max:
230 fps
105 [X] Intel Core i5-13600K 3.5GHz
NVIDIA GeForce RTX 3090
min:
31.1 fps, P0.1:
45.5 fps, P1:
86.7 fps, max:
238 fps
105 [X] Nvidia GeForce RTX 3090 FE AMD Ryzen 9 7950X 4.5GHz
NVIDIA GeForce RTX 3090
min:
27.9 fps, P0.1:
47.8 fps, P1:
85.9 fps, max:
277 fps
105.2 [X] Intel Core i5-13400F 2.5GHz
NVIDIA GeForce RTX 3090
min:
42.6 fps, P0.1:
55.1 fps, P1:
86.3 fps, max:
195.3 fps
108.7 [X] Desktop-PC Intel Core i9-12900K 3.2GHz
NVIDIA GeForce RTX 3090
min:
42.3 fps, P0.1:
51.9 fps, P1:
90.6 fps, max:
211 fps
~ 105 fps
102%
NVIDIA GeForce RTX 3080 Ti:
106.9 [X] AMD Ryzen 9 7950X 4.5GHz
NVIDIA GeForce RTX 3080 Ti
min:
24 fps, P0.1:
41 fps, P1:
84.6 fps, max:
276 fps
fps
93%
NVIDIA GeForce RTX 3080:
97.2 [X] Desktop-PC Intel Core i9-12900K 3.2GHz
NVIDIA GeForce RTX 3080
min:
40.2 fps, P0.1:
42.1 fps, P1:
81.4 fps, max:
228 fps
fps
100%
NVIDIA GeForce RTX 3090:
55.8 [X] Intel Core i5-13400F 2.5GHz
NVIDIA GeForce RTX 3090
56.5 [X] Nvidia GeForce RTX 3090 FE AMD Ryzen 9 7950X 4.5GHz
NVIDIA GeForce RTX 3090
min:
14.6 fps, P0.1:
24.3 fps, P1:
44.6 fps, max:
233 fps
58.9 [X] AMD Ryzen 9 7900X 4.7GHz
NVIDIA GeForce RTX 3090
min:
20.1 fps, P0.1:
25.4 fps, P1:
47.9 fps, max:
190.7 fps
59 [X] Intel Core i9-13900K 3GHz
NVIDIA GeForce RTX 3090
min:
23.1 fps, P0.1:
26.2 fps, P1:
49.8 fps, max:
141.2 fps
59 [X] NVIDIA GeForce RTX 3090 Founders Edition AMD Ryzen 9 7950X 4.5GHz
NVIDIA GeForce RTX 3090
min:
18.2 fps, P0.1:
24.2 fps, P1:
50.6 fps, max:
232 fps
59.4 [X] Intel Core i5-13600K 3.5GHz
NVIDIA GeForce RTX 3090
min:
21.4 fps, P0.1:
25.6 fps, P1:
49.8 fps, max:
188.8 fps
61.4 [X] Desktop-PC Intel Core i9-12900K 3.2GHz
NVIDIA GeForce RTX 3090
min:
26.5 fps, P0.1:
27.6 fps, P1:
52.5 fps, max:
185.8 fps
~ 59 fps
102%
NVIDIA GeForce RTX 3080 Ti:
60.3 [X] AMD Ryzen 9 7950X 4.5GHz
NVIDIA GeForce RTX 3080 Ti
min:
23.6 fps, P0.1:
26.5 fps, P1:
46.6 fps, max:
211 fps
fps
91%
NVIDIA GeForce RTX 3080:
53.8 [X] Desktop-PC Intel Core i9-12900K 3.2GHz
NVIDIA GeForce RTX 3080
min:
22 fps, P0.1:
24.4 fps, P1:
46 fps, max:
95.1 fps
fps
100%
NVIDIA GeForce RTX 3090:
258 [X] Intel Core i5-12600K 918016
Intel Core i5-12600K 2.8GHz
NVIDIA GeForce RTX 3090
min:
208 fps, P1:
159 fps, max:
307 fps
286 [X] 939134
Intel Core i5-13400F 2.5GHz
NVIDIA GeForce RTX 3090
min:
205 fps, P1:
170 fps, max:
323 fps
316 [X] Desktop-PC Intel Core i9-12900K 3.2GHz
NVIDIA GeForce RTX 3090
min:
235 fps
320 [X] 918016
Intel Core i9-13900K 3GHz
NVIDIA GeForce RTX 3090
min:
269 fps, P1:
180 fps, max:
377 fps
322 [X] 923650
Intel Core i5-13600K 3.5GHz
NVIDIA GeForce RTX 3090
min:
252 fps, P1:
186 fps, max:
368 fps
333 [X] 918016
AMD Ryzen 5 7600X 4.7GHz
NVIDIA GeForce RTX 3090
min:
255 fps, P1:
199 fps, max:
409 fps
344 [X] 914758
AMD Ryzen 9 7900X 4.7GHz
NVIDIA GeForce RTX 3090
min:
260 fps, P1:
201 fps, max:
409 fps
399 [X] AMD Ryzen 7 7700 939134
AMD Ryzen 7 7700 3.8GHz
NVIDIA GeForce RTX 3090
min:
277 fps, P1:
230 fps, max:
500 fps
400 [X] AMD Ryzen 7 7700X 928484
AMD Ryzen 7 7700X 4.5GHz
NVIDIA GeForce RTX 3090
min:
283 fps, P1:
230 fps, max:
503 fps
412 [X] AMD Ryzen 9 7950X 928484
AMD Ryzen 9 7950X 4.5GHz
NVIDIA GeForce RTX 3090
min:
288 fps, P1:
229 fps, max:
511 fps
441 [X] Nvidia GeForce RTX 3090 FE 959964
AMD Ryzen 9 7950X 4.5GHz
NVIDIA GeForce RTX 3090
min:
304 fps, P1:
245 fps, max:
501 fps
457 [X] NVIDIA GeForce RTX 3090 Founders Edition 923650
AMD Ryzen 9 7950X 4.5GHz
NVIDIA GeForce RTX 3090
min:
291 fps, P1:
254 fps, max:
516 fps
~ 357 fps
112%
NVIDIA GeForce RTX 3080 Ti:
367 433 [X] 939134
AMD Ryzen 9 7950X 4.5GHz
NVIDIA GeForce RTX 3080 Ti
min:
317 fps, P1:
236 fps, max:
495 fps
~ 400 fps
100%
NVIDIA GeForce RTX 3090:
280 [X] 939134
Intel Core i5-13400F 2.5GHz
NVIDIA GeForce RTX 3090
min:
213 fps, P1:
170 fps, max:
330 fps
304 [X] Desktop-PC Intel Core i9-12900K 3.2GHz
NVIDIA GeForce RTX 3090
min:
238 fps
338 [X] 918016
Intel Core i9-13900K 3GHz
NVIDIA GeForce RTX 3090
min:
258 fps, P1:
177 fps, max:
374 fps
352 [X] 918016
AMD Ryzen 5 7600X 4.7GHz
NVIDIA GeForce RTX 3090
min:
247 fps, P1:
201 fps, max:
396 fps
361 [X] 914758
AMD Ryzen 9 7900X 4.7GHz
NVIDIA GeForce RTX 3090
min:
251 fps, P1:
201 fps, max:
408 fps
373 [X] 923650
Intel Core i5-13600K 3.5GHz
NVIDIA GeForce RTX 3090
min:
266 fps, P1:
203 fps, max:
438 fps
415 [X] AMD Ryzen 7 7700X 928484
AMD Ryzen 7 7700X 4.5GHz
NVIDIA GeForce RTX 3090
min:
256 fps, P1:
234 fps, max:
480 fps
424 [X] AMD Ryzen 9 7950X 928484
AMD Ryzen 9 7950X 4.5GHz
NVIDIA GeForce RTX 3090
min:
307 fps, P1:
244 fps, max:
476 fps
427 [X] AMD Ryzen 7 7700 939134
AMD Ryzen 7 7700 3.8GHz
NVIDIA GeForce RTX 3090
min:
260 fps, P1:
236 fps, max:
494 fps
432 [X] Nvidia GeForce RTX 3090 FE 959964
AMD Ryzen 9 7950X 4.5GHz
NVIDIA GeForce RTX 3090
min:
333 fps, P1:
242 fps, max:
541 fps
439 [X] NVIDIA GeForce RTX 3090 Founders Edition 923650
AMD Ryzen 9 7950X 4.5GHz
NVIDIA GeForce RTX 3090
min:
303 fps, P1:
244 fps, max:
534 fps
~ 377 fps
102%
NVIDIA GeForce RTX 3080 Ti:
342 430 [X] 939134
AMD Ryzen 9 7950X 4.5GHz
NVIDIA GeForce RTX 3080 Ti
min:
281 fps, P1:
231 fps, max:
547 fps
~ 386 fps
87%
NVIDIA GeForce RTX 3080:
327 [X] Desktop-PC Intel Core i9-12900K 3.2GHz
NVIDIA GeForce RTX 3080
min:
251 fps
fps
100%
NVIDIA GeForce RTX 3090:
265 [X] 939134
Intel Core i5-13400F 2.5GHz
NVIDIA GeForce RTX 3090
min:
205 fps, P1:
159 fps, max:
296 fps
290 [X] Desktop-PC Intel Core i9-12900K 3.2GHz
NVIDIA GeForce RTX 3090
min:
222 fps
308 [X] 918016
Intel Core i9-13900K 3GHz
NVIDIA GeForce RTX 3090
min:
217 fps, P1:
155 fps, max:
359 fps
312 [X] 918016
AMD Ryzen 5 7600X 4.7GHz
NVIDIA GeForce RTX 3090
min:
236 fps, P1:
182 fps, max:
353 fps
321 [X] 914758
AMD Ryzen 9 7900X 4.7GHz
NVIDIA GeForce RTX 3090
min:
220 fps, P1:
187 fps, max:
356 fps
352 [X] AMD Ryzen 7 7700X 928484
AMD Ryzen 7 7700X 4.5GHz
NVIDIA GeForce RTX 3090
min:
279 fps, P1:
210 fps, max:
410 fps
355 [X] AMD Ryzen 9 7950X 928484
AMD Ryzen 9 7950X 4.5GHz
NVIDIA GeForce RTX 3090
min:
278 fps, P1:
216 fps, max:
408 fps
359 [X] Nvidia GeForce RTX 3090 FE 959964
AMD Ryzen 9 7950X 4.5GHz
NVIDIA GeForce RTX 3090
min:
256 fps, P1:
204 fps, max:
414 fps
361 [X] AMD Ryzen 7 7700 939134
AMD Ryzen 7 7700 3.8GHz
NVIDIA GeForce RTX 3090
min:
268 fps, P1:
216 fps, max:
411 fps
369 [X] NVIDIA GeForce RTX 3090 Founders Edition 923650
AMD Ryzen 9 7950X 4.5GHz
NVIDIA GeForce RTX 3090
min:
300 fps, P1:
233 fps, max:
427 fps
432 [X] 923650
Intel Core i5-13600K 3.5GHz
NVIDIA GeForce RTX 3090
min:
313 fps, P1:
274 fps, max:
480 fps
~ 339 fps
101%
NVIDIA GeForce RTX 3080 Ti:
321 365 [X] 939134
AMD Ryzen 9 7950X 4.5GHz
NVIDIA GeForce RTX 3080 Ti
min:
287 fps, P1:
215 fps, max:
426 fps
~ 343 fps
90%
NVIDIA GeForce RTX 3080:
305 [X] Desktop-PC Intel Core i9-12900K 3.2GHz
NVIDIA GeForce RTX 3080
min:
233 fps
fps
100%
NVIDIA GeForce RTX 3090:
122.6 [X] 918016
Intel Core i9-13900K 3GHz
NVIDIA GeForce RTX 3090
min:
104 fps, P1:
98 fps, max:
141 fps
125.1 [X] 914758
AMD Ryzen 9 7900X 4.7GHz
NVIDIA GeForce RTX 3090
min:
108 fps, P1:
100 fps, max:
144 fps
126.4 [X] 918016
AMD Ryzen 5 7600X 4.7GHz
NVIDIA GeForce RTX 3090
min:
109 fps, P1:
100 fps, max:
145 fps
127.2 [X] AMD Ryzen 7 7700X 928484
AMD Ryzen 7 7700X 4.5GHz
NVIDIA GeForce RTX 3090
min:
109 fps, P1:
102 fps, max:
148 fps
127.9 [X] AMD Ryzen 9 7950X 928484
AMD Ryzen 9 7950X 4.5GHz
NVIDIA GeForce RTX 3090
min:
109 fps, P1:
101 fps, max:
151 fps
128.1 [X] 923650
Intel Core i5-13600K 3.5GHz
NVIDIA GeForce RTX 3090
min:
110 fps, P1:
102 fps, max:
149 fps
128.1 [X] 939134
Intel Core i5-13400F 2.5GHz
NVIDIA GeForce RTX 3090
min:
111 fps, P1:
97 fps, max:
149 fps
128.7 [X] Intel Core i5-12600K 918016
Intel Core i5-12600K 2.8GHz
NVIDIA GeForce RTX 3090
min:
104 fps, P1:
93 fps, max:
154 fps
130.1 [X] NVIDIA GeForce RTX 3090 Founders Edition 923650
AMD Ryzen 9 7950X 4.5GHz
NVIDIA GeForce RTX 3090
min:
111 fps, P1:
102 fps, max:
154 fps
131 [X] Desktop-PC Intel Core i9-12900K 3.2GHz
NVIDIA GeForce RTX 3090
min:
109 fps
131.7 [X] Nvidia GeForce RTX 3090 FE 959964
AMD Ryzen 9 7950X 4.5GHz
NVIDIA GeForce RTX 3090
min:
113 fps, P1:
103 fps, max:
154 fps
136.9 [X] AMD Ryzen 7 7700 939134
AMD Ryzen 7 7700 3.8GHz
NVIDIA GeForce RTX 3090
min:
117 fps, P1:
106 fps, max:
159 fps
~ 129 fps
101%
NVIDIA GeForce RTX 3080 Ti:
128.8 131.6 [X] 939134
AMD Ryzen 9 7950X 4.5GHz
NVIDIA GeForce RTX 3080 Ti
min:
112 fps, P1:
103 fps, max:
154 fps
~ 130 fps
95%
NVIDIA GeForce RTX 3080:
123 [X] Desktop-PC Intel Core i9-12900K 3.2GHz
NVIDIA GeForce RTX 3080
min:
99 fps
fps
100%
NVIDIA GeForce RTX 3090:
82.5 [X] 918016
Intel Core i9-13900K 3GHz
NVIDIA GeForce RTX 3090
min:
70 fps, P1:
69 fps, max:
97 fps
83.3 [X] AMD Ryzen 9 7950X 928484
AMD Ryzen 9 7950X 4.5GHz
NVIDIA GeForce RTX 3090
min:
71 fps, P1:
70 fps, max:
97 fps
83.8 [X] 914758
AMD Ryzen 9 7900X 4.7GHz
NVIDIA GeForce RTX 3090
min:
71 fps, P1:
71 fps, max:
97 fps
83.9 [X] AMD Ryzen 7 7700X 928484
AMD Ryzen 7 7700X 4.5GHz
NVIDIA GeForce RTX 3090
min:
71 fps, P1:
70 fps, max:
99 fps
84.1 [X] 923650
Intel Core i5-13600K 3.5GHz
NVIDIA GeForce RTX 3090
min:
72 fps, P1:
71 fps, max:
98 fps
84.4 [X] 918016
AMD Ryzen 5 7600X 4.7GHz
NVIDIA GeForce RTX 3090
min:
71 fps, P1:
71 fps, max:
100 fps
84.4 [X] NVIDIA GeForce RTX 3090 Founders Edition 923650
AMD Ryzen 9 7950X 4.5GHz
NVIDIA GeForce RTX 3090
min:
72 fps, P1:
70 fps, max:
99 fps
84.7 [X] 939134
Intel Core i5-13400F 2.5GHz
NVIDIA GeForce RTX 3090
min:
73 fps, P1:
72 fps, max:
100 fps
87.6 [X] Nvidia GeForce RTX 3090 FE 959964
AMD Ryzen 9 7950X 4.5GHz
NVIDIA GeForce RTX 3090
min:
76 fps, P1:
74 fps, max:
104 fps
88 [X] Desktop-PC Intel Core i9-12900K 3.2GHz
NVIDIA GeForce RTX 3090
min:
77 fps
89.9 [X] AMD Ryzen 7 7700 939134
AMD Ryzen 7 7700 3.8GHz
NVIDIA GeForce RTX 3090
min:
78 fps, P1:
75 fps, max:
106 fps
~ 85 fps
101%
NVIDIA GeForce RTX 3080 Ti:
85.6 86.6 [X] 939134
AMD Ryzen 9 7950X 4.5GHz
NVIDIA GeForce RTX 3080 Ti
min:
74 fps, P1:
73 fps, max:
103 fps
~ 86 fps
93%
NVIDIA GeForce RTX 3080:
79 [X] Desktop-PC Intel Core i9-12900K 3.2GHz
NVIDIA GeForce RTX 3080
min:
64 fps
fps
100%
NVIDIA GeForce RTX 3090:
41.8 [X] 918016
Intel Core i9-13900K 3GHz
NVIDIA GeForce RTX 3090
min:
35 fps, P1:
31 fps, max:
49 fps
42 [X] AMD Ryzen 9 7950X 928484
AMD Ryzen 9 7950X 4.5GHz
NVIDIA GeForce RTX 3090
min:
35 fps, P1:
35 fps, max:
49 fps
42 [X] AMD Ryzen 7 7700X 928484
AMD Ryzen 7 7700X 4.5GHz
NVIDIA GeForce RTX 3090
min:
35 fps, P1:
35 fps, max:
49 fps
42.4 [X] 914758
AMD Ryzen 9 7900X 4.7GHz
NVIDIA GeForce RTX 3090
min:
36 fps, P1:
35 fps, max:
49 fps
42.4 [X] 923650
Intel Core i5-13600K 3.5GHz
NVIDIA GeForce RTX 3090
min:
36 fps, P1:
35 fps, max:
50 fps
42.6 [X] 918016
AMD Ryzen 5 7600X 4.7GHz
NVIDIA GeForce RTX 3090
min:
36 fps, P1:
35 fps, max:
51 fps
42.6 [X] NVIDIA GeForce RTX 3090 Founders Edition 923650
AMD Ryzen 9 7950X 4.5GHz
NVIDIA GeForce RTX 3090
min:
36 fps, P1:
28 fps, max:
49 fps
43 [X] 939134
Intel Core i5-13400F 2.5GHz
NVIDIA GeForce RTX 3090
min:
36 fps, P1:
30 fps, max:
50 fps
44.2 [X] Nvidia GeForce RTX 3090 FE 959964
AMD Ryzen 9 7950X 4.5GHz
NVIDIA GeForce RTX 3090
min:
37 fps, P1:
37 fps, max:
52 fps
45 [X] Desktop-PC Intel Core i9-12900K 3.2GHz
NVIDIA GeForce RTX 3090
min:
39 fps
45.7 [X] AMD Ryzen 7 7700 939134
AMD Ryzen 7 7700 3.8GHz
NVIDIA GeForce RTX 3090
min:
38 fps, P1:
38 fps, max:
54 fps
~ 43 fps
100%
NVIDIA GeForce RTX 3080 Ti:
43 43.4 [X] 939134
AMD Ryzen 9 7950X 4.5GHz
NVIDIA GeForce RTX 3080 Ti
min:
36 fps, P1:
36 fps, max:
51 fps
~ 43 fps
93%
NVIDIA GeForce RTX 3080:
40 [X] Desktop-PC Intel Core i9-12900K 3.2GHz
NVIDIA GeForce RTX 3080
min:
32 fps
fps
100%
NVIDIA GeForce RTX 3090:
386 [X] AMD Ryzen 9 5900X 3.7GHz
NVIDIA GeForce RTX 3090
min:
178.8 fps, P0.1:
235 fps, P1:
271 fps, max:
541 fps
fps
128%
NVIDIA GeForce RTX 3080 Ti:
496 [X] AMD Ryzen 9 7950X 4.5GHz
NVIDIA GeForce RTX 3080 Ti
min:
57.3 fps, P0.1:
251 fps, P1:
331 fps, max:
802 fps
fps
100%
NVIDIA GeForce RTX 3090:
309 [X] AMD Ryzen 9 5900X 3.7GHz
NVIDIA GeForce RTX 3090
min:
138.5 fps, P0.1:
189.3 fps, P1:
235 fps, max:
482 fps
383 [X] Desktop-PC Intel Core i9-12900K 3.2GHz
NVIDIA GeForce RTX 3090
min:
95.9 fps, P0.1:
221 fps, P1:
270 fps, max:
640 fps
~ 346 fps
111%
NVIDIA GeForce RTX 3080 Ti:
384 [X] AMD Ryzen 9 7950X 4.5GHz
NVIDIA GeForce RTX 3080 Ti
min:
45.1 fps, P0.1:
181.4 fps, P1:
264 fps, max:
677 fps
fps
102%
NVIDIA GeForce RTX 3080:
353 [X] Desktop-PC Intel Core i9-12900K 3.2GHz
NVIDIA GeForce RTX 3080
min:
27.9 fps, P0.1:
148.5 fps, P1:
242 fps, max:
686 fps
fps
100%
NVIDIA GeForce RTX 3090:
302 [X] AMD Ryzen 9 5900X 3.7GHz
NVIDIA GeForce RTX 3090
min:
53 fps, P0.1:
163.4 fps, P1:
203 fps, max:
467 fps
366 [X] Desktop-PC Intel Core i9-12900K 3.2GHz
NVIDIA GeForce RTX 3090
min:
184.4 fps, P0.1:
214 fps, P1:
265 fps, max:
666 fps
~ 334 fps
108%
NVIDIA GeForce RTX 3080 Ti:
362 [X] AMD Ryzen 9 7950X 4.5GHz
NVIDIA GeForce RTX 3080 Ti
min:
53.6 fps, P0.1:
198.8 fps, P1:
251 fps, max:
639 fps
fps
103%
NVIDIA GeForce RTX 3080:
345 [X] Desktop-PC Intel Core i9-12900K 3.2GHz
NVIDIA GeForce RTX 3080
min:
57.1 fps, P0.1:
192.3 fps, P1:
246 fps, max:
679 fps
fps
100%
NVIDIA GeForce RTX 3090:
299 [X] AMD Ryzen 9 5900X 3.7GHz
NVIDIA GeForce RTX 3090
min:
58.1 fps, P0.1:
192.3 fps, P1:
226 fps, max:
473 fps
352 [X] Desktop-PC Intel Core i9-12900K 3.2GHz
NVIDIA GeForce RTX 3090
min:
57 fps, P0.1:
187.9 fps, P1:
254 fps, max:
655 fps
~ 326 fps
107%
NVIDIA GeForce RTX 3080 Ti:
349 [X] AMD Ryzen 9 7950X 4.5GHz
NVIDIA GeForce RTX 3080 Ti
min:
55.9 fps, P0.1:
197.1 fps, P1:
244 fps, max:
618 fps
fps
101%
NVIDIA GeForce RTX 3080:
329 [X] Desktop-PC Intel Core i9-12900K 3.2GHz
NVIDIA GeForce RTX 3080
min:
126.3 fps, P0.1:
204 fps, P1:
239 fps, max:
651 fps
fps
100%
NVIDIA GeForce RTX 3090:
233 [X] AMD Ryzen 9 5900X 3.7GHz
NVIDIA GeForce RTX 3090
min:
69.6 fps, P0.1:
142.9 fps, P1:
179.1 fps, max:
378 fps
261 [X] Desktop-PC Intel Core i9-12900K 3.2GHz
NVIDIA GeForce RTX 3090
min:
49.3 fps, P0.1:
180.6 fps, P1:
203 fps, max:
595 fps
~ 247 fps
101%
NVIDIA GeForce RTX 3080 Ti:
249 [X] AMD Ryzen 9 7950X 4.5GHz
NVIDIA GeForce RTX 3080 Ti
min:
47.7 fps, P0.1:
113.5 fps, P1:
182.5 fps, max:
413 fps
fps
96%
NVIDIA GeForce RTX 3080:
237 [X] Desktop-PC Intel Core i9-12900K 3.2GHz
NVIDIA GeForce RTX 3080
min:
60.4 fps, P0.1:
157.9 fps, P1:
185.7 fps, max:
415 fps
fps
100%
NVIDIA GeForce RTX 3090:
129 [X] AMD Ryzen 9 5900X 3.7GHz
NVIDIA GeForce RTX 3090
min:
3.05 fps, P0.1:
73.1 fps, P1:
98.4 fps, max:
354 fps
145.8 [X] Desktop-PC Intel Core i9-12900K 3.2GHz
NVIDIA GeForce RTX 3090
min:
70.4 fps, P0.1:
97.6 fps, P1:
110.3 fps, max:
323 fps
~ 137 fps
101%
NVIDIA GeForce RTX 3080 Ti:
138.1 [X] AMD Ryzen 9 7950X 4.5GHz
NVIDIA GeForce RTX 3080 Ti
min:
50.5 fps, P0.1:
69.6 fps, P1:
111.3 fps, max:
356 fps
fps
93%
NVIDIA GeForce RTX 3080:
127.3 [X] Desktop-PC Intel Core i9-12900K 3.2GHz
NVIDIA GeForce RTX 3080
min:
63 fps, P0.1:
85.3 fps, P1:
96 fps, max:
293 fps
fps
100%
NVIDIA GeForce RTX 3090:
221 [X] AMD Ryzen 9 5900X 3.7GHz
NVIDIA GeForce RTX 3090
min:
30.8 fps, P0.1:
100 fps, P1:
169.9 fps, max:
277 fps
273 [X] Nvidia GeForce RTX 3090 FE AMD Ryzen 9 7950X 4.5GHz
NVIDIA GeForce RTX 3090
min:
57.9 fps, P0.1:
132.4 fps, P1:
214 fps, max:
356 fps
~ 247 fps
117%
NVIDIA GeForce RTX 3080 Ti:
290 [X] AMD Ryzen 9 7950X 4.5GHz
NVIDIA GeForce RTX 3080 Ti
min:
47.4 fps, P0.1:
142.8 fps, P1:
203 fps, max:
386 fps
fps
100%
NVIDIA GeForce RTX 3090:
221 [X] AMD Ryzen 9 5900X 3.7GHz
NVIDIA GeForce RTX 3090
min:
48.2 fps, P0.1:
106.2 fps, P1:
166.5 fps, max:
281 fps
228 [X] Desktop-PC Intel Core i9-12900K 3.2GHz
NVIDIA GeForce RTX 3090
min:
29.1 fps, P0.1:
70.8 fps, P1:
151.1 fps, max:
382 fps
269 [X] Nvidia GeForce RTX 3090 FE AMD Ryzen 9 7950X 4.5GHz
NVIDIA GeForce RTX 3090
min:
61.8 fps, P0.1:
132.8 fps, P1:
205 fps, max:
343 fps
~ 239 fps
121%
NVIDIA GeForce RTX 3080 Ti:
288 [X] AMD Ryzen 9 7950X 4.5GHz
NVIDIA GeForce RTX 3080 Ti
min:
44.4 fps, P0.1:
138 fps, P1:
210 fps, max:
373 fps
fps
90%
NVIDIA GeForce RTX 3080:
216 [X] Desktop-PC Intel Core i9-12900K 3.2GHz
NVIDIA GeForce RTX 3080
min:
33.7 fps, P0.1:
69.7 fps, P1:
148.6 fps, max:
347 fps
fps
100%
NVIDIA GeForce RTX 3090:
219 [X] Desktop-PC Intel Core i9-12900K 3.2GHz
NVIDIA GeForce RTX 3090
min:
29.1 fps, P0.1:
71.6 fps, P1:
146.4 fps, max:
363 fps
219 [X] AMD Ryzen 9 5900X 3.7GHz
NVIDIA GeForce RTX 3090
min:
29.2 fps, P0.1:
105.4 fps, P1:
166.2 fps, max:
279 fps
267 [X] Nvidia GeForce RTX 3090 FE AMD Ryzen 9 7950X 4.5GHz
NVIDIA GeForce RTX 3090
~ 235 fps
119%
NVIDIA GeForce RTX 3080 Ti:
279 [X] AMD Ryzen 9 7950X 4.5GHz
NVIDIA GeForce RTX 3080 Ti
min:
52.5 fps, P0.1:
138.3 fps, P1:
200 fps, max:
369 fps
fps
88%
NVIDIA GeForce RTX 3080:
207 [X] Desktop-PC Intel Core i9-12900K 3.2GHz
NVIDIA GeForce RTX 3080
min:
24.3 fps, P0.1:
63.5 fps, P1:
140 fps, max:
333 fps
fps
100%
NVIDIA GeForce RTX 3090:
218 [X] Desktop-PC Intel Core i9-12900K 3.2GHz
NVIDIA GeForce RTX 3090
min:
33.4 fps, P0.1:
65 fps, P1:
145.6 fps, max:
356 fps
218 [X] AMD Ryzen 9 5900X 3.7GHz
NVIDIA GeForce RTX 3090
min:
30.3 fps, P0.1:
101.3 fps, P1:
166.3 fps, max:
275 fps
265 [X] Nvidia GeForce RTX 3090 FE AMD Ryzen 9 7950X 4.5GHz
NVIDIA GeForce RTX 3090
min:
51.7 fps, P0.1:
131.7 fps, P1:
209 fps, max:
347 fps
~ 234 fps
119%
NVIDIA GeForce RTX 3080 Ti:
278 [X] AMD Ryzen 9 7950X 4.5GHz
NVIDIA GeForce RTX 3080 Ti
min:
61.4 fps, P0.1:
142 fps, P1:
201 fps, max:
369 fps
fps
88%
NVIDIA GeForce RTX 3080:
205 [X] Desktop-PC Intel Core i9-12900K 3.2GHz
NVIDIA GeForce RTX 3080
min:
25.8 fps, P0.1:
65.9 fps, P1:
135.3 fps, max:
338 fps
fps
100%
NVIDIA GeForce RTX 3090:
179.2 [X] AMD Ryzen 9 5900X 3.7GHz
NVIDIA GeForce RTX 3090
min:
30.7 fps, P0.1:
94.4 fps, P1:
130.5 fps, max:
261 fps
187.6 [X] Desktop-PC Intel Core i9-12900K 3.2GHz
NVIDIA GeForce RTX 3090
min:
33.2 fps, P0.1:
60.8 fps, P1:
123.9 fps, max:
331 fps
192.5 [X] Nvidia GeForce RTX 3090 FE AMD Ryzen 9 7950X 4.5GHz
NVIDIA GeForce RTX 3090
min:
43.8 fps, P0.1:
114.2 fps, P1:
137.6 fps, max:
280 fps
~ 186 fps
113%
NVIDIA GeForce RTX 3080 Ti:
211 [X] AMD Ryzen 9 7950X 4.5GHz
NVIDIA GeForce RTX 3080 Ti
min:
50.1 fps, P0.1:
118.4 fps, P1:
149.2 fps, max:
335 fps
fps
93%
NVIDIA GeForce RTX 3080:
172.5 [X] Desktop-PC Intel Core i9-12900K 3.2GHz
NVIDIA GeForce RTX 3080
min:
36.1 fps, P0.1:
56 fps, P1:
117 fps, max:
313 fps
fps
100%
NVIDIA GeForce RTX 3090:
97 [X] Nvidia GeForce RTX 3090 FE AMD Ryzen 9 7950X 4.5GHz
NVIDIA GeForce RTX 3090
min:
21.7 fps, P0.1:
54.1 fps, P1:
57.5 fps, max:
282 fps
100.7 [X] Desktop-PC Intel Core i9-12900K 3.2GHz
NVIDIA GeForce RTX 3090
min:
24.6 fps, P0.1:
44.4 fps, P1:
61 fps, max:
251 fps
102.6 [X] AMD Ryzen 9 5900X 3.7GHz
NVIDIA GeForce RTX 3090
min:
37.9 fps, P0.1:
52.8 fps, P1:
63.7 fps, max:
231 fps
~ 100 fps
108%
NVIDIA GeForce RTX 3080 Ti:
108.4 [X] AMD Ryzen 9 7950X 4.5GHz
NVIDIA GeForce RTX 3080 Ti
min:
39.4 fps, P0.1:
60.5 fps, P1:
64 fps, max:
293 fps
fps
90%
NVIDIA GeForce RTX 3080:
89.9 [X] Desktop-PC Intel Core i9-12900K 3.2GHz
NVIDIA GeForce RTX 3080
min:
32.5 fps, P0.1:
42.9 fps, P1:
53.7 fps, max:
256 fps
fps
100%
NVIDIA GeForce RTX 3090:
293 [X] AMD Ryzen 9 5900X 3.7GHz
NVIDIA GeForce RTX 3090
293 [X] Intel Core i5-13400F 2.5GHz
NVIDIA GeForce RTX 3090
349 358 [X] Intel Core i5-13600K 3.5GHz
NVIDIA GeForce RTX 3090
359 364 [X] AMD Ryzen 9 7900X 4.7GHz
NVIDIA GeForce RTX 3090
367 [X] AMD Ryzen 5 7600X 4.7GHz
NVIDIA GeForce RTX 3090
368 [X] Intel Core i9-13900K 3GHz
NVIDIA GeForce RTX 3090
374 [X] NVIDIA GeForce RTX 3090 Founders Edition AMD Ryzen 9 7950X 4.5GHz
NVIDIA GeForce RTX 3090
378 [X] Nvidia GeForce RTX 3090 FE AMD Ryzen 9 7950X 4.5GHz
NVIDIA GeForce RTX 3090
~ 350 fps
104%
NVIDIA GeForce RTX 3080 Ti:
355 370 [X] AMD Ryzen 9 7950X 4.5GHz
NVIDIA GeForce RTX 3080 Ti
~ 363 fps
100%
NVIDIA GeForce RTX 3090:
247 [X] AMD Ryzen 9 5900X 3.7GHz
NVIDIA GeForce RTX 3090
251 [X] Intel Core i5-13400F 2.5GHz
NVIDIA GeForce RTX 3090
269 [X] Desktop-PC Intel Core i9-12900K 3.2GHz
NVIDIA GeForce RTX 3090
287 289 290 [X] Intel Core i5-13600K 3.5GHz
NVIDIA GeForce RTX 3090
294 [X] AMD Ryzen 9 7900X 4.7GHz
NVIDIA GeForce RTX 3090
294 [X] AMD Ryzen 5 7600X 4.7GHz
NVIDIA GeForce RTX 3090
297 [X] Intel Core i9-13900K 3GHz
NVIDIA GeForce RTX 3090
301 [X] NVIDIA GeForce RTX 3090 Founders Edition AMD Ryzen 9 7950X 4.5GHz
NVIDIA GeForce RTX 3090
304 [X] Nvidia GeForce RTX 3090 FE AMD Ryzen 9 7950X 4.5GHz
NVIDIA GeForce RTX 3090
~ 284 fps
104%
NVIDIA GeForce RTX 3080 Ti:
291 299 [X] AMD Ryzen 9 7950X 4.5GHz
NVIDIA GeForce RTX 3080 Ti
~ 295 fps
86%
NVIDIA GeForce RTX 3080:
243 [X] Desktop-PC Intel Core i9-12900K 3.2GHz
NVIDIA GeForce RTX 3080
fps
100%
NVIDIA GeForce RTX 3090:
192.5 [X] AMD Ryzen 9 5900X 3.7GHz
NVIDIA GeForce RTX 3090
204 205 [X] Intel Core i5-13400F 2.5GHz
NVIDIA GeForce RTX 3090
208 [X] Intel Core i5-13600K 3.5GHz
NVIDIA GeForce RTX 3090
209 [X] Intel Core i9-13900K 3GHz
NVIDIA GeForce RTX 3090
209 211 [X] AMD Ryzen 5 7600X 4.7GHz
NVIDIA GeForce RTX 3090
212 [X] Desktop-PC Intel Core i9-12900K 3.2GHz
NVIDIA GeForce RTX 3090
212 [X] AMD Ryzen 9 7900X 4.7GHz
NVIDIA GeForce RTX 3090
212 [X] NVIDIA GeForce RTX 3090 Founders Edition AMD Ryzen 9 7950X 4.5GHz
NVIDIA GeForce RTX 3090
215 [X] Nvidia GeForce RTX 3090 FE AMD Ryzen 9 7950X 4.5GHz
NVIDIA GeForce RTX 3090
~ 208 fps
102%
NVIDIA GeForce RTX 3080 Ti:
211 215 [X] AMD Ryzen 9 7950X 4.5GHz
NVIDIA GeForce RTX 3080 Ti
~ 213 fps
93%
NVIDIA GeForce RTX 3080:
194 [X] Desktop-PC Intel Core i9-12900K 3.2GHz
NVIDIA GeForce RTX 3080
fps
100%
NVIDIA GeForce RTX 3090:
159.4 [X] AMD Ryzen 9 5900X 3.7GHz
NVIDIA GeForce RTX 3090
161.8 165.1 [X] Intel Core i5-13600K 3.5GHz
NVIDIA GeForce RTX 3090
165.8 [X] Intel Core i9-13900K 3GHz
NVIDIA GeForce RTX 3090
165.9 167.3 [X] Intel Core i5-13400F 2.5GHz
NVIDIA GeForce RTX 3090
168.3 [X] AMD Ryzen 5 7600X 4.7GHz
NVIDIA GeForce RTX 3090
168.3 [X] NVIDIA GeForce RTX 3090 Founders Edition AMD Ryzen 9 7950X 4.5GHz
NVIDIA GeForce RTX 3090
168.5 [X] AMD Ryzen 9 7900X 4.7GHz
NVIDIA GeForce RTX 3090
169.8 [X] Nvidia GeForce RTX 3090 FE AMD Ryzen 9 7950X 4.5GHz
NVIDIA GeForce RTX 3090
173 [X] Desktop-PC Intel Core i9-12900K 3.2GHz
NVIDIA GeForce RTX 3090
~ 167 fps
102%
NVIDIA GeForce RTX 3080 Ti:
168.5 171.3 [X] AMD Ryzen 9 7950X 4.5GHz
NVIDIA GeForce RTX 3080 Ti
~ 170 fps
94%
NVIDIA GeForce RTX 3080:
157 [X] Desktop-PC Intel Core i9-12900K 3.2GHz
NVIDIA GeForce RTX 3080
fps
100%
NVIDIA GeForce RTX 3090:
118.8 120.8 [X] Intel Core i5-13600K 3.5GHz
NVIDIA GeForce RTX 3090
121.7 [X] Intel Core i9-13900K 3GHz
NVIDIA GeForce RTX 3090
122 122.1 [X] NVIDIA GeForce RTX 3090 Founders Edition AMD Ryzen 9 7950X 4.5GHz
NVIDIA GeForce RTX 3090
123.9 [X] Intel Core i5-13400F 2.5GHz
NVIDIA GeForce RTX 3090
124 [X] AMD Ryzen 9 7900X 4.7GHz
NVIDIA GeForce RTX 3090
124 [X] AMD Ryzen 5 7600X 4.7GHz
NVIDIA GeForce RTX 3090
124.1 [X] Nvidia GeForce RTX 3090 FE AMD Ryzen 9 7950X 4.5GHz
NVIDIA GeForce RTX 3090
125.4 [X] AMD Ryzen 9 5900X 3.7GHz
NVIDIA GeForce RTX 3090
129 [X] Desktop-PC Intel Core i9-12900K 3.2GHz
NVIDIA GeForce RTX 3090
~ 123 fps
101%
NVIDIA GeForce RTX 3080 Ti:
123.1 124.7 [X] AMD Ryzen 9 7950X 4.5GHz
NVIDIA GeForce RTX 3080 Ti
~ 124 fps
93%
NVIDIA GeForce RTX 3080:
115 [X] Desktop-PC Intel Core i9-12900K 3.2GHz
NVIDIA GeForce RTX 3080
fps
100%
NVIDIA GeForce RTX 3090:
67.5 68.8 [X] Intel Core i5-13600K 3.5GHz
NVIDIA GeForce RTX 3090
69 [X] NVIDIA GeForce RTX 3090 Founders Edition AMD Ryzen 9 7950X 4.5GHz
NVIDIA GeForce RTX 3090
69 69.2 [X] Intel Core i9-13900K 3GHz
NVIDIA GeForce RTX 3090
69.7 [X] Nvidia GeForce RTX 3090 FE AMD Ryzen 9 7950X 4.5GHz
NVIDIA GeForce RTX 3090
70.2 [X] Intel Core i5-13400F 2.5GHz
NVIDIA GeForce RTX 3090
70.4 [X] AMD Ryzen 5 7600X 4.7GHz
NVIDIA GeForce RTX 3090
70.8 [X] AMD Ryzen 9 7900X 4.7GHz
NVIDIA GeForce RTX 3090
71.4 [X] AMD Ryzen 9 5900X 3.7GHz
NVIDIA GeForce RTX 3090
73.6 [X] Desktop-PC Intel Core i9-12900K 3.2GHz
NVIDIA GeForce RTX 3090
~ 70 fps
100%
NVIDIA GeForce RTX 3080 Ti:
70 70.6 [X] AMD Ryzen 9 7950X 4.5GHz
NVIDIA GeForce RTX 3080 Ti
~ 70 fps
93%
NVIDIA GeForce RTX 3080:
65.4 [X] Desktop-PC Intel Core i9-12900K 3.2GHz
NVIDIA GeForce RTX 3080
fps
100%
NVIDIA GeForce RTX 3090:
79.1 [X] AMD Ryzen 9 5900X 3.7GHz
NVIDIA GeForce RTX 3090
165 [X] Intel Core i5-12600K 1.6
Intel Core i5-12600K 2.8GHz
NVIDIA GeForce RTX 3090
min:
69.5 fps, max:
218 fps
199 [X] AMD Ryzen 5 7600X 4.7GHz
NVIDIA GeForce RTX 3090
205 [X] AMD Ryzen 7 7700X 1.6
AMD Ryzen 7 7700X 4.5GHz
NVIDIA GeForce RTX 3090
min:
96.9 fps, max:
307 fps
209 [X] AMD Ryzen 9 7950X 1.6
AMD Ryzen 9 7950X 4.5GHz
NVIDIA GeForce RTX 3090
min:
87.2 fps, max:
290 fps
214 [X] AMD Ryzen 9 7900X 4.7GHz
NVIDIA GeForce RTX 3090
217 [X] Desktop-PC Intel Core i9-12900K 3.2GHz
NVIDIA GeForce RTX 3090
min:
92 fps
220 [X] Nvidia GeForce RTX 3090 FE AMD Ryzen 9 7950X 4.5GHz
NVIDIA GeForce RTX 3090
~ 189 fps
116%
NVIDIA GeForce RTX 3080 Ti:
219 [X] 1.61
AMD Ryzen 9 7950X 4.5GHz
NVIDIA GeForce RTX 3080 Ti
min:
71.8 fps, max:
292 fps
fps
100%
NVIDIA GeForce RTX 3090:
78.8 [X] AMD Ryzen 9 5900X 3.7GHz
NVIDIA GeForce RTX 3090
142 [X] MSI GeForce RTX 3090 Suprim X Intel Core i9-9900K 3.6GHz
NVIDIA GeForce RTX 3090
min:
54 fps
172.1 [X] AMD Ryzen 7 7700X 1.6
AMD Ryzen 7 7700X 4.5GHz
NVIDIA GeForce RTX 3090
min:
90.6 fps, max:
241 fps
175.6 [X] AMD Ryzen 9 7950X 1.6
AMD Ryzen 9 7950X 4.5GHz
NVIDIA GeForce RTX 3090
min:
93.4 fps, max:
232 fps
180 [X] Nvidia GeForce RTX 3090 FE AMD Ryzen 9 7950X 4.5GHz
NVIDIA GeForce RTX 3090
198 [X] AMD Ryzen 5 7600X 4.7GHz
NVIDIA GeForce RTX 3090
213 [X] AMD Ryzen 9 7900X 4.7GHz
NVIDIA GeForce RTX 3090
~ 166 fps
111%
NVIDIA GeForce RTX 3080 Ti:
184.4 [X] 1.61
AMD Ryzen 9 7950X 4.5GHz
NVIDIA GeForce RTX 3080 Ti
min:
60.9 fps, max:
267 fps
fps
83%
NVIDIA GeForce RTX 3080:
138 [X] MSI GeForce RTX 3080 Gaming X Trio Intel Core i9-9900K 3.6GHz
NVIDIA GeForce RTX 3080
min:
56 fps
fps
100%
NVIDIA GeForce RTX 3090:
78.6 [X] AMD Ryzen 9 5900X 3.7GHz
NVIDIA GeForce RTX 3090
136 [X] MSI GeForce RTX 3090 Suprim X Intel Core i9-9900K 3.6GHz
NVIDIA GeForce RTX 3090
min:
74 fps
149.8 [X] AMD Ryzen 9 7950X 1.6
AMD Ryzen 9 7950X 4.5GHz
NVIDIA GeForce RTX 3090
min:
110.8 fps, max:
213 fps
151.3 [X] AMD Ryzen 7 7700X 1.6
AMD Ryzen 7 7700X 4.5GHz
NVIDIA GeForce RTX 3090
min:
81.2 fps, max:
217 fps
157 [X] Nvidia GeForce RTX 3090 FE AMD Ryzen 9 7950X 4.5GHz
NVIDIA GeForce RTX 3090
174 [X] AMD Ryzen 9 7900X 4.7GHz
NVIDIA GeForce RTX 3090
174 [X] AMD Ryzen 5 7600X 4.7GHz
NVIDIA GeForce RTX 3090
~ 146 fps
110%
NVIDIA GeForce RTX 3080 Ti:
160.4 [X] 1.61
AMD Ryzen 9 7950X 4.5GHz
NVIDIA GeForce RTX 3080 Ti
min:
82 fps, max:
255 fps
fps
92%
NVIDIA GeForce RTX 3080:
134 [X] MSI GeForce RTX 3080 Gaming X Trio Intel Core i9-9900K 3.6GHz
NVIDIA GeForce RTX 3080
min:
69 fps
fps
100%
NVIDIA GeForce RTX 3090:
78.6 [X] AMD Ryzen 9 5900X 3.7GHz
NVIDIA GeForce RTX 3090
103 [X] Desktop-PC Intel Core i9-12900K 3.2GHz
NVIDIA GeForce RTX 3090
min:
67 fps
125 [X] AMD Ryzen 5 7600X 4.7GHz
NVIDIA GeForce RTX 3090
126.3 [X] Intel Core i5-12600K 1.6
Intel Core i5-12600K 2.8GHz
NVIDIA GeForce RTX 3090
min:
79 fps, max:
175.5 fps
134 [X] MSI GeForce RTX 3090 Suprim X Intel Core i9-9900K 3.6GHz
NVIDIA GeForce RTX 3090
min:
66 fps
137.5 [X] AMD Ryzen 9 7950X 1.6
AMD Ryzen 9 7950X 4.5GHz
NVIDIA GeForce RTX 3090
min:
96.5 fps, max:
211 fps
137.7 [X] AMD Ryzen 7 7700X 1.6
AMD Ryzen 7 7700X 4.5GHz
NVIDIA GeForce RTX 3090
min:
83.2 fps, max:
210 fps
144 [X] Nvidia GeForce RTX 3090 FE AMD Ryzen 9 7950X 4.5GHz
NVIDIA GeForce RTX 3090
173 [X] AMD Ryzen 9 7900X 4.7GHz
NVIDIA GeForce RTX 3090
~ 129 fps
113%
NVIDIA GeForce RTX 3080 Ti:
146.4 [X] 1.61
AMD Ryzen 9 7950X 4.5GHz
NVIDIA GeForce RTX 3080 Ti
min:
72.3 fps, max:
244 fps
fps
102%
NVIDIA GeForce RTX 3080:
131 [X] MSI GeForce RTX 3080 Gaming X Trio Intel Core i9-9900K 3.6GHz
NVIDIA GeForce RTX 3080
min:
53 fps
fps
100%
NVIDIA GeForce RTX 3090:
78 [X] AMD Ryzen 9 5900X 3.7GHz
NVIDIA GeForce RTX 3090
88 [X] AMD Ryzen 9 7900X 4.7GHz
NVIDIA GeForce RTX 3090
88 [X] AMD Ryzen 5 7600X 4.7GHz
NVIDIA GeForce RTX 3090
92.8 [X] AMD Ryzen 7 7700X 1.6
AMD Ryzen 7 7700X 4.5GHz
NVIDIA GeForce RTX 3090
min:
61 fps, max:
129.3 fps
93.1 [X] AMD Ryzen 9 7950X 1.6
AMD Ryzen 9 7950X 4.5GHz
NVIDIA GeForce RTX 3090
min:
63.2 fps, max:
130 fps
94.8 [X] MSI GeForce RTX 3090 Suprim X Intel Core i9-9900K 3.6GHz
NVIDIA GeForce RTX 3090
min:
63 fps
96 [X] Nvidia GeForce RTX 3090 FE AMD Ryzen 9 7950X 4.5GHz
NVIDIA GeForce RTX 3090
~ 90 fps
110%
NVIDIA GeForce RTX 3080 Ti:
99.1 [X] 1.61
AMD Ryzen 9 7950X 4.5GHz
NVIDIA GeForce RTX 3080 Ti
min:
74.7 fps, max:
144.2 fps
fps
96%
NVIDIA GeForce RTX 3080:
86.1 [X] MSI GeForce RTX 3080 Gaming X Trio Intel Core i9-9900K 3.6GHz
NVIDIA GeForce RTX 3080
min:
59 fps
fps
100%
NVIDIA GeForce RTX 3090:
43.9 [X] AMD Ryzen 9 5900X 3.7GHz
NVIDIA GeForce RTX 3090
46 [X] AMD Ryzen 9 7900X 4.7GHz
NVIDIA GeForce RTX 3090
46 [X] AMD Ryzen 5 7600X 4.7GHz
NVIDIA GeForce RTX 3090
46.2 46.5 [X] AMD Ryzen 9 7950X 1.6
AMD Ryzen 9 7950X 4.5GHz
NVIDIA GeForce RTX 3090
min:
31.2 fps, max:
61.5 fps
47 [X] Nvidia GeForce RTX 3090 FE AMD Ryzen 9 7950X 4.5GHz
NVIDIA GeForce RTX 3090
48.6 [X] MSI GeForce RTX 3090 Suprim X Intel Core i9-9900K 3.6GHz
NVIDIA GeForce RTX 3090
min:
33 fps
~ 46 fps
108%
NVIDIA GeForce RTX 3080 Ti:
49.7 [X] 1.61
AMD Ryzen 9 7950X 4.5GHz
NVIDIA GeForce RTX 3080 Ti
min:
41.5 fps, max:
63.7 fps
fps
93%
NVIDIA GeForce RTX 3080:
42.8 [X] MSI GeForce RTX 3080 Gaming X Trio Intel Core i9-9900K 3.6GHz
NVIDIA GeForce RTX 3080
min:
29 fps
fps
100%
NVIDIA GeForce RTX 3090:
97.6 [X] MSI GeForce RTX 3090 Suprim X Intel Core i9-9900K 3.6GHz
NVIDIA GeForce RTX 3090
min:
32.8 fps, P0.1:
46.5 fps, P1:
68.5 fps, max:
141 fps
fps
96%
NVIDIA GeForce RTX 3080:
93.3 [X] MSI GeForce RTX 3080 Gaming X Trio Intel Core i9-9900K 3.6GHz
NVIDIA GeForce RTX 3080
min:
56.6 fps, P0.1:
62.3 fps, P1:
69.2 fps, max:
131 fps
fps
100%
NVIDIA GeForce RTX 3090:
87 [X] MSI GeForce RTX 3090 Suprim X Intel Core i9-9900K 3.6GHz
NVIDIA GeForce RTX 3090
min:
52.3 fps, P0.1:
57.4 fps, P1:
66.8 fps, max:
122 fps
fps
106%
NVIDIA GeForce RTX 3080:
92.5 [X] MSI GeForce RTX 3080 Gaming X Trio Intel Core i9-9900K 3.6GHz
NVIDIA GeForce RTX 3080
min:
55.8 fps, P0.1:
63.8 fps, P1:
69.2 fps, max:
132 fps
fps
100%
NVIDIA GeForce RTX 3090:
86.6 [X] MSI GeForce RTX 3090 Suprim X Intel Core i9-9900K 3.6GHz
NVIDIA GeForce RTX 3090
min:
54.2 fps, P0.1:
60 fps, P1:
64.6 fps, max:
121 fps
fps
106%
NVIDIA GeForce RTX 3080:
92.1 [X] MSI GeForce RTX 3080 Gaming X Trio Intel Core i9-9900K 3.6GHz
NVIDIA GeForce RTX 3080
min:
58.9 fps, P0.1:
63.1 fps, P1:
69.7 fps, max:
129 fps
fps
100%
NVIDIA GeForce RTX 3090:
83.6 [X] MSI GeForce RTX 3090 Suprim X Intel Core i9-9900K 3.6GHz
NVIDIA GeForce RTX 3090
min:
33.8 fps, P0.1:
40.9 fps, P1:
60.7 fps, max:
117 fps
fps
95%
NVIDIA GeForce RTX 3080:
79.5 [X] MSI GeForce RTX 3080 Gaming X Trio Intel Core i9-9900K 3.6GHz
NVIDIA GeForce RTX 3080
min:
58.2 fps, P0.1:
59.2 fps, P1:
63.8 fps, max:
125 fps
fps
100%
NVIDIA GeForce RTX 3090:
66.1 [X] MSI GeForce RTX 3090 Suprim X Intel Core i9-9900K 3.6GHz
NVIDIA GeForce RTX 3090
min:
48.6 fps, P0.1:
50.5 fps, P1:
55.2 fps, max:
92.7 fps
fps
90%
NVIDIA GeForce RTX 3080:
59.6 [X] MSI GeForce RTX 3080 Gaming X Trio Intel Core i9-9900K 3.6GHz
NVIDIA GeForce RTX 3080
min:
22.6 fps, P0.1:
31.1 fps, P1:
49.1 fps, max:
94.8 fps
fps
100%
NVIDIA GeForce RTX 3090:
214.9 [X] AMD Ryzen 9 5900X 3.7GHz
NVIDIA GeForce RTX 3090
257 [X] 643827
Intel Core i5-13400F 2.5GHz
NVIDIA GeForce RTX 3090
min:
52 fps, max:
370 fps
286 [X] Nvidia GeForce RTX 3090 FE 712825
AMD Ryzen 9 7950X 4.5GHz
NVIDIA GeForce RTX 3090
min:
79.4 fps, max:
453 fps
287 [X] 591708
Intel Core i5-13600K 3.5GHz
NVIDIA GeForce RTX 3090
min:
37.2 fps, max:
419 fps
366 [X] NVIDIA GeForce RTX 3090 Founders Edition 591708
AMD Ryzen 9 7950X 4.5GHz
NVIDIA GeForce RTX 3090
min:
128.2 fps, max:
509 fps
~ 282 fps
112%
NVIDIA GeForce RTX 3080 Ti:
317 [X] 643827
AMD Ryzen 9 7950X 4.5GHz
NVIDIA GeForce RTX 3080 Ti
min:
75.7 fps, max:
419 fps
fps
100%
NVIDIA GeForce RTX 3090:
157 [X] MSI GeForce RTX 3090 Suprim X Intel Core i9-9900K 3.6GHz
NVIDIA GeForce RTX 3090
min:
117 fps
194.1 [X] AMD Ryzen 9 5900X 3.7GHz
NVIDIA GeForce RTX 3090
256 [X] 643827
Intel Core i5-13400F 2.5GHz
NVIDIA GeForce RTX 3090
min:
51.4 fps, max:
363 fps
261 [X] 591708
Intel Core i5-13600K 3.5GHz
NVIDIA GeForce RTX 3090
min:
91.6 fps, max:
377 fps
263 [X] Nvidia GeForce RTX 3090 FE 712825
AMD Ryzen 9 7950X 4.5GHz
NVIDIA GeForce RTX 3090
min:
89 fps, max:
403 fps
324 [X] NVIDIA GeForce RTX 3090 Founders Edition 591708
AMD Ryzen 9 7950X 4.5GHz
NVIDIA GeForce RTX 3090
min:
120 fps, max:
446 fps
~ 243 fps
119%
NVIDIA GeForce RTX 3080 Ti:
289 [X] 643827
AMD Ryzen 9 7950X 4.5GHz
NVIDIA GeForce RTX 3080 Ti
min:
68.2 fps, max:
390 fps
fps
64%
NVIDIA GeForce RTX 3080:
155 [X] MSI GeForce RTX 3080 Gaming X Trio Intel Core i9-9900K 3.6GHz
NVIDIA GeForce RTX 3080
min:
115 fps
fps
100%
NVIDIA GeForce RTX 3090:
136 [X] MSI GeForce RTX 3090 Suprim X Intel Core i9-9900K 3.6GHz
NVIDIA GeForce RTX 3090
min:
108 fps
179.6 [X] AMD Ryzen 9 5900X 3.7GHz
NVIDIA GeForce RTX 3090
232 [X] 591708
Intel Core i5-13600K 3.5GHz
NVIDIA GeForce RTX 3090
min:
88.5 fps, max:
311 fps
236 [X] 643827
Intel Core i5-13400F 2.5GHz
NVIDIA GeForce RTX 3090
min:
30.7 fps, max:
329 fps
237 [X] Nvidia GeForce RTX 3090 FE 712825
AMD Ryzen 9 7950X 4.5GHz
NVIDIA GeForce RTX 3090
min:
97.9 fps, max:
355 fps
287 [X] NVIDIA GeForce RTX 3090 Founders Edition 591708
AMD Ryzen 9 7950X 4.5GHz
NVIDIA GeForce RTX 3090
min:
105.4 fps, max:
396 fps
~ 218 fps
117%
NVIDIA GeForce RTX 3080 Ti:
254 [X] 643827
AMD Ryzen 9 7950X 4.5GHz
NVIDIA GeForce RTX 3080 Ti
min:
75.4 fps, max:
343 fps
fps
62%
NVIDIA GeForce RTX 3080:
135 [X] MSI GeForce RTX 3080 Gaming X Trio Intel Core i9-9900K 3.6GHz
NVIDIA GeForce RTX 3080
min:
110 fps
fps
100%
NVIDIA GeForce RTX 3090:
126 [X] MSI GeForce RTX 3090 Suprim X Intel Core i9-9900K 3.6GHz
NVIDIA GeForce RTX 3090
min:
98 fps
153.9 [X] AMD Ryzen 9 5900X 3.7GHz
NVIDIA GeForce RTX 3090
156 [X] 591708
Intel Core i5-13600K 3.5GHz
NVIDIA GeForce RTX 3090
min:
46.9 fps, max:
259 fps
215 [X] NVIDIA GeForce RTX 3090 Founders Edition 591708
AMD Ryzen 9 7950X 4.5GHz
NVIDIA GeForce RTX 3090
min:
50.1 fps, max:
339 fps
216 [X] Nvidia GeForce RTX 3090 FE 712825
AMD Ryzen 9 7950X 4.5GHz
NVIDIA GeForce RTX 3090
min:
73.9 fps, max:
322 fps
217 [X] 643827
Intel Core i5-13400F 2.5GHz
NVIDIA GeForce RTX 3090
min:
51.3 fps, max:
297 fps
~ 181 fps
123%
NVIDIA GeForce RTX 3080 Ti:
223 [X] 643827
AMD Ryzen 9 7950X 4.5GHz
NVIDIA GeForce RTX 3080 Ti
min:
73.8 fps, max:
316 fps
fps
69%
NVIDIA GeForce RTX 3080:
125 [X] MSI GeForce RTX 3080 Gaming X Trio Intel Core i9-9900K 3.6GHz
NVIDIA GeForce RTX 3080
min:
96 fps
fps
100%
NVIDIA GeForce RTX 3090:
124 [X] MSI GeForce RTX 3090 Suprim X Intel Core i9-9900K 3.6GHz
NVIDIA GeForce RTX 3090
min:
97 fps
132.7 [X] AMD Ryzen 9 5900X 3.7GHz
NVIDIA GeForce RTX 3090
177.8 [X] 591708
Intel Core i5-13600K 3.5GHz
NVIDIA GeForce RTX 3090
min:
60.8 fps, max:
279 fps
177.8 [X] Nvidia GeForce RTX 3090 FE 712825
AMD Ryzen 9 7950X 4.5GHz
NVIDIA GeForce RTX 3090
min:
64.8 fps, max:
278 fps
185.9 [X] NVIDIA GeForce RTX 3090 Founders Edition 591708
AMD Ryzen 9 7950X 4.5GHz
NVIDIA GeForce RTX 3090
min:
59.5 fps, max:
307 fps
206 [X] 643827
Intel Core i5-13400F 2.5GHz
NVIDIA GeForce RTX 3090
min:
52 fps, max:
280 fps
~ 167 fps
111%
NVIDIA GeForce RTX 3080 Ti:
185.1 [X] 643827
AMD Ryzen 9 7950X 4.5GHz
NVIDIA GeForce RTX 3080 Ti
min:
56.1 fps, max:
284 fps
fps
74%
NVIDIA GeForce RTX 3080:
123 [X] MSI GeForce RTX 3080 Gaming X Trio Intel Core i9-9900K 3.6GHz
NVIDIA GeForce RTX 3080
min:
98 fps
fps
100%
NVIDIA GeForce RTX 3090:
101.4 [X] AMD Ryzen 9 5900X 3.7GHz
NVIDIA GeForce RTX 3090
112 [X] MSI GeForce RTX 3090 Suprim X Intel Core i9-9900K 3.6GHz
NVIDIA GeForce RTX 3090
min:
83 fps
115.1 [X] 591708
Intel Core i5-13600K 3.5GHz
NVIDIA GeForce RTX 3090
min:
58.4 fps, max:
297 fps
125.1 [X] Nvidia GeForce RTX 3090 FE 712825
AMD Ryzen 9 7950X 4.5GHz
NVIDIA GeForce RTX 3090
min:
80.8 fps, max:
258 fps
128.5 [X] NVIDIA GeForce RTX 3090 Founders Edition 591708
AMD Ryzen 9 7950X 4.5GHz
NVIDIA GeForce RTX 3090
min:
47.6 fps, max:
278 fps
185.5 [X] 643827
Intel Core i5-13400F 2.5GHz
NVIDIA GeForce RTX 3090
min:
51.5 fps, max:
256 fps
~ 128 fps
102%
NVIDIA GeForce RTX 3080 Ti:
130.3 [X] 643827
AMD Ryzen 9 7950X 4.5GHz
NVIDIA GeForce RTX 3080 Ti
min:
53.1 fps, max:
255 fps
fps
82%
NVIDIA GeForce RTX 3080:
105 [X] MSI GeForce RTX 3080 Gaming X Trio Intel Core i9-9900K 3.6GHz
NVIDIA GeForce RTX 3080
min:
83 fps
fps
100%
NVIDIA GeForce RTX 3090:
59.8 [X] AMD Ryzen 9 5900X 3.7GHz
NVIDIA GeForce RTX 3090
min:
21.1 fps, P0.1:
29.9 fps, P1:
49.2 fps, max:
111 fps
fps
100%
NVIDIA GeForce RTX 3090:
59.1 [X] MSI GeForce RTX 3090 Suprim X Intel Core i9-9900K 3.6GHz
NVIDIA GeForce RTX 3090
min:
32.2 fps, P0.1:
35.1 fps, P1:
41.9 fps, max:
86.3 fps
59.9 [X] AMD Ryzen 9 5900X 3.7GHz
NVIDIA GeForce RTX 3090
min:
28.9 fps, P0.1:
36.3 fps, P1:
50.4 fps, max:
109.2 fps
~ 60 fps
99%
NVIDIA GeForce RTX 3080:
59.2 [X] MSI GeForce RTX 3080 Gaming X Trio Intel Core i9-9900K 3.6GHz
NVIDIA GeForce RTX 3080
min:
33.1 fps, P0.1:
38.1 fps, P1:
43.5 fps, max:
78.8 fps
fps
100%
NVIDIA GeForce RTX 3090:
58.7 [X] MSI GeForce RTX 3090 Suprim X Intel Core i9-9900K 3.6GHz
NVIDIA GeForce RTX 3090
min:
31.5 fps, P0.1:
31.9 fps, P1:
40.6 fps, max:
79.9 fps
59.9 [X] AMD Ryzen 9 5900X 3.7GHz
NVIDIA GeForce RTX 3090
min:
29.4 fps, P0.1:
35.2 fps, P1:
52.9 fps, max:
99.8 fps
~ 59 fps
99%
NVIDIA GeForce RTX 3080:
58.6 [X] MSI GeForce RTX 3080 Gaming X Trio Intel Core i9-9900K 3.6GHz
NVIDIA GeForce RTX 3080
min:
32.5 fps, P0.1:
33.3 fps, P1:
39.1 fps, max:
79.3 fps
fps
100%
NVIDIA GeForce RTX 3090:
58.7 [X] MSI GeForce RTX 3090 Suprim X Intel Core i9-9900K 3.6GHz
NVIDIA GeForce RTX 3090
min:
31.4 fps, P0.1:
32.2 fps, P1:
40.7 fps, max:
77.9 fps
59.9 [X] AMD Ryzen 9 5900X 3.7GHz
NVIDIA GeForce RTX 3090
min:
28.9 fps, P0.1:
36.1 fps, P1:
52.8 fps, max:
96.3 fps
~ 59 fps
99%
NVIDIA GeForce RTX 3080:
58.6 [X] MSI GeForce RTX 3080 Gaming X Trio Intel Core i9-9900K 3.6GHz
NVIDIA GeForce RTX 3080
min:
32 fps, P0.1:
34.1 fps, P1:
39.9 fps, max:
78.3 fps
fps
100%
NVIDIA GeForce RTX 3090:
58.7 [X] MSI GeForce RTX 3090 Suprim X Intel Core i9-9900K 3.6GHz
NVIDIA GeForce RTX 3090
min:
31.3 fps, P0.1:
33 fps, P1:
38.8 fps, max:
81.3 fps
59.9 [X] AMD Ryzen 9 5900X 3.7GHz
NVIDIA GeForce RTX 3090
min:
29 fps, P0.1:
35.2 fps, P1:
53.3 fps, max:
101.8 fps
~ 59 fps
99%
NVIDIA GeForce RTX 3080:
58.6 [X] MSI GeForce RTX 3080 Gaming X Trio Intel Core i9-9900K 3.6GHz
NVIDIA GeForce RTX 3080
min:
30 fps, P0.1:
32.2 fps, P1:
39.3 fps, max:
81.6 fps
fps
100%
NVIDIA GeForce RTX 3090:
58.4 [X] MSI GeForce RTX 3090 Suprim X Intel Core i9-9900K 3.6GHz
NVIDIA GeForce RTX 3090
min:
32.1 fps, P0.1:
32.9 fps, P1:
36.9 fps, max:
79.5 fps
59.9 [X] AMD Ryzen 9 5900X 3.7GHz
NVIDIA GeForce RTX 3090
min:
28.2 fps, P0.1:
32.6 fps, P1:
52.8 fps, max:
99.6 fps
~ 59 fps
99%
NVIDIA GeForce RTX 3080:
58.3 [X] MSI GeForce RTX 3080 Gaming X Trio Intel Core i9-9900K 3.6GHz
NVIDIA GeForce RTX 3080
min:
31.3 fps, P0.1:
32.2 fps, P1:
37.4 fps, max:
76.6 fps
fps
100%
NVIDIA GeForce RTX 3090:
209 [X] AMD Ryzen 9 5900X 3.7GHz
NVIDIA GeForce RTX 3090
min:
39.8 fps, P0.1:
160 fps, P1:
173 fps, max:
243 fps
fps
90%
NVIDIA GeForce RTX 3080 Ti:
189 [X] Corsair One i300 Intel Core i9-12900K 3.2GHz
NVIDIA GeForce RTX 3080 Ti
min:
96.7 fps, P0.1:
168 fps, P1:
175 fps, max:
215 fps
fps
100%
NVIDIA GeForce RTX 3090:
150 [X] AMD Ryzen 9 5900X 3.7GHz
NVIDIA GeForce RTX 3090
min:
35.4 fps, P0.1:
124 fps, P1:
131 fps, max:
177 fps
152 [X] MSI GeForce RTX 3090 Suprim X Intel Core i9-9900K 3.6GHz
NVIDIA GeForce RTX 3090
min:
53.5 fps, P0.1:
71.2 fps, P1:
122 fps, max:
218 fps
~ 151 fps
109%
NVIDIA GeForce RTX 3080 Ti:
164 [X] Corsair One i300 Intel Core i9-12900K 3.2GHz
NVIDIA GeForce RTX 3080 Ti
min:
87.7 fps, P0.1:
150 fps, P1:
155 fps, max:
185 fps
fps
92%
NVIDIA GeForce RTX 3080:
139 [X] MSI GeForce RTX 3080 Gaming X Trio Intel Core i9-9900K 3.6GHz
NVIDIA GeForce RTX 3080
min:
66.4 fps, P0.1:
74.9 fps, P1:
118 fps, max:
181 fps
fps
100%
NVIDIA GeForce RTX 3090:
131 [X] AMD Ryzen 9 5900X 3.7GHz
NVIDIA GeForce RTX 3090
min:
34 fps, P0.1:
78 fps, P1:
116 fps, max:
153 fps
140 [X] MSI GeForce RTX 3090 Suprim X Intel Core i9-9900K 3.6GHz
NVIDIA GeForce RTX 3090
min:
53.9 fps, P0.1:
83.4 fps, P1:
119 fps, max:
212 fps
~ 136 fps
110%
NVIDIA GeForce RTX 3080 Ti:
149 [X] Corsair One i300 Intel Core i9-12900K 3.2GHz
NVIDIA GeForce RTX 3080 Ti
min:
93.5 fps, P0.1:
133 fps, P1:
141 fps, max:
168 fps
fps
94%
NVIDIA GeForce RTX 3080:
128 [X] MSI GeForce RTX 3080 Gaming X Trio Intel Core i9-9900K 3.6GHz
NVIDIA GeForce RTX 3080
min:
60.1 fps, P0.1:
66 fps, P1:
109 fps, max:
178 fps
fps
100%
NVIDIA GeForce RTX 3090:
98.7 [X] AMD Ryzen 9 5900X 3.7GHz
NVIDIA GeForce RTX 3090
min:
31.7 fps, P0.1:
35.1 fps, P1:
90 fps, max:
121 fps
106 [X] MSI GeForce RTX 3090 Suprim X Intel Core i9-9900K 3.6GHz
NVIDIA GeForce RTX 3090
min:
56.5 fps, P0.1:
60.7 fps, P1:
92.7 fps, max:
128 fps
~ 102 fps
107%
NVIDIA GeForce RTX 3080 Ti:
109 [X] Corsair One i300 Intel Core i9-12900K 3.2GHz
NVIDIA GeForce RTX 3080 Ti
min:
77.5 fps, P0.1:
86.8 fps, P1:
103 fps, max:
126 fps
fps
93%
NVIDIA GeForce RTX 3080:
94.6 [X] MSI GeForce RTX 3080 Gaming X Trio Intel Core i9-9900K 3.6GHz
NVIDIA GeForce RTX 3080
min:
49.2 fps, P0.1:
59.1 fps, P1:
83.9 fps, max:
125 fps
fps
100%
NVIDIA GeForce RTX 3090:
57.3 [X] AMD Ryzen 9 5900X 3.7GHz
NVIDIA GeForce RTX 3090
min:
27.6 fps, P0.1:
30.3 fps, P1:
53.8 fps, max:
67.9 fps
62.1 [X] MSI GeForce RTX 3090 Suprim X Intel Core i9-9900K 3.6GHz
NVIDIA GeForce RTX 3090
min:
41.7 fps, P0.1:
51.1 fps, P1:
56.6 fps, max:
73.5 fps
~ 60 fps
103%
NVIDIA GeForce RTX 3080 Ti:
61.5 [X] Corsair One i300 Intel Core i9-12900K 3.2GHz
NVIDIA GeForce RTX 3080 Ti
min:
47.6 fps, P0.1:
49.4 fps, P1:
57.8 fps, max:
70.9 fps
fps
90%
NVIDIA GeForce RTX 3080:
53.8 [X] MSI GeForce RTX 3080 Gaming X Trio Intel Core i9-9900K 3.6GHz
NVIDIA GeForce RTX 3080
min:
34.4 fps, P0.1:
42.8 fps, P1:
49.9 fps, max:
63.7 fps
fps
100%
NVIDIA GeForce RTX 3090:
360 [X] AMD Ryzen 9 5900X 3.7GHz
NVIDIA GeForce RTX 3090
fps
101%
NVIDIA GeForce RTX 3080 Ti:
365 [X] Corsair One i300 Intel Core i9-12900K 3.2GHz
NVIDIA GeForce RTX 3080 Ti
min:
268 fps, max:
415 fps
fps
100%
NVIDIA GeForce RTX 3090:
286 [X] AMD Ryzen 9 5900X 3.7GHz
NVIDIA GeForce RTX 3090
347 [X] MSI GeForce RTX 3090 Suprim X Intel Core i9-9900K 3.6GHz
NVIDIA GeForce RTX 3090
min:
261 fps
~ 317 fps
111%
NVIDIA GeForce RTX 3080 Ti:
353 [X] Corsair One i300 Intel Core i9-12900K 3.2GHz
NVIDIA GeForce RTX 3080 Ti
min:
264 fps, max:
407 fps
fps
104%
NVIDIA GeForce RTX 3080:
330 [X] MSI GeForce RTX 3080 Gaming X Trio Intel Core i9-9900K 3.6GHz
NVIDIA GeForce RTX 3080
min:
256 fps
fps
100%
NVIDIA GeForce RTX 3090:
278 [X] AMD Ryzen 9 5900X 3.7GHz
NVIDIA GeForce RTX 3090
341 [X] MSI GeForce RTX 3090 Suprim X Intel Core i9-9900K 3.6GHz
NVIDIA GeForce RTX 3090
min:
268 fps
~ 310 fps
112%
NVIDIA GeForce RTX 3080 Ti:
348 [X] Corsair One i300 Intel Core i9-12900K 3.2GHz
NVIDIA GeForce RTX 3080 Ti
min:
264 fps, max:
402 fps
fps
105%
NVIDIA GeForce RTX 3080:
324 [X] MSI GeForce RTX 3080 Gaming X Trio Intel Core i9-9900K 3.6GHz
NVIDIA GeForce RTX 3080
min:
254 fps
fps
100%
NVIDIA GeForce RTX 3090:
241 [X] AMD Ryzen 9 5900X 3.7GHz
NVIDIA GeForce RTX 3090
287 [X] MSI GeForce RTX 3090 Suprim X Intel Core i9-9900K 3.6GHz
NVIDIA GeForce RTX 3090
min:
200 fps
~ 264 fps
107%
NVIDIA GeForce RTX 3080 Ti:
282 [X] Corsair One i300 Intel Core i9-12900K 3.2GHz
NVIDIA GeForce RTX 3080 Ti
min:
188 fps, max:
338 fps
fps
100%
NVIDIA GeForce RTX 3080:
263 [X] MSI GeForce RTX 3080 Gaming X Trio Intel Core i9-9900K 3.6GHz
NVIDIA GeForce RTX 3080
min:
159 fps
fps
100%
NVIDIA GeForce RTX 3090:
175 [X] AMD Ryzen 9 5900X 3.7GHz
NVIDIA GeForce RTX 3090
203 [X] MSI GeForce RTX 3090 Suprim X Intel Core i9-9900K 3.6GHz
NVIDIA GeForce RTX 3090
min:
112 fps
~ 189 fps
103%
NVIDIA GeForce RTX 3080 Ti:
194 [X] Corsair One i300 Intel Core i9-12900K 3.2GHz
NVIDIA GeForce RTX 3080 Ti
min:
112 fps, max:
231 fps
fps
96%
NVIDIA GeForce RTX 3080:
181 [X] MSI GeForce RTX 3080 Gaming X Trio Intel Core i9-9900K 3.6GHz
NVIDIA GeForce RTX 3080
min:
106 fps
fps
100%
NVIDIA GeForce RTX 3090:
99 [X] AMD Ryzen 9 5900X 3.7GHz
NVIDIA GeForce RTX 3090
111 [X] MSI GeForce RTX 3090 Suprim X Intel Core i9-9900K 3.6GHz
NVIDIA GeForce RTX 3090
min:
60 fps
~ 105 fps
99%
NVIDIA GeForce RTX 3080 Ti:
104 [X] Corsair One i300 Intel Core i9-12900K 3.2GHz
NVIDIA GeForce RTX 3080 Ti
min:
58 fps, max:
126 fps
fps
93%
NVIDIA GeForce RTX 3080:
98 [X] MSI GeForce RTX 3080 Gaming X Trio Intel Core i9-9900K 3.6GHz
NVIDIA GeForce RTX 3080
min:
55 fps
fps
100%
NVIDIA GeForce RTX 3090:
187 [X] AMD Ryzen 9 5900X 3.7GHz
NVIDIA GeForce RTX 3090
min:
50.9 fps, P0.1:
122 fps, P1:
135 fps, max:
361 fps
191 [X] Intel Core i5-13400F 2.5GHz
NVIDIA GeForce RTX 3090
min:
95.6 fps, P0.1:
120.1 fps, P1:
132.2 fps, max:
412 fps
228 [X] Intel Core i5-13600K 3.5GHz
NVIDIA GeForce RTX 3090
min:
109.4 fps, P0.1:
135.8 fps, P1:
155.9 fps, max:
553 fps
240 [X] Intel Core i9-13900K 3GHz
NVIDIA GeForce RTX 3090
min:
100.1 fps, P0.1:
158.2 fps, P1:
178.1 fps, max:
601 fps
244 [X] NVIDIA GeForce RTX 3090 Founders Edition AMD Ryzen 9 7950X 4.5GHz
NVIDIA GeForce RTX 3090
min:
106 fps, P0.1:
166.3 fps, P1:
196.4 fps, max:
393 fps
248 [X] Nvidia GeForce RTX 3090 FE AMD Ryzen 9 7950X 4.5GHz
NVIDIA GeForce RTX 3090
min:
75.5 fps, P0.1:
138.4 fps, P1:
196.7 fps, max:
515 fps
~ 223 fps
97%
NVIDIA GeForce RTX 3080 Ti:
209 [X] Corsair One i300 Intel Core i9-12900K 3.2GHz
NVIDIA GeForce RTX 3080 Ti
min:
101 fps, P0.1:
124 fps, P1:
142 fps, max:
514 fps
212 [X] AMD Ryzen 9 7950X 4.5GHz
NVIDIA GeForce RTX 3080 Ti
min:
72.4 fps, P0.1:
101.6 fps, P1:
172.4 fps, max:
585 fps
229 [X] Intel NUC13 Raptor Canyon Intel Core i9-13900K 3GHz
NVIDIA GeForce RTX 3080 Ti
min:
126.7 fps, P0.1:
149.3 fps, P1:
167.5 fps, max:
541 fps
~ 217 fps
100%
NVIDIA GeForce RTX 3090:
135 [X] MSI GeForce RTX 3090 Suprim X Intel Core i9-9900K 3.6GHz
NVIDIA GeForce RTX 3090
min:
67.1 fps, P0.1:
80.2 fps, P1:
98.5 fps, max:
231 fps
180 [X] AMD Ryzen 9 5900X 3.7GHz
NVIDIA GeForce RTX 3090
min:
72.6 fps, P0.1:
116 fps, P1:
131 fps, max:
314 fps
188.9 [X] Intel Core i5-13400F 2.5GHz
NVIDIA GeForce RTX 3090
min:
96.4 fps, P0.1:
126.7 fps, P1:
137.8 fps, max:
389 fps
204 [X] Intel Core i9-13900K 3GHz
NVIDIA GeForce RTX 3090
min:
117.4 fps, P0.1:
139.9 fps, P1:
164.7 fps, max:
639 fps
205 [X] Intel Core i5-13600K 3.5GHz
NVIDIA GeForce RTX 3090
min:
119.5 fps, P0.1:
135.4 fps, P1:
150.7 fps, max:
432 fps
207 [X] Nvidia GeForce RTX 3090 FE AMD Ryzen 9 7950X 4.5GHz
NVIDIA GeForce RTX 3090
min:
79.1 fps, P0.1:
125.1 fps, P1:
169.5 fps, max:
610 fps
209 [X] NVIDIA GeForce RTX 3090 Founders Edition AMD Ryzen 9 7950X 4.5GHz
NVIDIA GeForce RTX 3090
min:
117.5 fps, P0.1:
146.1 fps, P1:
176.6 fps, max:
550 fps
~ 190 fps
99%
NVIDIA GeForce RTX 3080 Ti:
181 [X] Corsair One i300 Intel Core i9-12900K 3.2GHz
NVIDIA GeForce RTX 3080 Ti
min:
93.1 fps, P0.1:
128 fps, P1:
149 fps, max:
383 fps
184 [X] AMD Ryzen 9 7950X 4.5GHz
NVIDIA GeForce RTX 3080 Ti
200 ~ 188 fps
71%
NVIDIA GeForce RTX 3080:
135 [X] MSI GeForce RTX 3080 Gaming X Trio Intel Core i9-9900K 3.6GHz
NVIDIA GeForce RTX 3080
min:
60.6 fps, P0.1:
83.7 fps, P1:
99.4 fps, max:
237 fps
fps
100%
NVIDIA GeForce RTX 3090:
131 [X] MSI GeForce RTX 3090 Suprim X Intel Core i9-9900K 3.6GHz
NVIDIA GeForce RTX 3090
min:
70.5 fps, P0.1:
82.9 fps, P1:
93.5 fps, max:
233 fps
157 [X] AMD Ryzen 9 5900X 3.7GHz
NVIDIA GeForce RTX 3090
min:
70.6 fps, P0.1:
95.9 fps, P1:
118 fps, max:
288 fps
168.9 [X] Intel Core i5-13600K 3.5GHz
NVIDIA GeForce RTX 3090
min:
106.7 fps, P0.1:
123.9 fps, P1:
141 fps, max:
397 fps
170.8 [X] Intel Core i9-13900K 3GHz
NVIDIA GeForce RTX 3090
min:
98.3 fps, P0.1:
116.8 fps, P1:
135.7 fps, max:
516 fps
171 [X] Nvidia GeForce RTX 3090 FE AMD Ryzen 9 7950X 4.5GHz
NVIDIA GeForce RTX 3090
min:
64.2 fps, P0.1:
104.9 fps, P1:
130.2 fps, max:
443 fps
172.7 [X] Intel Core i5-13400F 2.5GHz
NVIDIA GeForce RTX 3090
min:
100.5 fps, P0.1:
123.9 fps, P1:
134.9 fps, max:
321 fps
173.7 [X] NVIDIA GeForce RTX 3090 Founders Edition AMD Ryzen 9 7950X 4.5GHz
NVIDIA GeForce RTX 3090
min:
104.9 fps, P0.1:
122.7 fps, P1:
146.3 fps, max:
461 fps
~ 164 fps
102%
NVIDIA GeForce RTX 3080 Ti:
163 [X] Corsair One i300 Intel Core i9-12900K 3.2GHz
NVIDIA GeForce RTX 3080 Ti
min:
90.9 fps, P0.1:
125 fps, P1:
139 fps, max:
320 fps
166.6 [X] Intel NUC13 Raptor Canyon Intel Core i9-13900K 3GHz
NVIDIA GeForce RTX 3080 Ti
min:
87.1 fps, P0.1:
122.5 fps, P1:
139.1 fps, max:
384 fps
173.6 [X] AMD Ryzen 9 7950X 4.5GHz
NVIDIA GeForce RTX 3080 Ti
min:
61.5 fps, P0.1:
74.1 fps, P1:
145.8 fps, max:
483 fps
~ 168 fps
80%
NVIDIA GeForce RTX 3080:
131 [X] MSI GeForce RTX 3080 Gaming X Trio Intel Core i9-9900K 3.6GHz
NVIDIA GeForce RTX 3080
min:
67 fps, P0.1:
77.9 fps, P1:
93.4 fps, max:
226 fps
fps
100%
NVIDIA GeForce RTX 3090:
115 [X] AMD Ryzen 9 5900X 3.7GHz
NVIDIA GeForce RTX 3090
min:
80.5 fps, P0.1:
84.1 fps, P1:
92.8 fps, max:
224 fps
119 [X] MSI GeForce RTX 3090 Suprim X Intel Core i9-9900K 3.6GHz
NVIDIA GeForce RTX 3090
min:
68.2 fps, P0.1:
75.2 fps, P1:
85.1 fps, max:
218 fps
120.5 [X] Nvidia GeForce RTX 3090 FE AMD Ryzen 9 7950X 4.5GHz
NVIDIA GeForce RTX 3090
min:
61.9 fps, P0.1:
69.3 fps, P1:
97.8 fps, max:
397 fps
121.9 [X] Intel Core i9-13900K 3GHz
NVIDIA GeForce RTX 3090
min:
73.7 fps, P0.1:
88.8 fps, P1:
101.7 fps, max:
337 fps
122 [X] Intel Core i5-13600K 3.5GHz
NVIDIA GeForce RTX 3090
min:
76.1 fps, P0.1:
97.3 fps, P1:
104.6 fps, max:
284 fps
122.9 [X] Intel Core i5-13400F 2.5GHz
NVIDIA GeForce RTX 3090
min:
84.5 fps, P0.1:
89.3 fps, P1:
103.5 fps, max:
249 fps
124.4 [X] NVIDIA GeForce RTX 3090 Founders Edition AMD Ryzen 9 7950X 4.5GHz
NVIDIA GeForce RTX 3090
min:
92.2 fps, P0.1:
96.6 fps, P1:
105.4 fps, max:
232 fps
~ 121 fps
99%
NVIDIA GeForce RTX 3080 Ti:
117 [X] Corsair One i300 Intel Core i9-12900K 3.2GHz
NVIDIA GeForce RTX 3080 Ti
min:
92.7 fps, P0.1:
94.9 fps, P1:
101 fps, max:
156 fps
119.6 124.4 [X] AMD Ryzen 9 7950X 4.5GHz
NVIDIA GeForce RTX 3080 Ti
min:
50.6 fps, P0.1:
66.1 fps, P1:
105.1 fps, max:
676 fps
~ 120 fps
91%
NVIDIA GeForce RTX 3080:
110 [X] MSI GeForce RTX 3080 Gaming X Trio Intel Core i9-9900K 3.6GHz
NVIDIA GeForce RTX 3080
min:
60.5 fps, P0.1:
69.8 fps, P1:
79.6 fps, max:
176 fps
fps
100%
NVIDIA GeForce RTX 3090:
96.9 [X] AMD Ryzen 9 5900X 3.7GHz
NVIDIA GeForce RTX 3090
min:
68.6 fps, P0.1:
75 fps, P1:
81.2 fps, max:
138 fps
104.3 [X] Intel Core i5-13400F 2.5GHz
NVIDIA GeForce RTX 3090
min:
72.5 fps, P0.1:
75.7 fps, P1:
89.7 fps, max:
193.2 fps
105 [X] MSI GeForce RTX 3090 Suprim X Intel Core i9-9900K 3.6GHz
NVIDIA GeForce RTX 3090
min:
64.8 fps, P0.1:
66.7 fps, P1:
78.5 fps, max:
222 fps
106.5 [X] Intel Core i5-13600K 3.5GHz
NVIDIA GeForce RTX 3090
min:
73.4 fps, P0.1:
86.4 fps, P1:
90.7 fps, max:
149.4 fps
106.5 [X] Nvidia GeForce RTX 3090 FE AMD Ryzen 9 7950X 4.5GHz
NVIDIA GeForce RTX 3090
min:
51.7 fps, P0.1:
77.3 fps, P1:
90.6 fps, max:
225 fps
108.4 [X] Intel Core i9-13900K 3GHz
NVIDIA GeForce RTX 3090
min:
76.7 fps, P0.1:
83.8 fps, P1:
94.4 fps, max:
179.3 fps
110.3 [X] NVIDIA GeForce RTX 3090 Founders Edition AMD Ryzen 9 7950X 4.5GHz
NVIDIA GeForce RTX 3090
min:
73.1 fps, P0.1:
88.9 fps, P1:
95.3 fps, max:
193.9 fps
~ 105 fps
99%
NVIDIA GeForce RTX 3080 Ti:
98.7 [X] Corsair One i300 Intel Core i9-12900K 3.2GHz
NVIDIA GeForce RTX 3080 Ti
min:
70.8 fps, P0.1:
82.4 fps, P1:
86.8 fps, max:
149 fps
105.8 [X] Intel NUC13 Raptor Canyon Intel Core i9-13900K 3GHz
NVIDIA GeForce RTX 3080 Ti
min:
85.8 fps, P0.1:
87.3 fps, P1:
91.3 fps, max:
158.1 fps
108.1 [X] AMD Ryzen 9 7950X 4.5GHz
NVIDIA GeForce RTX 3080 Ti
min:
46.8 fps, P0.1:
65.8 fps, P1:
90.9 fps, max:
393 fps
~ 104 fps
90%
NVIDIA GeForce RTX 3080:
94.1 [X] MSI GeForce RTX 3080 Gaming X Trio Intel Core i9-9900K 3.6GHz
NVIDIA GeForce RTX 3080
min:
57.6 fps, P0.1:
62.3 fps, P1:
76 fps, max:
232 fps
fps
100%
NVIDIA GeForce RTX 3090:
67.8 [X] AMD Ryzen 9 5900X 3.7GHz
NVIDIA GeForce RTX 3090
min:
56 fps, P0.1:
57.8 fps, P1:
60.3 fps, max:
86.8 fps
74.7 [X] MSI GeForce RTX 3090 Suprim X Intel Core i9-9900K 3.6GHz
NVIDIA GeForce RTX 3090
min:
34.1 fps, P0.1:
54.4 fps, P1:
63 fps, max:
126 fps
76.5 [X] Intel Core i5-13600K 3.5GHz
NVIDIA GeForce RTX 3090
min:
62 fps, P0.1:
64.1 fps, P1:
67.9 fps, max:
97.4 fps
76.6 [X] Nvidia GeForce RTX 3090 FE AMD Ryzen 9 7950X 4.5GHz
NVIDIA GeForce RTX 3090
min:
43 fps, P0.1:
56.2 fps, P1:
67.4 fps, max:
180.4 fps
77 [X] NVIDIA GeForce RTX 3090 Founders Edition AMD Ryzen 9 7950X 4.5GHz
NVIDIA GeForce RTX 3090
min:
63.6 fps, P0.1:
65.2 fps, P1:
69.6 fps, max:
98.8 fps
77.1 [X] Intel Core i9-13900K 3GHz
NVIDIA GeForce RTX 3090
min:
54.5 fps, P0.1:
64.1 fps, P1:
68.3 fps, max:
124.3 fps
77.8 [X] Intel Core i5-13400F 2.5GHz
NVIDIA GeForce RTX 3090
min:
62.6 fps, P0.1:
64 fps, P1:
67 fps, max:
106.5 fps
~ 75 fps
97%
NVIDIA GeForce RTX 3080 Ti:
64.7 [X] Corsair One i300 Intel Core i9-12900K 3.2GHz
NVIDIA GeForce RTX 3080 Ti
min:
35.8 fps, P0.1:
54.7 fps, P1:
58.8 fps, max:
246 fps
77.5 77.8 [X] AMD Ryzen 9 7950X 4.5GHz
NVIDIA GeForce RTX 3080 Ti
min:
49.8 fps, P0.1:
55.4 fps, P1:
69.1 fps, max:
158.8 fps
~ 73 fps
88%
NVIDIA GeForce RTX 3080:
66.2 [X] MSI GeForce RTX 3080 Gaming X Trio Intel Core i9-9900K 3.6GHz
NVIDIA GeForce RTX 3080
min:
37.6 fps, P0.1:
51.1 fps, P1:
56.1 fps, max:
284 fps
fps
100%
NVIDIA GeForce RTX 3090:
165 [X] AMD Ryzen 9 5900X 3.7GHz
NVIDIA GeForce RTX 3090
min:
46.5 fps, P0.1:
76.4 fps, P1:
114 fps, max:
328 fps
179 [X] MSI GeForce RTX 3090 Suprim X Intel Core i9-9900K 3.6GHz
NVIDIA GeForce RTX 3090
min:
40 fps, P0.1:
64.1 fps, P1:
115 fps, max:
333 fps
~ 172 fps
133%
NVIDIA GeForce RTX 3080 Ti:
229 [X] Corsair One i300 Intel Core i9-12900K 3.2GHz
NVIDIA GeForce RTX 3080 Ti
min:
81.1 fps, P0.1:
121 fps, P1:
163 fps, max:
418 fps
fps
101%
NVIDIA GeForce RTX 3080:
174 [X] MSI GeForce RTX 3080 Gaming X Trio Intel Core i9-9900K 3.6GHz
NVIDIA GeForce RTX 3080
min:
39.5 fps, P0.1:
66.2 fps, P1:
110 fps, max:
320 fps
fps
100%
NVIDIA GeForce RTX 3090:
142 [X] AMD Ryzen 9 5900X 3.7GHz
NVIDIA GeForce RTX 3090
min:
44.3 fps, P0.1:
66.8 fps, P1:
101 fps, max:
254 fps
155 [X] MSI GeForce RTX 3090 Suprim X Intel Core i9-9900K 3.6GHz
NVIDIA GeForce RTX 3090
min:
47.5 fps, P0.1:
65.2 fps, P1:
100 fps, max:
371 fps
~ 149 fps
133%
NVIDIA GeForce RTX 3080 Ti:
198 [X] Corsair One i300 Intel Core i9-12900K 3.2GHz
NVIDIA GeForce RTX 3080 Ti
min:
77.9 fps, P0.1:
124 fps, P1:
148 fps, max:
373 fps
fps
101%
NVIDIA GeForce RTX 3080:
151 [X] MSI GeForce RTX 3080 Gaming X Trio Intel Core i9-9900K 3.6GHz
NVIDIA GeForce RTX 3080
min:
48 fps, P0.1:
68.7 fps, P1:
101 fps, max:
251 fps
fps
100%
NVIDIA GeForce RTX 3090:
144 [X] AMD Ryzen 9 5900X 3.7GHz
NVIDIA GeForce RTX 3090
min:
45.3 fps, P0.1:
71.8 fps, P1:
101 fps, max:
268 fps
148 [X] MSI GeForce RTX 3090 Suprim X Intel Core i9-9900K 3.6GHz
NVIDIA GeForce RTX 3090
min:
58.7 fps, P0.1:
76.5 fps, P1:
103 fps, max:
245 fps
~ 146 fps
129%
NVIDIA GeForce RTX 3080 Ti:
188 [X] Corsair One i300 Intel Core i9-12900K 3.2GHz
NVIDIA GeForce RTX 3080 Ti
min:
54 fps, P0.1:
81.2 fps, P1:
141 fps, max:
453 fps
fps
97%
NVIDIA GeForce RTX 3080:
142 [X] MSI GeForce RTX 3080 Gaming X Trio Intel Core i9-9900K 3.6GHz
NVIDIA GeForce RTX 3080
min:
48.7 fps, P0.1:
70.4 fps, P1:
94.9 fps, max:
281 fps
fps
100%
NVIDIA GeForce RTX 3090:
110 [X] AMD Ryzen 9 5900X 3.7GHz
NVIDIA GeForce RTX 3090
min:
51.2 fps, P0.1:
66.9 fps, P1:
83.3 fps, max:
250 fps
121 [X] MSI GeForce RTX 3090 Suprim X Intel Core i9-9900K 3.6GHz
NVIDIA GeForce RTX 3090
min:
37.3 fps, P0.1:
72.5 fps, P1:
87.5 fps, max:
242 fps
~ 116 fps
122%
NVIDIA GeForce RTX 3080 Ti:
142 [X] Corsair One i300 Intel Core i9-12900K 3.2GHz
NVIDIA GeForce RTX 3080 Ti
min:
52.8 fps, P0.1:
92.4 fps, P1:
113 fps, max:
329 fps
fps
98%
NVIDIA GeForce RTX 3080:
114 [X] MSI GeForce RTX 3080 Gaming X Trio Intel Core i9-9900K 3.6GHz
NVIDIA GeForce RTX 3080
min:
45.4 fps, P0.1:
64.5 fps, P1:
82.1 fps, max:
224 fps
fps
100%
NVIDIA GeForce RTX 3090:
73.6 [X] AMD Ryzen 9 5900X 3.7GHz
NVIDIA GeForce RTX 3090
min:
43.7 fps, P0.1:
44.5 fps, P1:
57.9 fps, max:
194 fps
76.9 [X] MSI GeForce RTX 3090 Suprim X Intel Core i9-9900K 3.6GHz
NVIDIA GeForce RTX 3090
min:
33.3 fps, P0.1:
39.2 fps, P1:
58 fps, max:
251 fps
~ 75 fps
111%
NVIDIA GeForce RTX 3080 Ti:
83.1 [X] Corsair One i300 Intel Core i9-12900K 3.2GHz
NVIDIA GeForce RTX 3080 Ti
min:
41 fps, P0.1:
49.9 fps, P1:
66.9 fps, max:
286 fps
fps
93%
NVIDIA GeForce RTX 3080:
70.1 [X] MSI GeForce RTX 3080 Gaming X Trio Intel Core i9-9900K 3.6GHz
NVIDIA GeForce RTX 3080
min:
33.2 fps, P0.1:
37.4 fps, P1:
55.3 fps, max:
159 fps
fps
100%
NVIDIA GeForce RTX 3090:
270 [X] AMD Ryzen 9 5900X 3.7GHz
NVIDIA GeForce RTX 3090
min:
18.5 fps, P0.1:
29.4 fps, P1:
158 fps, max:
364 fps
fps
129%
NVIDIA GeForce RTX 3080 Ti:
349 [X] Corsair One i300 Intel Core i9-12900K 3.2GHz
NVIDIA GeForce RTX 3080 Ti
min:
24 fps, P0.1:
152 fps, P1:
200 fps, max:
448 fps
fps
100%
NVIDIA GeForce RTX 3090:
173 [X] MSI GeForce RTX 3090 Suprim X Intel Core i9-9900K 3.6GHz
NVIDIA GeForce RTX 3090
min:
7.01 fps, P0.1:
22 fps, P1:
125 fps, max:
266 fps
219 [X] AMD Ryzen 9 5900X 3.7GHz
NVIDIA GeForce RTX 3090
min:
11.8 fps, P0.1:
25.2 fps, P1:
150 fps, max:
285 fps
~ 196 fps
138%
NVIDIA GeForce RTX 3080 Ti:
270 [X] Corsair One i300 Intel Core i9-12900K 3.2GHz
NVIDIA GeForce RTX 3080 Ti
min:
28 fps, P0.1:
112 fps, P1:
199 fps, max:
333 fps
fps
85%
NVIDIA GeForce RTX 3080:
166 [X] MSI GeForce RTX 3080 Gaming X Trio Intel Core i9-9900K 3.6GHz
NVIDIA GeForce RTX 3080
min:
7.08 fps, P0.1:
21.9 fps, P1:
125 fps, max:
266 fps
fps
100%
NVIDIA GeForce RTX 3090:
156 [X] MSI GeForce RTX 3090 Suprim X Intel Core i9-9900K 3.6GHz
NVIDIA GeForce RTX 3090
min:
72.5 fps, P0.1:
102 fps, P1:
129 fps, max:
211 fps
190 [X] AMD Ryzen 9 5900X 3.7GHz
NVIDIA GeForce RTX 3090
min:
8.86 fps, P0.1:
24.2 fps, P1:
132 fps, max:
245 fps
~ 173 fps
131%
NVIDIA GeForce RTX 3080 Ti:
226 [X] Corsair One i300 Intel Core i9-12900K 3.2GHz
NVIDIA GeForce RTX 3080 Ti
min:
20.3 fps, P0.1:
110 fps, P1:
172 fps, max:
280 fps
fps
89%
NVIDIA GeForce RTX 3080:
154 [X] MSI GeForce RTX 3080 Gaming X Trio Intel Core i9-9900K 3.6GHz
NVIDIA GeForce RTX 3080
min:
17.8 fps, P0.1:
73.8 fps, P1:
114 fps, max:
220 fps
fps
100%
NVIDIA GeForce RTX 3090:
139 [X] MSI GeForce RTX 3090 Suprim X Intel Core i9-9900K 3.6GHz
NVIDIA GeForce RTX 3090
min:
18.7 fps, P0.1:
67.4 fps, P1:
102 fps, max:
211 fps
168 [X] AMD Ryzen 9 5900X 3.7GHz
NVIDIA GeForce RTX 3090
min:
17 fps, P0.1:
26.5 fps, P1:
125 fps, max:
217 fps
~ 154 fps
132%
NVIDIA GeForce RTX 3080 Ti:
203 [X] Corsair One i300 Intel Core i9-12900K 3.2GHz
NVIDIA GeForce RTX 3080 Ti
min:
26.6 fps, P0.1:
106 fps, P1:
154 fps, max:
253 fps
fps
90%
NVIDIA GeForce RTX 3080:
138 [X] MSI GeForce RTX 3080 Gaming X Trio Intel Core i9-9900K 3.6GHz
NVIDIA GeForce RTX 3080
min:
62 fps, P0.1:
75.6 fps, P1:
92.3 fps, max:
207 fps
fps
100%
NVIDIA GeForce RTX 3090:
137 [X] MSI GeForce RTX 3090 Suprim X Intel Core i9-9900K 3.6GHz
NVIDIA GeForce RTX 3090
min:
20 fps, P0.1:
68.1 fps, P1:
97 fps, max:
214 fps
169 [X] AMD Ryzen 9 5900X 3.7GHz
NVIDIA GeForce RTX 3090
min:
27.9 fps, P0.1:
91.7 fps, P1:
129 fps, max:
219 fps
~ 153 fps
131%
NVIDIA GeForce RTX 3080 Ti:
201 [X] Corsair One i300 Intel Core i9-12900K 3.2GHz
NVIDIA GeForce RTX 3080 Ti
min:
63.1 fps, P0.1:
104 fps, P1:
150 fps, max:
242 fps
fps
89%
NVIDIA GeForce RTX 3080:
136 [X] MSI GeForce RTX 3080 Gaming X Trio Intel Core i9-9900K 3.6GHz
NVIDIA GeForce RTX 3080
min:
20.9 fps, P0.1:
70.2 fps, P1:
101 fps, max:
204 fps
fps
100%
NVIDIA GeForce RTX 3090:
132 [X] MSI GeForce RTX 3090 Suprim X Intel Core i9-9900K 3.6GHz
NVIDIA GeForce RTX 3090
min:
17.1 fps, P0.1:
18.8 fps, P1:
101 fps, max:
203 fps
145 [X] AMD Ryzen 9 5900X 3.7GHz
NVIDIA GeForce RTX 3090
min:
58.3 fps, P0.1:
83.1 fps, P1:
109 fps, max:
186 fps
~ 139 fps
113%
NVIDIA GeForce RTX 3080 Ti:
157 [X] Corsair One i300 Intel Core i9-12900K 3.2GHz
NVIDIA GeForce RTX 3080 Ti
min:
43.8 fps, P0.1:
87.8 fps, P1:
118 fps, max:
206 fps
fps
92%
NVIDIA GeForce RTX 3080:
128 [X] MSI GeForce RTX 3080 Gaming X Trio Intel Core i9-9900K 3.6GHz
NVIDIA GeForce RTX 3080
min:
13.6 fps, P0.1:
17.7 fps, P1:
105 fps, max:
199 fps
fps
100%
NVIDIA GeForce RTX 3090:
105 [X] AMD Ryzen 9 5900X 3.7GHz
NVIDIA GeForce RTX 3090
min:
60.9 fps, P0.1:
71.2 fps, P1:
83.7 fps, max:
134 fps
fps
206%
NVIDIA GeForce RTX 3080 Ti:
216 [X] Corsair One i300 Intel Core i9-12900K 3.2GHz
NVIDIA GeForce RTX 3080 Ti
min:
17.8 fps, P0.1:
98.3 fps, P1:
150 fps, max:
274 fps
fps
100%
NVIDIA GeForce RTX 3090:
134 [X] MSI GeForce RTX 3090 Suprim X Intel Core i9-9900K 3.6GHz
NVIDIA GeForce RTX 3090
min:
59.7 fps, P0.1:
63.9 fps, P1:
101 fps, max:
172 fps
145 [X] AMD Ryzen 9 5900X 3.7GHz
NVIDIA GeForce RTX 3090
min:
33.9 fps, P0.1:
93 fps, P1:
111 fps, max:
178 fps
~ 140 fps
139%
NVIDIA GeForce RTX 3080 Ti:
194 [X] Corsair One i300 Intel Core i9-12900K 3.2GHz
NVIDIA GeForce RTX 3080 Ti
min:
33.5 fps, P0.1:
128 fps, P1:
153 fps, max:
247 fps
fps
95%
NVIDIA GeForce RTX 3080:
133 [X] MSI GeForce RTX 3080 Gaming X Trio Intel Core i9-9900K 3.6GHz
NVIDIA GeForce RTX 3080
min:
28.4 fps, P0.1:
65.2 fps, P1:
99.1 fps, max:
172 fps
fps
100%
NVIDIA GeForce RTX 3090:
132 [X] MSI GeForce RTX 3090 Suprim X Intel Core i9-9900K 3.6GHz
NVIDIA GeForce RTX 3090
min:
60.7 fps, P0.1:
63.9 fps, P1:
93.1 fps, max:
173 fps
138 [X] AMD Ryzen 9 5900X 3.7GHz
NVIDIA GeForce RTX 3090
min:
85.3 fps, P0.1:
90.1 fps, P1:
107 fps, max:
174 fps
~ 135 fps
125%
NVIDIA GeForce RTX 3080 Ti:
169 [X] Corsair One i300 Intel Core i9-12900K 3.2GHz
NVIDIA GeForce RTX 3080 Ti
min:
84.7 fps, P0.1:
99.1 fps, P1:
128 fps, max:
226 fps
fps
96%
NVIDIA GeForce RTX 3080:
130 [X] MSI GeForce RTX 3080 Gaming X Trio Intel Core i9-9900K 3.6GHz
NVIDIA GeForce RTX 3080
min:
30.3 fps, P0.1:
61.3 fps, P1:
91.7 fps, max:
170 fps
fps
100%
NVIDIA GeForce RTX 3090:
124 [X] MSI GeForce RTX 3090 Suprim X Intel Core i9-9900K 3.6GHz
NVIDIA GeForce RTX 3090
min:
7.84 fps, P0.1:
35.5 fps, P1:
84.6 fps, max:
168 fps
129 [X] AMD Ryzen 9 5900X 3.7GHz
NVIDIA GeForce RTX 3090
min:
83.5 fps, P0.1:
86.3 fps, P1:
97.5 fps, max:
168 fps
~ 127 fps
118%
NVIDIA GeForce RTX 3080 Ti:
150 [X] Corsair One i300 Intel Core i9-12900K 3.2GHz
NVIDIA GeForce RTX 3080 Ti
min:
74.8 fps, P0.1:
83.6 fps, P1:
107 fps, max:
218 fps
fps
97%
NVIDIA GeForce RTX 3080:
123 [X] MSI GeForce RTX 3080 Gaming X Trio Intel Core i9-9900K 3.6GHz
NVIDIA GeForce RTX 3080
min:
7.33 fps, P0.1:
50.3 fps, P1:
84.9 fps, max:
167 fps
fps
100%
NVIDIA GeForce RTX 3090:
118 [X] MSI GeForce RTX 3090 Suprim X Intel Core i9-9900K 3.6GHz
NVIDIA GeForce RTX 3090
min:
7.13 fps, P0.1:
33.4 fps, P1:
81.3 fps, max:
171 fps
119 [X] AMD Ryzen 9 5900X 3.7GHz
NVIDIA GeForce RTX 3090
min:
5.98 fps, P0.1:
46.8 fps, P1:
87.1 fps, max:
167 fps
~ 119 fps
103%
NVIDIA GeForce RTX 3080 Ti:
123 [X] Corsair One i300 Intel Core i9-12900K 3.2GHz
NVIDIA GeForce RTX 3080 Ti
min:
10.6 fps, P0.1:
41.6 fps, P1:
85.4 fps, max:
196 fps
fps
95%
NVIDIA GeForce RTX 3080:
113 [X] MSI GeForce RTX 3080 Gaming X Trio Intel Core i9-9900K 3.6GHz
NVIDIA GeForce RTX 3080
min:
6.92 fps, P0.1:
24.4 fps, P1:
79 fps, max:
165 fps
fps
100%
NVIDIA GeForce RTX 3090:
81.7 [X] AMD Ryzen 9 5900X 3.7GHz
NVIDIA GeForce RTX 3090
86.5 [X] MSI GeForce RTX 3090 Suprim X Intel Core i9-9900K 3.6GHz
NVIDIA GeForce RTX 3090
min:
27 fps, P0.1:
46.5 fps, P1:
59.7 fps, max:
167 fps
~ 84 fps
99%
NVIDIA GeForce RTX 3080 Ti:
83 [X] Corsair One i300 Intel Core i9-12900K 3.2GHz
NVIDIA GeForce RTX 3080 Ti
min:
8.49 fps, P0.1:
24.9 fps, P1:
63.3 fps, max:
169 fps
fps
92%
NVIDIA GeForce RTX 3080:
77.6 [X] MSI GeForce RTX 3080 Gaming X Trio Intel Core i9-9900K 3.6GHz
NVIDIA GeForce RTX 3080
min:
10.6 fps, P0.1:
33.2 fps, P1:
52 fps, max:
155 fps
fps
100%
NVIDIA GeForce RTX 3090:
255 [X] AMD Ryzen 9 5900X 3.7GHz
NVIDIA GeForce RTX 3090
295 334 [X] Intel Core i9-13900K 3GHz
NVIDIA GeForce RTX 3090
337 ~ 305 fps
92%
NVIDIA GeForce RTX 3080 Ti:
256 291 [X] AMD Ryzen 9 7950X 4.5GHz
NVIDIA GeForce RTX 3080 Ti
292 ~ 280 fps
100%
NVIDIA GeForce RTX 3090:
154 [X] MSI GeForce RTX 3090 Suprim X Intel Core i9-9900K 3.6GHz
NVIDIA GeForce RTX 3090
174 [X] AMD Ryzen 9 5900X 3.7GHz
NVIDIA GeForce RTX 3090
205 214 [X] Intel Core i9-13900K 3GHz
NVIDIA GeForce RTX 3090
223 ~ 194 fps
104%
NVIDIA GeForce RTX 3080 Ti:
191 200 215 [X] AMD Ryzen 9 7950X 4.5GHz
NVIDIA GeForce RTX 3080 Ti
~ 202 fps
78%
NVIDIA GeForce RTX 3080:
152 [X] MSI GeForce RTX 3080 Gaming X Trio Intel Core i9-9900K 3.6GHz
NVIDIA GeForce RTX 3080
fps
100%
NVIDIA GeForce RTX 3090:
144 [X] MSI GeForce RTX 3090 Suprim X Intel Core i9-9900K 3.6GHz
NVIDIA GeForce RTX 3090
159 [X] AMD Ryzen 9 5900X 3.7GHz
NVIDIA GeForce RTX 3090
193 196 [X] Intel Core i9-13900K 3GHz
NVIDIA GeForce RTX 3090
202 ~ 179 fps
107%
NVIDIA GeForce RTX 3080 Ti:
182 188 204 [X] AMD Ryzen 9 7950X 4.5GHz
NVIDIA GeForce RTX 3080 Ti
~ 191 fps
78%
NVIDIA GeForce RTX 3080:
140 [X] MSI GeForce RTX 3080 Gaming X Trio Intel Core i9-9900K 3.6GHz
NVIDIA GeForce RTX 3080
fps
100%
NVIDIA GeForce RTX 3090:
106 [X] MSI GeForce RTX 3090 Suprim X Intel Core i9-9900K 3.6GHz
NVIDIA GeForce RTX 3090
111 [X] AMD Ryzen 9 5900X 3.7GHz
NVIDIA GeForce RTX 3090
127 [X] Intel Core i9-13900K 3GHz
NVIDIA GeForce RTX 3090
129 129 ~ 120 fps
110%
NVIDIA GeForce RTX 3080 Ti:
126 129 141 [X] AMD Ryzen 9 7950X 4.5GHz
NVIDIA GeForce RTX 3080 Ti
~ 132 fps
83%
NVIDIA GeForce RTX 3080:
100 [X] MSI GeForce RTX 3080 Gaming X Trio Intel Core i9-9900K 3.6GHz
NVIDIA GeForce RTX 3080
fps
100%
NVIDIA GeForce RTX 3090:
100 [X] MSI GeForce RTX 3090 Suprim X Intel Core i9-9900K 3.6GHz
NVIDIA GeForce RTX 3090
100 [X] AMD Ryzen 9 5900X 3.7GHz
NVIDIA GeForce RTX 3090
113 [X] Intel Core i9-13900K 3GHz
NVIDIA GeForce RTX 3090
114 114 ~ 108 fps
108%
NVIDIA GeForce RTX 3080 Ti:
111 117 124 [X] AMD Ryzen 9 7950X 4.5GHz
NVIDIA GeForce RTX 3080 Ti
~ 117 fps
86%
NVIDIA GeForce RTX 3080:
93 [X] MSI GeForce RTX 3080 Gaming X Trio Intel Core i9-9900K 3.6GHz
NVIDIA GeForce RTX 3080
fps
100%
NVIDIA GeForce RTX 3090:
77 [X] AMD Ryzen 9 5900X 3.7GHz
NVIDIA GeForce RTX 3090
81 [X] MSI GeForce RTX 3090 Suprim X Intel Core i9-9900K 3.6GHz
NVIDIA GeForce RTX 3090
84 84 85 [X] Intel Core i9-13900K 3GHz
NVIDIA GeForce RTX 3090
~ 82 fps
106%
NVIDIA GeForce RTX 3080 Ti:
84 87 90 [X] AMD Ryzen 9 7950X 4.5GHz
NVIDIA GeForce RTX 3080 Ti
~ 87 fps
91%
NVIDIA GeForce RTX 3080:
75 [X] MSI GeForce RTX 3080 Gaming X Trio Intel Core i9-9900K 3.6GHz
NVIDIA GeForce RTX 3080
fps
100%
NVIDIA GeForce RTX 3090:
116 [X] AMD Ryzen 9 5900X 3.7GHz
NVIDIA GeForce RTX 3090
min:
64.6 fps, P0.1:
95.4 fps, P1:
102 fps, max:
389 fps
fps
100%
NVIDIA GeForce RTX 3090:
172 [X] AMD Ryzen 9 5900X 3.7GHz
NVIDIA GeForce RTX 3090
min:
93.3 fps, P0.1:
132 fps, P1:
143 fps, max:
342 fps
188 [X] MSI GeForce RTX 3090 Suprim X Intel Core i9-9900K 3.6GHz
NVIDIA GeForce RTX 3090
min:
87.1 fps, P0.1:
111 fps, P1:
132 fps, max:
377 fps
~ 180 fps
99%
NVIDIA GeForce RTX 3080:
179 [X] MSI GeForce RTX 3080 Gaming X Trio Intel Core i9-9900K 3.6GHz
NVIDIA GeForce RTX 3080
min:
103 fps, P0.1:
117 fps, P1:
137 fps, max:
380 fps
fps
100%
NVIDIA GeForce RTX 3090:
179 [X] AMD Ryzen 9 5900X 3.7GHz
NVIDIA GeForce RTX 3090
min:
68.9 fps, P0.1:
129 fps, P1:
145 fps, max:
363 fps
185 [X] MSI GeForce RTX 3090 Suprim X Intel Core i9-9900K 3.6GHz
NVIDIA GeForce RTX 3090
min:
113 fps, P0.1:
128 fps, P1:
144 fps, max:
373 fps
~ 182 fps
97%
NVIDIA GeForce RTX 3080:
176 [X] MSI GeForce RTX 3080 Gaming X Trio Intel Core i9-9900K 3.6GHz
NVIDIA GeForce RTX 3080
min:
89.1 fps, P0.1:
105 fps, P1:
124 fps, max:
377 fps
fps
100%
NVIDIA GeForce RTX 3090:
166 [X] AMD Ryzen 9 5900X 3.7GHz
NVIDIA GeForce RTX 3090
min:
121 fps, P0.1:
128 fps, P1:
137 fps, max:
255 fps
174 [X] MSI GeForce RTX 3090 Suprim X Intel Core i9-9900K 3.6GHz
NVIDIA GeForce RTX 3090
min:
94.9 fps, P0.1:
118 fps, P1:
136 fps, max:
336 fps
~ 170 fps
95%
NVIDIA GeForce RTX 3080:
161 [X] MSI GeForce RTX 3080 Gaming X Trio Intel Core i9-9900K 3.6GHz
NVIDIA GeForce RTX 3080
min:
68.8 fps, P0.1:
98.2 fps, P1:
115 fps, max:
352 fps
fps
100%
NVIDIA GeForce RTX 3090:
129 [X] AMD Ryzen 9 5900X 3.7GHz
NVIDIA GeForce RTX 3090
min:
94.4 fps, P0.1:
102 fps, P1:
109 fps, max:
185 fps
138 [X] MSI GeForce RTX 3090 Suprim X Intel Core i9-9900K 3.6GHz
NVIDIA GeForce RTX 3090
min:
86.7 fps, P0.1:
99 fps, P1:
110 fps, max:
309 fps
~ 134 fps
94%
NVIDIA GeForce RTX 3080:
126 [X] MSI GeForce RTX 3080 Gaming X Trio Intel Core i9-9900K 3.6GHz
NVIDIA GeForce RTX 3080
min:
84.8 fps, P0.1:
90.5 fps, P1:
98.8 fps, max:
244 fps
fps
100%
NVIDIA GeForce RTX 3090:
82 [X] AMD Ryzen 9 5900X 3.7GHz
NVIDIA GeForce RTX 3090
min:
45.3 fps, P0.1:
70 fps, P1:
73.4 fps, max:
112 fps
84.8 [X] MSI GeForce RTX 3090 Suprim X Intel Core i9-9900K 3.6GHz
NVIDIA GeForce RTX 3090
min:
53.3 fps, P0.1:
69 fps, P1:
72.9 fps, max:
130 fps
~ 83 fps
94%
NVIDIA GeForce RTX 3080:
77.7 [X] MSI GeForce RTX 3080 Gaming X Trio Intel Core i9-9900K 3.6GHz
NVIDIA GeForce RTX 3080
min:
43.8 fps, P0.1:
60.5 fps, P1:
65.7 fps, max:
241 fps
fps
100%
NVIDIA GeForce RTX 3090:
221 [X] AMD Ryzen 9 5900X 3.7GHz
NVIDIA GeForce RTX 3090
min:
158 fps, max:
300 fps
fps
129%
NVIDIA GeForce RTX 3080 Ti:
284 fps
100%
NVIDIA GeForce RTX 3090:
164 [X] MSI GeForce RTX 3090 Suprim X Intel Core i9-9900K 3.6GHz
NVIDIA GeForce RTX 3090
min:
118 fps
203 [X] AMD Ryzen 9 5900X 3.7GHz
NVIDIA GeForce RTX 3090
min:
165 fps, max:
251 fps
~ 184 fps
120%
NVIDIA GeForce RTX 3080 Ti:
220 fps
83%
NVIDIA GeForce RTX 3080:
152 [X] MSI GeForce RTX 3080 Gaming X Trio Intel Core i9-9900K 3.6GHz
NVIDIA GeForce RTX 3080
min:
114 fps
fps
100%
NVIDIA GeForce RTX 3090:
156 [X] MSI GeForce RTX 3090 Suprim X Intel Core i9-9900K 3.6GHz
NVIDIA GeForce RTX 3090
min:
111 fps
175 [X] AMD Ryzen 9 5900X 3.7GHz
NVIDIA GeForce RTX 3090
min:
139 fps, max:
219 fps
~ 166 fps
113%
NVIDIA GeForce RTX 3080 Ti:
188 fps
87%
NVIDIA GeForce RTX 3080:
144 [X] MSI GeForce RTX 3080 Gaming X Trio Intel Core i9-9900K 3.6GHz
NVIDIA GeForce RTX 3080
min:
111 fps
fps
100%
NVIDIA GeForce RTX 3090:
151 [X] MSI GeForce RTX 3090 Suprim X Intel Core i9-9900K 3.6GHz
NVIDIA GeForce RTX 3090
min:
103 fps
166 [X] AMD Ryzen 9 5900X 3.7GHz
NVIDIA GeForce RTX 3090
min:
135 fps, max:
207 fps
~ 159 fps
111%
NVIDIA GeForce RTX 3080 Ti:
176 fps
88%
NVIDIA GeForce RTX 3080:
140 [X] MSI GeForce RTX 3080 Gaming X Trio Intel Core i9-9900K 3.6GHz
NVIDIA GeForce RTX 3080
min:
106 fps
fps
100%
NVIDIA GeForce RTX 3090:
123 [X] MSI GeForce RTX 3090 Suprim X Intel Core i9-9900K 3.6GHz
NVIDIA GeForce RTX 3090
min:
104 fps
130 [X] AMD Ryzen 9 5900X 3.7GHz
NVIDIA GeForce RTX 3090
min:
110 fps, max:
166 fps
~ 127 fps
107%
NVIDIA GeForce RTX 3080 Ti:
136 fps
94%
NVIDIA GeForce RTX 3080:
119 [X] MSI GeForce RTX 3080 Gaming X Trio Intel Core i9-9900K 3.6GHz
NVIDIA GeForce RTX 3080
min:
96 fps
fps
100%
NVIDIA GeForce RTX 3090:
79 [X] MSI GeForce RTX 3090 Suprim X Intel Core i9-9900K 3.6GHz
NVIDIA GeForce RTX 3090
min:
67 fps
80 [X] AMD Ryzen 9 5900X 3.7GHz
NVIDIA GeForce RTX 3090
min:
70 fps, max:
101 fps
~ 80 fps
100%
NVIDIA GeForce RTX 3080 Ti:
80 fps
90%
NVIDIA GeForce RTX 3080:
72 [X] MSI GeForce RTX 3080 Gaming X Trio Intel Core i9-9900K 3.6GHz
NVIDIA GeForce RTX 3080
min:
61 fps
fps
100%
NVIDIA GeForce RTX 3090:
134 [X] AMD Ryzen 9 5900X 3.7GHz
NVIDIA GeForce RTX 3090
221 [X] Nvidia GeForce RTX 3090 FE AMD Ryzen 9 7950X 4.5GHz
NVIDIA GeForce RTX 3090
~ 178 fps
109%
NVIDIA GeForce RTX 3080 Ti:
194 fps
100%
NVIDIA GeForce RTX 3090:
116 [X] MSI GeForce RTX 3090 Suprim X Intel Core i9-9900K 3.6GHz
NVIDIA GeForce RTX 3090
min:
58 fps
135 [X] AMD Ryzen 9 5900X 3.7GHz
NVIDIA GeForce RTX 3090
223 [X] Nvidia GeForce RTX 3090 FE AMD Ryzen 9 7950X 4.5GHz
NVIDIA GeForce RTX 3090
~ 158 fps
124%
NVIDIA GeForce RTX 3080 Ti:
196 fps
72%
NVIDIA GeForce RTX 3080:
113 [X] MSI GeForce RTX 3080 Gaming X Trio Intel Core i9-9900K 3.6GHz
NVIDIA GeForce RTX 3080
min:
79 fps
fps
100%
NVIDIA GeForce RTX 3090:
115 [X] MSI GeForce RTX 3090 Suprim X Intel Core i9-9900K 3.6GHz
NVIDIA GeForce RTX 3090
min:
78 fps
136 [X] AMD Ryzen 9 5900X 3.7GHz
NVIDIA GeForce RTX 3090
221 [X] Nvidia GeForce RTX 3090 FE AMD Ryzen 9 7950X 4.5GHz
NVIDIA GeForce RTX 3090
~ 157 fps
122%
NVIDIA GeForce RTX 3080 Ti:
191 fps
71%
NVIDIA GeForce RTX 3080:
112 [X] MSI GeForce RTX 3080 Gaming X Trio Intel Core i9-9900K 3.6GHz
NVIDIA GeForce RTX 3080
min:
68 fps
fps
100%
NVIDIA GeForce RTX 3090:
114 [X] MSI GeForce RTX 3090 Suprim X Intel Core i9-9900K 3.6GHz
NVIDIA GeForce RTX 3090
min:
80 fps
134 [X] AMD Ryzen 9 5900X 3.7GHz
NVIDIA GeForce RTX 3090
218 [X] Nvidia GeForce RTX 3090 FE AMD Ryzen 9 7950X 4.5GHz
NVIDIA GeForce RTX 3090
~ 155 fps
123%
NVIDIA GeForce RTX 3080 Ti:
191 fps
72%
NVIDIA GeForce RTX 3080:
111 [X] MSI GeForce RTX 3080 Gaming X Trio Intel Core i9-9900K 3.6GHz
NVIDIA GeForce RTX 3080
min:
69 fps
fps
100%
NVIDIA GeForce RTX 3090:
113 [X] MSI GeForce RTX 3090 Suprim X Intel Core i9-9900K 3.6GHz
NVIDIA GeForce RTX 3090
min:
71 fps
133 [X] AMD Ryzen 9 5900X 3.7GHz
NVIDIA GeForce RTX 3090
200 [X] Nvidia GeForce RTX 3090 FE AMD Ryzen 9 7950X 4.5GHz
NVIDIA GeForce RTX 3090
~ 149 fps
125%
NVIDIA GeForce RTX 3080 Ti:
186 fps
74%
NVIDIA GeForce RTX 3080:
110 [X] MSI GeForce RTX 3080 Gaming X Trio Intel Core i9-9900K 3.6GHz
NVIDIA GeForce RTX 3080
min:
66 fps
fps
100%
NVIDIA GeForce RTX 3090:
106 [X] MSI GeForce RTX 3090 Suprim X Intel Core i9-9900K 3.6GHz
NVIDIA GeForce RTX 3090
min:
68 fps
106 [X] AMD Ryzen 9 5900X 3.7GHz
NVIDIA GeForce RTX 3090
115 [X] Nvidia GeForce RTX 3090 FE AMD Ryzen 9 7950X 4.5GHz
NVIDIA GeForce RTX 3090
~ 109 fps
101%
NVIDIA GeForce RTX 3080 Ti:
110 fps
87%
NVIDIA GeForce RTX 3080:
95 [X] MSI GeForce RTX 3080 Gaming X Trio Intel Core i9-9900K 3.6GHz
NVIDIA GeForce RTX 3080
min:
68 fps
fps
100%
NVIDIA GeForce RTX 3090:
300 [X] MSI GeForce RTX 3090 Suprim X Intel Core i9-9900K 3.6GHz
NVIDIA GeForce RTX 3090
min:
70.7 fps, P0.1:
139 fps, P1:
173 fps, max:
500 fps
305 [X] AMD Ryzen 9 5900X 3.7GHz
NVIDIA GeForce RTX 3090
min:
21.6 fps, P0.1:
152 fps, P1:
188 fps, max:
512 fps
~ 303 fps
96%
NVIDIA GeForce RTX 3080:
290 [X] MSI GeForce RTX 3080 Gaming X Trio Intel Core i9-9900K 3.6GHz
NVIDIA GeForce RTX 3080
min:
116 fps, P0.1:
129 fps, P1:
168 fps, max:
491 fps
fps
100%
NVIDIA GeForce RTX 3090:
274 [X] MSI GeForce RTX 3090 Suprim X Intel Core i9-9900K 3.6GHz
NVIDIA GeForce RTX 3090
min:
67.3 fps, P0.1:
113 fps, P1:
144 fps, max:
458 fps
294 [X] AMD Ryzen 9 5900X 3.7GHz
NVIDIA GeForce RTX 3090
min:
26.3 fps, P0.1:
156 fps, P1:
185 fps, max:
526 fps
~ 284 fps
96%
NVIDIA GeForce RTX 3080:
273 [X] MSI GeForce RTX 3080 Gaming X Trio Intel Core i9-9900K 3.6GHz
NVIDIA GeForce RTX 3080
min:
97.6 fps, P0.1:
120 fps, P1:
154 fps, max:
466 fps
fps
100%
NVIDIA GeForce RTX 3090:
272 [X] MSI GeForce RTX 3090 Suprim X Intel Core i9-9900K 3.6GHz
NVIDIA GeForce RTX 3090
min:
75.9 fps, P0.1:
122 fps, P1:
150 fps, max:
468 fps
285 [X] AMD Ryzen 9 5900X 3.7GHz
NVIDIA GeForce RTX 3090
min:
21.4 fps, P0.1:
155 fps, P1:
178 fps, max:
512 fps
~ 279 fps
97%
NVIDIA GeForce RTX 3080:
270 [X] MSI GeForce RTX 3080 Gaming X Trio Intel Core i9-9900K 3.6GHz
NVIDIA GeForce RTX 3080
min:
77.4 fps, P0.1:
119 fps, P1:
149 fps, max:
474 fps
fps
100%
NVIDIA GeForce RTX 3090:
231 [X] AMD Ryzen 9 5900X 3.7GHz
NVIDIA GeForce RTX 3090
min:
21 fps, P0.1:
134 fps, P1:
162 fps, max:
437 fps
241 [X] MSI GeForce RTX 3090 Suprim X Intel Core i9-9900K 3.6GHz
NVIDIA GeForce RTX 3090
min:
76.5 fps, P0.1:
101 fps, P1:
139 fps, max:
480 fps
~ 236 fps
94%
NVIDIA GeForce RTX 3080:
223 [X] MSI GeForce RTX 3080 Gaming X Trio Intel Core i9-9900K 3.6GHz
NVIDIA GeForce RTX 3080
min:
67.7 fps, P0.1:
98 fps, P1:
132 fps, max:
476 fps
fps
100%
NVIDIA GeForce RTX 3090:
131 [X] AMD Ryzen 9 5900X 3.7GHz
NVIDIA GeForce RTX 3090
min:
19.4 fps, P0.1:
40.3 fps, P1:
88.4 fps, max:
412 fps
151 [X] MSI GeForce RTX 3090 Suprim X Intel Core i9-9900K 3.6GHz
NVIDIA GeForce RTX 3090
min:
53.3 fps, P0.1:
67.3 fps, P1:
103 fps, max:
380 fps
~ 141 fps
93%
NVIDIA GeForce RTX 3080:
131 [X] MSI GeForce RTX 3080 Gaming X Trio Intel Core i9-9900K 3.6GHz
NVIDIA GeForce RTX 3080
min:
48.9 fps, P0.1:
55.3 fps, P1:
87.5 fps, max:
369 fps
fps
100%
NVIDIA GeForce RTX 3090:
142 [X] AMD Ryzen 9 5900X 3.7GHz
NVIDIA GeForce RTX 3090
min:
118 fps, max:
181 fps
160.8 [X] Intel Core i5-13400F 2.5GHz
NVIDIA GeForce RTX 3090
min:
132 fps, max:
211 fps
195.3 [X] Intel Core i5-13600K 3.5GHz
NVIDIA GeForce RTX 3090
min:
168 fps, max:
255 fps
196 205 224 [X] Nvidia GeForce RTX 3090 FE AMD Ryzen 9 7950X 4.5GHz
NVIDIA GeForce RTX 3090
min:
179 fps, max:
280 fps
226 [X] Intel Core i9-13900K 3GHz
NVIDIA GeForce RTX 3090
min:
194 fps, max:
273 fps
226 [X] NVIDIA GeForce RTX 3090 Founders Edition AMD Ryzen 9 7950X 4.5GHz
NVIDIA GeForce RTX 3090
min:
184 fps, max:
315 fps
266 [X] Nvidia GeForce RTX 3090 FE Intel Core i9-14900K 3.2GHz
NVIDIA GeForce RTX 3090
min:
225 fps, max:
333 fps
~ 205 fps
102%
NVIDIA GeForce RTX 3080 Ti:
200 [X] Corsair One i300 Intel Core i9-12900K 3.2GHz
NVIDIA GeForce RTX 3080 Ti
min:
170 fps, max:
263 fps
211 216 [X] AMD Ryzen 9 7950X 4.5GHz
NVIDIA GeForce RTX 3080 Ti
min:
172 fps, max:
277 fps
~ 209 fps
100%
NVIDIA GeForce RTX 3090:
108 [X] MSI GeForce RTX 3090 Suprim X Intel Core i9-9900K 3.6GHz
NVIDIA GeForce RTX 3090
min:
67 fps
130 [X] AMD Ryzen 9 5900X 3.7GHz
NVIDIA GeForce RTX 3090
min:
104 fps, max:
161 fps
138.3 [X] Intel Core i5-13400F 2.5GHz
NVIDIA GeForce RTX 3090
min:
112 fps, max:
173 fps
183 183.1 [X] Intel Core i5-13600K 3.5GHz
NVIDIA GeForce RTX 3090
min:
157 fps, max:
217 fps
189 192.3 [X] Intel Core i9-13900K 3GHz
NVIDIA GeForce RTX 3090
min:
170 fps, max:
227 fps
193.4 [X] NVIDIA GeForce RTX 3090 Founders Edition AMD Ryzen 9 7950X 4.5GHz
NVIDIA GeForce RTX 3090
min:
150 fps, max:
242 fps
193.9 [X] Nvidia GeForce RTX 3090 FE AMD Ryzen 9 7950X 4.5GHz
NVIDIA GeForce RTX 3090
min:
156 fps, max:
240 fps
223 [X] Nvidia GeForce RTX 3090 FE Intel Core i9-14900K 3.2GHz
NVIDIA GeForce RTX 3090
min:
192 fps, max:
253 fps
~ 173 fps
105%
NVIDIA GeForce RTX 3080 Ti:
176 [X] Corsair One i300 Intel Core i9-12900K 3.2GHz
NVIDIA GeForce RTX 3080 Ti
min:
147 fps, max:
211 fps
180.4 188 [X] AMD Ryzen 9 7950X 4.5GHz
NVIDIA GeForce RTX 3080 Ti
min:
148 fps, max:
229 fps
~ 181 fps
60%
NVIDIA GeForce RTX 3080:
104 [X] MSI GeForce RTX 3080 Gaming X Trio Intel Core i9-9900K 3.6GHz
NVIDIA GeForce RTX 3080
min:
65 fps
fps
100%
NVIDIA GeForce RTX 3090:
100 [X] MSI GeForce RTX 3090 Suprim X Intel Core i9-9900K 3.6GHz
NVIDIA GeForce RTX 3090
min:
59 fps
116 [X] AMD Ryzen 9 5900X 3.7GHz
NVIDIA GeForce RTX 3090
min:
90 fps, max:
155 fps
120.2 [X] Intel Core i5-13400F 2.5GHz
NVIDIA GeForce RTX 3090
min:
99 fps, max:
160 fps
163 169 169.2 [X] Intel Core i9-13900K 3GHz
NVIDIA GeForce RTX 3090
min:
144 fps, max:
204 fps
170.8 [X] Intel Core i5-13600K 3.5GHz
NVIDIA GeForce RTX 3090
min:
143 fps, max:
206 fps
172.7 [X] Nvidia GeForce RTX 3090 FE AMD Ryzen 9 7950X 4.5GHz
NVIDIA GeForce RTX 3090
min:
137 fps, max:
216 fps
172.9 [X] NVIDIA GeForce RTX 3090 Founders Edition AMD Ryzen 9 7950X 4.5GHz
NVIDIA GeForce RTX 3090
min:
134 fps, max:
212 fps
196 [X] Nvidia GeForce RTX 3090 FE Intel Core i9-14900K 3.2GHz
NVIDIA GeForce RTX 3090
min:
166 fps, max:
219 fps
~ 155 fps
104%
NVIDIA GeForce RTX 3080 Ti:
155 [X] Corsair One i300 Intel Core i9-12900K 3.2GHz
NVIDIA GeForce RTX 3080 Ti
min:
127 fps, max:
193 fps
160.6 167.6 [X] AMD Ryzen 9 7950X 4.5GHz
NVIDIA GeForce RTX 3080 Ti
min:
128 fps, max:
217 fps
~ 161 fps
64%
NVIDIA GeForce RTX 3080:
99 [X] MSI GeForce RTX 3080 Gaming X Trio Intel Core i9-9900K 3.6GHz
NVIDIA GeForce RTX 3080
min:
57 fps
fps
100%
NVIDIA GeForce RTX 3090:
94 [X] MSI GeForce RTX 3090 Suprim X Intel Core i9-9900K 3.6GHz
NVIDIA GeForce RTX 3090
min:
54 fps
113 [X] AMD Ryzen 9 5900X 3.7GHz
NVIDIA GeForce RTX 3090
min:
87 fps, max:
159 fps
122.1 [X] Intel Core i5-13400F 2.5GHz
NVIDIA GeForce RTX 3090
min:
98 fps, max:
162 fps
149 151 151.2 [X] Intel Core i5-13600K 3.5GHz
NVIDIA GeForce RTX 3090
min:
121 fps, max:
185 fps
159.1 [X] Intel Core i9-13900K 3GHz
NVIDIA GeForce RTX 3090
min:
137 fps, max:
188 fps
164.1 [X] NVIDIA GeForce RTX 3090 Founders Edition AMD Ryzen 9 7950X 4.5GHz
NVIDIA GeForce RTX 3090
min:
130 fps, max:
201 fps
165.4 [X] Nvidia GeForce RTX 3090 FE AMD Ryzen 9 7950X 4.5GHz
NVIDIA GeForce RTX 3090
min:
130 fps, max:
196 fps
177.6 [X] Nvidia GeForce RTX 3090 FE Intel Core i9-14900K 3.2GHz
NVIDIA GeForce RTX 3090
min:
153 fps, max:
199 fps
~ 145 fps
99%
NVIDIA GeForce RTX 3080 Ti:
120.7 149 [X] Corsair One i300 Intel Core i9-12900K 3.2GHz
NVIDIA GeForce RTX 3080 Ti
min:
125 fps, max:
185 fps
159.6 [X] AMD Ryzen 9 7950X 4.5GHz
NVIDIA GeForce RTX 3080 Ti
min:
123 fps, max:
198 fps
~ 143 fps
63%
NVIDIA GeForce RTX 3080:
92 [X] MSI GeForce RTX 3080 Gaming X Trio Intel Core i9-9900K 3.6GHz
NVIDIA GeForce RTX 3080
min:
55 fps
fps
100%
NVIDIA GeForce RTX 3090:
89 [X] MSI GeForce RTX 3090 Suprim X Intel Core i9-9900K 3.6GHz
NVIDIA GeForce RTX 3090
min:
54 fps
107 [X] AMD Ryzen 9 5900X 3.7GHz
NVIDIA GeForce RTX 3090
min:
82 fps, max:
131 fps
119.3 [X] Intel Core i5-13400F 2.5GHz
NVIDIA GeForce RTX 3090
min:
93 fps, max:
144 fps
127 132.4 [X] Intel Core i5-13600K 3.5GHz
NVIDIA GeForce RTX 3090
min:
121 fps, max:
145 fps
133.5 [X] Intel Core i9-13900K 3GHz
NVIDIA GeForce RTX 3090
min:
122 fps, max:
147 fps
134 137.4 [X] NVIDIA GeForce RTX 3090 Founders Edition AMD Ryzen 9 7950X 4.5GHz
NVIDIA GeForce RTX 3090
min:
125 fps, max:
152 fps
139.2 [X] Nvidia GeForce RTX 3090 FE AMD Ryzen 9 7950X 4.5GHz
NVIDIA GeForce RTX 3090
min:
123 fps, max:
154 fps
139.5 [X] Nvidia GeForce RTX 3090 FE Intel Core i9-14900K 3.2GHz
NVIDIA GeForce RTX 3090
min:
126 fps, max:
156 fps
~ 126 fps
106%
NVIDIA GeForce RTX 3080 Ti:
129 [X] Corsair One i300 Intel Core i9-12900K 3.2GHz
NVIDIA GeForce RTX 3080 Ti
min:
113 fps, max:
145 fps
136 136.9 [X] AMD Ryzen 9 7950X 4.5GHz
NVIDIA GeForce RTX 3080 Ti
min:
116 fps, max:
152 fps
~ 134 fps
70%
NVIDIA GeForce RTX 3080:
88 [X] MSI GeForce RTX 3080 Gaming X Trio Intel Core i9-9900K 3.6GHz
NVIDIA GeForce RTX 3080
min:
51 fps
fps
100%
NVIDIA GeForce RTX 3090:
77 [X] MSI GeForce RTX 3090 Suprim X Intel Core i9-9900K 3.6GHz
NVIDIA GeForce RTX 3090
min:
60 fps
78.3 [X] AMD Ryzen 9 5900X 3.7GHz
NVIDIA GeForce RTX 3090
min:
68 fps, max:
86 fps
82 84 84.1 [X] Intel Core i5-13600K 3.5GHz
NVIDIA GeForce RTX 3090
min:
75 fps, max:
92 fps
84.5 [X] Intel Core i9-13900K 3GHz
NVIDIA GeForce RTX 3090
min:
76 fps, max:
92 fps
84.9 [X] NVIDIA GeForce RTX 3090 Founders Edition AMD Ryzen 9 7950X 4.5GHz
NVIDIA GeForce RTX 3090
min:
78 fps, max:
92 fps
85.4 [X] Intel Core i5-13400F 2.5GHz
NVIDIA GeForce RTX 3090
min:
77 fps, max:
92 fps
85.9 [X] Nvidia GeForce RTX 3090 FE Intel Core i9-14900K 3.2GHz
NVIDIA GeForce RTX 3090
min:
78 fps, max:
94 fps
86.7 [X] Nvidia GeForce RTX 3090 FE AMD Ryzen 9 7950X 4.5GHz
NVIDIA GeForce RTX 3090
min:
79 fps, max:
94 fps
~ 83 fps
102%
NVIDIA GeForce RTX 3080 Ti:
81.6 [X] Corsair One i300 Intel Core i9-12900K 3.2GHz
NVIDIA GeForce RTX 3080 Ti
min:
74 fps, max:
88 fps
86 86.2 [X] AMD Ryzen 9 7950X 4.5GHz
NVIDIA GeForce RTX 3080 Ti
min:
79 fps, max:
93 fps
~ 85 fps
87%
NVIDIA GeForce RTX 3080:
72 [X] MSI GeForce RTX 3080 Gaming X Trio Intel Core i9-9900K 3.6GHz
NVIDIA GeForce RTX 3080
min:
50 fps
fps
100%
NVIDIA GeForce RTX 3090:
94 [X] AMD Ryzen 9 5900X 3.7GHz
NVIDIA GeForce RTX 3090
min:
30.4 fps, P0.1:
44 fps, P1:
74.9 fps, max:
252 fps
107 [X] MSI GeForce RTX 3090 Suprim X Intel Core i9-9900K 3.6GHz
NVIDIA GeForce RTX 3090
min:
40.4 fps, P0.1:
45.9 fps, P1:
63.3 fps, max:
245 fps
~ 101 fps
105%
NVIDIA GeForce RTX 3080:
106 [X] MSI GeForce RTX 3080 Gaming X Trio Intel Core i9-9900K 3.6GHz
NVIDIA GeForce RTX 3080
min:
40.4 fps, P0.1:
45 fps, P1:
63.5 fps, max:
235 fps
fps
100%
NVIDIA GeForce RTX 3090:
89.1 [X] AMD Ryzen 9 5900X 3.7GHz
NVIDIA GeForce RTX 3090
min:
38.7 fps, P0.1:
43.3 fps, P1:
70.7 fps, max:
187 fps
103 [X] MSI GeForce RTX 3090 Suprim X Intel Core i9-9900K 3.6GHz
NVIDIA GeForce RTX 3090
min:
39.1 fps, P0.1:
44.8 fps, P1:
61.3 fps, max:
233 fps
~ 96 fps
106%
NVIDIA GeForce RTX 3080:
102 [X] MSI GeForce RTX 3080 Gaming X Trio Intel Core i9-9900K 3.6GHz
NVIDIA GeForce RTX 3080
min:
43.7 fps, P0.1:
47.4 fps, P1:
61.2 fps, max:
222 fps
fps
100%
NVIDIA GeForce RTX 3090:
88.9 [X] AMD Ryzen 9 5900X 3.7GHz
NVIDIA GeForce RTX 3090
min:
28.1 fps, P0.1:
42 fps, P1:
71 fps, max:
187 fps
102 [X] MSI GeForce RTX 3090 Suprim X Intel Core i9-9900K 3.6GHz
NVIDIA GeForce RTX 3090
min:
35.9 fps, P0.1:
45.8 fps, P1:
61.9 fps, max:
230 fps
~ 95 fps
106%
NVIDIA GeForce RTX 3080:
101 [X] MSI GeForce RTX 3080 Gaming X Trio Intel Core i9-9900K 3.6GHz
NVIDIA GeForce RTX 3080
min:
41 fps, P0.1:
45.1 fps, P1:
61.8 fps, max:
225 fps
fps
100%
NVIDIA GeForce RTX 3090:
89.4 [X] AMD Ryzen 9 5900X 3.7GHz
NVIDIA GeForce RTX 3090
min:
30.8 fps, P0.1:
42.8 fps, P1:
73.4 fps, max:
187 fps
97.9 [X] MSI GeForce RTX 3090 Suprim X Intel Core i9-9900K 3.6GHz
NVIDIA GeForce RTX 3090
min:
42.7 fps, P0.1:
47.3 fps, P1:
60.1 fps, max:
213 fps
~ 94 fps
103%
NVIDIA GeForce RTX 3080:
97 [X] MSI GeForce RTX 3080 Gaming X Trio Intel Core i9-9900K 3.6GHz
NVIDIA GeForce RTX 3080
min:
17.4 fps, P0.1:
40.1 fps, P1:
61.3 fps, max:
200 fps
fps
100%
NVIDIA GeForce RTX 3090:
276 [X] MSI GeForce RTX 3090 Suprim X Intel Core i9-9900K 3.6GHz
NVIDIA GeForce RTX 3090
min:
48.6 fps, P0.1:
117 fps, P1:
190 fps, max:
389 fps
fps
97%
NVIDIA GeForce RTX 3080:
268 [X] MSI GeForce RTX 3080 Gaming X Trio Intel Core i9-9900K 3.6GHz
NVIDIA GeForce RTX 3080
min:
128 fps, P0.1:
160 fps, P1:
181 fps, max:
390 fps
fps
100%
NVIDIA GeForce RTX 3090:
274 [X] MSI GeForce RTX 3090 Suprim X Intel Core i9-9900K 3.6GHz
NVIDIA GeForce RTX 3090
min:
76.4 fps, P0.1:
158 fps, P1:
189 fps, max:
416 fps
fps
97%
NVIDIA GeForce RTX 3080:
265 [X] MSI GeForce RTX 3080 Gaming X Trio Intel Core i9-9900K 3.6GHz
NVIDIA GeForce RTX 3080
min:
125 fps, P0.1:
164 fps, P1:
178 fps, max:
382 fps
fps
100%
NVIDIA GeForce RTX 3090:
272 [X] MSI GeForce RTX 3090 Suprim X Intel Core i9-9900K 3.6GHz
NVIDIA GeForce RTX 3090
min:
102 fps, P0.1:
168 fps, P1:
187 fps, max:
392 fps
fps
97%
NVIDIA GeForce RTX 3080:
263 [X] MSI GeForce RTX 3080 Gaming X Trio Intel Core i9-9900K 3.6GHz
NVIDIA GeForce RTX 3080
min:
128 fps, P0.1:
156 fps, P1:
179 fps, max:
366 fps
fps
100%
NVIDIA GeForce RTX 3090:
272 [X] MSI GeForce RTX 3090 Suprim X Intel Core i9-9900K 3.6GHz
NVIDIA GeForce RTX 3090
min:
61.5 fps, P0.1:
140 fps, P1:
185 fps, max:
380 fps
fps
96%
NVIDIA GeForce RTX 3080:
261 [X] MSI GeForce RTX 3080 Gaming X Trio Intel Core i9-9900K 3.6GHz
NVIDIA GeForce RTX 3080
min:
32.7 fps, P0.1:
160 fps, P1:
179 fps, max:
365 fps
fps
100%
NVIDIA GeForce RTX 3090:
269 [X] MSI GeForce RTX 3090 Suprim X Intel Core i9-9900K 3.6GHz
NVIDIA GeForce RTX 3090
min:
75.3 fps, P0.1:
162 fps, P1:
186 fps, max:
391 fps
fps
97%
NVIDIA GeForce RTX 3080:
260 [X] MSI GeForce RTX 3080 Gaming X Trio Intel Core i9-9900K 3.6GHz
NVIDIA GeForce RTX 3080
min:
126 fps, P0.1:
144 fps, P1:
177 fps, max:
362 fps
fps
100%
NVIDIA GeForce RTX 3090:
199 [X] AMD Ryzen 9 5900X 3.7GHz
NVIDIA GeForce RTX 3090
min:
21.3 fps, P0.1:
74.9 fps, P1:
116 fps, max:
418 fps
fps
97%
NVIDIA GeForce RTX 3080 Ti:
194 [X] Corsair One i300 Intel Core i9-12900K 3.2GHz
NVIDIA GeForce RTX 3080 Ti
min:
35.3 fps, P0.1:
76.3 fps, P1:
117 fps, max:
423 fps
fps
100%
NVIDIA GeForce RTX 3090:
74.5 [X] MSI GeForce RTX 3090 Suprim X Intel Core i9-9900K 3.6GHz
NVIDIA GeForce RTX 3090
min:
28.5 fps, P0.1:
31.4 fps, P1:
38.2 fps, max:
195 fps
149 [X] AMD Ryzen 9 5900X 3.7GHz
NVIDIA GeForce RTX 3090
min:
20.5 fps, P0.1:
54.5 fps, P1:
87 fps, max:
298 fps
~ 112 fps
147%
NVIDIA GeForce RTX 3080 Ti:
165 [X] Corsair One i300 Intel Core i9-12900K 3.2GHz
NVIDIA GeForce RTX 3080 Ti
min:
36.9 fps, P0.1:
68.3 fps, P1:
101 fps, max:
326 fps
fps
67%
NVIDIA GeForce RTX 3080:
74.8 [X] MSI GeForce RTX 3080 Gaming X Trio Intel Core i9-9900K 3.6GHz
NVIDIA GeForce RTX 3080
min:
31.7 fps, P0.1:
33.1 fps, P1:
38.5 fps, max:
197 fps
fps
100%
NVIDIA GeForce RTX 3090:
72.4 [X] MSI GeForce RTX 3090 Suprim X Intel Core i9-9900K 3.6GHz
NVIDIA GeForce RTX 3090
min:
31.3 fps, P0.1:
33.2 fps, P1:
38.3 fps, max:
178 fps
138 [X] AMD Ryzen 9 5900X 3.7GHz
NVIDIA GeForce RTX 3090
min:
20.3 fps, P0.1:
63.5 fps, P1:
85.5 fps, max:
279 fps
~ 105 fps
146%
NVIDIA GeForce RTX 3080 Ti:
153 [X] Corsair One i300 Intel Core i9-12900K 3.2GHz
NVIDIA GeForce RTX 3080 Ti
min:
39.4 fps, P0.1:
67.3 fps, P1:
93.5 fps, max:
308 fps
fps
67%
NVIDIA GeForce RTX 3080:
70.8 [X] MSI GeForce RTX 3080 Gaming X Trio Intel Core i9-9900K 3.6GHz
NVIDIA GeForce RTX 3080
min:
29.8 fps, P0.1:
31.9 fps, P1:
37.7 fps, max:
178 fps
fps
100%
NVIDIA GeForce RTX 3090:
70.1 [X] MSI GeForce RTX 3090 Suprim X Intel Core i9-9900K 3.6GHz
NVIDIA GeForce RTX 3090
min:
28.4 fps, P0.1:
31.1 fps, P1:
38 fps, max:
175 fps
75.3 [X] AMD Ryzen 9 5900X 3.7GHz
NVIDIA GeForce RTX 3090
min:
13.7 fps, P0.1:
49 fps, P1:
57.5 fps, max:
136 fps
126 [X] AMD Ryzen 9 5900X 3.7GHz
NVIDIA GeForce RTX 3090
min:
19.4 fps, P0.1:
49.2 fps, P1:
72.1 fps, max:
257 fps
~ 90 fps
158%
NVIDIA GeForce RTX 3080 Ti:
142 [X] Corsair One i300 Intel Core i9-12900K 3.2GHz
NVIDIA GeForce RTX 3080 Ti
min:
39.9 fps, P0.1:
64.8 fps, P1:
84.5 fps, max:
296 fps
fps
78%
NVIDIA GeForce RTX 3080:
70.6 [X] MSI GeForce RTX 3080 Gaming X Trio Intel Core i9-9900K 3.6GHz
NVIDIA GeForce RTX 3080
min:
26.2 fps, P0.1:
31.2 fps, P1:
37.2 fps, max:
173 fps
fps
100%
NVIDIA GeForce RTX 3090:
70 [X] MSI GeForce RTX 3090 Suprim X Intel Core i9-9900K 3.6GHz
NVIDIA GeForce RTX 3090
min:
25.2 fps, P0.1:
34.3 fps, P1:
39.4 fps, max:
170 fps
124 [X] AMD Ryzen 9 5900X 3.7GHz
NVIDIA GeForce RTX 3090
min:
15.9 fps, P0.1:
60.6 fps, P1:
80.6 fps, max:
252 fps
~ 97 fps
137%
NVIDIA GeForce RTX 3080 Ti:
133 [X] Corsair One i300 Intel Core i9-12900K 3.2GHz
NVIDIA GeForce RTX 3080 Ti
min:
41.1 fps, P0.1:
59.4 fps, P1:
81.4 fps, max:
291 fps
fps
72%
NVIDIA GeForce RTX 3080:
69.7 [X] MSI GeForce RTX 3080 Gaming X Trio Intel Core i9-9900K 3.6GHz
NVIDIA GeForce RTX 3080
min:
27.4 fps, P0.1:
32.3 fps, P1:
37.9 fps, max:
177 fps
fps
100%
NVIDIA GeForce RTX 3090:
69.1 [X] MSI GeForce RTX 3090 Suprim X Intel Core i9-9900K 3.6GHz
NVIDIA GeForce RTX 3090
min:
25.9 fps, P0.1:
28.7 fps, P1:
36.1 fps, max:
174 fps
fps
115%
NVIDIA GeForce RTX 3080 Ti:
79.2 [X] Corsair One i300 Intel Core i9-12900K 3.2GHz
NVIDIA GeForce RTX 3080 Ti
min:
27.9 fps, P0.1:
51.3 fps, P1:
60.7 fps, max:
228 fps
fps
99%
NVIDIA GeForce RTX 3080:
68.1 [X] MSI GeForce RTX 3080 Gaming X Trio Intel Core i9-9900K 3.6GHz
NVIDIA GeForce RTX 3080
min:
27.1 fps, P0.1:
29.9 fps, P1:
35.7 fps, max:
172 fps
fps
100%
NVIDIA GeForce RTX 3090:
122 [X] AMD Ryzen 9 5900X 3.7GHz
NVIDIA GeForce RTX 3090
min:
75.9 fps, P0.1:
91.1 fps, P1:
102 fps, max:
153 fps
fps
100%
NVIDIA GeForce RTX 3090:
119 [X] MSI GeForce RTX 3090 Suprim X Intel Core i9-9900K 3.6GHz
NVIDIA GeForce RTX 3090
min:
23.8 fps, P0.1:
92.1 fps, P1:
103 fps, max:
143 fps
119 [X] AMD Ryzen 9 5900X 3.7GHz
NVIDIA GeForce RTX 3090
min:
76.8 fps, P0.1:
91.9 fps, P1:
100 fps, max:
156 fps
~ 119 fps
100%
NVIDIA GeForce RTX 3080:
119 [X] MSI GeForce RTX 3080 Gaming X Trio Intel Core i9-9900K 3.6GHz
NVIDIA GeForce RTX 3080
min:
62.6 fps, P0.1:
93.2 fps, P1:
101 fps, max:
153 fps
fps
100%
NVIDIA GeForce RTX 3090:
118 [X] MSI GeForce RTX 3090 Suprim X Intel Core i9-9900K 3.6GHz
NVIDIA GeForce RTX 3090
min:
86.8 fps, P0.1:
88.7 fps, P1:
98.5 fps, max:
155 fps
120 [X] AMD Ryzen 9 5900X 3.7GHz
NVIDIA GeForce RTX 3090
min:
84 fps, P0.1:
87.2 fps, P1:
97.2 fps, max:
154 fps
~ 119 fps
100%
NVIDIA GeForce RTX 3080:
119 [X] MSI GeForce RTX 3080 Gaming X Trio Intel Core i9-9900K 3.6GHz
NVIDIA GeForce RTX 3080
min:
24.9 fps, P0.1:
91.7 fps, P1:
103 fps, max:
145 fps
fps
100%
NVIDIA GeForce RTX 3090:
114 [X] MSI GeForce RTX 3090 Suprim X Intel Core i9-9900K 3.6GHz
NVIDIA GeForce RTX 3090
min:
80.9 fps, P0.1:
82.5 fps, P1:
89.6 fps, max:
149 fps
116 [X] AMD Ryzen 9 5900X 3.7GHz
NVIDIA GeForce RTX 3090
min:
73.4 fps, P0.1:
87.4 fps, P1:
93.3 fps, max:
159 fps
~ 115 fps
99%
NVIDIA GeForce RTX 3080:
114 [X] MSI GeForce RTX 3080 Gaming X Trio Intel Core i9-9900K 3.6GHz
NVIDIA GeForce RTX 3080
min:
80.3 fps, P0.1:
83.1 fps, P1:
89.4 fps, max:
146 fps
fps
100%
NVIDIA GeForce RTX 3090:
107 [X] AMD Ryzen 9 5900X 3.7GHz
NVIDIA GeForce RTX 3090
min:
55.9 fps, P0.1:
76.7 fps, P1:
83.3 fps, max:
148 fps
114 [X] MSI GeForce RTX 3090 Suprim X Intel Core i9-9900K 3.6GHz
NVIDIA GeForce RTX 3090
min:
78.1 fps, P0.1:
81.3 fps, P1:
88 fps, max:
147 fps
~ 111 fps
97%
NVIDIA GeForce RTX 3080:
108 [X] MSI GeForce RTX 3080 Gaming X Trio Intel Core i9-9900K 3.6GHz
NVIDIA GeForce RTX 3080
min:
60.3 fps, P0.1:
75 fps, P1:
82.6 fps, max:
145 fps
fps
100%
NVIDIA GeForce RTX 3090:
64.2 [X] AMD Ryzen 9 5900X 3.7GHz
NVIDIA GeForce RTX 3090
min:
46.9 fps, P0.1:
51.1 fps, P1:
53.4 fps, max:
77.9 fps
77.5 [X] MSI GeForce RTX 3090 Suprim X Intel Core i9-9900K 3.6GHz
NVIDIA GeForce RTX 3090
min:
51.6 fps, P0.1:
61.8 fps, P1:
64.6 fps, max:
100 fps
~ 71 fps
96%
NVIDIA GeForce RTX 3080:
68.5 [X] MSI GeForce RTX 3080 Gaming X Trio Intel Core i9-9900K 3.6GHz
NVIDIA GeForce RTX 3080
min:
48.9 fps, P0.1:
57.1 fps, P1:
58.6 fps, max:
85.6 fps
fps
100%
NVIDIA GeForce RTX 3090:
389 [X] 874931
Intel Core i5-13400F 2.5GHz
NVIDIA GeForce RTX 3090
min:
311 fps, P1:
265 fps, max:
422 fps
433 [X] 831795
AMD Ryzen 9 5900X 3.7GHz
NVIDIA GeForce RTX 3090
min:
318 fps, P1:
279 fps, max:
466 fps
512 [X] 874931
Intel Core i5-13600K 3.5GHz
NVIDIA GeForce RTX 3090
min:
380 fps, P1:
318 fps, max:
564 fps
590 [X] 874931
Intel Core i9-13900K 3GHz
NVIDIA GeForce RTX 3090
min:
455 fps, P1:
371 fps, max:
649 fps
619 [X] AMD Ryzen 9 7950X 874931
AMD Ryzen 9 7950X 4.5GHz
NVIDIA GeForce RTX 3090
min:
444 fps, P1:
371 fps, max:
699 fps
648 [X] 874931
AMD Ryzen 9 7900X 4.7GHz
NVIDIA GeForce RTX 3090
min:
480 fps, P1:
396 fps, max:
722 fps
658 [X] AMD Ryzen 7 7700 874931
AMD Ryzen 7 7700 3.8GHz
NVIDIA GeForce RTX 3090
min:
446 fps, P1:
397 fps, max:
745 fps
663 [X] AMD Ryzen 7 7700X 874931
AMD Ryzen 7 7700X 4.5GHz
NVIDIA GeForce RTX 3090
min:
470 fps, P1:
409 fps, max:
741 fps
670 [X] Nvidia GeForce RTX 3090 FE 874931
AMD Ryzen 9 7950X 4.5GHz
NVIDIA GeForce RTX 3090
min:
490 fps, P1:
408 fps, max:
749 fps
686 [X] NVIDIA GeForce RTX 3090 Founders Edition 874931
AMD Ryzen 9 7950X 4.5GHz
NVIDIA GeForce RTX 3090
min:
521 fps, P1:
427 fps, max:
754 fps
699 [X] 874931
AMD Ryzen 5 7600X 4.7GHz
NVIDIA GeForce RTX 3090
min:
502 fps, P1:
427 fps, max:
770 fps
~ 597 fps
100%
NVIDIA GeForce RTX 3080 Ti:
534 [X] Corsair One i300 843175
Intel Core i9-12900K 3.2GHz
NVIDIA GeForce RTX 3080 Ti
min:
409 fps, P1:
339 fps, max:
581 fps
615 643 [X] 874931
AMD Ryzen 9 7950X 4.5GHz
NVIDIA GeForce RTX 3080 Ti
min:
461 fps, P1:
396 fps, max:
710 fps
~ 597 fps
100%
NVIDIA GeForce RTX 3090:
264 [X] MSI GeForce RTX 3090 Suprim X Intel Core i9-9900K 3.6GHz
NVIDIA GeForce RTX 3090
min:
193 fps
373 [X] 874931
Intel Core i5-13400F 2.5GHz
NVIDIA GeForce RTX 3090
min:
289 fps, P1:
250 fps, max:
411 fps
408 [X] 831795
AMD Ryzen 9 5900X 3.7GHz
NVIDIA GeForce RTX 3090
min:
292 fps, P1:
251 fps, max:
449 fps
474 [X] 874931
Intel Core i5-13600K 3.5GHz
NVIDIA GeForce RTX 3090
min:
359 fps, P1:
294 fps, max:
531 fps
520 [X] 874931
Intel Core i9-13900K 3GHz
NVIDIA GeForce RTX 3090
min:
417 fps, P1:
323 fps, max:
572 fps
542 [X] AMD Ryzen 9 7950X 874931
AMD Ryzen 9 7950X 4.5GHz
NVIDIA GeForce RTX 3090
min:
418 fps, P1:
336 fps, max:
607 fps
543 [X] AMD Ryzen 7 7700X 874931
AMD Ryzen 7 7700X 4.5GHz
NVIDIA GeForce RTX 3090
min:
411 fps, P1:
340 fps, max:
611 fps
548 [X] 874931
AMD Ryzen 9 7900X 4.7GHz
NVIDIA GeForce RTX 3090
min:
414 fps, P1:
339 fps, max:
621 fps
562 [X] 874931
AMD Ryzen 5 7600X 4.7GHz
NVIDIA GeForce RTX 3090
min:
449 fps, P1:
356 fps, max:
631 fps
565 [X] AMD Ryzen 7 7700 874931
AMD Ryzen 7 7700 3.8GHz
NVIDIA GeForce RTX 3090
min:
417 fps, P1:
344 fps, max:
636 fps
572 [X] Nvidia GeForce RTX 3090 FE 874931
AMD Ryzen 9 7950X 4.5GHz
NVIDIA GeForce RTX 3090
min:
445 fps, P1:
354 fps, max:
649 fps
581 [X] NVIDIA GeForce RTX 3090 Founders Edition 874931
AMD Ryzen 9 7950X 4.5GHz
NVIDIA GeForce RTX 3090
min:
455 fps, P1:
367 fps, max:
650 fps
~ 496 fps
107%
NVIDIA GeForce RTX 3080 Ti:
498 [X] Corsair One i300 843175
Intel Core i9-12900K 3.2GHz
NVIDIA GeForce RTX 3080 Ti
min:
400 fps, P1:
314 fps, max:
542 fps
525 569 [X] 874931
AMD Ryzen 9 7950X 4.5GHz
NVIDIA GeForce RTX 3080 Ti
min:
442 fps, P1:
351 fps, max:
635 fps
~ 531 fps
53%
NVIDIA GeForce RTX 3080:
263 [X] MSI GeForce RTX 3080 Gaming X Trio Intel Core i9-9900K 3.6GHz
NVIDIA GeForce RTX 3080
min:
199 fps
fps
100%
NVIDIA GeForce RTX 3090:
256 [X] MSI GeForce RTX 3090 Suprim X Intel Core i9-9900K 3.6GHz
NVIDIA GeForce RTX 3090
min:
193 fps
334 [X] 874931
Intel Core i5-13400F 2.5GHz
NVIDIA GeForce RTX 3090
min:
232 fps, P1:
179 fps, max:
386 fps
340 [X] 831795
AMD Ryzen 9 5900X 3.7GHz
NVIDIA GeForce RTX 3090
min:
240 fps, P1:
183 fps, max:
403 fps
399 [X] 874931
Intel Core i5-13600K 3.5GHz
NVIDIA GeForce RTX 3090
min:
291 fps, P1:
210 fps, max:
463 fps
435 [X] 874931
Intel Core i9-13900K 3GHz
NVIDIA GeForce RTX 3090
min:
318 fps, P1:
233 fps, max:
503 fps
436 [X] AMD Ryzen 9 7950X 874931
AMD Ryzen 9 7950X 4.5GHz
NVIDIA GeForce RTX 3090
min:
311 fps, P1:
244 fps, max:
510 fps
441 [X] 874931
AMD Ryzen 9 7900X 4.7GHz
NVIDIA GeForce RTX 3090
min:
330 fps, P1:
247 fps, max:
509 fps
453 [X] 874931
AMD Ryzen 5 7600X 4.7GHz
NVIDIA GeForce RTX 3090
min:
363 fps, P1:
269 fps, max:
507 fps
453 [X] AMD Ryzen 7 7700X 874931
AMD Ryzen 7 7700X 4.5GHz
NVIDIA GeForce RTX 3090
min:
372 fps, P1:
310 fps, max:
504 fps
460 [X] NVIDIA GeForce RTX 3090 Founders Edition 874931
AMD Ryzen 9 7950X 4.5GHz
NVIDIA GeForce RTX 3090
min:
343 fps, P1:
257 fps, max:
529 fps
463 [X] AMD Ryzen 7 7700 874931
AMD Ryzen 7 7700 3.8GHz
NVIDIA GeForce RTX 3090
min:
340 fps, P1:
248 fps, max:
534 fps
477 [X] Nvidia GeForce RTX 3090 FE 874931
AMD Ryzen 9 7950X 4.5GHz
NVIDIA GeForce RTX 3090
min:
337 fps, P1:
288 fps, max:
540 fps
~ 412 fps
105%
NVIDIA GeForce RTX 3080 Ti:
410 [X] Corsair One i300 843175
Intel Core i9-12900K 3.2GHz
NVIDIA GeForce RTX 3080 Ti
min:
311 fps, P1:
214 fps, max:
471 fps
428 460 [X] 874931
AMD Ryzen 9 7950X 4.5GHz
NVIDIA GeForce RTX 3080 Ti
min:
323 fps, P1:
242 fps, max:
546 fps
~ 433 fps
62%
NVIDIA GeForce RTX 3080:
255 [X] MSI GeForce RTX 3080 Gaming X Trio Intel Core i9-9900K 3.6GHz
NVIDIA GeForce RTX 3080
min:
191 fps
fps
100%
NVIDIA GeForce RTX 3090:
154 [X] MSI GeForce RTX 3090 Suprim X Intel Core i9-9900K 3.6GHz
NVIDIA GeForce RTX 3090
min:
129 fps
192 [X] 831795
AMD Ryzen 9 5900X 3.7GHz
NVIDIA GeForce RTX 3090
min:
149 fps, P1:
131 fps, max:
204 fps
201 [X] 874931
Intel Core i5-13400F 2.5GHz
NVIDIA GeForce RTX 3090
min:
173 fps, P1:
159 fps, max:
215 fps
222 [X] AMD Ryzen 7 7700X 874931
AMD Ryzen 7 7700X 4.5GHz
NVIDIA GeForce RTX 3090
min:
187 fps, P1:
179 fps, max:
248 fps
223 [X] 874931
Intel Core i5-13600K 3.5GHz
NVIDIA GeForce RTX 3090
min:
186 fps, P1:
178 fps, max:
242 fps
224 [X] 874931
AMD Ryzen 9 7900X 4.7GHz
NVIDIA GeForce RTX 3090
min:
191 fps, P1:
185 fps, max:
243 fps
224 [X] 874931
Intel Core i9-13900K 3GHz
NVIDIA GeForce RTX 3090
min:
191 fps, P1:
182 fps, max:
252 fps
225 [X] AMD Ryzen 9 7950X 874931
AMD Ryzen 9 7950X 4.5GHz
NVIDIA GeForce RTX 3090
min:
191 fps, P1:
181 fps, max:
246 fps
227 [X] 874931
AMD Ryzen 5 7600X 4.7GHz
NVIDIA GeForce RTX 3090
min:
192 fps, P1:
190 fps, max:
253 fps
229 [X] NVIDIA GeForce RTX 3090 Founders Edition 874931
AMD Ryzen 9 7950X 4.5GHz
NVIDIA GeForce RTX 3090
min:
193 fps, P1:
191 fps, max:
257 fps
236 [X] Nvidia GeForce RTX 3090 FE 874931
AMD Ryzen 9 7950X 4.5GHz
NVIDIA GeForce RTX 3090
min:
197 fps, P1:
194 fps, max:
261 fps
244 [X] AMD Ryzen 7 7700 874931
AMD Ryzen 7 7700 3.8GHz
NVIDIA GeForce RTX 3090
min:
200 fps, P1:
193 fps, max:
265 fps
~ 217 fps
104%
NVIDIA GeForce RTX 3080 Ti:
219 225 234 [X] 874931
AMD Ryzen 9 7950X 4.5GHz
NVIDIA GeForce RTX 3080 Ti
min:
196 fps, P1:
186 fps, max:
256 fps
~ 226 fps
70%
NVIDIA GeForce RTX 3080:
152 [X] MSI GeForce RTX 3080 Gaming X Trio Intel Core i9-9900K 3.6GHz
NVIDIA GeForce RTX 3080
min:
127 fps
fps
100%
NVIDIA GeForce RTX 3090:
153 [X] MSI GeForce RTX 3090 Suprim X Intel Core i9-9900K 3.6GHz
NVIDIA GeForce RTX 3090
min:
129 fps
165 [X] 831795
AMD Ryzen 9 5900X 3.7GHz
NVIDIA GeForce RTX 3090
min:
140 fps, P1:
122 fps, max:
182 fps
169.3 [X] AMD Ryzen 7 7700X 874931
AMD Ryzen 7 7700X 4.5GHz
NVIDIA GeForce RTX 3090
min:
146 fps, P1:
143 fps, max:
186 fps
171 [X] 874931
Intel Core i5-13400F 2.5GHz
NVIDIA GeForce RTX 3090
min:
147 fps, P1:
134 fps, max:
188 fps
171.8 [X] 874931
Intel Core i9-13900K 3GHz
NVIDIA GeForce RTX 3090
min:
147 fps, P1:
145 fps, max:
188 fps
171.8 [X] 874931
Intel Core i5-13600K 3.5GHz
NVIDIA GeForce RTX 3090
min:
148 fps, P1:
146 fps, max:
193 fps
172.8 [X] AMD Ryzen 9 7950X 874931
AMD Ryzen 9 7950X 4.5GHz
NVIDIA GeForce RTX 3090
min:
149 fps, P1:
146 fps, max:
190 fps
173.6 [X] NVIDIA GeForce RTX 3090 Founders Edition 874931
AMD Ryzen 9 7950X 4.5GHz
NVIDIA GeForce RTX 3090
min:
150 fps, P1:
147 fps, max:
193 fps
175.4 [X] 874931
AMD Ryzen 9 7900X 4.7GHz
NVIDIA GeForce RTX 3090
min:
149 fps, P1:
148 fps, max:
195 fps
175.8 [X] 874931
AMD Ryzen 5 7600X 4.7GHz
NVIDIA GeForce RTX 3090
min:
149 fps, P1:
148 fps, max:
196 fps
179.3 [X] Nvidia GeForce RTX 3090 FE 874931
AMD Ryzen 9 7950X 4.5GHz
NVIDIA GeForce RTX 3090
min:
155 fps, P1:
152 fps, max:
201 fps
186.2 [X] AMD Ryzen 7 7700 874931
AMD Ryzen 7 7700 3.8GHz
NVIDIA GeForce RTX 3090
min:
158 fps, P1:
157 fps, max:
207 fps
~ 172 fps
102%
NVIDIA GeForce RTX 3080 Ti:
170 [X] Corsair One i300 843175
Intel Core i9-12900K 3.2GHz
NVIDIA GeForce RTX 3080 Ti
min:
147 fps, P1:
146 fps, max:
185 fps
174.3 180.2 [X] 874931
AMD Ryzen 9 7950X 4.5GHz
NVIDIA GeForce RTX 3080 Ti
min:
154 fps, P1:
153 fps, max:
199 fps
~ 175 fps
87%
NVIDIA GeForce RTX 3080:
149 [X] MSI GeForce RTX 3080 Gaming X Trio Intel Core i9-9900K 3.6GHz
NVIDIA GeForce RTX 3080
min:
126 fps
fps
100%
NVIDIA GeForce RTX 3090:
100.4 [X] 874931
Intel Core i5-13400F 2.5GHz
NVIDIA GeForce RTX 3090
min:
72 fps, P1:
37 fps, max:
116 fps
101.1 [X] AMD Ryzen 7 7700X 874931
AMD Ryzen 7 7700X 4.5GHz
NVIDIA GeForce RTX 3090
min:
88 fps, P1:
87 fps, max:
112 fps
101.8 [X] 874931
Intel Core i5-13600K 3.5GHz
NVIDIA GeForce RTX 3090
min:
86 fps, P1:
88 fps, max:
114 fps
101.8 [X] AMD Ryzen 9 7950X 874931
AMD Ryzen 9 7950X 4.5GHz
NVIDIA GeForce RTX 3090
min:
88 fps, P1:
88 fps, max:
115 fps
102 [X] MSI GeForce RTX 3090 Suprim X Intel Core i9-9900K 3.6GHz
NVIDIA GeForce RTX 3090
min:
90 fps
102 [X] 831795
AMD Ryzen 9 5900X 3.7GHz
NVIDIA GeForce RTX 3090
min:
88 fps, P1:
87 fps, max:
114 fps
102.7 [X] NVIDIA GeForce RTX 3090 Founders Edition 874931
AMD Ryzen 9 7950X 4.5GHz
NVIDIA GeForce RTX 3090
min:
90 fps, P1:
89 fps, max:
116 fps
103.4 [X] 874931
Intel Core i9-13900K 3GHz
NVIDIA GeForce RTX 3090
min:
90 fps, P1:
89 fps, max:
116 fps
105.3 [X] 874931
AMD Ryzen 9 7900X 4.7GHz
NVIDIA GeForce RTX 3090
min:
90 fps, P1:
90 fps, max:
117 fps
105.6 [X] 874931
AMD Ryzen 5 7600X 4.7GHz
NVIDIA GeForce RTX 3090
min:
91 fps, P1:
90 fps, max:
117 fps
105.8 [X] Nvidia GeForce RTX 3090 FE 874931
AMD Ryzen 9 7950X 4.5GHz
NVIDIA GeForce RTX 3090
min:
92 fps, P1:
92 fps, max:
118 fps
110 [X] AMD Ryzen 7 7700 874931
AMD Ryzen 7 7700 3.8GHz
NVIDIA GeForce RTX 3090
min:
96 fps, P1:
95 fps, max:
123 fps
~ 103 fps
100%
NVIDIA GeForce RTX 3080 Ti:
101 [X] Corsair One i300 843175
Intel Core i9-12900K 3.2GHz
NVIDIA GeForce RTX 3080 Ti
min:
88 fps, P1:
87 fps, max:
114 fps
103.2 105.6 [X] 874931
AMD Ryzen 9 7950X 4.5GHz
NVIDIA GeForce RTX 3080 Ti
min:
91 fps, P1:
91 fps, max:
117 fps
~ 103 fps
88%
NVIDIA GeForce RTX 3080:
91 [X] MSI GeForce RTX 3080 Gaming X Trio Intel Core i9-9900K 3.6GHz
NVIDIA GeForce RTX 3080
min:
81 fps
fps
100%
NVIDIA GeForce RTX 3090:
144 [X] AMD Ryzen 9 5900X 3.7GHz
NVIDIA GeForce RTX 3090
fps
100%
NVIDIA GeForce RTX 3090:
144 [X] MSI GeForce RTX 3090 Suprim X Intel Core i9-9900K 3.6GHz
NVIDIA GeForce RTX 3090
min:
65.1 fps, P0.1:
109 fps, P1:
123 fps, max:
181 fps
144 [X] AMD Ryzen 9 5900X 3.7GHz
NVIDIA GeForce RTX 3090
~ 144 fps
100%
NVIDIA GeForce RTX 3080:
144 [X] MSI GeForce RTX 3080 Gaming X Trio Intel Core i9-9900K 3.6GHz
NVIDIA GeForce RTX 3080
min:
67.1 fps, P0.1:
109 fps, P1:
121 fps, max:
186 fps
fps
100%
NVIDIA GeForce RTX 3090:
144 [X] MSI GeForce RTX 3090 Suprim X Intel Core i9-9900K 3.6GHz
NVIDIA GeForce RTX 3090
min:
61.9 fps, P0.1:
108 fps, P1:
121 fps, max:
177 fps
144 [X] AMD Ryzen 9 5900X 3.7GHz
NVIDIA GeForce RTX 3090
~ 144 fps
100%
NVIDIA GeForce RTX 3080:
144 [X] MSI GeForce RTX 3080 Gaming X Trio Intel Core i9-9900K 3.6GHz
NVIDIA GeForce RTX 3080
min:
64.7 fps, P0.1:
98.7 fps, P1:
111 fps, max:
184 fps
fps
100%
NVIDIA GeForce RTX 3090:
144 [X] MSI GeForce RTX 3090 Suprim X Intel Core i9-9900K 3.6GHz
NVIDIA GeForce RTX 3090
min:
57.7 fps, P0.1:
109 fps, P1:
121 fps, max:
182 fps
144 [X] AMD Ryzen 9 5900X 3.7GHz
NVIDIA GeForce RTX 3090
~ 144 fps
100%
NVIDIA GeForce RTX 3080:
144 [X] MSI GeForce RTX 3080 Gaming X Trio Intel Core i9-9900K 3.6GHz
NVIDIA GeForce RTX 3080
min:
61.2 fps, P0.1:
110 fps, P1:
123 fps, max:
187 fps
fps
100%
NVIDIA GeForce RTX 3090:
144 [X] MSI GeForce RTX 3090 Suprim X Intel Core i9-9900K 3.6GHz
NVIDIA GeForce RTX 3090
min:
55.6 fps, P0.1:
95.9 fps, P1:
110 fps, max:
183 fps
144 [X] AMD Ryzen 9 5900X 3.7GHz
NVIDIA GeForce RTX 3090
~ 144 fps
100%
NVIDIA GeForce RTX 3080:
144 [X] MSI GeForce RTX 3080 Gaming X Trio Intel Core i9-9900K 3.6GHz
NVIDIA GeForce RTX 3080
min:
56.1 fps, P0.1:
101 fps, P1:
122 fps, max:
184 fps
fps
100%
NVIDIA GeForce RTX 3090:
180 [X] AMD Ryzen 9 5900X 3.7GHz
NVIDIA GeForce RTX 3090
min:
29.8 fps, P0.1:
51.5 fps, P1:
79.5 fps, max:
357 fps
fps
100%
NVIDIA GeForce RTX 3090:
161 [X] MSI GeForce RTX 3090 Suprim X Intel Core i9-9900K 3.6GHz
NVIDIA GeForce RTX 3090
min:
35.8 fps, P0.1:
54.2 fps, P1:
94.4 fps, max:
253 fps
177 [X] AMD Ryzen 9 5900X 3.7GHz
NVIDIA GeForce RTX 3090
min:
29.9 fps, P0.1:
54.8 fps, P1:
83.7 fps, max:
342 fps
~ 169 fps
102%
NVIDIA GeForce RTX 3080:
172 [X] MSI GeForce RTX 3080 Gaming X Trio Intel Core i9-9900K 3.6GHz
NVIDIA GeForce RTX 3080
min:
41.5 fps, P0.1:
59.7 fps, P1:
99 fps, max:
275 fps
fps
100%
NVIDIA GeForce RTX 3090:
160 [X] MSI GeForce RTX 3090 Suprim X Intel Core i9-9900K 3.6GHz
NVIDIA GeForce RTX 3090
min:
33.8 fps, P0.1:
51.8 fps, P1:
91.6 fps, max:
262 fps
175 [X] AMD Ryzen 9 5900X 3.7GHz
NVIDIA GeForce RTX 3090
min:
33.1 fps, P0.1:
50.1 fps, P1:
81.9 fps, max:
368 fps
~ 168 fps
101%
NVIDIA GeForce RTX 3080:
169 [X] MSI GeForce RTX 3080 Gaming X Trio Intel Core i9-9900K 3.6GHz
NVIDIA GeForce RTX 3080
min:
37.8 fps, P0.1:
51.7 fps, P1:
89.1 fps, max:
263 fps
fps
100%
NVIDIA GeForce RTX 3090:
159 [X] MSI GeForce RTX 3090 Suprim X Intel Core i9-9900K 3.6GHz
NVIDIA GeForce RTX 3090
min:
37.9 fps, P0.1:
52.2 fps, P1:
94.2 fps, max:
253 fps
164 [X] AMD Ryzen 9 5900X 3.7GHz
NVIDIA GeForce RTX 3090
min:
30.3 fps, P0.1:
46.6 fps, P1:
78.1 fps, max:
336 fps
~ 162 fps
110%
NVIDIA GeForce RTX 3080 Ti:
178 fps
98%
NVIDIA GeForce RTX 3080:
158 [X] MSI GeForce RTX 3080 Gaming X Trio Intel Core i9-9900K 3.6GHz
NVIDIA GeForce RTX 3080
min:
39.8 fps, P0.1:
55.3 fps, P1:
95.9 fps, max:
271 fps
fps
100%
NVIDIA GeForce RTX 3090:
133 [X] AMD Ryzen 9 5900X 3.7GHz
NVIDIA GeForce RTX 3090
min:
34.2 fps, P0.1:
47.6 fps, P1:
71.1 fps, max:
307 fps
139 [X] MSI GeForce RTX 3090 Suprim X Intel Core i9-9900K 3.6GHz
NVIDIA GeForce RTX 3090
min:
41 fps, P0.1:
54.8 fps, P1:
86.1 fps, max:
229 fps
~ 136 fps
101%
NVIDIA GeForce RTX 3080 Ti:
137 fps
96%
NVIDIA GeForce RTX 3080:
131 [X] MSI GeForce RTX 3080 Gaming X Trio Intel Core i9-9900K 3.6GHz
NVIDIA GeForce RTX 3080
min:
32.8 fps, P0.1:
52.9 fps, P1:
86.2 fps, max:
222 fps
fps
100%
NVIDIA GeForce RTX 3090:
81.2 [X] AMD Ryzen 9 5900X 3.7GHz
NVIDIA GeForce RTX 3090
min:
30.6 fps, P0.1:
39.4 fps, P1:
55.6 fps, max:
168 fps
88.7 [X] MSI GeForce RTX 3090 Suprim X Intel Core i9-9900K 3.6GHz
NVIDIA GeForce RTX 3090
min:
36 fps, P0.1:
40.3 fps, P1:
59.8 fps, max:
197 fps
~ 85 fps
98%
NVIDIA GeForce RTX 3080 Ti:
83.3 fps
92%
NVIDIA GeForce RTX 3080:
78.6 [X] MSI GeForce RTX 3080 Gaming X Trio Intel Core i9-9900K 3.6GHz
NVIDIA GeForce RTX 3080
min:
26.8 fps, P0.1:
38.3 fps, P1:
54.9 fps, max:
145 fps
fps
100%
NVIDIA GeForce RTX 3090:
117 [X] AMD Ryzen 9 5900X 3.7GHz
NVIDIA GeForce RTX 3090
min:
26.1 fps, P0.1:
45.7 fps, P1:
66.6 fps, max:
275 fps
135 [X] MSI GeForce RTX 3090 Suprim X Intel Core i9-9900K 3.6GHz
NVIDIA GeForce RTX 3090
min:
25.8 fps, P0.1:
50.3 fps, P1:
74 fps, max:
368 fps
~ 126 fps
102%
NVIDIA GeForce RTX 3080:
129 [X] MSI GeForce RTX 3080 Gaming X Trio Intel Core i9-9900K 3.6GHz
NVIDIA GeForce RTX 3080
min:
24.9 fps, P0.1:
48.3 fps, P1:
71.8 fps, max:
343 fps
fps
100%
NVIDIA GeForce RTX 3090:
112 [X] AMD Ryzen 9 5900X 3.7GHz
NVIDIA GeForce RTX 3090
min:
23.1 fps, P0.1:
49.1 fps, P1:
66.1 fps, max:
301 fps
128 [X] MSI GeForce RTX 3090 Suprim X Intel Core i9-9900K 3.6GHz
NVIDIA GeForce RTX 3090
min:
27.1 fps, P0.1:
49.8 fps, P1:
69.8 fps, max:
325 fps
~ 120 fps
102%
NVIDIA GeForce RTX 3080:
122 [X] MSI GeForce RTX 3080 Gaming X Trio Intel Core i9-9900K 3.6GHz
NVIDIA GeForce RTX 3080
min:
25.2 fps, P0.1:
51.7 fps, P1:
65.6 fps, max:
341 fps
fps
100%
NVIDIA GeForce RTX 3090:
107 [X] AMD Ryzen 9 5900X 3.7GHz
NVIDIA GeForce RTX 3090
min:
25 fps, P0.1:
47.2 fps, P1:
63.2 fps, max:
265 fps
128 [X] MSI GeForce RTX 3090 Suprim X Intel Core i9-9900K 3.6GHz
NVIDIA GeForce RTX 3090
min:
26.2 fps, P0.1:
55.6 fps, P1:
68.7 fps, max:
338 fps
~ 118 fps
102%
NVIDIA GeForce RTX 3080:
120 [X] MSI GeForce RTX 3080 Gaming X Trio Intel Core i9-9900K 3.6GHz
NVIDIA GeForce RTX 3080
min:
26.8 fps, P0.1:
50.6 fps, P1:
66.1 fps, max:
347 fps
fps
100%
NVIDIA GeForce RTX 3090:
109 [X] AMD Ryzen 9 5900X 3.7GHz
NVIDIA GeForce RTX 3090
min:
22.1 fps, P0.1:
46.5 fps, P1:
62.7 fps, max:
259 fps
121 [X] MSI GeForce RTX 3090 Suprim X Intel Core i9-9900K 3.6GHz
NVIDIA GeForce RTX 3090
min:
27.4 fps, P0.1:
46.8 fps, P1:
68.2 fps, max:
319 fps
~ 115 fps
102%
NVIDIA GeForce RTX 3080:
117 [X] MSI GeForce RTX 3080 Gaming X Trio Intel Core i9-9900K 3.6GHz
NVIDIA GeForce RTX 3080
min:
25.4 fps, P0.1:
41.2 fps, P1:
65.5 fps, max:
346 fps
fps
100%
NVIDIA GeForce RTX 3090:
305 [X] AMD Ryzen 9 5900X 3.7GHz
NVIDIA GeForce RTX 3090
min:
140 fps, P0.1:
195 fps, P1:
233 fps, max:
472 fps
fps
100%
NVIDIA GeForce RTX 3090:
181 [X] MSI GeForce RTX 3090 Suprim X Intel Core i9-9900K 3.6GHz
NVIDIA GeForce RTX 3090
min:
124 fps, P0.1:
128 fps, P1:
139 fps, max:
231 fps
304 [X] AMD Ryzen 9 5900X 3.7GHz
NVIDIA GeForce RTX 3090
min:
142 fps, P0.1:
192 fps, P1:
225 fps, max:
441 fps
~ 243 fps
77%
NVIDIA GeForce RTX 3080:
188 [X] MSI GeForce RTX 3080 Gaming X Trio Intel Core i9-9900K 3.6GHz
NVIDIA GeForce RTX 3080
min:
90.9 fps, P0.1:
128 fps, P1:
141 fps, max:
251 fps
fps
100%
NVIDIA GeForce RTX 3090:
181 [X] MSI GeForce RTX 3090 Suprim X Intel Core i9-9900K 3.6GHz
NVIDIA GeForce RTX 3090
min:
113 fps, P0.1:
123 fps, P1:
137 fps, max:
237 fps
304 [X] AMD Ryzen 9 5900X 3.7GHz
NVIDIA GeForce RTX 3090
min:
141 fps, P0.1:
199 fps, P1:
232 fps, max:
422 fps
~ 243 fps
77%
NVIDIA GeForce RTX 3080:
187 [X] MSI GeForce RTX 3080 Gaming X Trio Intel Core i9-9900K 3.6GHz
NVIDIA GeForce RTX 3080
min:
118 fps, P0.1:
128 fps, P1:
141 fps, max:
242 fps
fps
100%
NVIDIA GeForce RTX 3090:
180 [X] MSI GeForce RTX 3090 Suprim X Intel Core i9-9900K 3.6GHz
NVIDIA GeForce RTX 3090
min:
59.1 fps, P0.1:
125 fps, P1:
139 fps, max:
229 fps
285 [X] AMD Ryzen 9 5900X 3.7GHz
NVIDIA GeForce RTX 3090
min:
152 fps, P0.1:
198 fps, P1:
217 fps, max:
395 fps
~ 233 fps
100%
NVIDIA GeForce RTX 3080 Ti:
234 fps
80%
NVIDIA GeForce RTX 3080:
186 [X] MSI GeForce RTX 3080 Gaming X Trio Intel Core i9-9900K 3.6GHz
NVIDIA GeForce RTX 3080
min:
97.4 fps, P0.1:
109 fps, P1:
134 fps, max:
242 fps
fps
100%
NVIDIA GeForce RTX 3090:
179 [X] MSI GeForce RTX 3090 Suprim X Intel Core i9-9900K 3.6GHz
NVIDIA GeForce RTX 3090
min:
116 fps, P0.1:
128 fps, P1:
141 fps, max:
226 fps
213 [X] AMD Ryzen 9 5900X 3.7GHz
NVIDIA GeForce RTX 3090
min:
144 fps, P0.1:
170 fps, P1:
177 fps, max:
288 fps
~ 196 fps
102%
NVIDIA GeForce RTX 3080 Ti:
199 fps
93%
NVIDIA GeForce RTX 3080:
182 [X] MSI GeForce RTX 3080 Gaming X Trio Intel Core i9-9900K 3.6GHz
NVIDIA GeForce RTX 3080
min:
40.4 fps, P0.1:
126 fps, P1:
142 fps, max:
250 fps
fps
100%
NVIDIA GeForce RTX 3090:
116 [X] AMD Ryzen 9 5900X 3.7GHz
NVIDIA GeForce RTX 3090
min:
74.7 fps, P0.1:
97.9 fps, P1:
100 fps, max:
155 fps
117 [X] MSI GeForce RTX 3090 Suprim X Intel Core i9-9900K 3.6GHz
NVIDIA GeForce RTX 3090
min:
23.3 fps, P0.1:
97.8 fps, P1:
101 fps, max:
154 fps
~ 117 fps
97%
NVIDIA GeForce RTX 3080 Ti:
114 fps
88%
NVIDIA GeForce RTX 3080:
103 [X] MSI GeForce RTX 3080 Gaming X Trio Intel Core i9-9900K 3.6GHz
NVIDIA GeForce RTX 3080
min:
22.6 fps, P0.1:
50.7 fps, P1:
87.8 fps, max:
137 fps
fps
100%
NVIDIA GeForce RTX 3090:
120 [X] AMD Ryzen 9 5900X 3.7GHz
NVIDIA GeForce RTX 3090
min:
9.68 fps, P0.1:
12.4 fps, P1:
25.3 fps, max:
214 fps
fps
100%
NVIDIA GeForce RTX 3090:
134 [X] MSI GeForce RTX 3090 Suprim X Intel Core i9-9900K 3.6GHz
NVIDIA GeForce RTX 3090
min:
37.9 fps, P0.1:
44.4 fps, P1:
63.5 fps, max:
218 fps
137 [X] AMD Ryzen 9 5900X 3.7GHz
NVIDIA GeForce RTX 3090
min:
15 fps, P0.1:
22.1 fps, P1:
67.6 fps, max:
223 fps
~ 136 fps
99%
NVIDIA GeForce RTX 3080:
135 [X] MSI GeForce RTX 3080 Gaming X Trio Intel Core i9-9900K 3.6GHz
NVIDIA GeForce RTX 3080
min:
34.6 fps, P0.1:
42.8 fps, P1:
61.9 fps, max:
230 fps
fps
100%
NVIDIA GeForce RTX 3090:
132 [X] MSI GeForce RTX 3090 Suprim X Intel Core i9-9900K 3.6GHz
NVIDIA GeForce RTX 3090
min:
42 fps, P0.1:
44.2 fps, P1:
60 fps, max:
225 fps
166 [X] AMD Ryzen 9 5900X 3.7GHz
NVIDIA GeForce RTX 3090
min:
11 fps, P0.1:
21.1 fps, P1:
78.5 fps, max:
280 fps
~ 149 fps
89%
NVIDIA GeForce RTX 3080:
133 [X] MSI GeForce RTX 3080 Gaming X Trio Intel Core i9-9900K 3.6GHz
NVIDIA GeForce RTX 3080
min:
30.1 fps, P0.1:
46.4 fps, P1:
62.9 fps, max:
226 fps
fps
100%
NVIDIA GeForce RTX 3090:
125 [X] MSI GeForce RTX 3090 Suprim X Intel Core i9-9900K 3.6GHz
NVIDIA GeForce RTX 3090
min:
44.8 fps, P0.1:
47.2 fps, P1:
57.1 fps, max:
222 fps
168 [X] AMD Ryzen 9 5900X 3.7GHz
NVIDIA GeForce RTX 3090
min:
20.9 fps, P0.1:
40.1 fps, P1:
86.5 fps, max:
275 fps
~ 147 fps
101%
NVIDIA GeForce RTX 3080 Ti:
148 fps
86%
NVIDIA GeForce RTX 3080:
126 [X] MSI GeForce RTX 3080 Gaming X Trio Intel Core i9-9900K 3.6GHz
NVIDIA GeForce RTX 3080
min:
38.2 fps, P0.1:
45.8 fps, P1:
58.3 fps, max:
211 fps
fps
100%
NVIDIA GeForce RTX 3090:
125 [X] MSI GeForce RTX 3090 Suprim X Intel Core i9-9900K 3.6GHz
NVIDIA GeForce RTX 3090
min:
42.7 fps, P0.1:
46.3 fps, P1:
61.6 fps, max:
212 fps
150 [X] AMD Ryzen 9 5900X 3.7GHz
NVIDIA GeForce RTX 3090
min:
18.9 fps, P0.1:
38.2 fps, P1:
79.9 fps, max:
274 fps
~ 138 fps
109%
NVIDIA GeForce RTX 3080 Ti:
151 fps
91%
NVIDIA GeForce RTX 3080:
125 [X] MSI GeForce RTX 3080 Gaming X Trio Intel Core i9-9900K 3.6GHz
NVIDIA GeForce RTX 3080
min:
39.6 fps, P0.1:
45.8 fps, P1:
61.9 fps, max:
220 fps
fps
100%
NVIDIA GeForce RTX 3090:
85.7 [X] AMD Ryzen 9 5900X 3.7GHz
NVIDIA GeForce RTX 3090
min:
14.7 fps, P0.1:
22.5 fps, P1:
46.9 fps, max:
251 fps
89.3 [X] MSI GeForce RTX 3090 Suprim X Intel Core i9-9900K 3.6GHz
NVIDIA GeForce RTX 3090
min:
33.3 fps, P0.1:
40.2 fps, P1:
53.4 fps, max:
180 fps
~ 88 fps
95%
NVIDIA GeForce RTX 3080 Ti:
83.7 fps
90%
NVIDIA GeForce RTX 3080:
79.1 [X] MSI GeForce RTX 3080 Gaming X Trio Intel Core i9-9900K 3.6GHz
NVIDIA GeForce RTX 3080
min:
37.2 fps, P0.1:
39.7 fps, P1:
50.7 fps, max:
175 fps
fps
100%
NVIDIA GeForce RTX 3090:
267 [X] AMD Ryzen 9 5900X 3.7GHz
NVIDIA GeForce RTX 3090
fps
100%
NVIDIA GeForce RTX 3090:
173 [X] MSI GeForce RTX 3090 Suprim X Intel Core i9-9900K 3.6GHz
NVIDIA GeForce RTX 3090
min:
89 fps
224 [X] AMD Ryzen 9 5900X 3.7GHz
NVIDIA GeForce RTX 3090
~ 199 fps
86%
NVIDIA GeForce RTX 3080:
172 [X] MSI GeForce RTX 3080 Gaming X Trio Intel Core i9-9900K 3.6GHz
NVIDIA GeForce RTX 3080
min:
94 fps
fps
100%
NVIDIA GeForce RTX 3090:
170 [X] MSI GeForce RTX 3090 Suprim X Intel Core i9-9900K 3.6GHz
NVIDIA GeForce RTX 3090
min:
86 fps
223 [X] AMD Ryzen 9 5900X 3.7GHz
NVIDIA GeForce RTX 3090
~ 197 fps
85%
NVIDIA GeForce RTX 3080:
168 [X] MSI GeForce RTX 3080 Gaming X Trio Intel Core i9-9900K 3.6GHz
NVIDIA GeForce RTX 3080
min:
90 fps
fps
100%
NVIDIA GeForce RTX 3090:
167 [X] MSI GeForce RTX 3090 Suprim X Intel Core i9-9900K 3.6GHz
NVIDIA GeForce RTX 3090
min:
76 fps
223 [X] AMD Ryzen 9 5900X 3.7GHz
NVIDIA GeForce RTX 3090
~ 195 fps
137%
NVIDIA GeForce RTX 3080 Ti:
267 fps
85%
NVIDIA GeForce RTX 3080:
166 [X] MSI GeForce RTX 3080 Gaming X Trio Intel Core i9-9900K 3.6GHz
NVIDIA GeForce RTX 3080
min:
77 fps
fps
100%
NVIDIA GeForce RTX 3090:
166 [X] MSI GeForce RTX 3090 Suprim X Intel Core i9-9900K 3.6GHz
NVIDIA GeForce RTX 3090
min:
58 fps
190 [X] AMD Ryzen 9 5900X 3.7GHz
NVIDIA GeForce RTX 3090
~ 178 fps
118%
NVIDIA GeForce RTX 3080 Ti:
210.4 fps
92%
NVIDIA GeForce RTX 3080:
164 [X] MSI GeForce RTX 3080 Gaming X Trio Intel Core i9-9900K 3.6GHz
NVIDIA GeForce RTX 3080
min:
54 fps
fps
100%
NVIDIA GeForce RTX 3090:
115 [X] AMD Ryzen 9 5900X 3.7GHz
NVIDIA GeForce RTX 3090
122 [X] MSI GeForce RTX 3090 Suprim X Intel Core i9-9900K 3.6GHz
NVIDIA GeForce RTX 3090
min:
54 fps
~ 119 fps
101%
NVIDIA GeForce RTX 3080 Ti:
119.6 fps
92%
NVIDIA GeForce RTX 3080:
109 [X] MSI GeForce RTX 3080 Gaming X Trio Intel Core i9-9900K 3.6GHz
NVIDIA GeForce RTX 3080
min:
49 fps
fps
100%
NVIDIA GeForce RTX 3090:
143.1 [X] AMD Ryzen 9 5900X 3.7GHz
NVIDIA GeForce RTX 3090
fps
92%
NVIDIA GeForce RTX 3080:
132 [X] AMD Ryzen 9 5900X 3.7GHz
NVIDIA GeForce RTX 3080
min:
21.4 fps, P0.1:
70 fps, P1:
92 fps, max:
216 fps
fps
100%
NVIDIA GeForce RTX 3090:
115 [X] MSI GeForce RTX 3090 Suprim X Intel Core i9-9900K 3.6GHz
NVIDIA GeForce RTX 3090
min:
19.2 fps, P0.1:
64.8 fps, P1:
80.9 fps, max:
189 fps
138.6 [X] AMD Ryzen 9 5900X 3.7GHz
NVIDIA GeForce RTX 3090
~ 127 fps
101%
NVIDIA GeForce RTX 3080:
128 [X] AMD Ryzen 9 5900X 3.7GHz
NVIDIA GeForce RTX 3080
min:
21.9 fps, P0.1:
76.5 fps, P1:
91 fps, max:
212 fps
fps
100%
NVIDIA GeForce RTX 3090:
112 [X] MSI GeForce RTX 3090 Suprim X Intel Core i9-9900K 3.6GHz
NVIDIA GeForce RTX 3090
min:
16.6 fps, P0.1:
67.4 fps, P1:
80 fps, max:
184 fps
124.1 [X] AMD Ryzen 9 5900X 3.7GHz
NVIDIA GeForce RTX 3090
~ 118 fps
98%
NVIDIA GeForce RTX 3080:
116 [X] AMD Ryzen 9 5900X 3.7GHz
NVIDIA GeForce RTX 3080
min:
22.9 fps, P0.1:
71.8 fps, P1:
85.4 fps, max:
174 fps
fps
100%
NVIDIA GeForce RTX 3090:
108 [X] MSI GeForce RTX 3090 Suprim X Intel Core i9-9900K 3.6GHz
NVIDIA GeForce RTX 3090
min:
20 fps, P0.1:
63.9 fps, P1:
76.5 fps, max:
172 fps
109.7 [X] AMD Ryzen 9 5900X 3.7GHz
NVIDIA GeForce RTX 3090
~ 109 fps
115%
NVIDIA GeForce RTX 3080 Ti:
125 fps
94%
NVIDIA GeForce RTX 3080:
103 [X] AMD Ryzen 9 5900X 3.7GHz
NVIDIA GeForce RTX 3080
min:
23.3 fps, P0.1:
60.3 fps, P1:
75.7 fps, max:
176 fps
fps
100%
NVIDIA GeForce RTX 3090:
78.1 [X] AMD Ryzen 9 5900X 3.7GHz
NVIDIA GeForce RTX 3090
85.3 [X] MSI GeForce RTX 3090 Suprim X Intel Core i9-9900K 3.6GHz
NVIDIA GeForce RTX 3090
min:
20.2 fps, P0.1:
57 fps, P1:
66.9 fps, max:
128 fps
~ 82 fps
103%
NVIDIA GeForce RTX 3080 Ti:
84.3 fps
88%
NVIDIA GeForce RTX 3080:
72.5 [X] AMD Ryzen 9 5900X 3.7GHz
NVIDIA GeForce RTX 3080
min:
22.2 fps, P0.1:
46.6 fps, P1:
57.1 fps, max:
159 fps
fps
100%
NVIDIA GeForce RTX 3090:
41.5 [X] AMD Ryzen 9 5900X 3.7GHz
NVIDIA GeForce RTX 3090
45.3 [X] MSI GeForce RTX 3090 Suprim X Intel Core i9-9900K 3.6GHz
NVIDIA GeForce RTX 3090
min:
19.3 fps, P0.1:
34.5 fps, P1:
40.5 fps, max:
95.5 fps
~ 43 fps
98%
NVIDIA GeForce RTX 3080 Ti:
42.3 fps
90%
NVIDIA GeForce RTX 3080:
38.9 [X] AMD Ryzen 9 5900X 3.7GHz
NVIDIA GeForce RTX 3080
min:
20.9 fps, P0.1:
31.3 fps, P1:
34.3 fps, max:
86.6 fps
fps
100%
NVIDIA GeForce RTX 3090:
164 [X] AMD Ryzen 9 5900X 3.7GHz
NVIDIA GeForce RTX 3090
min:
57 fps, max:
237 fps
fps
87%
NVIDIA GeForce RTX 3080:
143 [X] AMD Ryzen 9 5900X 3.7GHz
NVIDIA GeForce RTX 3080
min:
35 fps, max:
224 fps
fps
100%
NVIDIA GeForce RTX 3090:
144 [X] AMD Ryzen 9 5900X 3.7GHz
NVIDIA GeForce RTX 3090
min:
40 fps, max:
230 fps
fps
84%
NVIDIA GeForce RTX 3080:
121 [X] AMD Ryzen 9 5900X 3.7GHz
NVIDIA GeForce RTX 3080
min:
35 fps, max:
184 fps
fps
100%
NVIDIA GeForce RTX 3090:
138 [X] AMD Ryzen 9 5900X 3.7GHz
NVIDIA GeForce RTX 3090
min:
30 fps, max:
223 fps
fps
79%
NVIDIA GeForce RTX 3080:
109 [X] AMD Ryzen 9 5900X 3.7GHz
NVIDIA GeForce RTX 3080
min:
28 fps, max:
183 fps
fps
100%
NVIDIA GeForce RTX 3090:
130 [X] AMD Ryzen 9 5900X 3.7GHz
NVIDIA GeForce RTX 3090
min:
39 fps, max:
206 fps
fps
62%
NVIDIA GeForce RTX 3080:
80 [X] AMD Ryzen 9 5900X 3.7GHz
NVIDIA GeForce RTX 3080
min:
31 fps, max:
147 fps
fps
100%
NVIDIA GeForce RTX 3090:
114 [X] AMD Ryzen 9 5900X 3.7GHz
NVIDIA GeForce RTX 3090
min:
46 fps, max:
199 fps
fps
65%
NVIDIA GeForce RTX 3080:
74 [X] AMD Ryzen 9 5900X 3.7GHz
NVIDIA GeForce RTX 3080
min:
32 fps, max:
123 fps
fps
100%
NVIDIA GeForce RTX 3090:
83 [X] AMD Ryzen 9 5900X 3.7GHz
NVIDIA GeForce RTX 3090
min:
39 fps, max:
149 fps
fps
69%
NVIDIA GeForce RTX 3080:
57 [X] AMD Ryzen 9 5900X 3.7GHz
NVIDIA GeForce RTX 3080
min:
25 fps, max:
115 fps
fps
100%
NVIDIA GeForce RTX 3090:
116 [X] AMD Ryzen 9 5900X 3.7GHz
NVIDIA GeForce RTX 3090
min:
68.3 fps, P0.1:
70.3 fps, P1:
80.7 fps, max:
151 fps
121.2 [X] AMD Ryzen 9 5900X 3.7GHz
NVIDIA GeForce RTX 3090
~ 119 fps
102%
NVIDIA GeForce RTX 3080:
121 [X] AMD Ryzen 9 5900X 3.7GHz
NVIDIA GeForce RTX 3080
min:
33.8 fps, P0.1:
70.5 fps, P1:
86.2 fps, max:
160 fps
fps
100%
NVIDIA GeForce RTX 3090:
114 [X] AMD Ryzen 9 5900X 3.7GHz
NVIDIA GeForce RTX 3090
min:
37.3 fps, P0.1:
65.4 fps, P1:
77.7 fps, max:
157 fps
120 [X] AMD Ryzen 9 5900X 3.7GHz
NVIDIA GeForce RTX 3090
~ 117 fps
99%
NVIDIA GeForce RTX 3080:
116 [X] AMD Ryzen 9 5900X 3.7GHz
NVIDIA GeForce RTX 3080
min:
63.1 fps, P0.1:
70.7 fps, P1:
83.1 fps, max:
147 fps
fps
100%
NVIDIA GeForce RTX 3090:
115 [X] AMD Ryzen 9 5900X 3.7GHz
NVIDIA GeForce RTX 3090
min:
24.2 fps, P0.1:
64.6 fps, P1:
77.9 fps, max:
154 fps
118.3 [X] AMD Ryzen 9 5900X 3.7GHz
NVIDIA GeForce RTX 3090
~ 117 fps
101%
NVIDIA GeForce RTX 3080:
118 [X] AMD Ryzen 9 5900X 3.7GHz
NVIDIA GeForce RTX 3080
min:
33.2 fps, P0.1:
73.3 fps, P1:
83.4 fps, max:
152 fps
fps
100%
NVIDIA GeForce RTX 3090:
115 [X] AMD Ryzen 9 5900X 3.7GHz
NVIDIA GeForce RTX 3090
116 [X] AMD Ryzen 9 5900X 3.7GHz
NVIDIA GeForce RTX 3090
min:
47.3 fps, P0.1:
66.5 fps, P1:
79 fps, max:
149 fps
~ 116 fps
95%
NVIDIA GeForce RTX 3080:
110 [X] AMD Ryzen 9 5900X 3.7GHz
NVIDIA GeForce RTX 3080
min:
70.4 fps, P0.1:
70.8 fps, P1:
79.9 fps, max:
139 fps
fps
100%
NVIDIA GeForce RTX 3090:
113.2 [X] AMD Ryzen 9 5900X 3.7GHz
NVIDIA GeForce RTX 3090
116 [X] AMD Ryzen 9 5900X 3.7GHz
NVIDIA GeForce RTX 3090
min:
60.3 fps, P0.1:
67 fps, P1:
78 fps, max:
149 fps
~ 115 fps
97%
NVIDIA GeForce RTX 3080:
112 [X] AMD Ryzen 9 5900X 3.7GHz
NVIDIA GeForce RTX 3080
min:
52.9 fps, P0.1:
68 fps, P1:
81.4 fps, max:
140 fps
fps
100%
NVIDIA GeForce RTX 3090:
78.2 [X] AMD Ryzen 9 5900X 3.7GHz
NVIDIA GeForce RTX 3090
80.2 [X] AMD Ryzen 9 5900X 3.7GHz
NVIDIA GeForce RTX 3090
min:
17.1 fps, P0.1:
31 fps, P1:
52.3 fps, max:
139 fps
~ 79 fps
92%
NVIDIA GeForce RTX 3080:
72.4 [X] AMD Ryzen 9 5900X 3.7GHz
NVIDIA GeForce RTX 3080
min:
37 fps, P0.1:
40.3 fps, P1:
47.4 fps, max:
129 fps
fps
100%
NVIDIA GeForce RTX 3090:
251 [X] AMD Ryzen 9 5900X 3.7GHz
NVIDIA GeForce RTX 3090
min:
75.4 fps, P0.1:
140 fps, P1:
161 fps, max:
531 fps
264 [X] AMD Ryzen 9 5900X 3.7GHz
NVIDIA GeForce RTX 3090
~ 258 fps
91%
NVIDIA GeForce RTX 3080:
235 [X] AMD Ryzen 9 5900X 3.7GHz
NVIDIA GeForce RTX 3080
min:
66.8 fps, P0.1:
121 fps, P1:
147 fps, max:
531 fps
fps
100%
NVIDIA GeForce RTX 3090:
223 [X] AMD Ryzen 9 5900X 3.7GHz
NVIDIA GeForce RTX 3090
min:
73.1 fps, P0.1:
126 fps, P1:
141 fps, max:
524 fps
231.2 [X] AMD Ryzen 9 5900X 3.7GHz
NVIDIA GeForce RTX 3090
~ 227 fps
89%
NVIDIA GeForce RTX 3080:
201 [X] AMD Ryzen 9 5900X 3.7GHz
NVIDIA GeForce RTX 3080
min:
39.6 fps, P0.1:
109 fps, P1:
131 fps, max:
459 fps
fps
100%
NVIDIA GeForce RTX 3090:
172 [X] AMD Ryzen 9 5900X 3.7GHz
NVIDIA GeForce RTX 3090
min:
59.6 fps, P0.1:
102 fps, P1:
116 fps, max:
318 fps
195.4 [X] AMD Ryzen 9 5900X 3.7GHz
NVIDIA GeForce RTX 3090
~ 184 fps
94%
NVIDIA GeForce RTX 3080:
173 [X] AMD Ryzen 9 5900X 3.7GHz
NVIDIA GeForce RTX 3080
min:
29 fps, P0.1:
93.3 fps, P1:
119 fps, max:
451 fps
fps
100%
NVIDIA GeForce RTX 3090:
161 [X] AMD Ryzen 9 5900X 3.7GHz
NVIDIA GeForce RTX 3090
min:
59.8 fps, P0.1:
96.1 fps, P1:
111 fps, max:
312 fps
161.1 [X] AMD Ryzen 9 5900X 3.7GHz
NVIDIA GeForce RTX 3090
~ 161 fps
101%
NVIDIA GeForce RTX 3080 Ti:
162 fps
79%
NVIDIA GeForce RTX 3080:
127 [X] AMD Ryzen 9 5900X 3.7GHz
NVIDIA GeForce RTX 3080
min:
21.9 fps, P0.1:
24.4 fps, P1:
83.5 fps, max:
285 fps
fps
100%
NVIDIA GeForce RTX 3090:
122 [X] AMD Ryzen 9 5900X 3.7GHz
NVIDIA GeForce RTX 3090
min:
54.5 fps, P0.1:
84.4 fps, P1:
93.9 fps, max:
258 fps
124.7 [X] AMD Ryzen 9 5900X 3.7GHz
NVIDIA GeForce RTX 3090
~ 123 fps
107%
NVIDIA GeForce RTX 3080 Ti:
131 fps
85%
NVIDIA GeForce RTX 3080:
104 [X] AMD Ryzen 9 5900X 3.7GHz
NVIDIA GeForce RTX 3080
min:
19.1 fps, P0.1:
20.4 fps, P1:
77.7 fps, max:
258 fps
fps
100%
NVIDIA GeForce RTX 3090:
74.6 [X] AMD Ryzen 9 5900X 3.7GHz
NVIDIA GeForce RTX 3090
76.1 [X] AMD Ryzen 9 5900X 3.7GHz
NVIDIA GeForce RTX 3090
min:
42.1 fps, P0.1:
58.7 fps, P1:
61.9 fps, max:
221 fps
~ 75 fps
102%
NVIDIA GeForce RTX 3080 Ti:
76.5 fps
87%
NVIDIA GeForce RTX 3080:
65.6 [X] AMD Ryzen 9 5900X 3.7GHz
NVIDIA GeForce RTX 3080
min:
13.8 fps, P0.1:
17.5 fps, P1:
51.4 fps, max:
229 fps
fps
100%
NVIDIA GeForce RTX 3090:
137 [X] AMD Ryzen 9 5900X 3.7GHz
NVIDIA GeForce RTX 3090
min:
7 fps, max:
201 fps
138 [X] AMD Ryzen 9 5900X 3.7GHz
NVIDIA GeForce RTX 3090
min:
83 fps, max:
169 fps
275 [X] Nvidia GeForce RTX 3090 FE Intel Core i9-14900K 3.2GHz
NVIDIA GeForce RTX 3090
min:
175 fps, P0.1:
203 fps, P1:
246 fps, max:
340 fps
~ 183 fps
74%
NVIDIA GeForce RTX 3080:
136 [X] AMD Ryzen 9 5900X 3.7GHz
NVIDIA GeForce RTX 3080
min:
25 fps, max:
177 fps
fps
100%
NVIDIA GeForce RTX 3090:
112 [X] AMD Ryzen 9 5900X 3.7GHz
NVIDIA GeForce RTX 3090
min:
9 fps, max:
185 fps
114 [X] AMD Ryzen 9 5900X 3.7GHz
NVIDIA GeForce RTX 3090
min:
53 fps, max:
179 fps
206 [X] Nvidia GeForce RTX 3090 FE Intel Core i9-14900K 3.2GHz
NVIDIA GeForce RTX 3090
min:
124 fps, P0.1:
142 fps, P1:
167 fps, max:
311 fps
~ 144 fps
77%
NVIDIA GeForce RTX 3080:
111 [X] AMD Ryzen 9 5900X 3.7GHz
NVIDIA GeForce RTX 3080
min:
52 fps, max:
171 fps
fps
100%
NVIDIA GeForce RTX 3090:
97 [X] AMD Ryzen 9 5900X 3.7GHz
NVIDIA GeForce RTX 3090
min:
23 fps, max:
174 fps
105 [X] AMD Ryzen 9 5900X 3.7GHz
NVIDIA GeForce RTX 3090
min:
44 fps, max:
173 fps
174 [X] Nvidia GeForce RTX 3090 FE Intel Core i9-14900K 3.2GHz
NVIDIA GeForce RTX 3090
min:
82 fps, P0.1:
113 fps, P1:
139 fps, max:
297 fps
~ 125 fps
77%
NVIDIA GeForce RTX 3080:
96 [X] AMD Ryzen 9 5900X 3.7GHz
NVIDIA GeForce RTX 3080
min:
16 fps, max:
161 fps
fps
100%
NVIDIA GeForce RTX 3090:
88 [X] AMD Ryzen 9 5900X 3.7GHz
NVIDIA GeForce RTX 3090
min:
22 fps, max:
159 fps
91 [X] AMD Ryzen 9 5900X 3.7GHz
NVIDIA GeForce RTX 3090
min:
48 fps, max:
158 fps
152 [X] Nvidia GeForce RTX 3090 FE Intel Core i9-14900K 3.2GHz
NVIDIA GeForce RTX 3090
min:
87 fps, P0.1:
101 fps, P1:
120 fps, max:
273 fps
~ 110 fps
91%
NVIDIA GeForce RTX 3080 Ti:
100 fps
80%
NVIDIA GeForce RTX 3080:
88 [X] AMD Ryzen 9 5900X 3.7GHz
NVIDIA GeForce RTX 3080
min:
47 fps, max:
162 fps
fps
100%
NVIDIA GeForce RTX 3090:
76 [X] AMD Ryzen 9 5900X 3.7GHz
NVIDIA GeForce RTX 3090
min:
42 fps, max:
144 fps
79 [X] AMD Ryzen 9 5900X 3.7GHz
NVIDIA GeForce RTX 3090
min:
44 fps, max:
135 fps
120 [X] Nvidia GeForce RTX 3090 FE Intel Core i9-14900K 3.2GHz
NVIDIA GeForce RTX 3090
min:
65 fps, P0.1:
78 fps, P1:
95 fps, max:
270 fps
~ 92 fps
93%
NVIDIA GeForce RTX 3080 Ti:
86 fps
83%
NVIDIA GeForce RTX 3080:
76 [X] AMD Ryzen 9 5900X 3.7GHz
NVIDIA GeForce RTX 3080
min:
41 fps, max:
156 fps
fps
100%
NVIDIA GeForce RTX 3090:
55 [X] AMD Ryzen 9 5900X 3.7GHz
NVIDIA GeForce RTX 3090
min:
19 fps, max:
107 fps
57 [X] AMD Ryzen 9 5900X 3.7GHz
NVIDIA GeForce RTX 3090
min:
36 fps, max:
113 fps
74 [X] Nvidia GeForce RTX 3090 FE Intel Core i9-14900K 3.2GHz
NVIDIA GeForce RTX 3090
min:
49 fps, P0.1:
51 fps, P1:
57 fps, max:
177 fps
~ 62 fps
98%
NVIDIA GeForce RTX 3080 Ti:
61 fps
84%
NVIDIA GeForce RTX 3080:
52 [X] AMD Ryzen 9 5900X 3.7GHz
NVIDIA GeForce RTX 3080
min:
3 fps, max:
95 fps
fps
100%
NVIDIA GeForce RTX 3090:
191 [X] AMD Ryzen 9 5900X 3.7GHz
NVIDIA GeForce RTX 3090
min:
143 fps, P0.1:
156.3 fps, P1:
165.9 fps, max:
230.1 fps
250.2 [X] AMD Ryzen 9 5900X 3.7GHz
NVIDIA GeForce RTX 3090
min:
188 fps, max:
310 fps
~ 221 fps
82%
NVIDIA GeForce RTX 3080:
176 [X] AMD Ryzen 9 5900X 3.7GHz
NVIDIA GeForce RTX 3080
min:
98.9 fps, P0.1:
141.1 fps, P1:
152 fps, max:
215 fps
186 [X] AMD Ryzen 9 5900X 3.7GHz
NVIDIA GeForce RTX 3080
min:
145.4 fps, P0.1:
156.4 fps, P1:
167.9 fps, max:
215.1 fps
~ 181 fps
100%
NVIDIA GeForce RTX 3090:
149 [X] AMD Ryzen 9 5900X 3.7GHz
NVIDIA GeForce RTX 3090
min:
112.5 fps, P0.1:
117.9 fps, P1:
128.4 fps, max:
180 fps
197 [X] AMD Ryzen 9 5900X 3.7GHz
NVIDIA GeForce RTX 3090
min:
10 fps, max:
241 fps
~ 173 fps
74%
NVIDIA GeForce RTX 3080:
121 [X] AMD Ryzen 9 5900X 3.7GHz
NVIDIA GeForce RTX 3080
min:
60.9 fps, P0.1:
96.8 fps, P1:
105.3 fps, max:
146 fps
134 [X] AMD Ryzen 9 5900X 3.7GHz
NVIDIA GeForce RTX 3080
min:
81.7 fps, P0.1:
102.8 fps, P1:
118.2 fps, max:
170.6 fps
~ 128 fps
100%
NVIDIA GeForce RTX 3090:
127 [X] AMD Ryzen 9 5900X 3.7GHz
NVIDIA GeForce RTX 3090
min:
105.3 fps, P0.1:
108.6 fps, P1:
111.5 fps, max:
160.7 fps
178.5 [X] AMD Ryzen 9 5900X 3.7GHz
NVIDIA GeForce RTX 3090
min:
10 fps, max:
208 fps
~ 153 fps
73%
NVIDIA GeForce RTX 3080:
111 [X] AMD Ryzen 9 5900X 3.7GHz
NVIDIA GeForce RTX 3080
min:
11.8 fps, P0.1:
87.2 fps, P1:
98.3 fps, max:
146.8 fps
112 [X] AMD Ryzen 9 5900X 3.7GHz
NVIDIA GeForce RTX 3080
min:
72.3 fps, P0.1:
78.9 fps, P1:
82.6 fps, max:
194.3 fps
~ 112 fps
100%
NVIDIA GeForce RTX 3090:
112 [X] AMD Ryzen 9 5900X 3.7GHz
NVIDIA GeForce RTX 3090
min:
19.5 fps, P0.1:
93.6 fps, P1:
97 fps, max:
136.8 fps
159.5 [X] AMD Ryzen 9 5900X 3.7GHz
NVIDIA GeForce RTX 3090
min:
110 fps, max:
186 fps
~ 136 fps
120%
NVIDIA GeForce RTX 3080 Ti:
163 fps
76%
NVIDIA GeForce RTX 3080:
97 [X] AMD Ryzen 9 5900X 3.7GHz
NVIDIA GeForce RTX 3080
min:
47.5 fps, P0.1:
70.2 fps, P1:
73.6 fps, max:
173.7 fps
111 [X] AMD Ryzen 9 5900X 3.7GHz
NVIDIA GeForce RTX 3080
min:
47.8 fps, P0.1:
86.7 fps, P1:
97.3 fps, max:
135.6 fps
~ 104 fps
100%
NVIDIA GeForce RTX 3090:
100 [X] AMD Ryzen 9 5900X 3.7GHz
NVIDIA GeForce RTX 3090
min:
76.7 fps, P0.1:
80.2 fps, P1:
87 fps, max:
124.8 fps
131.1 [X] AMD Ryzen 9 5900X 3.7GHz
NVIDIA GeForce RTX 3090
min:
91 fps, max:
152 fps
~ 116 fps
117%
NVIDIA GeForce RTX 3080 Ti:
136 fps
66%
NVIDIA GeForce RTX 3080:
69.1 [X] AMD Ryzen 9 5900X 3.7GHz
NVIDIA GeForce RTX 3080
min:
47.8 fps, P0.1:
57.1 fps, P1:
59.9 fps, max:
84.8 fps
85.5 [X] AMD Ryzen 9 5900X 3.7GHz
NVIDIA GeForce RTX 3080
min:
50.9 fps, P0.1:
63.1 fps, P1:
66.5 fps, max:
134.8 fps
~ 77 fps
100%
NVIDIA GeForce RTX 3090:
73.8 [X] AMD Ryzen 9 5900X 3.7GHz
NVIDIA GeForce RTX 3090
min:
54.5 fps, P0.1:
56.1 fps, P1:
65.4 fps, max:
89 fps
91.4 [X] AMD Ryzen 9 5900X 3.7GHz
NVIDIA GeForce RTX 3090
min:
14 fps, max:
106 fps
~ 83 fps
111%
NVIDIA GeForce RTX 3080 Ti:
92.4 fps
73%
NVIDIA GeForce RTX 3080:
55.3 [X] AMD Ryzen 9 5900X 3.7GHz
NVIDIA GeForce RTX 3080
min:
37.7 fps, P0.1:
41 fps, P1:
48.1 fps, max:
64.5 fps
65.7 [X] AMD Ryzen 9 5900X 3.7GHz
NVIDIA GeForce RTX 3080
min:
38.5 fps, P0.1:
48.7 fps, P1:
55 fps, max:
86.9 fps
~ 61 fps
100%
NVIDIA GeForce RTX 3090:
128 [X] AMD Ryzen 9 5900X 3.7GHz
NVIDIA GeForce RTX 3090
min:
30.64 fps, P1:
93.6 fps, max:
189.21 fps
132 [X] AMD Ryzen 9 5900X 3.7GHz
NVIDIA GeForce RTX 3090
min:
48.54 fps, P1:
91.36 fps, max:
208.81 fps
217 [X] Nvidia GeForce RTX 3090 FE Intel Core i9-14900K 3.2GHz
NVIDIA GeForce RTX 3090
min:
95 fps, P0.1:
139 fps, P1:
164 fps, max:
314 fps
~ 159 fps
85%
NVIDIA GeForce RTX 3080:
122 [X] AMD Ryzen 9 5900X 3.7GHz
NVIDIA GeForce RTX 3080
min:
51.47 fps, P1:
84.82 fps, max:
204.8 fps
147 [X] AMD Ryzen 9 5900X 3.7GHz
NVIDIA GeForce RTX 3080
min:
46.65 fps, P1:
103.31 fps, max:
214.95 fps
~ 135 fps
100%
NVIDIA GeForce RTX 3090:
127 [X] AMD Ryzen 9 5900X 3.7GHz
NVIDIA GeForce RTX 3090
min:
72.64 fps, P1:
93.43 fps, max:
188.24 fps
131 [X] AMD Ryzen 9 5900X 3.7GHz
NVIDIA GeForce RTX 3090
min:
14.51 fps, P1:
91.89 fps, max:
193.79 fps
206 [X] Nvidia GeForce RTX 3090 FE Intel Core i9-14900K 3.2GHz
NVIDIA GeForce RTX 3090
min:
124 fps, P0.1:
138 fps, P1:
151 fps, max:
329 fps
~ 155 fps
86%
NVIDIA GeForce RTX 3080:
121 [X] AMD Ryzen 9 5900X 3.7GHz
NVIDIA GeForce RTX 3080
min:
60.95 fps, P1:
86.21 fps, max:
189.77 fps
146 [X] AMD Ryzen 9 5900X 3.7GHz
NVIDIA GeForce RTX 3080
min:
42.48 fps, P1:
108.89 fps, max:
214.05 fps
~ 134 fps
100%
NVIDIA GeForce RTX 3090:
111 [X] AMD Ryzen 9 5900X 3.7GHz
NVIDIA GeForce RTX 3090
min:
44.66 fps, P1:
83.58 fps, max:
163.27 fps
120 [X] AMD Ryzen 9 5900X 3.7GHz
NVIDIA GeForce RTX 3090
min:
47.71 fps, P1:
85.91 fps, max:
182.47 fps
186 [X] Nvidia GeForce RTX 3090 FE Intel Core i9-14900K 3.2GHz
NVIDIA GeForce RTX 3090
min:
87 fps, P0.1:
135 fps, P1:
146 fps, max:
282 fps
~ 139 fps
86%
NVIDIA GeForce RTX 3080:
113 [X] AMD Ryzen 9 5900X 3.7GHz
NVIDIA GeForce RTX 3080
min:
41.54 fps, P1:
82.63 fps, max:
184.04 fps
125 [X] AMD Ryzen 9 5900X 3.7GHz
NVIDIA GeForce RTX 3080
min:
52.74 fps, P1:
95.81 fps, max:
178.52 fps
~ 119 fps
100%
NVIDIA GeForce RTX 3090:
103 [X] AMD Ryzen 9 5900X 3.7GHz
NVIDIA GeForce RTX 3090
min:
30.26 fps, P1:
75.96 fps, max:
155.81 fps
107 [X] AMD Ryzen 9 5900X 3.7GHz
NVIDIA GeForce RTX 3090
min:
24.35 fps, P1:
77.46 fps, max:
174.03 fps
134 [X] Nvidia GeForce RTX 3090 FE Intel Core i9-14900K 3.2GHz
NVIDIA GeForce RTX 3090
min:
25 fps, P0.1:
102 fps, P1:
110 fps, max:
212 fps
~ 115 fps
84%
NVIDIA GeForce RTX 3080 Ti:
97 fps
88%
NVIDIA GeForce RTX 3080:
99.3 [X] AMD Ryzen 9 5900X 3.7GHz
NVIDIA GeForce RTX 3080
min:
13.98 fps, P1:
73.29 fps, max:
167.32 fps
103 [X] AMD Ryzen 9 5900X 3.7GHz
NVIDIA GeForce RTX 3080
min:
55.63 fps, P1:
83.65 fps, max:
156.57 fps
~ 101 fps
100%
NVIDIA GeForce RTX 3090:
88.3 [X] AMD Ryzen 9 5900X 3.7GHz
NVIDIA GeForce RTX 3090
min:
48.36 fps, P1:
68.18 fps, max:
160.5 fps
89.7 [X] AMD Ryzen 9 5900X 3.7GHz
NVIDIA GeForce RTX 3090
min:
59.87 fps, P1:
73.02 fps, max:
132.92 fps
103 [X] Nvidia GeForce RTX 3090 FE Intel Core i9-14900K 3.2GHz
NVIDIA GeForce RTX 3090
min:
45 fps, P0.1:
76 fps, P1:
87 fps, max:
212 fps
~ 94 fps
94%
NVIDIA GeForce RTX 3080 Ti:
88.5 fps
86%
NVIDIA GeForce RTX 3080:
81.1 [X] AMD Ryzen 9 5900X 3.7GHz
NVIDIA GeForce RTX 3080
min:
46.24 fps, P1:
61.45 fps, max:
140.66 fps
81.6 [X] AMD Ryzen 9 5900X 3.7GHz
NVIDIA GeForce RTX 3080
min:
44.31 fps, P1:
65.35 fps, max:
139.28 fps
~ 81 fps
100%
NVIDIA GeForce RTX 3090:
57.6 [X] AMD Ryzen 9 5900X 3.7GHz
NVIDIA GeForce RTX 3090
min:
24.58 fps, P1:
45.93 fps, max:
114.36 fps
60.3 [X] AMD Ryzen 9 5900X 3.7GHz
NVIDIA GeForce RTX 3090
min:
34.68 fps, P1:
51.05 fps, max:
78.14 fps
64 [X] Nvidia GeForce RTX 3090 FE Intel Core i9-14900K 3.2GHz
NVIDIA GeForce RTX 3090
min:
36 fps, P0.1:
44 fps, P1:
54 fps, max:
160 fps
~ 61 fps
96%
NVIDIA GeForce RTX 3080 Ti:
58.7 fps
89%
NVIDIA GeForce RTX 3080:
53.5 [X] AMD Ryzen 9 5900X 3.7GHz
NVIDIA GeForce RTX 3080
min:
33.98 fps, P1:
42.85 fps, max:
79.6 fps
54.1 [X] AMD Ryzen 9 5900X 3.7GHz
NVIDIA GeForce RTX 3080
min:
24.72 fps, P1:
44.97 fps, max:
114.7 fps
~ 54 fps
100%
NVIDIA GeForce RTX 3090:
202 [X] AMD Ryzen 9 5900X 3.7GHz
NVIDIA GeForce RTX 3090
min:
9.53 fps, P0.1:
88.1 fps, P1:
127 fps, max:
328 fps
212 [X] AMD Ryzen 9 5900X 3.7GHz
NVIDIA GeForce RTX 3090
~ 207 fps
115%
NVIDIA GeForce RTX 3080:
170 [X] AMD Ryzen 9 5900X 3.7GHz
NVIDIA GeForce RTX 3080
min:
8.9 fps, P0.1:
68.1 fps, P1:
93.1 fps, max:
332 fps
306 [X] AMD Ryzen 9 5900X 3.7GHz
NVIDIA GeForce RTX 3080
min:
24 fps, P0.1:
82.6 fps, P1:
124 fps, max:
468 fps
~ 238 fps
100%
NVIDIA GeForce RTX 3090:
194 [X] AMD Ryzen 9 5900X 3.7GHz
NVIDIA GeForce RTX 3090
min:
16.3 fps, P0.1:
75.8 fps, P1:
122 fps, max:
295 fps
206.5 [X] AMD Ryzen 9 5900X 3.7GHz
NVIDIA GeForce RTX 3090
~ 200 fps
124%
NVIDIA GeForce RTX 3080:
184 [X] AMD Ryzen 9 5900X 3.7GHz
NVIDIA GeForce RTX 3080
min:
65.1 fps, P0.1:
77 fps, P1:
105 fps, max:
316 fps
312 [X] AMD Ryzen 9 5900X 3.7GHz
NVIDIA GeForce RTX 3080
min:
58.7 fps, P0.1:
82.5 fps, P1:
129 fps, max:
492 fps
~ 248 fps
100%
NVIDIA GeForce RTX 3090:
195 [X] AMD Ryzen 9 5900X 3.7GHz
NVIDIA GeForce RTX 3090
min:
36.8 fps, P0.1:
71.9 fps, P1:
122 fps, max:
320 fps
202.4 [X] AMD Ryzen 9 5900X 3.7GHz
NVIDIA GeForce RTX 3090
~ 199 fps
120%
NVIDIA GeForce RTX 3080:
182 [X] AMD Ryzen 9 5900X 3.7GHz
NVIDIA GeForce RTX 3080
min:
45.5 fps, P0.1:
77.4 fps, P1:
106 fps, max:
297 fps
293 [X] AMD Ryzen 9 5900X 3.7GHz
NVIDIA GeForce RTX 3080
min:
60.7 fps, P0.1:
83.3 fps, P1:
123 fps, max:
443 fps
~ 238 fps
100%
NVIDIA GeForce RTX 3090:
199.9 [X] AMD Ryzen 9 5900X 3.7GHz
NVIDIA GeForce RTX 3090
202 [X] AMD Ryzen 9 5900X 3.7GHz
NVIDIA GeForce RTX 3090
min:
26.3 fps, P0.1:
82.3 fps, P1:
126 fps, max:
304 fps
~ 201 fps
118%
NVIDIA GeForce RTX 3080:
181 [X] AMD Ryzen 9 5900X 3.7GHz
NVIDIA GeForce RTX 3080
min:
37.1 fps, P0.1:
72.7 fps, P1:
107 fps, max:
299 fps
295 [X] AMD Ryzen 9 5900X 3.7GHz
NVIDIA GeForce RTX 3080
min:
53.7 fps, P0.1:
79.1 fps, P1:
127 fps, max:
450 fps
~ 238 fps
100%
NVIDIA GeForce RTX 3090:
199.9 [X] AMD Ryzen 9 5900X 3.7GHz
NVIDIA GeForce RTX 3090
207 [X] AMD Ryzen 9 5900X 3.7GHz
NVIDIA GeForce RTX 3090
min:
69.5 fps, P0.1:
91.8 fps, P1:
137 fps, max:
303 fps
~ 203 fps
122%
NVIDIA GeForce RTX 3080:
199 [X] AMD Ryzen 9 5900X 3.7GHz
NVIDIA GeForce RTX 3080
min:
50.7 fps, P0.1:
87.6 fps, P1:
126 fps, max:
326 fps
295 [X] AMD Ryzen 9 5900X 3.7GHz
NVIDIA GeForce RTX 3080
min:
67.5 fps, P0.1:
87.1 fps, P1:
129 fps, max:
431 fps
~ 247 fps
100%
NVIDIA GeForce RTX 3090:
203.3 [X] AMD Ryzen 9 5900X 3.7GHz
NVIDIA GeForce RTX 3090
213 [X] AMD Ryzen 9 5900X 3.7GHz
NVIDIA GeForce RTX 3090
min:
50 fps, P0.1:
92.3 fps, P1:
136 fps, max:
333 fps
~ 208 fps
115%
NVIDIA GeForce RTX 3080:
195 [X] AMD Ryzen 9 5900X 3.7GHz
NVIDIA GeForce RTX 3080
min:
32.1 fps, P0.1:
87 fps, P1:
119 fps, max:
334 fps
284 [X] AMD Ryzen 9 5900X 3.7GHz
NVIDIA GeForce RTX 3080
min:
60.3 fps, P0.1:
83.9 fps, P1:
127 fps, max:
422 fps
~ 240 fps
100%
NVIDIA GeForce RTX 3090:
448 [X] AMD Ryzen 9 5900X 3.7GHz
NVIDIA GeForce RTX 3090
454 [X] AMD Ryzen 9 5900X 3.7GHz
NVIDIA GeForce RTX 3090
min:
26.3 fps, P0.1:
231 fps, P1:
300 fps, max:
659 fps
~ 451 fps
105%
NVIDIA GeForce RTX 3080:
360 [X] AMD Ryzen 9 5900X 3.7GHz
NVIDIA GeForce RTX 3080
min:
32.6 fps, P0.1:
174 fps, P1:
220 fps, max:
592 fps
586 [X] AMD Ryzen 9 5900X 3.7GHz
NVIDIA GeForce RTX 3080
min:
55 fps, P0.1:
221 fps, P1:
383 fps, max:
886 fps
~ 473 fps
100%
NVIDIA GeForce RTX 3090:
412.3 [X] AMD Ryzen 9 5900X 3.7GHz
NVIDIA GeForce RTX 3090
419 [X] AMD Ryzen 9 5900X 3.7GHz
NVIDIA GeForce RTX 3090
min:
88.2 fps, P0.1:
226 fps, P1:
293 fps, max:
601 fps
~ 416 fps
99%
NVIDIA GeForce RTX 3080:
392 [X] AMD Ryzen 9 5900X 3.7GHz
NVIDIA GeForce RTX 3080
min:
107 fps, P0.1:
177 fps, P1:
222 fps, max:
666 fps
433 [X] AMD Ryzen 9 5900X 3.7GHz
NVIDIA GeForce RTX 3080
min:
137 fps, P0.1:
314 fps, P1:
347 fps, max:
624 fps
~ 413 fps
100%
NVIDIA GeForce RTX 3090:
397.8 [X] AMD Ryzen 9 5900X 3.7GHz
NVIDIA GeForce RTX 3090
403 [X] AMD Ryzen 9 5900X 3.7GHz
NVIDIA GeForce RTX 3090
min:
86.8 fps, P0.1:
228 fps, P1:
302 fps, max:
578 fps
~ 400 fps
93%
NVIDIA GeForce RTX 3080:
362 [X] AMD Ryzen 9 5900X 3.7GHz
NVIDIA GeForce RTX 3080
min:
74.4 fps, P0.1:
187 fps, P1:
253 fps, max:
539 fps
379 [X] AMD Ryzen 9 5900X 3.7GHz
NVIDIA GeForce RTX 3080
min:
83.9 fps, P0.1:
281 fps, P1:
307 fps, max:
527 fps
~ 371 fps
100%
NVIDIA GeForce RTX 3090:
384.2 [X] AMD Ryzen 9 5900X 3.7GHz
NVIDIA GeForce RTX 3090
389 [X] AMD Ryzen 9 5900X 3.7GHz
NVIDIA GeForce RTX 3090
min:
113 fps, P0.1:
229 fps, P1:
288 fps, max:
547 fps
~ 387 fps
93%
NVIDIA GeForce RTX 3080:
358 [X] AMD Ryzen 9 5900X 3.7GHz
NVIDIA GeForce RTX 3080
min:
50.8 fps, P0.1:
268 fps, P1:
289 fps, max:
514 fps
362 [X] AMD Ryzen 9 5900X 3.7GHz
NVIDIA GeForce RTX 3080
min:
108 fps, P0.1:
215 fps, P1:
271 fps, max:
523 fps
~ 360 fps
100%
NVIDIA GeForce RTX 3090:
297.2 [X] AMD Ryzen 9 5900X 3.7GHz
NVIDIA GeForce RTX 3090
305 [X] AMD Ryzen 9 5900X 3.7GHz
NVIDIA GeForce RTX 3090
min:
148 fps, P0.1:
211 fps, P1:
234 fps, max:
480 fps
~ 301 fps
90%
NVIDIA GeForce RTX 3080:
266 [X] AMD Ryzen 9 5900X 3.7GHz
NVIDIA GeForce RTX 3080
min:
79.6 fps, P0.1:
211 fps, P1:
226 fps, max:
588 fps
274 [X] AMD Ryzen 9 5900X 3.7GHz
NVIDIA GeForce RTX 3080
min:
109 fps, P0.1:
186 fps, P1:
216 fps, max:
447 fps
~ 270 fps
100%
NVIDIA GeForce RTX 3090:
188.3 [X] AMD Ryzen 9 5900X 3.7GHz
NVIDIA GeForce RTX 3090
197 [X] AMD Ryzen 9 5900X 3.7GHz
NVIDIA GeForce RTX 3090
min:
140 fps, P0.1:
150 fps, P1:
161 fps, max:
258 fps
~ 193 fps
89%
NVIDIA GeForce RTX 3080:
169 [X] AMD Ryzen 9 5900X 3.7GHz
NVIDIA GeForce RTX 3080
min:
101 fps, P0.1:
138 fps, P1:
144 fps, max:
433 fps
175 [X] AMD Ryzen 9 5900X 3.7GHz
NVIDIA GeForce RTX 3080
min:
90.5 fps, P0.1:
139 fps, P1:
147 fps, max:
212 fps
~ 172 fps
100%
NVIDIA GeForce RTX 3090:
180 [X] AMD Ryzen 9 5900X 3.7GHz
NVIDIA GeForce RTX 3090
min:
68.2 fps, P0.1:
83.1 fps, P1:
115 fps, max:
349 fps
188.4 [X] AMD Ryzen 9 5900X 3.7GHz
NVIDIA GeForce RTX 3090
~ 184 fps
104%
NVIDIA GeForce RTX 3080:
182 [X] AMD Ryzen 9 5900X 3.7GHz
NVIDIA GeForce RTX 3080
min:
45.5 fps, P0.1:
86 fps, P1:
118 fps, max:
318 fps
199 [X] AMD Ryzen 9 5900X 3.7GHz
NVIDIA GeForce RTX 3080
min:
32.7 fps, P0.1:
82.7 fps, P1:
134 fps, max:
388 fps
~ 191 fps
100%
NVIDIA GeForce RTX 3090:
161 [X] AMD Ryzen 9 5900X 3.7GHz
NVIDIA GeForce RTX 3090
min:
55.2 fps, P0.1:
75.7 fps, P1:
104 fps, max:
307 fps
163.6 [X] AMD Ryzen 9 5900X 3.7GHz
NVIDIA GeForce RTX 3090
~ 162 fps
106%
NVIDIA GeForce RTX 3080:
159 [X] AMD Ryzen 9 5900X 3.7GHz
NVIDIA GeForce RTX 3080
min:
60.2 fps, P0.1:
70.6 fps, P1:
103 fps, max:
328 fps
184 [X] AMD Ryzen 9 5900X 3.7GHz
NVIDIA GeForce RTX 3080
min:
35.3 fps, P0.1:
79.4 fps, P1:
119 fps, max:
345 fps
~ 172 fps
100%
NVIDIA GeForce RTX 3090:
157 [X] AMD Ryzen 9 5900X 3.7GHz
NVIDIA GeForce RTX 3090
min:
64.1 fps, P0.1:
76.8 fps, P1:
100 fps, max:
260 fps
158.8 [X] AMD Ryzen 9 5900X 3.7GHz
NVIDIA GeForce RTX 3090
~ 158 fps
103%
NVIDIA GeForce RTX 3080 Ti:
163 fps
99%
NVIDIA GeForce RTX 3080:
144 [X] AMD Ryzen 9 5900X 3.7GHz
NVIDIA GeForce RTX 3080
min:
59.7 fps, P0.1:
73.4 fps, P1:
93.2 fps, max:
295 fps
169 [X] AMD Ryzen 9 5900X 3.7GHz
NVIDIA GeForce RTX 3080
min:
32.7 fps, P0.1:
75.7 fps, P1:
112 fps, max:
361 fps
~ 157 fps
100%
NVIDIA GeForce RTX 3090:
142.3 [X] AMD Ryzen 9 5900X 3.7GHz
NVIDIA GeForce RTX 3090
149 [X] AMD Ryzen 9 5900X 3.7GHz
NVIDIA GeForce RTX 3090
min:
40.4 fps, P0.1:
77.6 fps, P1:
101 fps, max:
238 fps
~ 146 fps
97%
NVIDIA GeForce RTX 3080 Ti:
142 fps
90%
NVIDIA GeForce RTX 3080:
127 [X] AMD Ryzen 9 5900X 3.7GHz
NVIDIA GeForce RTX 3080
min:
47.5 fps, P0.1:
74.6 fps, P1:
89.7 fps, max:
194 fps
137 [X] AMD Ryzen 9 5900X 3.7GHz
NVIDIA GeForce RTX 3080
min:
26.5 fps, P0.1:
66.2 fps, P1:
95.7 fps, max:
265 fps
~ 132 fps
100%
NVIDIA GeForce RTX 3090:
84.5 [X] AMD Ryzen 9 5900X 3.7GHz
NVIDIA GeForce RTX 3090
89.1 [X] AMD Ryzen 9 5900X 3.7GHz
NVIDIA GeForce RTX 3090
min:
42.7 fps, P0.1:
53.9 fps, P1:
62.7 fps, max:
175 fps
~ 87 fps
100%
NVIDIA GeForce RTX 3080 Ti:
86.6 fps
90%
NVIDIA GeForce RTX 3080:
78.1 [X] AMD Ryzen 9 5900X 3.7GHz
NVIDIA GeForce RTX 3080
min:
44.8 fps, P0.1:
50.5 fps, P1:
54.7 fps, max:
175 fps
78.2 [X] AMD Ryzen 9 5900X 3.7GHz
NVIDIA GeForce RTX 3080
min:
17.9 fps, P0.1:
31 fps, P1:
59.3 fps, max:
292 fps
~ 78 fps
100%
NVIDIA GeForce RTX 3090:
138.7 [X] AMD Ryzen 9 5900X 3.7GHz
NVIDIA GeForce RTX 3090
175.1 [X] AMD Ryzen 9 5900X 3.7GHz
NVIDIA GeForce RTX 3090
~ 157 fps
110%
NVIDIA GeForce RTX 3080:
161 [X] AMD Ryzen 9 5900X 3.7GHz
NVIDIA GeForce RTX 3080
182.5 [X] AMD Ryzen 9 5900X 3.7GHz
NVIDIA GeForce RTX 3080
~ 172 fps
100%
NVIDIA GeForce RTX 3090:
129.8 [X] AMD Ryzen 9 5900X 3.7GHz
NVIDIA GeForce RTX 3090
130.4 [X] AMD Ryzen 9 5900X 3.7GHz
NVIDIA GeForce RTX 3090
~ 130 fps
105%
NVIDIA GeForce RTX 3080:
125.2 [X] AMD Ryzen 9 5900X 3.7GHz
NVIDIA GeForce RTX 3080
148.6 [X] AMD Ryzen 9 5900X 3.7GHz
NVIDIA GeForce RTX 3080
~ 137 fps
100%
NVIDIA GeForce RTX 3090:
121.4 [X] AMD Ryzen 9 5900X 3.7GHz
NVIDIA GeForce RTX 3090
125.3 [X] AMD Ryzen 9 5900X 3.7GHz
NVIDIA GeForce RTX 3090
~ 123 fps
106%
NVIDIA GeForce RTX 3080:
121.7 [X] AMD Ryzen 9 5900X 3.7GHz
NVIDIA GeForce RTX 3080
138.1 [X] AMD Ryzen 9 5900X 3.7GHz
NVIDIA GeForce RTX 3080
~ 130 fps
100%
NVIDIA GeForce RTX 3090:
115.2 [X] AMD Ryzen 9 5900X 3.7GHz
NVIDIA GeForce RTX 3090
121.3 [X] AMD Ryzen 9 5900X 3.7GHz
NVIDIA GeForce RTX 3090
~ 118 fps
106%
NVIDIA GeForce RTX 3080:
114.3 [X] AMD Ryzen 9 5900X 3.7GHz
NVIDIA GeForce RTX 3080
135.2 [X] AMD Ryzen 9 5900X 3.7GHz
NVIDIA GeForce RTX 3080
~ 125 fps
100%
NVIDIA GeForce RTX 3090:
113.5 [X] AMD Ryzen 9 5900X 3.7GHz
NVIDIA GeForce RTX 3090
118.4 [X] AMD Ryzen 9 5900X 3.7GHz
NVIDIA GeForce RTX 3090
~ 116 fps
103%
NVIDIA GeForce RTX 3080:
112.8 [X] AMD Ryzen 9 5900X 3.7GHz
NVIDIA GeForce RTX 3080
124.8 [X] AMD Ryzen 9 5900X 3.7GHz
NVIDIA GeForce RTX 3080
~ 119 fps
100%
NVIDIA GeForce RTX 3090:
97.4 [X] AMD Ryzen 9 5900X 3.7GHz
NVIDIA GeForce RTX 3090
115.1 [X] AMD Ryzen 9 5900X 3.7GHz
NVIDIA GeForce RTX 3090
~ 106 fps
108%
NVIDIA GeForce RTX 3080:
112.7 [X] AMD Ryzen 9 5900X 3.7GHz
NVIDIA GeForce RTX 3080
117 [X] AMD Ryzen 9 5900X 3.7GHz
NVIDIA GeForce RTX 3080
~ 115 fps
100%
NVIDIA GeForce RTX 3090:
233.3 [X] AMD Ryzen 9 5900X 3.7GHz
NVIDIA GeForce RTX 3090
266 [X] AMD Ryzen 9 5900X 3.7GHz
NVIDIA GeForce RTX 3090
min:
58.6 fps, P0.1:
106 fps, P1:
169 fps, max:
495 fps
~ 250 fps
91%
NVIDIA GeForce RTX 3080:
227 [X] AMD Ryzen 9 5900X 3.7GHz
NVIDIA GeForce RTX 3080
min:
60.8 fps, P0.1:
81.9 fps, P1:
140 fps, max:
500 fps
fps
100%
NVIDIA GeForce RTX 3090:
209 [X] AMD Ryzen 9 5900X 3.7GHz
NVIDIA GeForce RTX 3090
min:
81 fps, P0.1:
118 fps, P1:
137 fps, max:
435 fps
222.4 [X] AMD Ryzen 9 5900X 3.7GHz
NVIDIA GeForce RTX 3090
~ 216 fps
73%
NVIDIA GeForce RTX 3080:
157 [X] AMD Ryzen 9 5900X 3.7GHz
NVIDIA GeForce RTX 3080
min:
39.4 fps, P0.1:
82.3 fps, P1:
103 fps, max:
300 fps
fps
100%
NVIDIA GeForce RTX 3090:
130 [X] AMD Ryzen 9 5900X 3.7GHz
NVIDIA GeForce RTX 3090
min:
41.5 fps, P0.1:
60.8 fps, P1:
73.6 fps, max:
262 fps
220.6 [X] AMD Ryzen 9 5900X 3.7GHz
NVIDIA GeForce RTX 3090
~ 175 fps
57%
NVIDIA GeForce RTX 3080:
98.9 [X] AMD Ryzen 9 5900X 3.7GHz
NVIDIA GeForce RTX 3080
min:
41.2 fps, P0.1:
48.7 fps, P1:
59 fps, max:
216 fps
fps
100%
NVIDIA GeForce RTX 3090:
97.1 [X] AMD Ryzen 9 5900X 3.7GHz
NVIDIA GeForce RTX 3090
102 [X] AMD Ryzen 9 5900X 3.7GHz
NVIDIA GeForce RTX 3090
min:
50.2 fps, P0.1:
53.2 fps, P1:
66.9 fps, max:
213 fps
~ 100 fps
62%
NVIDIA GeForce RTX 3080:
62.1 [X] AMD Ryzen 9 5900X 3.7GHz
NVIDIA GeForce RTX 3080
min:
41.5 fps, P0.1:
41.8 fps, P1:
44.5 fps, max:
113 fps
fps
100%
NVIDIA GeForce RTX 3090:
82.6 [X] AMD Ryzen 9 5900X 3.7GHz
NVIDIA GeForce RTX 3090
86.7 [X] AMD Ryzen 9 5900X 3.7GHz
NVIDIA GeForce RTX 3090
min:
51.5 fps, P0.1:
52.9 fps, P1:
60.8 fps, max:
128 fps
~ 85 fps
70%
NVIDIA GeForce RTX 3080:
59.9 [X] AMD Ryzen 9 5900X 3.7GHz
NVIDIA GeForce RTX 3080
min:
39.3 fps, P0.1:
40.1 fps, P1:
43.5 fps, max:
107 fps
fps
100%
NVIDIA GeForce RTX 3090:
60.5 [X] AMD Ryzen 9 5900X 3.7GHz
NVIDIA GeForce RTX 3090
64.9 [X] AMD Ryzen 9 5900X 3.7GHz
NVIDIA GeForce RTX 3090
min:
44.8 fps, P0.1:
49.4 fps, P1:
54.6 fps, max:
96.2 fps
~ 63 fps
78%
NVIDIA GeForce RTX 3080:
49.2 [X] AMD Ryzen 9 5900X 3.7GHz
NVIDIA GeForce RTX 3080
min:
36 fps, P0.1:
36.9 fps, P1:
39 fps, max:
61.3 fps
fps
NVIDIA GeForce RTX 3080:
115 [X] AMD Ryzen 9 5900X 3.7GHz
NVIDIA GeForce RTX 3080
min:
7.09 fps, P0.1:
43.4 fps, P1:
81.7 fps, max:
141 fps
fps
NVIDIA GeForce RTX 3080:
97.4 [X] AMD Ryzen 9 5900X 3.7GHz
NVIDIA GeForce RTX 3080
min:
8.65 fps, P0.1:
39.1 fps, P1:
67.1 fps, max:
121 fps
fps
NVIDIA GeForce RTX 3080:
79.9 [X] AMD Ryzen 9 5900X 3.7GHz
NVIDIA GeForce RTX 3080
min:
9.96 fps, P0.1:
35.5 fps, P1:
59 fps, max:
98.4 fps
fps
NVIDIA GeForce RTX 3080:
62.8 [X] AMD Ryzen 9 5900X 3.7GHz
NVIDIA GeForce RTX 3080
min:
6.79 fps, P0.1:
32.1 fps, P1:
50 fps, max:
76.3 fps
fps
NVIDIA GeForce RTX 3080:
55.6 [X] AMD Ryzen 9 5900X 3.7GHz
NVIDIA GeForce RTX 3080
min:
6.88 fps, P0.1:
30.7 fps, P1:
44.2 fps, max:
68.6 fps
fps
NVIDIA GeForce RTX 3080:
37.3 [X] AMD Ryzen 9 5900X 3.7GHz
NVIDIA GeForce RTX 3080
min:
10.6 fps, P0.1:
19.7 fps, P1:
31 fps, max:
59.8 fps
fps
100%
NVIDIA GeForce RTX 3090:
203 [X] AMD Ryzen 9 5900X 3.7GHz
NVIDIA GeForce RTX 3090
min:
38 fps, max:
359 fps
206 [X] AMD Ryzen 9 5900X 3.7GHz
NVIDIA GeForce RTX 3090
~ 205 fps
88%
NVIDIA GeForce RTX 3080:
164 [X] AMD Ryzen 9 5900X 3.7GHz
NVIDIA GeForce RTX 3080
198 [X] AMD Ryzen 9 5900X 3.7GHz
NVIDIA GeForce RTX 3080
min:
79 fps, max:
347 fps
~ 181 fps
100%
NVIDIA GeForce RTX 3090:
158 191 [X] AMD Ryzen 9 5900X 3.7GHz
NVIDIA GeForce RTX 3090
196 [X] AMD Ryzen 9 5900X 3.7GHz
NVIDIA GeForce RTX 3090
min:
24 fps, max:
348 fps
~ 182 fps
91%
NVIDIA GeForce RTX 3080:
151 [X] AMD Ryzen 9 5900X 3.7GHz
NVIDIA GeForce RTX 3080
180 [X] AMD Ryzen 9 5900X 3.7GHz
NVIDIA GeForce RTX 3080
min:
5 fps, max:
321 fps
~ 166 fps
100%
NVIDIA GeForce RTX 3090:
147 175 [X] AMD Ryzen 9 5900X 3.7GHz
NVIDIA GeForce RTX 3090
181 [X] AMD Ryzen 9 5900X 3.7GHz
NVIDIA GeForce RTX 3090
min:
53 fps, max:
295 fps
~ 168 fps
93%
NVIDIA GeForce RTX 3080:
147 [X] AMD Ryzen 9 5900X 3.7GHz
NVIDIA GeForce RTX 3080
164 [X] AMD Ryzen 9 5900X 3.7GHz
NVIDIA GeForce RTX 3080
min:
45 fps, max:
274 fps
~ 156 fps
100%
NVIDIA GeForce RTX 3090:
138 159 [X] AMD Ryzen 9 5900X 3.7GHz
NVIDIA GeForce RTX 3090
166 [X] AMD Ryzen 9 5900X 3.7GHz
NVIDIA GeForce RTX 3090
min:
75 fps, max:
277 fps
~ 154 fps
93%
NVIDIA GeForce RTX 3080:
141 [X] AMD Ryzen 9 5900X 3.7GHz
NVIDIA GeForce RTX 3080
144 [X] AMD Ryzen 9 5900X 3.7GHz
NVIDIA GeForce RTX 3080
min:
44 fps, max:
263 fps
~ 143 fps
100%
NVIDIA GeForce RTX 3090:
126 141 [X] AMD Ryzen 9 5900X 3.7GHz
NVIDIA GeForce RTX 3090
148 [X] AMD Ryzen 9 5900X 3.7GHz
NVIDIA GeForce RTX 3090
min:
73 fps, max:
256 fps
~ 138 fps
95%
NVIDIA GeForce RTX 3080:
128 [X] AMD Ryzen 9 5900X 3.7GHz
NVIDIA GeForce RTX 3080
min:
69 fps, max:
227 fps
133 [X] AMD Ryzen 9 5900X 3.7GHz
NVIDIA GeForce RTX 3080
~ 131 fps
100%
NVIDIA GeForce RTX 3090:
82 89 [X] AMD Ryzen 9 5900X 3.7GHz
NVIDIA GeForce RTX 3090
95 [X] AMD Ryzen 9 5900X 3.7GHz
NVIDIA GeForce RTX 3090
min:
19 fps, max:
156 fps
~ 89 fps
100%
NVIDIA GeForce RTX 3080:
82 [X] AMD Ryzen 9 5900X 3.7GHz
NVIDIA GeForce RTX 3080
min:
52 fps, max:
158 fps
95 [X] AMD Ryzen 9 5900X 3.7GHz
NVIDIA GeForce RTX 3080
~ 89 fps
100%
NVIDIA GeForce RTX 3090:
206.1 [X] AMD Ryzen 9 5900X 3.7GHz
NVIDIA GeForce RTX 3090
209 [X] AMD Ryzen 9 5900X 3.7GHz
NVIDIA GeForce RTX 3090
min:
112 fps, P0.1:
125 fps, P1:
155 fps, max:
304 fps
~ 208 fps
112%
NVIDIA GeForce RTX 3080:
232 [X] AMD Ryzen 9 5900X 3.7GHz
NVIDIA GeForce RTX 3080
min:
29.2 fps, P0.1:
145 fps, P1:
186 fps, max:
308 fps
fps
100%
NVIDIA GeForce RTX 3090:
184 193.2 [X] AMD Ryzen 9 5900X 3.7GHz
NVIDIA GeForce RTX 3090
207 [X] AMD Ryzen 9 5900X 3.7GHz
NVIDIA GeForce RTX 3090
min:
125 fps, P0.1:
132 fps, P1:
160 fps, max:
274 fps
~ 195 fps
112%
NVIDIA GeForce RTX 3080:
219 [X] AMD Ryzen 9 5900X 3.7GHz
NVIDIA GeForce RTX 3080
min:
142 fps, P0.1:
160 fps, P1:
181 fps, max:
314 fps
fps
100%
NVIDIA GeForce RTX 3090:
178 188.6 [X] AMD Ryzen 9 5900X 3.7GHz
NVIDIA GeForce RTX 3090
203 [X] AMD Ryzen 9 5900X 3.7GHz
NVIDIA GeForce RTX 3090
min:
68.9 fps, P0.1:
145 fps, P1:
164 fps, max:
298 fps
~ 190 fps
109%
NVIDIA GeForce RTX 3080:
208 [X] AMD Ryzen 9 5900X 3.7GHz
NVIDIA GeForce RTX 3080
min:
78.4 fps, P0.1:
149 fps, P1:
168 fps, max:
297 fps
fps
100%
NVIDIA GeForce RTX 3090:
173 188.1 [X] AMD Ryzen 9 5900X 3.7GHz
NVIDIA GeForce RTX 3090
210 [X] AMD Ryzen 9 5900X 3.7GHz
NVIDIA GeForce RTX 3090
min:
126 fps, P0.1:
142 fps, P1:
167 fps, max:
290 fps
~ 190 fps
106%
NVIDIA GeForce RTX 3080:
202 [X] AMD Ryzen 9 5900X 3.7GHz
NVIDIA GeForce RTX 3080
min:
133 fps, P0.1:
151 fps, P1:
165 fps, max:
290 fps
fps
100%
NVIDIA GeForce RTX 3090:
107 140.9 [X] AMD Ryzen 9 5900X 3.7GHz
NVIDIA GeForce RTX 3090
176 [X] AMD Ryzen 9 5900X 3.7GHz
NVIDIA GeForce RTX 3090
min:
120 fps, P0.1:
132 fps, P1:
142 fps, max:
264 fps
~ 141 fps
116%
NVIDIA GeForce RTX 3080:
163 [X] AMD Ryzen 9 5900X 3.7GHz
NVIDIA GeForce RTX 3080
min:
112 fps, P0.1:
121 fps, P1:
134 fps, max:
252 fps
fps
100%
NVIDIA GeForce RTX 3090:
110 [X] AMD Ryzen 9 5900X 3.7GHz
NVIDIA GeForce RTX 3090
min:
80.9 fps, P0.1:
86.9 fps, P1:
98.2 fps, max:
157 fps
131 [X] AMD Ryzen 9 5900X 3.7GHz
NVIDIA GeForce RTX 3090
164 ~ 135 fps
73%
NVIDIA GeForce RTX 3080:
98.7 [X] AMD Ryzen 9 5900X 3.7GHz
NVIDIA GeForce RTX 3080
min:
76.9 fps, P0.1:
81.1 fps, P1:
88.7 fps, max:
127 fps
fps
100%
NVIDIA GeForce RTX 3090:
327 [X] 759689
Intel Core i5-13400F 2.5GHz
NVIDIA GeForce RTX 3090
min:
278 fps, max:
362 fps
379 [X] AMD Ryzen 9 5900X 3.7GHz
NVIDIA GeForce RTX 3090
min:
297 fps, max:
414 fps
386 [X] 704326
AMD Ryzen 9 5900X 3.7GHz
NVIDIA GeForce RTX 3090
min:
300 fps, max:
421 fps
456 [X] 759689
Intel Core i5-13600K 3.5GHz
NVIDIA GeForce RTX 3090
min:
360 fps, max:
503 fps
487 [X] 759689
AMD Ryzen 9 7900X 4.7GHz
NVIDIA GeForce RTX 3090
min:
372 fps, max:
539 fps
515 [X] 759689
Intel Core i9-13900K 3GHz
NVIDIA GeForce RTX 3090
min:
409 fps, max:
585 fps
554 [X] Nvidia GeForce RTX 3090 FE 759689
AMD Ryzen 9 7950X 4.5GHz
NVIDIA GeForce RTX 3090
min:
430 fps, max:
611 fps
587 [X] 759689
AMD Ryzen 5 7600X 4.7GHz
NVIDIA GeForce RTX 3090
min:
437 fps, max:
653 fps
593 [X] NVIDIA GeForce RTX 3090 Founders Edition 759689
AMD Ryzen 9 7950X 4.5GHz
NVIDIA GeForce RTX 3090
min:
454 fps, max:
657 fps
~ 476 fps
109%
NVIDIA GeForce RTX 3080 Ti:
478 [X] Corsair One i300 759689
Intel Core i9-12900K 3.2GHz
NVIDIA GeForce RTX 3080 Ti
min:
380 fps, max:
541 fps
520 553 [X] 759689
AMD Ryzen 9 7950X 4.5GHz
NVIDIA GeForce RTX 3080 Ti
min:
426 fps, max:
613 fps
~ 517 fps
72%
NVIDIA GeForce RTX 3080:
321 [X] 692646
AMD Ryzen 9 5900X 3.7GHz
NVIDIA GeForce RTX 3080
min:
250 fps, max:
352 fps
367 [X] 692646
AMD Ryzen 9 5900X 3.7GHz
NVIDIA GeForce RTX 3080
min:
271 fps, max:
409 fps
~ 344 fps
100%
NVIDIA GeForce RTX 3090:
248 298 [X] 759689
Intel Core i5-13400F 2.5GHz
NVIDIA GeForce RTX 3090
min:
245 fps, max:
337 fps
320 [X] AMD Ryzen 9 5900X 3.7GHz
NVIDIA GeForce RTX 3090
min:
248 fps, max:
378 fps
336 [X] 704326
AMD Ryzen 9 5900X 3.7GHz
NVIDIA GeForce RTX 3090
min:
268 fps, max:
393 fps
383 [X] 759689
Intel Core i5-13600K 3.5GHz
NVIDIA GeForce RTX 3090
min:
312 fps, max:
448 fps
403 [X] 759689
AMD Ryzen 9 7900X 4.7GHz
NVIDIA GeForce RTX 3090
min:
298 fps, max:
477 fps
438 [X] 759689
Intel Core i9-13900K 3GHz
NVIDIA GeForce RTX 3090
min:
317 fps, max:
505 fps
460 [X] 759689
AMD Ryzen 5 7600X 4.7GHz
NVIDIA GeForce RTX 3090
min:
358 fps, max:
541 fps
473 [X] Nvidia GeForce RTX 3090 FE 759689
AMD Ryzen 9 7950X 4.5GHz
NVIDIA GeForce RTX 3090
min:
360 fps, max:
559 fps
485 [X] NVIDIA GeForce RTX 3090 Founders Edition 759689
AMD Ryzen 9 7950X 4.5GHz
NVIDIA GeForce RTX 3090
min:
395 fps, max:
563 fps
~ 384 fps
112%
NVIDIA GeForce RTX 3080 Ti:
379 [X] Corsair One i300 759689
Intel Core i9-12900K 3.2GHz
NVIDIA GeForce RTX 3080 Ti
min:
304 fps, max:
424 fps
448 463 [X] 759689
AMD Ryzen 9 7950X 4.5GHz
NVIDIA GeForce RTX 3080 Ti
min:
367 fps, max:
542 fps
~ 430 fps
71%
NVIDIA GeForce RTX 3080:
255 [X] 692646
AMD Ryzen 9 5900X 3.7GHz
NVIDIA GeForce RTX 3080
min:
193 fps, max:
294 fps
288 [X] 692646
AMD Ryzen 9 5900X 3.7GHz
NVIDIA GeForce RTX 3080
min:
217 fps, max:
336 fps
~ 272 fps
100%
NVIDIA GeForce RTX 3090:
245 294 [X] 759689
Intel Core i5-13400F 2.5GHz
NVIDIA GeForce RTX 3090
min:
244 fps, max:
328 fps
316 [X] AMD Ryzen 9 5900X 3.7GHz
NVIDIA GeForce RTX 3090
min:
249 fps, max:
358 fps
322 [X] 704326
AMD Ryzen 9 5900X 3.7GHz
NVIDIA GeForce RTX 3090
min:
262 fps, max:
365 fps
374 [X] 759689
AMD Ryzen 9 7900X 4.7GHz
NVIDIA GeForce RTX 3090
min:
299 fps, max:
436 fps
376 [X] 759689
Intel Core i5-13600K 3.5GHz
NVIDIA GeForce RTX 3090
min:
306 fps, max:
429 fps
407 [X] 759689
Intel Core i9-13900K 3GHz
NVIDIA GeForce RTX 3090
min:
322 fps, max:
460 fps
418 [X] 759689
AMD Ryzen 5 7600X 4.7GHz
NVIDIA GeForce RTX 3090
min:
355 fps, max:
479 fps
432 [X] NVIDIA GeForce RTX 3090 Founders Edition 759689
AMD Ryzen 9 7950X 4.5GHz
NVIDIA GeForce RTX 3090
min:
349 fps, max:
503 fps
433 [X] Nvidia GeForce RTX 3090 FE 759689
AMD Ryzen 9 7950X 4.5GHz
NVIDIA GeForce RTX 3090
min:
351 fps, max:
497 fps
~ 362 fps
115%
NVIDIA GeForce RTX 3080 Ti:
397 [X] Corsair One i300 759689
Intel Core i9-12900K 3.2GHz
NVIDIA GeForce RTX 3080 Ti
min:
319 fps, max:
445 fps
419 432 [X] 759689
AMD Ryzen 9 7950X 4.5GHz
NVIDIA GeForce RTX 3080 Ti
min:
348 fps, max:
488 fps
~ 416 fps
67%
NVIDIA GeForce RTX 3080:
239 [X] 692646
AMD Ryzen 9 5900X 3.7GHz
NVIDIA GeForce RTX 3080
min:
186 fps, max:
270 fps
249 [X] 692646
AMD Ryzen 9 5900X 3.7GHz
NVIDIA GeForce RTX 3080
min:
198 fps, max:
283 fps
~ 244 fps
100%
NVIDIA GeForce RTX 3090:
227 250 [X] AMD Ryzen 9 5900X 3.7GHz
NVIDIA GeForce RTX 3090
min:
214 fps, max:
304 fps
266 [X] 704326
AMD Ryzen 9 5900X 3.7GHz
NVIDIA GeForce RTX 3090
min:
218 fps, max:
321 fps
266 [X] 759689
Intel Core i5-13400F 2.5GHz
NVIDIA GeForce RTX 3090
min:
222 fps, max:
305 fps
270 [X] 759689
AMD Ryzen 9 7900X 4.7GHz
NVIDIA GeForce RTX 3090
min:
217 fps, max:
324 fps
295 [X] 759689
Intel Core i5-13600K 3.5GHz
NVIDIA GeForce RTX 3090
min:
245 fps, max:
358 fps
297 [X] 759689
Intel Core i9-13900K 3GHz
NVIDIA GeForce RTX 3090
min:
238 fps, max:
361 fps
302 [X] 759689
AMD Ryzen 5 7600X 4.7GHz
NVIDIA GeForce RTX 3090
min:
238 fps, max:
363 fps
303 [X] NVIDIA GeForce RTX 3090 Founders Edition 759689
AMD Ryzen 9 7950X 4.5GHz
NVIDIA GeForce RTX 3090
min:
242 fps, max:
372 fps
311 [X] Nvidia GeForce RTX 3090 FE 759689
AMD Ryzen 9 7950X 4.5GHz
NVIDIA GeForce RTX 3090
min:
250 fps, max:
370 fps
~ 279 fps
110%
NVIDIA GeForce RTX 3080 Ti:
298 [X] Corsair One i300 759689
Intel Core i9-12900K 3.2GHz
NVIDIA GeForce RTX 3080 Ti
min:
238 fps, max:
364 fps
310 313 [X] 759689
AMD Ryzen 9 7950X 4.5GHz
NVIDIA GeForce RTX 3080 Ti
min:
254 fps, max:
380 fps
~ 307 fps
65%
NVIDIA GeForce RTX 3080:
179 [X] 692646
AMD Ryzen 9 5900X 3.7GHz
NVIDIA GeForce RTX 3080
min:
153 fps, max:
213 fps
185 [X] 692646
AMD Ryzen 9 5900X 3.7GHz
NVIDIA GeForce RTX 3080
min:
158 fps, max:
218 fps
~ 182 fps
100%
NVIDIA GeForce RTX 3090:
204 207 [X] AMD Ryzen 9 5900X 3.7GHz
NVIDIA GeForce RTX 3090
min:
171 fps, max:
241 fps
218 [X] 759689
AMD Ryzen 9 7900X 4.7GHz
NVIDIA GeForce RTX 3090
min:
180 fps, max:
260 fps
219 [X] 704326
AMD Ryzen 9 5900X 3.7GHz
NVIDIA GeForce RTX 3090
min:
181 fps, max:
256 fps
233 [X] 759689
Intel Core i9-13900K 3GHz
NVIDIA GeForce RTX 3090
min:
191 fps, max:
275 fps
233 [X] 759689
Intel Core i5-13600K 3.5GHz
NVIDIA GeForce RTX 3090
min:
194 fps, max:
274 fps
235 [X] 759689
Intel Core i5-13400F 2.5GHz
NVIDIA GeForce RTX 3090
min:
196 fps, max:
273 fps
237 [X] NVIDIA GeForce RTX 3090 Founders Edition 759689
AMD Ryzen 9 7950X 4.5GHz
NVIDIA GeForce RTX 3090
min:
196 fps, max:
282 fps
238 [X] 759689
AMD Ryzen 5 7600X 4.7GHz
NVIDIA GeForce RTX 3090
min:
197 fps, max:
278 fps
240 [X] Nvidia GeForce RTX 3090 FE 759689
AMD Ryzen 9 7950X 4.5GHz
NVIDIA GeForce RTX 3090
min:
199 fps, max:
287 fps
~ 226 fps
105%
NVIDIA GeForce RTX 3080 Ti:
233 [X] Corsair One i300 759689
Intel Core i9-12900K 3.2GHz
NVIDIA GeForce RTX 3080 Ti
min:
192 fps, max:
280 fps
240 242 [X] 759689
AMD Ryzen 9 7950X 4.5GHz
NVIDIA GeForce RTX 3080 Ti
min:
200 fps, max:
289 fps
~ 238 fps
67%
NVIDIA GeForce RTX 3080:
146 [X] 692646
AMD Ryzen 9 5900X 3.7GHz
NVIDIA GeForce RTX 3080
min:
121 fps, max:
168 fps
155 [X] 692646
AMD Ryzen 9 5900X 3.7GHz
NVIDIA GeForce RTX 3080
min:
128 fps, max:
184 fps
~ 151 fps
100%
NVIDIA GeForce RTX 3090:
133 135 [X] AMD Ryzen 9 5900X 3.7GHz
NVIDIA GeForce RTX 3090
min:
116 fps, max:
157 fps
138.8 [X] 759689
AMD Ryzen 9 7900X 4.7GHz
NVIDIA GeForce RTX 3090
min:
117 fps, max:
164 fps
142.1 [X] 759689
Intel Core i5-13600K 3.5GHz
NVIDIA GeForce RTX 3090
min:
121 fps, max:
168 fps
142.4 [X] 759689
Intel Core i9-13900K 3GHz
NVIDIA GeForce RTX 3090
min:
118 fps, max:
168 fps
143.6 [X] NVIDIA GeForce RTX 3090 Founders Edition 759689
AMD Ryzen 9 7950X 4.5GHz
NVIDIA GeForce RTX 3090
min:
121 fps, max:
170 fps
143.8 [X] 759689
Intel Core i5-13400F 2.5GHz
NVIDIA GeForce RTX 3090
min:
122 fps, max:
169 fps
144 [X] 704326
AMD Ryzen 9 5900X 3.7GHz
NVIDIA GeForce RTX 3090
min:
123 fps, max:
166 fps
145.4 [X] 759689
AMD Ryzen 5 7600X 4.7GHz
NVIDIA GeForce RTX 3090
min:
124 fps, max:
171 fps
149.6 [X] Nvidia GeForce RTX 3090 FE 759689
AMD Ryzen 9 7950X 4.5GHz
NVIDIA GeForce RTX 3090
min:
126 fps, max:
175 fps
~ 142 fps
102%
NVIDIA GeForce RTX 3080 Ti:
143 [X] Corsair One i300 759689
Intel Core i9-12900K 3.2GHz
NVIDIA GeForce RTX 3080 Ti
min:
122 fps, max:
169 fps
145.2 145.9 [X] 759689
AMD Ryzen 9 7950X 4.5GHz
NVIDIA GeForce RTX 3080 Ti
min:
124 fps, max:
173 fps
~ 145 fps
82%
NVIDIA GeForce RTX 3080:
114 [X] 692646
AMD Ryzen 9 5900X 3.7GHz
NVIDIA GeForce RTX 3080
min:
100 fps, max:
136 fps
118 [X] 692646
AMD Ryzen 9 5900X 3.7GHz
NVIDIA GeForce RTX 3080
min:
102 fps, max:
137 fps
~ 116 fps
100%
NVIDIA GeForce RTX 3090:
206.4 fps
100%
NVIDIA GeForce RTX 3090:
144.9 fps
100%
NVIDIA GeForce RTX 3090:
123 fps
115%
NVIDIA GeForce RTX 3080 Ti:
141.1 fps
100%
NVIDIA GeForce RTX 3090:
121.8 fps
121%
NVIDIA GeForce RTX 3080 Ti:
147.5 fps
100%
NVIDIA GeForce RTX 3090:
74.5 fps
119%
NVIDIA GeForce RTX 3080 Ti:
88.3 fps
100%
NVIDIA GeForce RTX 3090:
314 [X] AMD Ryzen 9 5900X 3.7GHz
NVIDIA GeForce RTX 3090
P1:
256.4 fps
449.3 [X] AMD Ryzen 9 5900X 3.7GHz
NVIDIA GeForce RTX 3090
~ 382 fps
76%
NVIDIA GeForce RTX 3080:
283 [X] AMD Ryzen 9 5900X 3.7GHz
NVIDIA GeForce RTX 3080
P1:
129.9 fps
283 [X] AMD Ryzen 9 5900X 3.7GHz
NVIDIA GeForce RTX 3080
P1:
129.9 fps
305 [X] AMD Ryzen 9 5900X 3.7GHz
NVIDIA GeForce RTX 3080
P1:
166.7 fps
~ 290 fps
100%
NVIDIA GeForce RTX 3090:
310 [X] AMD Ryzen 9 5900X 3.7GHz
NVIDIA GeForce RTX 3090
P1:
181.8 fps
393 398.6 [X] AMD Ryzen 9 5900X 3.7GHz
NVIDIA GeForce RTX 3090
~ 367 fps
78%
NVIDIA GeForce RTX 3080:
277 [X] AMD Ryzen 9 5900X 3.7GHz
NVIDIA GeForce RTX 3080
P1:
138.9 fps
277 [X] AMD Ryzen 9 5900X 3.7GHz
NVIDIA GeForce RTX 3080
P1:
138.9 fps
302 [X] AMD Ryzen 9 5900X 3.7GHz
NVIDIA GeForce RTX 3080
P1:
169.5 fps
~ 285 fps
100%
NVIDIA GeForce RTX 3090:
298 [X] AMD Ryzen 9 5900X 3.7GHz
NVIDIA GeForce RTX 3090
P1:
181.8 fps
330 365.8 [X] AMD Ryzen 9 5900X 3.7GHz
NVIDIA GeForce RTX 3090
~ 331 fps
84%
NVIDIA GeForce RTX 3080:
270 [X] AMD Ryzen 9 5900X 3.7GHz
NVIDIA GeForce RTX 3080
P1:
133.3 fps
270 [X] AMD Ryzen 9 5900X 3.7GHz
NVIDIA GeForce RTX 3080
P1:
133.3 fps
291 [X] AMD Ryzen 9 5900X 3.7GHz
NVIDIA GeForce RTX 3080
P1:
175.4 fps
~ 277 fps
100%
NVIDIA GeForce RTX 3090:
282 296 [X] AMD Ryzen 9 5900X 3.7GHz
NVIDIA GeForce RTX 3090
P1:
181.8 fps
359.9 [X] AMD Ryzen 9 5900X 3.7GHz
NVIDIA GeForce RTX 3090
~ 313 fps
124%
NVIDIA GeForce RTX 3080 Ti:
388 fps
88%
NVIDIA GeForce RTX 3080:
268 [X] AMD Ryzen 9 5900X 3.7GHz
NVIDIA GeForce RTX 3080
P1:
147.1 fps
268 [X] AMD Ryzen 9 5900X 3.7GHz
NVIDIA GeForce RTX 3080
P1:
147.1 fps
290 [X] AMD Ryzen 9 5900X 3.7GHz
NVIDIA GeForce RTX 3080
P1:
175.4 fps
~ 275 fps
100%
NVIDIA GeForce RTX 3090:
271 295 [X] AMD Ryzen 9 5900X 3.7GHz
NVIDIA GeForce RTX 3090
P1:
185.2 fps
304.5 [X] AMD Ryzen 9 5900X 3.7GHz
NVIDIA GeForce RTX 3090
~ 290 fps
109%
NVIDIA GeForce RTX 3080 Ti:
316 fps
89%
NVIDIA GeForce RTX 3080:
248 [X] AMD Ryzen 9 5900X 3.7GHz
NVIDIA GeForce RTX 3080
P1:
122 fps
248 [X] AMD Ryzen 9 5900X 3.7GHz
NVIDIA GeForce RTX 3080
P1:
122 fps
277 [X] AMD Ryzen 9 5900X 3.7GHz
NVIDIA GeForce RTX 3080
P1:
172.4 fps
~ 258 fps
100%
NVIDIA GeForce RTX 3090:
182 188 [X] AMD Ryzen 9 5900X 3.7GHz
NVIDIA GeForce RTX 3090
P1:
151.5 fps
192.6 [X] AMD Ryzen 9 5900X 3.7GHz
NVIDIA GeForce RTX 3090
~ 188 fps
102%
NVIDIA GeForce RTX 3080 Ti:
191 fps
84%
NVIDIA GeForce RTX 3080:
153 [X] AMD Ryzen 9 5900X 3.7GHz
NVIDIA GeForce RTX 3080
P1:
103.1 fps
153 [X] AMD Ryzen 9 5900X 3.7GHz
NVIDIA GeForce RTX 3080
P1:
103.1 fps
167 [X] AMD Ryzen 9 5900X 3.7GHz
NVIDIA GeForce RTX 3080
P1:
133.3 fps
~ 158 fps
100%
NVIDIA GeForce RTX 3090:
239 [X] AMD Ryzen 9 5900X 3.7GHz
NVIDIA GeForce RTX 3090
270 [X] AMD Ryzen 9 5900X 3.7GHz
NVIDIA GeForce RTX 3090
min:
250 fps, max:
327 fps
~ 255 fps
97%
NVIDIA GeForce RTX 3080:
236 [X] AMD Ryzen 9 5900X 3.7GHz
NVIDIA GeForce RTX 3080
min:
210 fps, max:
265 fps
260 [X] AMD Ryzen 9 5900X 3.7GHz
NVIDIA GeForce RTX 3080
min:
220 fps, max:
303 fps
~ 248 fps
100%
NVIDIA GeForce RTX 3090:
206.5 [X] AMD Ryzen 9 5900X 3.7GHz
NVIDIA GeForce RTX 3090
278 [X] AMD Ryzen 9 5900X 3.7GHz
NVIDIA GeForce RTX 3090
min:
200 fps, max:
313 fps
~ 242 fps
84%
NVIDIA GeForce RTX 3080:
173 [X] AMD Ryzen 9 5900X 3.7GHz
NVIDIA GeForce RTX 3080
min:
142 fps, max:
225 fps
232 [X] AMD Ryzen 9 5900X 3.7GHz
NVIDIA GeForce RTX 3080
min:
192 fps, max:
267 fps
~ 203 fps
100%
NVIDIA GeForce RTX 3090:
192 [X] AMD Ryzen 9 5900X 3.7GHz
NVIDIA GeForce RTX 3090
252 [X] AMD Ryzen 9 5900X 3.7GHz
NVIDIA GeForce RTX 3090
min:
221 fps, max:
288 fps
~ 222 fps
90%
NVIDIA GeForce RTX 3080:
172 [X] AMD Ryzen 9 5900X 3.7GHz
NVIDIA GeForce RTX 3080
min:
141 fps, max:
204 fps
228 [X] AMD Ryzen 9 5900X 3.7GHz
NVIDIA GeForce RTX 3080
min:
194 fps, max:
293 fps
~ 200 fps
100%
NVIDIA GeForce RTX 3090:
184.4 [X] AMD Ryzen 9 5900X 3.7GHz
NVIDIA GeForce RTX 3090
217 [X] AMD Ryzen 9 5900X 3.7GHz
NVIDIA GeForce RTX 3090
min:
195 fps, max:
232 fps
~ 201 fps
86%
NVIDIA GeForce RTX 3080:
155 [X] AMD Ryzen 9 5900X 3.7GHz
NVIDIA GeForce RTX 3080
min:
126 fps, max:
198 fps
188 [X] AMD Ryzen 9 5900X 3.7GHz
NVIDIA GeForce RTX 3080
min:
143 fps, max:
199 fps
~ 172 fps
100%
NVIDIA GeForce RTX 3090:
112.8 [X] AMD Ryzen 9 5900X 3.7GHz
NVIDIA GeForce RTX 3090
121 [X] AMD Ryzen 9 5900X 3.7GHz
NVIDIA GeForce RTX 3090
min:
111 fps, max:
131 fps
~ 117 fps
86%
NVIDIA GeForce RTX 3080:
95.8 [X] AMD Ryzen 9 5900X 3.7GHz
NVIDIA GeForce RTX 3080
min:
90 fps, max:
111 fps
107 [X] AMD Ryzen 9 5900X 3.7GHz
NVIDIA GeForce RTX 3080
min:
104 fps, max:
111 fps
~ 101 fps
100%
NVIDIA GeForce RTX 3090:
167.9 [X] AMD Ryzen 9 5900X 3.7GHz
NVIDIA GeForce RTX 3090
min:
25 fps, max:
274 fps
175 [X] AMD Ryzen 9 5900X 3.7GHz
NVIDIA GeForce RTX 3090
min:
100 fps, max:
279 fps
~ 171 fps
94%
NVIDIA GeForce RTX 3080:
152.1 [X] AMD Ryzen 9 5900X 3.7GHz
NVIDIA GeForce RTX 3080
min:
19 fps, max:
294 fps
167 [X] AMD Ryzen 9 5900X 3.7GHz
NVIDIA GeForce RTX 3080
~ 160 fps
100%
NVIDIA GeForce RTX 3090:
152 171.7 [X] AMD Ryzen 9 5900X 3.7GHz
NVIDIA GeForce RTX 3090
min:
39 fps, max:
253 fps
174 [X] AMD Ryzen 9 5900X 3.7GHz
NVIDIA GeForce RTX 3090
min:
93 fps, max:
161 fps
~ 166 fps
92%
NVIDIA GeForce RTX 3080:
149.5 [X] AMD Ryzen 9 5900X 3.7GHz
NVIDIA GeForce RTX 3080
min:
12 fps, max:
269 fps
154 [X] AMD Ryzen 9 5900X 3.7GHz
NVIDIA GeForce RTX 3080
~ 152 fps
100%
NVIDIA GeForce RTX 3090:
143 153.2 [X] AMD Ryzen 9 5900X 3.7GHz
NVIDIA GeForce RTX 3090
min:
56 fps, max:
205 fps
155 [X] AMD Ryzen 9 5900X 3.7GHz
NVIDIA GeForce RTX 3090
min:
113 fps, max:
204 fps
~ 150 fps
92%
NVIDIA GeForce RTX 3080:
135 [X] AMD Ryzen 9 5900X 3.7GHz
NVIDIA GeForce RTX 3080
141.9 [X] AMD Ryzen 9 5900X 3.7GHz
NVIDIA GeForce RTX 3080
min:
33 fps, max:
239 fps
~ 138 fps
100%
NVIDIA GeForce RTX 3090:
109.9 [X] AMD Ryzen 9 5900X 3.7GHz
NVIDIA GeForce RTX 3090
min:
37 fps, max:
148 fps
110 115 [X] AMD Ryzen 9 5900X 3.7GHz
NVIDIA GeForce RTX 3090
min:
33 fps, max:
148 fps
~ 112 fps
100%
NVIDIA GeForce RTX 3080 Ti:
112 fps
89%
NVIDIA GeForce RTX 3080:
96 [X] AMD Ryzen 9 5900X 3.7GHz
NVIDIA GeForce RTX 3080
103 [X] AMD Ryzen 9 5900X 3.7GHz
NVIDIA GeForce RTX 3080
min:
38 fps, max:
135 fps
~ 100 fps
100%
NVIDIA GeForce RTX 3090:
91.9 92.3 [X] AMD Ryzen 9 5900X 3.7GHz
NVIDIA GeForce RTX 3090
min:
33 fps, max:
132 fps
96 [X] AMD Ryzen 9 5900X 3.7GHz
NVIDIA GeForce RTX 3090
min:
34 fps, max:
142 fps
~ 93 fps
99%
NVIDIA GeForce RTX 3080 Ti:
92.5 fps
90%
NVIDIA GeForce RTX 3080:
81 [X] AMD Ryzen 9 5900X 3.7GHz
NVIDIA GeForce RTX 3080
86.4 [X] AMD Ryzen 9 5900X 3.7GHz
NVIDIA GeForce RTX 3080
min:
34 fps, max:
118 fps
~ 84 fps
100%
NVIDIA GeForce RTX 3090:
61.9 63.5 [X] AMD Ryzen 9 5900X 3.7GHz
NVIDIA GeForce RTX 3090
min:
29 fps, max:
85 fps
67 [X] AMD Ryzen 9 5900X 3.7GHz
NVIDIA GeForce RTX 3090
min:
34 fps, max:
98 fps
~ 64 fps
98%
NVIDIA GeForce RTX 3080 Ti:
62.7 fps
88%
NVIDIA GeForce RTX 3080:
56 [X] AMD Ryzen 9 5900X 3.7GHz
NVIDIA GeForce RTX 3080
56.4 [X] AMD Ryzen 9 5900X 3.7GHz
NVIDIA GeForce RTX 3080
min:
33 fps, max:
92 fps
~ 56 fps
100%
NVIDIA GeForce RTX 3090:
104 129.9 [X] AMD Ryzen 9 5900X 3.7GHz
NVIDIA GeForce RTX 3090
133 [X] AMD Ryzen 9 5900X 3.7GHz
NVIDIA GeForce RTX 3090
min:
88 fps, max:
145 fps
~ 122 fps
107%
NVIDIA GeForce RTX 3080:
128 [X] AMD Ryzen 9 5900X 3.7GHz
NVIDIA GeForce RTX 3080
min:
80 fps, max:
145 fps
134 [X] AMD Ryzen 9 5900X 3.7GHz
NVIDIA GeForce RTX 3080
min:
90 fps, max:
145 fps
~ 131 fps
100%
NVIDIA GeForce RTX 3090:
100 129.6 [X] AMD Ryzen 9 5900X 3.7GHz
NVIDIA GeForce RTX 3090
132 [X] AMD Ryzen 9 5900X 3.7GHz
NVIDIA GeForce RTX 3090
min:
86 fps, max:
145 fps
~ 121 fps
107%
NVIDIA GeForce RTX 3080:
127 [X] AMD Ryzen 9 5900X 3.7GHz
NVIDIA GeForce RTX 3080
min:
78 fps, max:
145 fps
132 [X] AMD Ryzen 9 5900X 3.7GHz
NVIDIA GeForce RTX 3080
min:
87 fps, max:
145 fps
~ 130 fps
100%
NVIDIA GeForce RTX 3090:
97.4 129.2 [X] AMD Ryzen 9 5900X 3.7GHz
NVIDIA GeForce RTX 3090
131 [X] AMD Ryzen 9 5900X 3.7GHz
NVIDIA GeForce RTX 3090
min:
83 fps, max:
145 fps
~ 119 fps
110%
NVIDIA GeForce RTX 3080:
129 [X] AMD Ryzen 9 5900X 3.7GHz
NVIDIA GeForce RTX 3080
min:
76 fps, max:
145 fps
133 [X] AMD Ryzen 9 5900X 3.7GHz
NVIDIA GeForce RTX 3080
min:
90 fps, max:
145 fps
~ 131 fps
100%
NVIDIA GeForce RTX 3090:
101 127.4 [X] AMD Ryzen 9 5900X 3.7GHz
NVIDIA GeForce RTX 3090
130 [X] AMD Ryzen 9 5900X 3.7GHz
NVIDIA GeForce RTX 3090
min:
88 fps, max:
145 fps
~ 119 fps
109%
NVIDIA GeForce RTX 3080:
128 [X] AMD Ryzen 9 5900X 3.7GHz
NVIDIA GeForce RTX 3080
min:
79 fps, max:
145 fps
132 [X] AMD Ryzen 9 5900X 3.7GHz
NVIDIA GeForce RTX 3080
min:
94 fps, max:
145 fps
~ 130 fps
100%
NVIDIA GeForce RTX 3090:
87.1 111 [X] AMD Ryzen 9 5900X 3.7GHz
NVIDIA GeForce RTX 3090
min:
85 fps, max:
132 fps
124.4 [X] AMD Ryzen 9 5900X 3.7GHz
NVIDIA GeForce RTX 3090
~ 108 fps
88%
NVIDIA GeForce RTX 3080:
92.9 [X] AMD Ryzen 9 5900X 3.7GHz
NVIDIA GeForce RTX 3080
min:
75 fps, max:
110 fps
97.2 [X] AMD Ryzen 9 5900X 3.7GHz
NVIDIA GeForce RTX 3080
min:
74 fps, max:
115 fps
~ 95 fps
100%
NVIDIA GeForce RTX 3090:
177 fps
100%
NVIDIA GeForce RTX 3090:
169 fps
100%
NVIDIA GeForce RTX 3090:
169 fps
100%
NVIDIA GeForce RTX 3090:
149 fps
100%
NVIDIA GeForce RTX 3090:
96.4 fps
100%
NVIDIA GeForce RTX 3090:
178 fps
100%
NVIDIA GeForce RTX 3090:
116 fps
100%
NVIDIA GeForce RTX 3090:
129 fps
100%
NVIDIA GeForce RTX 3090:
106 fps
100%
NVIDIA GeForce RTX 3090:
91.2 fps
100%
NVIDIA GeForce RTX 3090:
172 [X] AMD Ryzen 9 5900X 3.7GHz
NVIDIA GeForce RTX 3090
174.5 [X] Intel Core i5-13400F 2.5GHz
NVIDIA GeForce RTX 3090
178 [X] AMD Ryzen 9 5900X 3.7GHz
NVIDIA GeForce RTX 3090
219 223 [X] Intel Core i5-13600K 3.5GHz
NVIDIA GeForce RTX 3090
230 232 [X] AMD Ryzen 5 7600X 4.7GHz
NVIDIA GeForce RTX 3090
238 [X] NVIDIA GeForce RTX 3090 Founders Edition AMD Ryzen 9 7950X 4.5GHz
NVIDIA GeForce RTX 3090
243 [X] Intel Core i9-13900K 3GHz
NVIDIA GeForce RTX 3090
243 [X] Nvidia GeForce RTX 3090 FE AMD Ryzen 9 7950X 4.5GHz
NVIDIA GeForce RTX 3090
244 [X] AMD Ryzen 9 7900X 4.7GHz
NVIDIA GeForce RTX 3090
~ 218 fps
104%
NVIDIA GeForce RTX 3080 Ti:
208 229 241 [X] AMD Ryzen 9 7950X 4.5GHz
NVIDIA GeForce RTX 3080 Ti
~ 226 fps
72%
NVIDIA GeForce RTX 3080:
147 [X] AMD Ryzen 9 5900X 3.7GHz
NVIDIA GeForce RTX 3080
165 [X] AMD Ryzen 9 5900X 3.7GHz
NVIDIA GeForce RTX 3080
~ 156 fps
100%
NVIDIA GeForce RTX 3090:
134 142 [X] AMD Ryzen 9 5900X 3.7GHz
NVIDIA GeForce RTX 3090
154.1 [X] Intel Core i5-13400F 2.5GHz
NVIDIA GeForce RTX 3090
157 [X] AMD Ryzen 9 5900X 3.7GHz
NVIDIA GeForce RTX 3090
195.3 [X] Intel Core i5-13600K 3.5GHz
NVIDIA GeForce RTX 3090
197.3 201 205 [X] AMD Ryzen 5 7600X 4.7GHz
NVIDIA GeForce RTX 3090
213 [X] AMD Ryzen 9 7900X 4.7GHz
NVIDIA GeForce RTX 3090
214 [X] Nvidia GeForce RTX 3090 FE AMD Ryzen 9 7950X 4.5GHz
NVIDIA GeForce RTX 3090
215 [X] Intel Core i9-13900K 3GHz
NVIDIA GeForce RTX 3090
217 [X] NVIDIA GeForce RTX 3090 Founders Edition AMD Ryzen 9 7950X 4.5GHz
NVIDIA GeForce RTX 3090
~ 187 fps
105%
NVIDIA GeForce RTX 3080 Ti:
181 195.3 213 [X] AMD Ryzen 9 7950X 4.5GHz
NVIDIA GeForce RTX 3080 Ti
~ 196 fps
72%
NVIDIA GeForce RTX 3080:
127 [X] AMD Ryzen 9 5900X 3.7GHz
NVIDIA GeForce RTX 3080
143 [X] AMD Ryzen 9 5900X 3.7GHz
NVIDIA GeForce RTX 3080
~ 135 fps
100%
NVIDIA GeForce RTX 3090:
124 126 [X] AMD Ryzen 9 5900X 3.7GHz
NVIDIA GeForce RTX 3090
143.4 [X] Intel Core i5-13400F 2.5GHz
NVIDIA GeForce RTX 3090
145 [X] AMD Ryzen 9 5900X 3.7GHz
NVIDIA GeForce RTX 3090
174.9 176.3 [X] Intel Core i5-13600K 3.5GHz
NVIDIA GeForce RTX 3090
179.4 185 [X] AMD Ryzen 5 7600X 4.7GHz
NVIDIA GeForce RTX 3090
189.8 [X] Nvidia GeForce RTX 3090 FE AMD Ryzen 9 7950X 4.5GHz
NVIDIA GeForce RTX 3090
190.3 [X] Intel Core i9-13900K 3GHz
NVIDIA GeForce RTX 3090
190.8 [X] AMD Ryzen 9 7900X 4.7GHz
NVIDIA GeForce RTX 3090
193 [X] NVIDIA GeForce RTX 3090 Founders Edition AMD Ryzen 9 7950X 4.5GHz
NVIDIA GeForce RTX 3090
~ 168 fps
107%
NVIDIA GeForce RTX 3080 Ti:
167 179.7 189.7 [X] AMD Ryzen 9 7950X 4.5GHz
NVIDIA GeForce RTX 3080 Ti
~ 179 fps
74%
NVIDIA GeForce RTX 3080:
120 [X] AMD Ryzen 9 5900X 3.7GHz
NVIDIA GeForce RTX 3080
129 [X] AMD Ryzen 9 5900X 3.7GHz
NVIDIA GeForce RTX 3080
~ 125 fps
100%
NVIDIA GeForce RTX 3090:
117 119 [X] AMD Ryzen 9 5900X 3.7GHz
NVIDIA GeForce RTX 3090
134 [X] Intel Core i5-13400F 2.5GHz
NVIDIA GeForce RTX 3090
135 [X] AMD Ryzen 9 5900X 3.7GHz
NVIDIA GeForce RTX 3090
153 156.3 [X] Intel Core i5-13600K 3.5GHz
NVIDIA GeForce RTX 3090
156.3 161.2 [X] AMD Ryzen 5 7600X 4.7GHz
NVIDIA GeForce RTX 3090
163 [X] Intel Core i9-13900K 3GHz
NVIDIA GeForce RTX 3090
164.1 [X] AMD Ryzen 9 7900X 4.7GHz
NVIDIA GeForce RTX 3090
164.7 [X] NVIDIA GeForce RTX 3090 Founders Edition AMD Ryzen 9 7950X 4.5GHz
NVIDIA GeForce RTX 3090
165 [X] Nvidia GeForce RTX 3090 FE AMD Ryzen 9 7950X 4.5GHz
NVIDIA GeForce RTX 3090
~ 149 fps
101%
NVIDIA GeForce RTX 3080 Ti:
129 152 160 164.9 [X] AMD Ryzen 9 7950X 4.5GHz
NVIDIA GeForce RTX 3080 Ti
~ 151 fps
83%
NVIDIA GeForce RTX 3080:
117 [X] AMD Ryzen 9 5900X 3.7GHz
NVIDIA GeForce RTX 3080
128 [X] AMD Ryzen 9 5900X 3.7GHz
NVIDIA GeForce RTX 3080
~ 123 fps
100%
NVIDIA GeForce RTX 3090:
105 [X] AMD Ryzen 9 5900X 3.7GHz
NVIDIA GeForce RTX 3090
109 117 [X] AMD Ryzen 9 5900X 3.7GHz
NVIDIA GeForce RTX 3090
120.4 [X] Intel Core i5-13400F 2.5GHz
NVIDIA GeForce RTX 3090
122.6 126.3 128.3 [X] Intel Core i9-13900K 3GHz
NVIDIA GeForce RTX 3090
128.3 [X] Intel Core i5-13600K 3.5GHz
NVIDIA GeForce RTX 3090
129.1 [X] NVIDIA GeForce RTX 3090 Founders Edition AMD Ryzen 9 7950X 4.5GHz
NVIDIA GeForce RTX 3090
130 [X] Nvidia GeForce RTX 3090 FE AMD Ryzen 9 7950X 4.5GHz
NVIDIA GeForce RTX 3090
130.7 [X] AMD Ryzen 5 7600X 4.7GHz
NVIDIA GeForce RTX 3090
131.6 [X] AMD Ryzen 9 7900X 4.7GHz
NVIDIA GeForce RTX 3090
~ 123 fps
101%
NVIDIA GeForce RTX 3080 Ti:
114 125 128.7 130.2 [X] AMD Ryzen 9 7950X 4.5GHz
NVIDIA GeForce RTX 3080 Ti
~ 124 fps
80%
NVIDIA GeForce RTX 3080:
95.7 [X] AMD Ryzen 9 5900X 3.7GHz
NVIDIA GeForce RTX 3080
103 [X] AMD Ryzen 9 5900X 3.7GHz
NVIDIA GeForce RTX 3080
~ 99 fps
100%
NVIDIA GeForce RTX 3090:
68 [X] AMD Ryzen 9 5900X 3.7GHz
NVIDIA GeForce RTX 3090
70.3 71.5 72.6 72.8 [X] NVIDIA GeForce RTX 3090 Founders Edition AMD Ryzen 9 7950X 4.5GHz
NVIDIA GeForce RTX 3090
73.1 [X] Intel Core i9-13900K 3GHz
NVIDIA GeForce RTX 3090
73.2 [X] Intel Core i5-13600K 3.5GHz
NVIDIA GeForce RTX 3090
73.3 [X] Intel Core i5-13400F 2.5GHz
NVIDIA GeForce RTX 3090
73.4 [X] AMD Ryzen 9 5900X 3.7GHz
NVIDIA GeForce RTX 3090
74.7 [X] Nvidia GeForce RTX 3090 FE AMD Ryzen 9 7950X 4.5GHz
NVIDIA GeForce RTX 3090
75 [X] AMD Ryzen 5 7600X 4.7GHz
NVIDIA GeForce RTX 3090
75.3 [X] AMD Ryzen 9 7900X 4.7GHz
NVIDIA GeForce RTX 3090
~ 73 fps
100%
NVIDIA GeForce RTX 3080 Ti:
71.2 72 73.8 [X] AMD Ryzen 9 7950X 4.5GHz
NVIDIA GeForce RTX 3080 Ti
74 ~ 73 fps
85%
NVIDIA GeForce RTX 3080:
61.5 [X] AMD Ryzen 9 5900X 3.7GHz
NVIDIA GeForce RTX 3080
61.9 [X] AMD Ryzen 9 5900X 3.7GHz
NVIDIA GeForce RTX 3080
~ 62 fps
100%
NVIDIA GeForce RTX 3090:
238 [X] AMD Ryzen 9 5900X 3.7GHz
NVIDIA GeForce RTX 3090
min:
214 fps, max:
241 fps
239.2 [X] AMD Ryzen 9 5900X 3.7GHz
NVIDIA GeForce RTX 3090
240 [X] Nvidia GeForce RTX 3090 FE AMD Ryzen 9 7950X 4.5GHz
NVIDIA GeForce RTX 3090
min:
52.5 fps, P0.1:
136.8 fps, P1:
158.1 fps, max:
630 fps
240 [X] Nvidia GeForce RTX 3090 FE Intel Core i9-14900K 3.2GHz
NVIDIA GeForce RTX 3090
min:
60 fps, P0.1:
146.5 fps, P1:
160.2 fps, max:
961 fps
~ 239 fps
100%
NVIDIA GeForce RTX 3080 Ti:
240 [X] Corsair One i300 Intel Core i9-12900K 3.2GHz
NVIDIA GeForce RTX 3080 Ti
min:
105 fps, P0.1:
144 fps, P1:
159 fps, max:
706 fps
240 [X] AMD Ryzen 9 7950X 4.5GHz
NVIDIA GeForce RTX 3080 Ti
min:
47.4 fps, P0.1:
116.4 fps, P1:
154.3 fps, max:
1183 fps
~ 240 fps
100%
NVIDIA GeForce RTX 3080:
235 [X] AMD Ryzen 9 5900X 3.7GHz
NVIDIA GeForce RTX 3080
min:
199 fps, max:
242 fps
240 [X] AMD Ryzen 9 5900X 3.7GHz
NVIDIA GeForce RTX 3080
min:
234 fps, max:
243 fps
~ 238 fps
100%
NVIDIA GeForce RTX 3090:
215 [X] AMD Ryzen 9 5900X 3.7GHz
NVIDIA GeForce RTX 3090
min:
186 fps, max:
242 fps
217 [X] AMD Ryzen 9 5900X 3.7GHz
NVIDIA GeForce RTX 3090
223 235 [X] Nvidia GeForce RTX 3090 FE Intel Core i9-14900K 3.2GHz
NVIDIA GeForce RTX 3090
min:
47.8 fps, P0.1:
139.5 fps, P1:
161.5 fps, max:
807 fps
237 [X] Nvidia GeForce RTX 3090 FE AMD Ryzen 9 7950X 4.5GHz
NVIDIA GeForce RTX 3090
min:
63 fps, P0.1:
85.6 fps, P1:
160.1 fps, max:
772 fps
~ 225 fps
105%
NVIDIA GeForce RTX 3080 Ti:
233 [X] Corsair One i300 Intel Core i9-12900K 3.2GHz
NVIDIA GeForce RTX 3080 Ti
min:
70.6 fps, P0.1:
144 fps, P1:
161 fps, max:
630 fps
238 [X] AMD Ryzen 9 7950X 4.5GHz
NVIDIA GeForce RTX 3080 Ti
min:
55.9 fps, P0.1:
115.2 fps, P1:
159.8 fps, max:
859 fps
~ 236 fps
85%
NVIDIA GeForce RTX 3080:
185 [X] AMD Ryzen 9 5900X 3.7GHz
NVIDIA GeForce RTX 3080
min:
159 fps, max:
212 fps
196 [X] AMD Ryzen 9 5900X 3.7GHz
NVIDIA GeForce RTX 3080
min:
168 fps, max:
228 fps
~ 191 fps
100%
NVIDIA GeForce RTX 3090:
172.2 [X] AMD Ryzen 9 5900X 3.7GHz
NVIDIA GeForce RTX 3090
174 177 [X] AMD Ryzen 9 5900X 3.7GHz
NVIDIA GeForce RTX 3090
min:
150 fps, max:
204 fps
186.9 [X] Nvidia GeForce RTX 3090 FE Intel Core i9-14900K 3.2GHz
NVIDIA GeForce RTX 3090
min:
67.5 fps, P0.1:
112.4 fps, P1:
147.7 fps, max:
550 fps
189.2 [X] Nvidia GeForce RTX 3090 FE AMD Ryzen 9 7950X 4.5GHz
NVIDIA GeForce RTX 3090
min:
62.5 fps, P0.1:
96.3 fps, P1:
147.5 fps, max:
703 fps
~ 180 fps
103%
NVIDIA GeForce RTX 3080 Ti:
181 187 [X] Corsair One i300 Intel Core i9-12900K 3.2GHz
NVIDIA GeForce RTX 3080 Ti
min:
63.4 fps, P0.1:
119 fps, P1:
150 fps, max:
624 fps
190.7 [X] AMD Ryzen 9 7950X 4.5GHz
NVIDIA GeForce RTX 3080 Ti
min:
57 fps, P0.1:
98.2 fps, P1:
148.2 fps, max:
651 fps
~ 186 fps
85%
NVIDIA GeForce RTX 3080:
151 [X] AMD Ryzen 9 5900X 3.7GHz
NVIDIA GeForce RTX 3080
min:
129 fps, max:
176 fps
155 [X] AMD Ryzen 9 5900X 3.7GHz
NVIDIA GeForce RTX 3080
min:
133 fps, max:
178 fps
~ 153 fps
100%
NVIDIA GeForce RTX 3090:
115.8 [X] AMD Ryzen 9 5900X 3.7GHz
NVIDIA GeForce RTX 3090
118 121.4 [X] Nvidia GeForce RTX 3090 FE Intel Core i9-14900K 3.2GHz
NVIDIA GeForce RTX 3090
min:
75.3 fps, P0.1:
91.5 fps, P1:
98.1 fps, max:
191.9 fps
123 [X] AMD Ryzen 9 5900X 3.7GHz
NVIDIA GeForce RTX 3090
min:
107 fps, max:
139 fps
123.7 [X] Nvidia GeForce RTX 3090 FE AMD Ryzen 9 7950X 4.5GHz
NVIDIA GeForce RTX 3090
min:
54.1 fps, P0.1:
60.9 fps, P1:
98.8 fps, max:
577 fps
~ 120 fps
103%
NVIDIA GeForce RTX 3080 Ti:
122 124 [X] Corsair One i300 Intel Core i9-12900K 3.2GHz
NVIDIA GeForce RTX 3080 Ti
min:
33.7 fps, P0.1:
81.3 fps, P1:
103 fps, max:
622 fps
125.5 [X] AMD Ryzen 9 7950X 4.5GHz
NVIDIA GeForce RTX 3080 Ti
min:
33.6 fps, P0.1:
61.9 fps, P1:
102.9 fps, max:
664 fps
~ 124 fps
88%
NVIDIA GeForce RTX 3080:
105 [X] AMD Ryzen 9 5900X 3.7GHz
NVIDIA GeForce RTX 3080
min:
90 fps, max:
123 fps
106 [X] AMD Ryzen 9 5900X 3.7GHz
NVIDIA GeForce RTX 3080
min:
92 fps, max:
123 fps
~ 106 fps
100%
NVIDIA GeForce RTX 3090:
61.3 [X] AMD Ryzen 9 5900X 3.7GHz
NVIDIA GeForce RTX 3090
61.8 62.5 [X] Nvidia GeForce RTX 3090 FE Intel Core i9-14900K 3.2GHz
NVIDIA GeForce RTX 3090
min:
49.9 fps, P0.1:
50.4 fps, P1:
53.1 fps, max:
91.7 fps
62.7 [X] Nvidia GeForce RTX 3090 FE AMD Ryzen 9 7950X 4.5GHz
NVIDIA GeForce RTX 3090
min:
33.8 fps, P0.1:
43.7 fps, P1:
52.7 fps, max:
203 fps
66 [X] AMD Ryzen 9 5900X 3.7GHz
NVIDIA GeForce RTX 3090
min:
57 fps, max:
76 fps
~ 63 fps
102%
NVIDIA GeForce RTX 3080 Ti:
63.9 [X] Corsair One i300 Intel Core i9-12900K 3.2GHz
NVIDIA GeForce RTX 3080 Ti
min:
32.5 fps, P0.1:
50.8 fps, P1:
54.5 fps, max:
99.9 fps
64 [X] AMD Ryzen 9 7950X 4.5GHz
NVIDIA GeForce RTX 3080 Ti
min:
29.9 fps, P0.1:
39.4 fps, P1:
54.7 fps, max:
164.2 fps
64.9 ~ 64 fps
89%
NVIDIA GeForce RTX 3080:
56.2 [X] AMD Ryzen 9 5900X 3.7GHz
NVIDIA GeForce RTX 3080
min:
49 fps, max:
64 fps
56.7 [X] AMD Ryzen 9 5900X 3.7GHz
NVIDIA GeForce RTX 3080
min:
48 fps, max:
65 fps
~ 56 fps
100%
NVIDIA GeForce RTX 3090:
74 [X] Nvidia GeForce RTX 3090 FE AMD Ryzen 9 7950X 4.5GHz
NVIDIA GeForce RTX 3090
min:
58.8 fps, P0.1:
61.3 fps, P1:
63.9 fps, max:
96.3 fps
74 [X] Nvidia GeForce RTX 3090 FE Intel Core i9-14900K 3.2GHz
NVIDIA GeForce RTX 3090
min:
54.1 fps, P0.1:
61.6 fps, P1:
64.6 fps, max:
122.1 fps
~ 74 fps
100%
NVIDIA GeForce RTX 3090:
172.7 fps
100%
NVIDIA GeForce RTX 3090:
135.5 fps
100%
NVIDIA GeForce RTX 3090:
123.5 fps
122%
NVIDIA GeForce RTX 3080 Ti:
151.2 fps
100%
NVIDIA GeForce RTX 3090:
100 fps
103%
NVIDIA GeForce RTX 3080 Ti:
103.4 fps
100%
NVIDIA GeForce RTX 3090:
51.4 fps
100%
NVIDIA GeForce RTX 3080 Ti:
51.4 fps
100%
NVIDIA GeForce RTX 3090:
264 [X] AMD Ryzen 9 5900X 3.7GHz
NVIDIA GeForce RTX 3090
P1:
138.9 fps
fps
111%
NVIDIA GeForce RTX 3080:
294 [X] AMD Ryzen 9 5900X 3.7GHz
NVIDIA GeForce RTX 3080
P1:
163.9 fps
fps
100%
NVIDIA GeForce RTX 3090:
192 [X] AMD Ryzen 9 5900X 3.7GHz
NVIDIA GeForce RTX 3090
P1:
135.1 fps
fps
109%
NVIDIA GeForce RTX 3080:
209 [X] AMD Ryzen 9 5900X 3.7GHz
NVIDIA GeForce RTX 3080
P1:
138.9 fps
fps
100%
NVIDIA GeForce RTX 3090:
168 [X] AMD Ryzen 9 5900X 3.7GHz
NVIDIA GeForce RTX 3090
P1:
129.9 fps
fps
108%
NVIDIA GeForce RTX 3080:
182 [X] AMD Ryzen 9 5900X 3.7GHz
NVIDIA GeForce RTX 3080
P1:
116.3 fps
fps
100%
NVIDIA GeForce RTX 3090:
163 [X] AMD Ryzen 9 5900X 3.7GHz
NVIDIA GeForce RTX 3090
P1:
119 fps
fps
110%
NVIDIA GeForce RTX 3080:
180 [X] AMD Ryzen 9 5900X 3.7GHz
NVIDIA GeForce RTX 3080
P1:
113.6 fps
fps
100%
NVIDIA GeForce RTX 3090:
110 [X] AMD Ryzen 9 5900X 3.7GHz
NVIDIA GeForce RTX 3090
P1:
87.7 fps
fps
122%
NVIDIA GeForce RTX 3080:
134 [X] AMD Ryzen 9 5900X 3.7GHz
NVIDIA GeForce RTX 3080
P1:
109.9 fps
fps
100%
NVIDIA GeForce RTX 3090:
56.7 [X] AMD Ryzen 9 5900X 3.7GHz
NVIDIA GeForce RTX 3090
P1:
51.8 fps
fps
127%
NVIDIA GeForce RTX 3080:
72.1 [X] AMD Ryzen 9 5900X 3.7GHz
NVIDIA GeForce RTX 3080
P1:
62.9 fps
fps
100%
NVIDIA GeForce RTX 3090:
145 [X] AMD Ryzen 9 5900X 3.7GHz
NVIDIA GeForce RTX 3090
min:
131 fps, max:
171 fps
179 [X] AMD Ryzen 9 5900X 3.7GHz
NVIDIA GeForce RTX 3090
212 [X] Nvidia GeForce RTX 3090 FE Intel Core i9-14900K 3.2GHz
NVIDIA GeForce RTX 3090
min:
114.9 fps, P0.1:
149.3 fps, P1:
172.7 fps, max:
258 fps
~ 179 fps
89%
NVIDIA GeForce RTX 3080 Ti:
159 [X] Corsair One i300 Intel Core i9-12900K 3.2GHz
NVIDIA GeForce RTX 3080 Ti
min:
91.7 fps, P0.1:
118 fps, P1:
131 fps, max:
191 fps
fps
78%
NVIDIA GeForce RTX 3080:
137 [X] AMD Ryzen 9 5900X 3.7GHz
NVIDIA GeForce RTX 3080
min:
123 fps, max:
162 fps
142 [X] AMD Ryzen 9 5900X 3.7GHz
NVIDIA GeForce RTX 3080
min:
130 fps, max:
162 fps
~ 140 fps
100%
NVIDIA GeForce RTX 3090:
116 145 [X] AMD Ryzen 9 5900X 3.7GHz
NVIDIA GeForce RTX 3090
min:
130 fps, max:
170 fps
155 [X] AMD Ryzen 9 5900X 3.7GHz
NVIDIA GeForce RTX 3090
198.6 [X] Nvidia GeForce RTX 3090 FE Intel Core i9-14900K 3.2GHz
NVIDIA GeForce RTX 3090
min:
101.3 fps, P0.1:
134.6 fps, P1:
161.4 fps, max:
253 fps
~ 154 fps
106%
NVIDIA GeForce RTX 3080 Ti:
163 [X] Corsair One i300 Intel Core i9-12900K 3.2GHz
NVIDIA GeForce RTX 3080 Ti
min:
84.7 fps, P0.1:
116 fps, P1:
133 fps, max:
206 fps
fps
89%
NVIDIA GeForce RTX 3080:
135 [X] AMD Ryzen 9 5900X 3.7GHz
NVIDIA GeForce RTX 3080
min:
122 fps, max:
160 fps
139 [X] AMD Ryzen 9 5900X 3.7GHz
NVIDIA GeForce RTX 3080
min:
119 fps, max:
164 fps
~ 137 fps
100%
NVIDIA GeForce RTX 3090:
87.7 103.5 [X] AMD Ryzen 9 5900X 3.7GHz
NVIDIA GeForce RTX 3090
105 [X] AMD Ryzen 9 5900X 3.7GHz
NVIDIA GeForce RTX 3090
min:
91 fps, max:
121 fps
173.3 [X] Nvidia GeForce RTX 3090 FE Intel Core i9-14900K 3.2GHz
NVIDIA GeForce RTX 3090
min:
89 fps, P0.1:
126.7 fps, P1:
139.7 fps, max:
223 fps
~ 117 fps
106%
NVIDIA GeForce RTX 3080 Ti:
124 [X] Corsair One i300 Intel Core i9-12900K 3.2GHz
NVIDIA GeForce RTX 3080 Ti
min:
77.1 fps, P0.1:
91.4 fps, P1:
103 fps, max:
151 fps
fps
83%
NVIDIA GeForce RTX 3080:
93.9 [X] AMD Ryzen 9 5900X 3.7GHz
NVIDIA GeForce RTX 3080
min:
85 fps, max:
115 fps
99.3 [X] AMD Ryzen 9 5900X 3.7GHz
NVIDIA GeForce RTX 3080
min:
89 fps, max:
115 fps
~ 97 fps
100%
NVIDIA GeForce RTX 3090:
51.5 54.5 [X] AMD Ryzen 9 5900X 3.7GHz
NVIDIA GeForce RTX 3090
54.8 [X] AMD Ryzen 9 5900X 3.7GHz
NVIDIA GeForce RTX 3090
min:
41 fps, max:
85 fps
85.5 [X] Nvidia GeForce RTX 3090 FE Intel Core i9-14900K 3.2GHz
NVIDIA GeForce RTX 3090
min:
64.2 fps, P0.1:
67.1 fps, P1:
69.1 fps, max:
109 fps
~ 62 fps
112%
NVIDIA GeForce RTX 3080 Ti:
69.4 [X] Corsair One i300 Intel Core i9-12900K 3.2GHz
NVIDIA GeForce RTX 3080 Ti
min:
28.1 fps, P0.1:
29 fps, P1:
51 fps, max:
92 fps
fps
87%
NVIDIA GeForce RTX 3080:
54 [X] AMD Ryzen 9 5900X 3.7GHz
NVIDIA GeForce RTX 3080
min:
38 fps, max:
82 fps
54.1 [X] AMD Ryzen 9 5900X 3.7GHz
NVIDIA GeForce RTX 3080
min:
42 fps, max:
83 fps
~ 54 fps
100%
NVIDIA GeForce RTX 3090:
53 53.5 [X] AMD Ryzen 9 5900X 3.7GHz
NVIDIA GeForce RTX 3090
53.9 [X] AMD Ryzen 9 5900X 3.7GHz
NVIDIA GeForce RTX 3090
min:
43 fps, max:
68 fps
86.1 [X] Nvidia GeForce RTX 3090 FE Intel Core i9-14900K 3.2GHz
NVIDIA GeForce RTX 3090
min:
61.6 fps, P0.1:
64.6 fps, P1:
69.3 fps, max:
103.7 fps
~ 62 fps
107%
NVIDIA GeForce RTX 3080 Ti:
66.1 [X] Corsair One i300 Intel Core i9-12900K 3.2GHz
NVIDIA GeForce RTX 3080 Ti
min:
28.6 fps, P0.1:
31.3 fps, P1:
53.7 fps, max:
87.3 fps
fps
84%
NVIDIA GeForce RTX 3080:
52.4 [X] AMD Ryzen 9 5900X 3.7GHz
NVIDIA GeForce RTX 3080
min:
41 fps, max:
71 fps
52.5 [X] AMD Ryzen 9 5900X 3.7GHz
NVIDIA GeForce RTX 3080
min:
42 fps, max:
77 fps
~ 52 fps
100%
NVIDIA GeForce RTX 3090:
51.3 [X] AMD Ryzen 9 5900X 3.7GHz
NVIDIA GeForce RTX 3090
52.5 [X] AMD Ryzen 9 5900X 3.7GHz
NVIDIA GeForce RTX 3090
min:
42 fps, max:
63 fps
53.2 87.4 [X] Nvidia GeForce RTX 3090 FE Intel Core i9-14900K 3.2GHz
NVIDIA GeForce RTX 3090
min:
41.9 fps, P0.1:
63.6 fps, P1:
70.4 fps, max:
103.1 fps
~ 61 fps
92%
NVIDIA GeForce RTX 3080 Ti:
55.9 [X] Corsair One i300 Intel Core i9-12900K 3.2GHz
NVIDIA GeForce RTX 3080 Ti
min:
28.6 fps, P0.1:
33 fps, P1:
44.1 fps, max:
87.9 fps
fps
74%
NVIDIA GeForce RTX 3080:
43.2 [X] AMD Ryzen 9 5900X 3.7GHz
NVIDIA GeForce RTX 3080
min:
32 fps, max:
52 fps
46.3 [X] AMD Ryzen 9 5900X 3.7GHz
NVIDIA GeForce RTX 3080
min:
40 fps, max:
52 fps
~ 45 fps
100%
NVIDIA GeForce RTX 3090:
234 [X] Nvidia GeForce RTX 3090 FE Intel Core i9-14900K 3.2GHz
NVIDIA GeForce RTX 3090
239 [X] AMD Ryzen 9 5900X 3.7GHz
NVIDIA GeForce RTX 3090
min:
44.2 fps, P1:
147 fps
249 [X] AMD Ryzen 9 5900X 3.7GHz
NVIDIA GeForce RTX 3090
~ 241 fps
100%
NVIDIA GeForce RTX 3080:
240 [X] AMD Ryzen 9 5900X 3.7GHz
NVIDIA GeForce RTX 3080
fps
100%
NVIDIA GeForce RTX 3090:
183 210 [X] AMD Ryzen 9 5900X 3.7GHz
NVIDIA GeForce RTX 3090
218 [X] Nvidia GeForce RTX 3090 FE Intel Core i9-14900K 3.2GHz
NVIDIA GeForce RTX 3090
221 [X] AMD Ryzen 9 5900X 3.7GHz
NVIDIA GeForce RTX 3090
min:
48.5 fps, P1:
127 fps
~ 208 fps
95%
NVIDIA GeForce RTX 3080:
197 [X] AMD Ryzen 9 5900X 3.7GHz
NVIDIA GeForce RTX 3080
fps
100%
NVIDIA GeForce RTX 3090:
157 177 [X] AMD Ryzen 9 5900X 3.7GHz
NVIDIA GeForce RTX 3090
188 [X] AMD Ryzen 9 5900X 3.7GHz
NVIDIA GeForce RTX 3090
min:
37.5 fps, P1:
102 fps
210 [X] Nvidia GeForce RTX 3090 FE Intel Core i9-14900K 3.2GHz
NVIDIA GeForce RTX 3090
~ 183 fps
92%
NVIDIA GeForce RTX 3080:
168 [X] AMD Ryzen 9 5900X 3.7GHz
NVIDIA GeForce RTX 3080
fps
100%
NVIDIA GeForce RTX 3090:
140 152 [X] AMD Ryzen 9 5900X 3.7GHz
NVIDIA GeForce RTX 3090
160 [X] AMD Ryzen 9 5900X 3.7GHz
NVIDIA GeForce RTX 3090
min:
43.7 fps, P1:
88.5 fps
180 [X] Nvidia GeForce RTX 3090 FE Intel Core i9-14900K 3.2GHz
NVIDIA GeForce RTX 3090
~ 158 fps
91%
NVIDIA GeForce RTX 3080 Ti:
143 fps
89%
NVIDIA GeForce RTX 3080:
140 [X] AMD Ryzen 9 5900X 3.7GHz
NVIDIA GeForce RTX 3080
fps
100%
NVIDIA GeForce RTX 3090:
120 121 [X] AMD Ryzen 9 5900X 3.7GHz
NVIDIA GeForce RTX 3090
128 [X] AMD Ryzen 9 5900X 3.7GHz
NVIDIA GeForce RTX 3090
min:
25.2 fps, P1:
84 fps
136 [X] Nvidia GeForce RTX 3090 FE Intel Core i9-14900K 3.2GHz
NVIDIA GeForce RTX 3090
~ 126 fps
96%
NVIDIA GeForce RTX 3080 Ti:
121 fps
85%
NVIDIA GeForce RTX 3080:
107 [X] AMD Ryzen 9 5900X 3.7GHz
NVIDIA GeForce RTX 3080
fps
100%
NVIDIA GeForce RTX 3090:
71.9 72 [X] AMD Ryzen 9 5900X 3.7GHz
NVIDIA GeForce RTX 3090
77.5 [X] AMD Ryzen 9 5900X 3.7GHz
NVIDIA GeForce RTX 3090
min:
50 fps, P1:
62.1 fps
78 [X] Nvidia GeForce RTX 3090 FE Intel Core i9-14900K 3.2GHz
NVIDIA GeForce RTX 3090
~ 75 fps
102%
NVIDIA GeForce RTX 3080 Ti:
76.6 fps
87%
NVIDIA GeForce RTX 3080:
65 [X] AMD Ryzen 9 5900X 3.7GHz
NVIDIA GeForce RTX 3080
fps
100%
NVIDIA GeForce RTX 3090:
171 fps
100%
NVIDIA GeForce RTX 3090:
166 fps
100%
NVIDIA GeForce RTX 3090:
150 fps
100%
NVIDIA GeForce RTX 3090:
137 fps
100%
NVIDIA GeForce RTX 3090:
93 fps
100%
NVIDIA GeForce RTX 3090:
134 [X] AMD Ryzen 9 5900X 3.7GHz
NVIDIA GeForce RTX 3090
min:
92 fps, max:
210 fps
148 [X] AMD Ryzen 9 5900X 3.7GHz
NVIDIA GeForce RTX 3090
min:
105 fps, max:
230 fps
166 [X] Intel Core i5-13400F 2.5GHz
NVIDIA GeForce RTX 3090
min:
123 fps, max:
246 fps
176 191 [X] AMD Ryzen 5 7600X 4.7GHz
NVIDIA GeForce RTX 3090
min:
141 fps, max:
299 fps
192 199 [X] Nvidia GeForce RTX 3090 FE AMD Ryzen 9 7950X 4.5GHz
NVIDIA GeForce RTX 3090
min:
132 fps, max:
304 fps
200 [X] AMD Ryzen 9 7900X 4.7GHz
NVIDIA GeForce RTX 3090
min:
144 fps, max:
316 fps
201 [X] Intel Core i5-13600K 3.5GHz
NVIDIA GeForce RTX 3090
min:
128 fps, max:
295 fps
205 [X] NVIDIA GeForce RTX 3090 Founders Edition AMD Ryzen 9 7950X 4.5GHz
NVIDIA GeForce RTX 3090
min:
150 fps, max:
317 fps
221 [X] Intel Core i9-13900K 3GHz
NVIDIA GeForce RTX 3090
min:
141 fps, max:
329 fps
234 [X] Nvidia GeForce RTX 3090 FE Intel Core i9-14900K 3.2GHz
NVIDIA GeForce RTX 3090
min:
163 fps, max:
351 fps
~ 189 fps
104%
NVIDIA GeForce RTX 3080 Ti:
190 [X] Corsair One i300 Intel Core i9-12900K 3.2GHz
NVIDIA GeForce RTX 3080 Ti
min:
144 fps, max:
282 fps
199 [X] AMD Ryzen 9 7950X 4.5GHz
NVIDIA GeForce RTX 3080 Ti
min:
134 fps, max:
298 fps
200 ~ 196 fps
78%
NVIDIA GeForce RTX 3080:
143 [X] AMD Ryzen 9 5900X 3.7GHz
NVIDIA GeForce RTX 3080
min:
98 fps, max:
231 fps
150 [X] AMD Ryzen 9 5900X 3.7GHz
NVIDIA GeForce RTX 3080
min:
106 fps, max:
238 fps
~ 147 fps
100%
NVIDIA GeForce RTX 3090:
117 [X] AMD Ryzen 9 5900X 3.7GHz
NVIDIA GeForce RTX 3090
min:
86 fps, max:
191 fps
122 128 [X] AMD Ryzen 9 5900X 3.7GHz
NVIDIA GeForce RTX 3090
min:
94 fps, max:
205 fps
145 [X] Intel Core i5-13400F 2.5GHz
NVIDIA GeForce RTX 3090
min:
116 fps, max:
213 fps
160 168 [X] AMD Ryzen 5 7600X 4.7GHz
NVIDIA GeForce RTX 3090
min:
124 fps, max:
267 fps
169 175 [X] Nvidia GeForce RTX 3090 FE AMD Ryzen 9 7950X 4.5GHz
NVIDIA GeForce RTX 3090
min:
136 fps, max:
272 fps
176 [X] AMD Ryzen 9 7900X 4.7GHz
NVIDIA GeForce RTX 3090
min:
132 fps, max:
278 fps
176 [X] Intel Core i5-13600K 3.5GHz
NVIDIA GeForce RTX 3090
min:
138 fps, max:
263 fps
180 [X] NVIDIA GeForce RTX 3090 Founders Edition AMD Ryzen 9 7950X 4.5GHz
NVIDIA GeForce RTX 3090
min:
140 fps, max:
285 fps
191 [X] Intel Core i9-13900K 3GHz
NVIDIA GeForce RTX 3090
min:
150 fps, max:
291 fps
199 [X] Nvidia GeForce RTX 3090 FE Intel Core i9-14900K 3.2GHz
NVIDIA GeForce RTX 3090
min:
154 fps, max:
300 fps
~ 162 fps
106%
NVIDIA GeForce RTX 3080 Ti:
165 [X] Corsair One i300 Intel Core i9-12900K 3.2GHz
NVIDIA GeForce RTX 3080 Ti
min:
129 fps, max:
250 fps
174 175 [X] AMD Ryzen 9 7950X 4.5GHz
NVIDIA GeForce RTX 3080 Ti
min:
135 fps, max:
268 fps
~ 171 fps
80%
NVIDIA GeForce RTX 3080:
125 [X] AMD Ryzen 9 5900X 3.7GHz
NVIDIA GeForce RTX 3080
min:
84 fps, max:
199 fps
132 [X] AMD Ryzen 9 5900X 3.7GHz
NVIDIA GeForce RTX 3080
min:
99 fps, max:
208 fps
~ 129 fps
100%
NVIDIA GeForce RTX 3090:
115 117 [X] AMD Ryzen 9 5900X 3.7GHz
NVIDIA GeForce RTX 3090
min:
89 fps, max:
179 fps
123 [X] AMD Ryzen 9 5900X 3.7GHz
NVIDIA GeForce RTX 3090
min:
92 fps, max:
193 fps
138 [X] Intel Core i5-13400F 2.5GHz
NVIDIA GeForce RTX 3090
min:
108 fps, max:
198 fps
156 161 [X] AMD Ryzen 5 7600X 4.7GHz
NVIDIA GeForce RTX 3090
min:
117 fps, max:
256 fps
162 169 [X] AMD Ryzen 9 7900X 4.7GHz
NVIDIA GeForce RTX 3090
min:
127 fps, max:
265 fps
169 [X] Nvidia GeForce RTX 3090 FE AMD Ryzen 9 7950X 4.5GHz
NVIDIA GeForce RTX 3090
min:
127 fps, max:
262 fps
170 [X] Intel Core i5-13600K 3.5GHz
NVIDIA GeForce RTX 3090
min:
135 fps, max:
250 fps
173 [X] NVIDIA GeForce RTX 3090 Founders Edition AMD Ryzen 9 7950X 4.5GHz
NVIDIA GeForce RTX 3090
min:
134 fps, max:
264 fps
183 [X] Intel Core i9-13900K 3GHz
NVIDIA GeForce RTX 3090
min:
143 fps, max:
277 fps
191 [X] Nvidia GeForce RTX 3090 FE Intel Core i9-14900K 3.2GHz
NVIDIA GeForce RTX 3090
min:
148 fps, max:
283 fps
~ 156 fps
105%
NVIDIA GeForce RTX 3080 Ti:
157 [X] Corsair One i300 Intel Core i9-12900K 3.2GHz
NVIDIA GeForce RTX 3080 Ti
min:
122 fps, max:
235 fps
167 169 [X] AMD Ryzen 9 7950X 4.5GHz
NVIDIA GeForce RTX 3080 Ti
min:
131 fps, max:
261 fps
~ 164 fps
79%
NVIDIA GeForce RTX 3080:
120 [X] AMD Ryzen 9 5900X 3.7GHz
NVIDIA GeForce RTX 3080
min:
90 fps, max:
181 fps
127 [X] AMD Ryzen 9 5900X 3.7GHz
NVIDIA GeForce RTX 3080
min:
94 fps, max:
197 fps
~ 124 fps
100%
NVIDIA GeForce RTX 3090:
104 106 [X] AMD Ryzen 9 5900X 3.7GHz
NVIDIA GeForce RTX 3090
min:
69 fps, max:
171 fps
112 [X] AMD Ryzen 9 5900X 3.7GHz
NVIDIA GeForce RTX 3090
min:
75 fps, max:
189 fps
125 [X] Intel Core i5-13400F 2.5GHz
NVIDIA GeForce RTX 3090
min:
90 fps, max:
200 fps
142 144 [X] AMD Ryzen 5 7600X 4.7GHz
NVIDIA GeForce RTX 3090
min:
96 fps, max:
249 fps
144 151 [X] AMD Ryzen 9 7900X 4.7GHz
NVIDIA GeForce RTX 3090
min:
101 fps, max:
257 fps
153 [X] Intel Core i5-13600K 3.5GHz
NVIDIA GeForce RTX 3090
min:
107 fps, max:
240 fps
153 [X] Nvidia GeForce RTX 3090 FE AMD Ryzen 9 7950X 4.5GHz
NVIDIA GeForce RTX 3090
min:
102 fps, max:
256 fps
157 [X] NVIDIA GeForce RTX 3090 Founders Edition AMD Ryzen 9 7950X 4.5GHz
NVIDIA GeForce RTX 3090
min:
106 fps, max:
261 fps
166 [X] Intel Core i9-13900K 3GHz
NVIDIA GeForce RTX 3090
min:
118 fps, max:
265 fps
172 [X] Nvidia GeForce RTX 3090 FE Intel Core i9-14900K 3.2GHz
NVIDIA GeForce RTX 3090
min:
120 fps, max:
265 fps
~ 141 fps
101%
NVIDIA GeForce RTX 3080 Ti:
122 141 [X] Corsair One i300 Intel Core i9-12900K 3.2GHz
NVIDIA GeForce RTX 3080 Ti
min:
98 fps, max:
229 fps
150 153 [X] AMD Ryzen 9 7950X 4.5GHz
NVIDIA GeForce RTX 3080 Ti
min:
104 fps, max:
256 fps
~ 142 fps
79%
NVIDIA GeForce RTX 3080:
108 [X] AMD Ryzen 9 5900X 3.7GHz
NVIDIA GeForce RTX 3080
min:
71 fps, max:
183 fps
115 [X] AMD Ryzen 9 5900X 3.7GHz
NVIDIA GeForce RTX 3080
min:
77 fps, max:
195 fps
~ 112 fps
100%
NVIDIA GeForce RTX 3090:
102 105 [X] AMD Ryzen 9 5900X 3.7GHz
NVIDIA GeForce RTX 3090
min:
69 fps, max:
179 fps
110 [X] AMD Ryzen 9 5900X 3.7GHz
NVIDIA GeForce RTX 3090
min:
75 fps, max:
184 fps
123 [X] Intel Core i5-13400F 2.5GHz
NVIDIA GeForce RTX 3090
min:
88 fps, max:
193 fps
138 [X] AMD Ryzen 5 7600X 4.7GHz
NVIDIA GeForce RTX 3090
min:
95 fps, max:
210 fps
138 139 143 [X] AMD Ryzen 9 7900X 4.7GHz
NVIDIA GeForce RTX 3090
min:
99 fps, max:
213 fps
146 [X] Intel Core i5-13600K 3.5GHz
NVIDIA GeForce RTX 3090
min:
107 fps, max:
212 fps
147 [X] Nvidia GeForce RTX 3090 FE AMD Ryzen 9 7950X 4.5GHz
NVIDIA GeForce RTX 3090
min:
105 fps, max:
218 fps
148 [X] NVIDIA GeForce RTX 3090 Founders Edition AMD Ryzen 9 7950X 4.5GHz
NVIDIA GeForce RTX 3090
min:
105 fps, max:
214 fps
156 [X] Intel Core i9-13900K 3GHz
NVIDIA GeForce RTX 3090
min:
115 fps, max:
215 fps
160 [X] Nvidia GeForce RTX 3090 FE Intel Core i9-14900K 3.2GHz
NVIDIA GeForce RTX 3090
min:
120 fps, max:
216 fps
~ 135 fps
101%
NVIDIA GeForce RTX 3080 Ti:
118 137 [X] Corsair One i300 Intel Core i9-12900K 3.2GHz
NVIDIA GeForce RTX 3080 Ti
min:
97 fps, max:
205 fps
144 146 [X] AMD Ryzen 9 7950X 4.5GHz
NVIDIA GeForce RTX 3080 Ti
min:
103 fps, max:
216 fps
~ 136 fps
79%
NVIDIA GeForce RTX 3080:
103 [X] AMD Ryzen 9 5900X 3.7GHz
NVIDIA GeForce RTX 3080
min:
68 fps, max:
169 fps
110 [X] AMD Ryzen 9 5900X 3.7GHz
NVIDIA GeForce RTX 3080
min:
77 fps, max:
169 fps
~ 107 fps
100%
NVIDIA GeForce RTX 3090:
92 96 [X] AMD Ryzen 9 5900X 3.7GHz
NVIDIA GeForce RTX 3090
min:
71 fps, max:
125 fps
97 [X] AMD Ryzen 9 5900X 3.7GHz
NVIDIA GeForce RTX 3090
min:
75 fps, max:
124 fps
104 105 105 [X] Intel Core i5-13400F 2.5GHz
NVIDIA GeForce RTX 3090
min:
85 fps, max:
130 fps
108 [X] Intel Core i5-13600K 3.5GHz
NVIDIA GeForce RTX 3090
min:
92 fps, max:
128 fps
108 [X] NVIDIA GeForce RTX 3090 Founders Edition AMD Ryzen 9 7950X 4.5GHz
NVIDIA GeForce RTX 3090
min:
93 fps, max:
129 fps
109 [X] AMD Ryzen 9 7900X 4.7GHz
NVIDIA GeForce RTX 3090
min:
93 fps, max:
131 fps
109 [X] AMD Ryzen 5 7600X 4.7GHz
NVIDIA GeForce RTX 3090
min:
87 fps, max:
130 fps
109 [X] Nvidia GeForce RTX 3090 FE Intel Core i9-14900K 3.2GHz
NVIDIA GeForce RTX 3090
min:
90 fps, max:
129 fps
110 [X] Nvidia GeForce RTX 3090 FE AMD Ryzen 9 7950X 4.5GHz
NVIDIA GeForce RTX 3090
min:
94 fps, max:
131 fps
111 [X] Intel Core i9-13900K 3GHz
NVIDIA GeForce RTX 3090
min:
94 fps, max:
132 fps
~ 105 fps
102%
NVIDIA GeForce RTX 3080 Ti:
100 107 [X] Corsair One i300 Intel Core i9-12900K 3.2GHz
NVIDIA GeForce RTX 3080 Ti
min:
85 fps, max:
127 fps
109 110 [X] AMD Ryzen 9 7950X 4.5GHz
NVIDIA GeForce RTX 3080 Ti
min:
85 fps, max:
131 fps
~ 107 fps
85%
NVIDIA GeForce RTX 3080:
88 [X] AMD Ryzen 9 5900X 3.7GHz
NVIDIA GeForce RTX 3080
min:
71 fps, max:
110 fps
89 [X] AMD Ryzen 9 5900X 3.7GHz
NVIDIA GeForce RTX 3080
min:
72 fps, max:
108 fps
~ 89 fps
100%
NVIDIA GeForce RTX 3090:
190 [X] AMD Ryzen 9 5900X 3.7GHz
NVIDIA GeForce RTX 3090
min:
103.36 fps, max:
299.49 fps
201 [X] AMD Ryzen 9 5900X 3.7GHz
NVIDIA GeForce RTX 3090
min:
107.86 fps, max:
298.95 fps
224 [X] Intel Core i5-13400F 2.5GHz
NVIDIA GeForce RTX 3090
min:
117.5 fps, max:
343.41 fps
272 [X] Intel Core i5-13600K 3.5GHz
NVIDIA GeForce RTX 3090
min:
144.26 fps, max:
415.11 fps
281 [X] AMD Ryzen 9 7950X AMD Ryzen 9 7950X 4.5GHz
NVIDIA GeForce RTX 3090
min:
154.2 fps, max:
444.64 fps
285 [X] Intel Core i9-13900K 3GHz
NVIDIA GeForce RTX 3090
min:
125.31 fps, max:
503.02 fps
298 [X] Nvidia GeForce RTX 3090 FE AMD Ryzen 9 7950X 4.5GHz
NVIDIA GeForce RTX 3090
min:
158.45 fps, max:
472.37 fps
310 [X] NVIDIA GeForce RTX 3090 Founders Edition AMD Ryzen 9 7950X 4.5GHz
NVIDIA GeForce RTX 3090
min:
168.18 fps, max:
493.1 fps
311 [X] AMD Ryzen 9 7900X 4.7GHz
NVIDIA GeForce RTX 3090
min:
169.15 fps, max:
473.71 fps
317 [X] AMD Ryzen 7 7700X AMD Ryzen 7 7700X 4.5GHz
NVIDIA GeForce RTX 3090
min:
162.84 fps, max:
497.76 fps
321 [X] AMD Ryzen 5 7600X 4.7GHz
NVIDIA GeForce RTX 3090
min:
162.18 fps, max:
504.54 fps
~ 274 fps
97%
NVIDIA GeForce RTX 3080 Ti:
241 258 [X] Corsair One i300 Intel Core i9-12900K 3.2GHz
NVIDIA GeForce RTX 3080 Ti
min:
138.39 fps, max:
398.72 fps
303 [X] AMD Ryzen 9 7950X 4.5GHz
NVIDIA GeForce RTX 3080 Ti
min:
163.77 fps, max:
476.87 fps
~ 267 fps
79%
NVIDIA GeForce RTX 3080:
212 [X] AMD Ryzen 9 5900X 3.7GHz
NVIDIA GeForce RTX 3080
min:
112.45 fps, max:
343.17 fps
220 [X] AMD Ryzen 9 5900X 3.7GHz
NVIDIA GeForce RTX 3080
min:
123.76 fps, max:
325.95 fps
~ 216 fps
100%
NVIDIA GeForce RTX 3090:
139 166 [X] AMD Ryzen 9 5900X 3.7GHz
NVIDIA GeForce RTX 3090
min:
85.22 fps, max:
252.27 fps
168 [X] AMD Ryzen 9 5900X 3.7GHz
NVIDIA GeForce RTX 3090
min:
80.55 fps, max:
254.52 fps
198.5 [X] Intel Core i5-13400F 2.5GHz
NVIDIA GeForce RTX 3090
min:
97.3 fps, max:
291.04 fps
215 [X] AMD Ryzen 9 7950X AMD Ryzen 9 7950X 4.5GHz
NVIDIA GeForce RTX 3090
min:
90.45 fps, max:
357.02 fps
217 [X] Intel Core i9-13900K 3GHz
NVIDIA GeForce RTX 3090
min:
95.52 fps, max:
408.33 fps
218 [X] Intel Core i5-13600K 3.5GHz
NVIDIA GeForce RTX 3090
min:
94.74 fps, max:
350.75 fps
219 [X] AMD Ryzen 7 7700X AMD Ryzen 7 7700X 4.5GHz
NVIDIA GeForce RTX 3090
min:
89.48 fps, max:
382.56 fps
221 [X] AMD Ryzen 5 7600X 4.7GHz
NVIDIA GeForce RTX 3090
min:
91.22 fps, max:
382.26 fps
223 [X] AMD Ryzen 9 7900X 4.7GHz
NVIDIA GeForce RTX 3090
min:
95.64 fps, max:
376.79 fps
229 [X] Nvidia GeForce RTX 3090 FE AMD Ryzen 9 7950X 4.5GHz
NVIDIA GeForce RTX 3090
min:
97.91 fps, max:
384.91 fps
230 [X] NVIDIA GeForce RTX 3090 Founders Edition AMD Ryzen 9 7950X 4.5GHz
NVIDIA GeForce RTX 3090
min:
95.34 fps, max:
392.16 fps
~ 204 fps
104%
NVIDIA GeForce RTX 3080 Ti:
200 212 [X] Corsair One i300 Intel Core i9-12900K 3.2GHz
NVIDIA GeForce RTX 3080 Ti
min:
90.52 fps, max:
333.89 fps
227 [X] AMD Ryzen 9 7950X 4.5GHz
NVIDIA GeForce RTX 3080 Ti
min:
95.27 fps, max:
384.76 fps
~ 213 fps
82%
NVIDIA GeForce RTX 3080:
155 [X] AMD Ryzen 9 5900X 3.7GHz
NVIDIA GeForce RTX 3080
min:
77.83 fps, max:
252.53 fps
181 [X] AMD Ryzen 9 5900X 3.7GHz
NVIDIA GeForce RTX 3080
min:
85.17 fps, max:
277.47 fps
~ 168 fps
100%
NVIDIA GeForce RTX 3090:
123 146 [X] AMD Ryzen 9 5900X 3.7GHz
NVIDIA GeForce RTX 3090
min:
71.89 fps, max:
219.3 fps
155 [X] AMD Ryzen 9 5900X 3.7GHz
NVIDIA GeForce RTX 3090
min:
81.75 fps, max:
234.3 fps
166 [X] Intel Core i5-13400F 2.5GHz
NVIDIA GeForce RTX 3090
min:
70.41 fps, max:
258.2 fps
170.4 [X] AMD Ryzen 9 7950X AMD Ryzen 9 7950X 4.5GHz
NVIDIA GeForce RTX 3090
min:
79.38 fps, max:
296.56 fps
171.6 [X] AMD Ryzen 7 7700X AMD Ryzen 7 7700X 4.5GHz
NVIDIA GeForce RTX 3090
min:
74.91 fps, max:
315.36 fps
173 [X] Intel Core i5-13600K 3.5GHz
NVIDIA GeForce RTX 3090
min:
80.75 fps, max:
296.74 fps
173.1 [X] AMD Ryzen 5 7600X 4.7GHz
NVIDIA GeForce RTX 3090
min:
76.09 fps, max:
313.87 fps
173.9 [X] Intel Core i9-13900K 3GHz
NVIDIA GeForce RTX 3090
min:
82.22 fps, max:
337.72 fps
175.2 [X] AMD Ryzen 9 7900X 4.7GHz
NVIDIA GeForce RTX 3090
min:
80.19 fps, max:
309.02 fps
179.6 [X] NVIDIA GeForce RTX 3090 Founders Edition AMD Ryzen 9 7950X 4.5GHz
NVIDIA GeForce RTX 3090
min:
81.62 fps, max:
319.9 fps
181.6 [X] Nvidia GeForce RTX 3090 FE AMD Ryzen 9 7950X 4.5GHz
NVIDIA GeForce RTX 3090
min:
83.63 fps, max:
328.52 fps
~ 166 fps
104%
NVIDIA GeForce RTX 3080 Ti:
165.8 169 [X] Corsair One i300 Intel Core i9-12900K 3.2GHz
NVIDIA GeForce RTX 3080 Ti
min:
76.59 fps, max:
287.19 fps
179.8 [X] AMD Ryzen 9 7950X 4.5GHz
NVIDIA GeForce RTX 3080 Ti
min:
81.67 fps, max:
324.46 fps
~ 172 fps
61%
NVIDIA GeForce RTX 3080:
60.2 [X] AMD Ryzen 9 5900X 3.7GHz
NVIDIA GeForce RTX 3080
min:
51.74 fps, max:
71.28 fps
143 [X] AMD Ryzen 9 5900X 3.7GHz
NVIDIA GeForce RTX 3080
min:
70.98 fps, max:
233.15 fps
~ 102 fps
100%
NVIDIA GeForce RTX 3090:
108 124 [X] AMD Ryzen 9 5900X 3.7GHz
NVIDIA GeForce RTX 3090
min:
65.58 fps, max:
188.71 fps
132 [X] AMD Ryzen 9 5900X 3.7GHz
NVIDIA GeForce RTX 3090
min:
72.24 fps, max:
199.88 fps
136.4 [X] Intel Core i5-13400F 2.5GHz
NVIDIA GeForce RTX 3090
min:
62.72 fps, max:
220.56 fps
136.6 [X] AMD Ryzen 7 7700X AMD Ryzen 7 7700X 4.5GHz
NVIDIA GeForce RTX 3090
min:
67.59 fps, max:
249.13 fps
137 138.5 [X] AMD Ryzen 5 7600X 4.7GHz
NVIDIA GeForce RTX 3090
min:
67.54 fps, max:
248.26 fps
140.1 [X] AMD Ryzen 9 7900X 4.7GHz
NVIDIA GeForce RTX 3090
min:
72.19 fps, max:
248.88 fps
140.8 [X] Intel Core i5-13600K 3.5GHz
NVIDIA GeForce RTX 3090
min:
71.38 fps, max:
248.76 fps
141.3 [X] Intel Core i9-13900K 3GHz
NVIDIA GeForce RTX 3090
min:
72.08 fps, max:
276.09 fps
143.7 [X] NVIDIA GeForce RTX 3090 Founders Edition AMD Ryzen 9 7950X 4.5GHz
NVIDIA GeForce RTX 3090
min:
74.95 fps, max:
260.55 fps
145 [X] Nvidia GeForce RTX 3090 FE AMD Ryzen 9 7950X 4.5GHz
NVIDIA GeForce RTX 3090
min:
73.9 fps, max:
262.61 fps
~ 135 fps
100%
NVIDIA GeForce RTX 3080 Ti:
131 131 134 137 [X] Corsair One i300 Intel Core i9-12900K 3.2GHz
NVIDIA GeForce RTX 3080 Ti
min:
66.86 fps, max:
244.08 fps
144.2 [X] AMD Ryzen 9 7950X 4.5GHz
NVIDIA GeForce RTX 3080 Ti
min:
71.71 fps, max:
266.45 fps
~ 135 fps
84%
NVIDIA GeForce RTX 3080:
111 [X] AMD Ryzen 9 5900X 3.7GHz
NVIDIA GeForce RTX 3080
min:
57.16 fps, max:
183.25 fps
116 [X] AMD Ryzen 9 5900X 3.7GHz
NVIDIA GeForce RTX 3080
min:
56.76 fps, max:
185.19 fps
~ 114 fps
100%
NVIDIA GeForce RTX 3090:
102 106 [X] AMD Ryzen 9 5900X 3.7GHz
NVIDIA GeForce RTX 3090
min:
54.88 fps, max:
173.25 fps
112 [X] AMD Ryzen 9 5900X 3.7GHz
NVIDIA GeForce RTX 3090
min:
58.69 fps, max:
182.42 fps
112.1 [X] AMD Ryzen 7 7700X AMD Ryzen 7 7700X 4.5GHz
NVIDIA GeForce RTX 3090
min:
62.79 fps, max:
185.84 fps
112.5 115.1 [X] Intel Core i5-13400F 2.5GHz
NVIDIA GeForce RTX 3090
min:
58.56 fps, max:
200.88 fps
115.4 [X] AMD Ryzen 5 7600X 4.7GHz
NVIDIA GeForce RTX 3090
min:
64.31 fps, max:
192.31 fps
115.5 [X] Intel Core i5-13600K 3.5GHz
NVIDIA GeForce RTX 3090
min:
64.74 fps, max:
189.68 fps
115.8 [X] AMD Ryzen 9 7900X 4.7GHz
NVIDIA GeForce RTX 3090
min:
65.18 fps, max:
195.12 fps
116.4 [X] Intel Core i9-13900K 3GHz
NVIDIA GeForce RTX 3090
min:
67.43 fps, max:
207.51 fps
116.9 [X] NVIDIA GeForce RTX 3090 Founders Edition AMD Ryzen 9 7950X 4.5GHz
NVIDIA GeForce RTX 3090
min:
64.78 fps, max:
197.75 fps
118.2 [X] Nvidia GeForce RTX 3090 FE AMD Ryzen 9 7950X 4.5GHz
NVIDIA GeForce RTX 3090
min:
65.8 fps, max:
192.98 fps
~ 113 fps
101%
NVIDIA GeForce RTX 3080 Ti:
110 113 [X] Corsair One i300 Intel Core i9-12900K 3.2GHz
NVIDIA GeForce RTX 3080 Ti
min:
60.76 fps, max:
190.69 fps
115 118 [X] AMD Ryzen 9 7950X 4.5GHz
NVIDIA GeForce RTX 3080 Ti
min:
65.77 fps, max:
193.84 fps
~ 114 fps
84%
NVIDIA GeForce RTX 3080:
92.2 [X] AMD Ryzen 9 5900X 3.7GHz
NVIDIA GeForce RTX 3080
min:
46.62 fps, max:
155.93 fps
97.4 [X] AMD Ryzen 9 5900X 3.7GHz
NVIDIA GeForce RTX 3080
min:
51.56 fps, max:
162.47 fps
~ 95 fps
100%
NVIDIA GeForce RTX 3090:
70.6 [X] AMD Ryzen 9 5900X 3.7GHz
NVIDIA GeForce RTX 3090
min:
41.43 fps, max:
118.98 fps
71.7 73.3 73.5 [X] AMD Ryzen 9 7950X AMD Ryzen 9 7950X 4.5GHz
NVIDIA GeForce RTX 3090
min:
46.83 fps, max:
120.34 fps
75.7 [X] Intel Core i5-13600K 3.5GHz
NVIDIA GeForce RTX 3090
min:
48.81 fps, max:
125.11 fps
75.9 [X] NVIDIA GeForce RTX 3090 Founders Edition AMD Ryzen 9 7950X 4.5GHz
NVIDIA GeForce RTX 3090
min:
48.64 fps, max:
130.4 fps
76.2 [X] Intel Core i9-13900K 3GHz
NVIDIA GeForce RTX 3090
min:
48.9 fps, max:
128.44 fps
76.3 [X] AMD Ryzen 9 5900X 3.7GHz
NVIDIA GeForce RTX 3090
min:
45.25 fps, max:
131.44 fps
76.3 [X] AMD Ryzen 5 7600X 4.7GHz
NVIDIA GeForce RTX 3090
min:
46.74 fps, max:
137.57 fps
76.6 [X] AMD Ryzen 9 7900X 4.7GHz
NVIDIA GeForce RTX 3090
min:
47.33 fps, max:
132.59 fps
76.7 [X] Nvidia GeForce RTX 3090 FE AMD Ryzen 9 7950X 4.5GHz
NVIDIA GeForce RTX 3090
min:
48.8 fps, max:
119.32 fps
77.3 [X] Intel Core i5-13400F 2.5GHz
NVIDIA GeForce RTX 3090
min:
46.79 fps, max:
122.94 fps
~ 75 fps
101%
NVIDIA GeForce RTX 3080 Ti:
74.2 75 [X] Corsair One i300 Intel Core i9-12900K 3.2GHz
NVIDIA GeForce RTX 3080 Ti
min:
46.62 fps, max:
125.88 fps
76.5 77.1 [X] AMD Ryzen 9 7950X 4.5GHz
NVIDIA GeForce RTX 3080 Ti
min:
48.66 fps, max:
128.68 fps
~ 76 fps
87%
NVIDIA GeForce RTX 3080:
64.1 [X] AMD Ryzen 9 5900X 3.7GHz
NVIDIA GeForce RTX 3080
min:
36.54 fps, max:
108.57 fps
65.9 [X] AMD Ryzen 9 5900X 3.7GHz
NVIDIA GeForce RTX 3080
min:
38.48 fps, max:
122.03 fps
~ 65 fps
100%
NVIDIA GeForce RTX 3090:
144 [X] AMD Ryzen 9 5900X 3.7GHz
NVIDIA GeForce RTX 3090
144 [X] AMD Ryzen 9 5900X 3.7GHz
NVIDIA GeForce RTX 3090
~ 144 fps
100%
NVIDIA GeForce RTX 3080:
144 [X] AMD Ryzen 9 5900X 3.7GHz
NVIDIA GeForce RTX 3080
144 [X] AMD Ryzen 9 5900X 3.7GHz
NVIDIA GeForce RTX 3080
~ 144 fps
100%
NVIDIA GeForce RTX 3090:
144 [X] AMD Ryzen 9 5900X 3.7GHz
NVIDIA GeForce RTX 3090
144 [X] AMD Ryzen 9 5900X 3.7GHz
NVIDIA GeForce RTX 3090
~ 144 fps
100%
NVIDIA GeForce RTX 3080:
144 [X] AMD Ryzen 9 5900X 3.7GHz
NVIDIA GeForce RTX 3080
144 [X] AMD Ryzen 9 5900X 3.7GHz
NVIDIA GeForce RTX 3080
min:
142 fps, max:
145 fps
~ 144 fps
100%
NVIDIA GeForce RTX 3090:
144 [X] AMD Ryzen 9 5900X 3.7GHz
NVIDIA GeForce RTX 3090
min:
143 fps, max:
145 fps
144 [X] AMD Ryzen 9 5900X 3.7GHz
NVIDIA GeForce RTX 3090
~ 144 fps
100%
NVIDIA GeForce RTX 3080:
144 [X] AMD Ryzen 9 5900X 3.7GHz
NVIDIA GeForce RTX 3080
min:
142 fps, max:
146 fps
144 [X] AMD Ryzen 9 5900X 3.7GHz
NVIDIA GeForce RTX 3080
min:
142 fps, max:
145 fps
~ 144 fps
100%
NVIDIA GeForce RTX 3090:
139 [X] AMD Ryzen 9 5900X 3.7GHz
NVIDIA GeForce RTX 3090
min:
126 fps, max:
145 fps
142.3 [X] AMD Ryzen 9 5900X 3.7GHz
NVIDIA GeForce RTX 3090
~ 141 fps
101%
NVIDIA GeForce RTX 3080:
140 [X] AMD Ryzen 9 5900X 3.7GHz
NVIDIA GeForce RTX 3080
min:
128 fps, max:
146 fps
143 [X] AMD Ryzen 9 5900X 3.7GHz
NVIDIA GeForce RTX 3080
min:
135 fps, max:
146 fps
~ 142 fps
100%
NVIDIA GeForce RTX 3090:
179.4 [X] AMD Ryzen 9 5900X 3.7GHz
NVIDIA GeForce RTX 3090
184 [X] AMD Ryzen 9 5900X 3.7GHz
NVIDIA GeForce RTX 3090
~ 182 fps
104%
NVIDIA GeForce RTX 3080:
187.3 [X] AMD Ryzen 9 5900X 3.7GHz
NVIDIA GeForce RTX 3080
192 [X] AMD Ryzen 9 5900X 3.7GHz
NVIDIA GeForce RTX 3080
min:
151 fps, max:
202 fps
~ 190 fps
100%
NVIDIA GeForce RTX 3090:
164 [X] AMD Ryzen 9 5900X 3.7GHz
NVIDIA GeForce RTX 3090
172.3 [X] AMD Ryzen 9 5900X 3.7GHz
NVIDIA GeForce RTX 3090
184 ~ 173 fps
99%
NVIDIA GeForce RTX 3080:
165.8 [X] AMD Ryzen 9 5900X 3.7GHz
NVIDIA GeForce RTX 3080
178 [X] AMD Ryzen 9 5900X 3.7GHz
NVIDIA GeForce RTX 3080
min:
151 fps, max:
200 fps
~ 172 fps
100%
NVIDIA GeForce RTX 3090:
151 [X] AMD Ryzen 9 5900X 3.7GHz
NVIDIA GeForce RTX 3090
157.6 [X] AMD Ryzen 9 5900X 3.7GHz
NVIDIA GeForce RTX 3090
188 ~ 166 fps
94%
NVIDIA GeForce RTX 3080:
148.6 [X] AMD Ryzen 9 5900X 3.7GHz
NVIDIA GeForce RTX 3080
163 [X] AMD Ryzen 9 5900X 3.7GHz
NVIDIA GeForce RTX 3080
min:
140 fps, max:
199 fps
~ 156 fps
100%
NVIDIA GeForce RTX 3090:
141 [X] AMD Ryzen 9 5900X 3.7GHz
NVIDIA GeForce RTX 3090
145.8 [X] AMD Ryzen 9 5900X 3.7GHz
NVIDIA GeForce RTX 3090
187 ~ 158 fps
124%
NVIDIA GeForce RTX 3080 Ti:
196 fps
92%
NVIDIA GeForce RTX 3080:
137.9 [X] AMD Ryzen 9 5900X 3.7GHz
NVIDIA GeForce RTX 3080
152 [X] AMD Ryzen 9 5900X 3.7GHz
NVIDIA GeForce RTX 3080
min:
126 fps, max:
199 fps
~ 145 fps
100%
NVIDIA GeForce RTX 3090:
124 [X] AMD Ryzen 9 5900X 3.7GHz
NVIDIA GeForce RTX 3090
129.5 [X] AMD Ryzen 9 5900X 3.7GHz
NVIDIA GeForce RTX 3090
178 ~ 144 fps
133%
NVIDIA GeForce RTX 3080 Ti:
192 fps
86%
NVIDIA GeForce RTX 3080:
116.1 [X] AMD Ryzen 9 5900X 3.7GHz
NVIDIA GeForce RTX 3080
132 [X] AMD Ryzen 9 5900X 3.7GHz
NVIDIA GeForce RTX 3080
min:
109 fps, max:
179 fps
~ 124 fps
100%
NVIDIA GeForce RTX 3090:
94 [X] AMD Ryzen 9 5900X 3.7GHz
NVIDIA GeForce RTX 3090
95.8 [X] AMD Ryzen 9 5900X 3.7GHz
NVIDIA GeForce RTX 3090
130 130 ~ 112 fps
121%
NVIDIA GeForce RTX 3080 Ti:
136 fps
81%
NVIDIA GeForce RTX 3080:
87.2 [X] AMD Ryzen 9 5900X 3.7GHz
NVIDIA GeForce RTX 3080
94.2 [X] AMD Ryzen 9 5900X 3.7GHz
NVIDIA GeForce RTX 3080
min:
78 fps, max:
135 fps
~ 91 fps
100%
NVIDIA GeForce RTX 3090:
102 fps
100%
NVIDIA GeForce RTX 3090:
93.6 fps
100%
NVIDIA GeForce RTX 3090:
95.1 fps
100%
NVIDIA GeForce RTX 3090:
91.4 fps
100%
NVIDIA GeForce RTX 3090:
91.2 fps
100%
NVIDIA GeForce RTX 3090:
236 [X] Nvidia GeForce RTX 3090 FE Intel Core i9-14900K 3.2GHz
NVIDIA GeForce RTX 3090
min:
79 fps, max:
335 fps
fps
100%
NVIDIA GeForce RTX 3090:
138 179 [X] Nvidia GeForce RTX 3090 FE Intel Core i9-14900K 3.2GHz
NVIDIA GeForce RTX 3090
min:
82 fps, max:
283 fps
~ 159 fps
100%
NVIDIA GeForce RTX 3090:
121 164 [X] Nvidia GeForce RTX 3090 FE Intel Core i9-14900K 3.2GHz
NVIDIA GeForce RTX 3090
min:
88 fps, max:
262 fps
~ 143 fps
100%
NVIDIA GeForce RTX 3090:
92 123 [X] Nvidia GeForce RTX 3090 FE Intel Core i9-14900K 3.2GHz
NVIDIA GeForce RTX 3090
min:
17 fps, max:
239 fps
~ 108 fps
100%
NVIDIA GeForce RTX 3090:
82 104 [X] Nvidia GeForce RTX 3090 FE Intel Core i9-14900K 3.2GHz
NVIDIA GeForce RTX 3090
min:
25 fps, max:
223 fps
~ 93 fps
100%
NVIDIA GeForce RTX 3090:
65 74 [X] Nvidia GeForce RTX 3090 FE Intel Core i9-14900K 3.2GHz
NVIDIA GeForce RTX 3090
min:
53 fps, max:
117 fps
~ 70 fps
100%
NVIDIA GeForce RTX 3090:
175 fps
100%
NVIDIA GeForce RTX 3090:
175 fps
100%
NVIDIA GeForce RTX 3090:
166 fps
100%
NVIDIA GeForce RTX 3090:
164 fps
100%
NVIDIA GeForce RTX 3090:
147 fps
100%
NVIDIA GeForce RTX 3090:
201 [X] AMD Ryzen 9 5900X 3.7GHz
NVIDIA GeForce RTX 3090
max:
308.7 fps
206 [X] AMD Ryzen 9 5900X 3.7GHz
NVIDIA GeForce RTX 3090
217 [X] Intel Core i5-13400F 2.5GHz
NVIDIA GeForce RTX 3090
max:
338.5 fps
269 [X] Intel Core i5-13600K 3.5GHz
NVIDIA GeForce RTX 3090
max:
374.1 fps
299 [X] AMD Ryzen 5 7600X 4.7GHz
NVIDIA GeForce RTX 3090
max:
454.9 fps
304 307 314 [X] AMD Ryzen 9 7900X 4.7GHz
NVIDIA GeForce RTX 3090
max:
487.8 fps
314 [X] Intel Core i9-13900K 3GHz
NVIDIA GeForce RTX 3090
max:
455.7 fps
338 [X] Nvidia GeForce RTX 3090 FE AMD Ryzen 9 7950X 4.5GHz
NVIDIA GeForce RTX 3090
max:
497 fps
351 [X] NVIDIA GeForce RTX 3090 Founders Edition AMD Ryzen 9 7950X 4.5GHz
NVIDIA GeForce RTX 3090
max:
497.9 fps
~ 284 fps
102%
NVIDIA GeForce RTX 3080 Ti:
245 336 [X] AMD Ryzen 9 7950X 4.5GHz
NVIDIA GeForce RTX 3080 Ti
max:
496.5 fps
~ 291 fps
74%
NVIDIA GeForce RTX 3080:
191 [X] AMD Ryzen 9 5900X 3.7GHz
NVIDIA GeForce RTX 3080
max:
303 fps
227 [X] AMD Ryzen 9 5900X 3.7GHz
NVIDIA GeForce RTX 3080
max:
351.7 fps
~ 209 fps
100%
NVIDIA GeForce RTX 3090:
148 148 193 [X] AMD Ryzen 9 5900X 3.7GHz
NVIDIA GeForce RTX 3090
max:
287.2 fps
194 [X] AMD Ryzen 9 5900X 3.7GHz
NVIDIA GeForce RTX 3090
207 [X] Intel Core i5-13400F 2.5GHz
NVIDIA GeForce RTX 3090
max:
299.2 fps
240 [X] Intel Core i5-13600K 3.5GHz
NVIDIA GeForce RTX 3090
max:
341.8 fps
251 [X] AMD Ryzen 5 7600X 4.7GHz
NVIDIA GeForce RTX 3090
max:
417.1 fps
252 255 261 [X] AMD Ryzen 9 7900X 4.7GHz
NVIDIA GeForce RTX 3090
max:
438.7 fps
265 [X] Intel Core i9-13900K 3GHz
NVIDIA GeForce RTX 3090
max:
410.4 fps
271 [X] NVIDIA GeForce RTX 3090 Founders Edition AMD Ryzen 9 7950X 4.5GHz
NVIDIA GeForce RTX 3090
max:
475.3 fps
272 [X] Nvidia GeForce RTX 3090 FE AMD Ryzen 9 7950X 4.5GHz
NVIDIA GeForce RTX 3090
max:
469.5 fps
~ 227 fps
109%
NVIDIA GeForce RTX 3080 Ti:
226 267 [X] AMD Ryzen 9 7950X 4.5GHz
NVIDIA GeForce RTX 3080 Ti
max:
450.5 fps
~ 247 fps
85%
NVIDIA GeForce RTX 3080:
181 [X] AMD Ryzen 9 5900X 3.7GHz
NVIDIA GeForce RTX 3080
max:
284.7 fps
206 [X] AMD Ryzen 9 5900X 3.7GHz
NVIDIA GeForce RTX 3080
max:
311.5 fps
~ 194 fps
100%
NVIDIA GeForce RTX 3090:
148 148 177 [X] AMD Ryzen 9 5900X 3.7GHz
NVIDIA GeForce RTX 3090
max:
280.8 fps
199 [X] AMD Ryzen 9 5900X 3.7GHz
NVIDIA GeForce RTX 3090
205 [X] Intel Core i5-13400F 2.5GHz
NVIDIA GeForce RTX 3090
max:
305.5 fps
234 [X] Intel Core i5-13600K 3.5GHz
NVIDIA GeForce RTX 3090
max:
339.8 fps
240 241 [X] AMD Ryzen 5 7600X 4.7GHz
NVIDIA GeForce RTX 3090
max:
414.3 fps
247 250 [X] Intel Core i9-13900K 3GHz
NVIDIA GeForce RTX 3090
max:
409.2 fps
251 [X] AMD Ryzen 9 7900X 4.7GHz
NVIDIA GeForce RTX 3090
max:
434.3 fps
253 [X] NVIDIA GeForce RTX 3090 Founders Edition AMD Ryzen 9 7950X 4.5GHz
NVIDIA GeForce RTX 3090
max:
436.7 fps
258 [X] Nvidia GeForce RTX 3090 FE AMD Ryzen 9 7950X 4.5GHz
NVIDIA GeForce RTX 3090
max:
439.1 fps
~ 219 fps
110%
NVIDIA GeForce RTX 3080 Ti:
226 254 [X] AMD Ryzen 9 7950X 4.5GHz
NVIDIA GeForce RTX 3080 Ti
max:
430.5 fps
~ 240 fps
88%
NVIDIA GeForce RTX 3080:
186 [X] AMD Ryzen 9 5900X 3.7GHz
NVIDIA GeForce RTX 3080
max:
289.9 fps
198 [X] AMD Ryzen 9 5900X 3.7GHz
NVIDIA GeForce RTX 3080
max:
305.9 fps
~ 192 fps
100%
NVIDIA GeForce RTX 3090:
145 145 145 187 [X] AMD Ryzen 9 5900X 3.7GHz
NVIDIA GeForce RTX 3090
188 [X] AMD Ryzen 9 5900X 3.7GHz
NVIDIA GeForce RTX 3090
max:
284.8 fps
198 [X] Intel Core i5-13400F 2.5GHz
NVIDIA GeForce RTX 3090
max:
321.1 fps
220 [X] Intel Core i5-13600K 3.5GHz
NVIDIA GeForce RTX 3090
max:
338.8 fps
223 228 [X] AMD Ryzen 5 7600X 4.7GHz
NVIDIA GeForce RTX 3090
max:
414.2 fps
230 [X] Intel Core i9-13900K 3GHz
NVIDIA GeForce RTX 3090
max:
398.5 fps
232 234 [X] AMD Ryzen 9 7900X 4.7GHz
NVIDIA GeForce RTX 3090
max:
418.9 fps
234 [X] NVIDIA GeForce RTX 3090 Founders Edition AMD Ryzen 9 7950X 4.5GHz
NVIDIA GeForce RTX 3090
max:
416 fps
240 [X] Nvidia GeForce RTX 3090 FE AMD Ryzen 9 7950X 4.5GHz
NVIDIA GeForce RTX 3090
max:
416.3 fps
~ 204 fps
102%
NVIDIA GeForce RTX 3080 Ti:
178 212 238 [X] AMD Ryzen 9 7950X 4.5GHz
NVIDIA GeForce RTX 3080 Ti
max:
420.9 fps
~ 209 fps
89%
NVIDIA GeForce RTX 3080:
177 [X] AMD Ryzen 9 5900X 3.7GHz
NVIDIA GeForce RTX 3080
max:
279.3 fps
185 [X] AMD Ryzen 9 5900X 3.7GHz
NVIDIA GeForce RTX 3080
max:
292.7 fps
~ 181 fps
100%
NVIDIA GeForce RTX 3090:
137 159 [X] AMD Ryzen 9 5900X 3.7GHz
NVIDIA GeForce RTX 3090
162 [X] AMD Ryzen 9 5900X 3.7GHz
NVIDIA GeForce RTX 3090
max:
257.2 fps
167.1 [X] Intel Core i5-13600K 3.5GHz
NVIDIA GeForce RTX 3090
max:
272.9 fps
167.4 [X] Intel Core i9-13900K 3GHz
NVIDIA GeForce RTX 3090
max:
272.1 fps
168 168.9 [X] NVIDIA GeForce RTX 3090 Founders Edition AMD Ryzen 9 7950X 4.5GHz
NVIDIA GeForce RTX 3090
max:
265.9 fps
169 172 [X] AMD Ryzen 5 7600X 4.7GHz
NVIDIA GeForce RTX 3090
max:
277 fps
172.2 [X] AMD Ryzen 9 7900X 4.7GHz
NVIDIA GeForce RTX 3090
max:
277.7 fps
172.2 [X] Intel Core i5-13400F 2.5GHz
NVIDIA GeForce RTX 3090
max:
273.9 fps
172.3 [X] Nvidia GeForce RTX 3090 FE AMD Ryzen 9 7950X 4.5GHz
NVIDIA GeForce RTX 3090
max:
279.2 fps
~ 166 fps
99%
NVIDIA GeForce RTX 3080 Ti:
157 164 173.3 [X] AMD Ryzen 9 7950X 4.5GHz
NVIDIA GeForce RTX 3080 Ti
max:
275.1 fps
~ 165 fps
90%
NVIDIA GeForce RTX 3080:
147 [X] AMD Ryzen 9 5900X 3.7GHz
NVIDIA GeForce RTX 3080
max:
226.7 fps
152 [X] AMD Ryzen 9 5900X 3.7GHz
NVIDIA GeForce RTX 3080
max:
247.3 fps
~ 150 fps
100%
NVIDIA GeForce RTX 3090:
89.3 94 [X] AMD Ryzen 9 5900X 3.7GHz
NVIDIA GeForce RTX 3090
95.6 [X] AMD Ryzen 9 5900X 3.7GHz
NVIDIA GeForce RTX 3090
max:
147.9 fps
96 96 96.4 [X] Intel Core i5-13600K 3.5GHz
NVIDIA GeForce RTX 3090
max:
144.2 fps
96.9 [X] NVIDIA GeForce RTX 3090 Founders Edition AMD Ryzen 9 7950X 4.5GHz
NVIDIA GeForce RTX 3090
max:
143.2 fps
97.1 [X] Intel Core i9-13900K 3GHz
NVIDIA GeForce RTX 3090
max:
145.6 fps
98 [X] Intel Core i5-13400F 2.5GHz
NVIDIA GeForce RTX 3090
max:
146.1 fps
98.4 [X] Nvidia GeForce RTX 3090 FE AMD Ryzen 9 7950X 4.5GHz
NVIDIA GeForce RTX 3090
max:
146.8 fps
99.6 [X] AMD Ryzen 9 7900X 4.7GHz
NVIDIA GeForce RTX 3090
max:
149.8 fps
99.7 [X] AMD Ryzen 5 7600X 4.7GHz
NVIDIA GeForce RTX 3090
max:
149.1 fps
~ 96 fps
99%
NVIDIA GeForce RTX 3080 Ti:
93 93.7 98.6 [X] AMD Ryzen 9 7950X 4.5GHz
NVIDIA GeForce RTX 3080 Ti
max:
146 fps
~ 95 fps
90%
NVIDIA GeForce RTX 3080:
83.9 [X] AMD Ryzen 9 5900X 3.7GHz
NVIDIA GeForce RTX 3080
max:
136.5 fps
87.9 [X] AMD Ryzen 9 5900X 3.7GHz
NVIDIA GeForce RTX 3080
max:
145.6 fps
~ 86 fps
100%
NVIDIA GeForce RTX 3090:
402 [X] 1.47.22.14 D3D12
AMD Ryzen 9 5900X 3.7GHz
NVIDIA GeForce RTX 3090
min:
115 fps, P1:
294 fps, max:
654 fps
437 [X] 1.47.22.14 D3D12
Intel Core i5-13400F 2.5GHz
NVIDIA GeForce RTX 3090
min:
60.1 fps, P1:
332 fps, max:
666 fps
481 [X] MSI MEG Z590 ACE 1.47.22.14 D3D12
Intel Core i9-11900K 3.5GHz
NVIDIA GeForce RTX 3090
min:
37.6 fps, P1:
365 fps, max:
780 fps
525 [X] 1.47.22.14 D3D12
AMD Ryzen 9 5900X 3.7GHz
NVIDIA GeForce RTX 3090
min:
165 fps, P1:
414 fps, max:
745 fps
679 [X] 1.47.22.14 D3D12
Intel Core i5-13600K 3.5GHz
NVIDIA GeForce RTX 3090
min:
62 fps, P1:
496 fps, max:
977 fps
694 [X] AMD Ryzen 9 7950X 1.47.22.14 D3D12
AMD Ryzen 9 7950X 4.5GHz
NVIDIA GeForce RTX 3090
min:
143.1 fps, P1:
555 fps, max:
934 fps
701 [X] Nvidia GeForce RTX 3090 FE 1.47.22.14 D3D12
AMD Ryzen 9 7950X 4.5GHz
NVIDIA GeForce RTX 3090
min:
212 fps, P1:
561 fps, max:
945 fps
739 [X] NVIDIA GeForce RTX 3090 Founders Edition 1.47.22.14 D3D12
AMD Ryzen 9 7950X 4.5GHz
NVIDIA GeForce RTX 3090
min:
60 fps, P1:
584 fps, max:
1002 fps
741 [X] 1.47.22.14 D3D12
AMD Ryzen 9 7900X 4.7GHz
NVIDIA GeForce RTX 3090
min:
352 fps, P1:
583 fps, max:
1009 fps
749 [X] 1.47.22.14 D3D12
Intel Core i9-13900K 3GHz
NVIDIA GeForce RTX 3090
min:
60.3 fps, P1:
591 fps, max:
1040 fps
756 [X] AMD Ryzen 7 7700 1.47.22.14 D3D12
AMD Ryzen 7 7700 3.8GHz
NVIDIA GeForce RTX 3090
min:
144 fps, P1:
586 fps, max:
1093 fps
797 [X] AMD Ryzen 7 7700X 1.47.22.14 D3D12
AMD Ryzen 7 7700X 4.5GHz
NVIDIA GeForce RTX 3090
min:
143.3 fps, P1:
618 fps, max:
1190 fps
819 [X] 1.47.22.14 D3D12
AMD Ryzen 5 7600X 4.7GHz
NVIDIA GeForce RTX 3090
min:
60.2 fps, P1:
627 fps, max:
1175 fps
~ 655 fps
100%
NVIDIA GeForce RTX 3080 Ti:
613 667 [X] Corsair One i300 1.47.22.14 D3D12
Intel Core i9-12900K 3.2GHz
NVIDIA GeForce RTX 3080 Ti
min:
61.1 fps, P1:
507 fps, max:
980 fps
692 [X] 1.47.22.14 D3D12
AMD Ryzen 9 7950X 4.5GHz
NVIDIA GeForce RTX 3080 Ti
min:
60.2 fps, P1:
551 fps, max:
930 fps
~ 657 fps
76%
NVIDIA GeForce RTX 3080:
426 [X] 1.47.22.14 D3D12
AMD Ryzen 9 5900X 3.7GHz
NVIDIA GeForce RTX 3080
min:
108 fps, P1:
304 fps, max:
712 fps
567 [X] 1.47.22.14 D3D12
AMD Ryzen 9 5900X 3.7GHz
NVIDIA GeForce RTX 3080
min:
319 fps, P1:
450 fps, max:
775 fps
~ 497 fps
100%
NVIDIA GeForce RTX 3090:
342 [X] 1.47.22.14 D3D12
AMD Ryzen 9 5900X 3.7GHz
NVIDIA GeForce RTX 3090
min:
97.3 fps, P1:
244 fps, max:
548 fps
343 [X] 1.47.22.14 D3D12
Intel Core i5-13400F 2.5GHz
NVIDIA GeForce RTX 3090
min:
63.6 fps, P1:
248 fps, max:
528 fps
392 [X] MSI MEG Z590 ACE 1.47.22.14 D3D12
Intel Core i9-11900K 3.5GHz
NVIDIA GeForce RTX 3090
min:
37.4 fps, P1:
294 fps, max:
603 fps
415 [X] 1.47.22.14 D3D12
AMD Ryzen 9 5900X 3.7GHz
NVIDIA GeForce RTX 3090
min:
72.5 fps, P1:
314 fps, max:
600 fps
479 [X] 1.47.22.14 D3D12
AMD Ryzen 9 7900X 4.7GHz
NVIDIA GeForce RTX 3090
min:
278 fps, P1:
386 fps, max:
670 fps
487 [X] 1.47.22.14 D3D12
Intel Core i5-13600K 3.5GHz
NVIDIA GeForce RTX 3090
min:
59.7 fps, P1:
381 fps, max:
698 fps
503 [X] AMD Ryzen 9 7950X 1.47.22.14 D3D12
AMD Ryzen 9 7950X 4.5GHz
NVIDIA GeForce RTX 3090
min:
143.9 fps, P1:
413 fps, max:
710 fps
506 [X] 1.47.22.14 D3D12
Intel Core i9-13900K 3GHz
NVIDIA GeForce RTX 3090
min:
60.1 fps, P1:
434 fps, max:
661 fps
509 [X] AMD Ryzen 7 7700X 1.47.22.14 D3D12
AMD Ryzen 7 7700X 4.5GHz
NVIDIA GeForce RTX 3090
min:
110.2 fps, P1:
436 fps, max:
730 fps
510 [X] 1.47.22.14 D3D12
AMD Ryzen 5 7600X 4.7GHz
NVIDIA GeForce RTX 3090
min:
60 fps, P1:
447 fps, max:
732 fps
514 [X] Nvidia GeForce RTX 3090 FE 1.47.22.14 D3D12
AMD Ryzen 9 7950X 4.5GHz
NVIDIA GeForce RTX 3090
min:
261 fps, P1:
408 fps, max:
720 fps
529 [X] NVIDIA GeForce RTX 3090 Founders Edition 1.47.22.14 D3D12
AMD Ryzen 9 7950X 4.5GHz
NVIDIA GeForce RTX 3090
min:
58.5 fps, P1:
443 fps, max:
748 fps
542 [X] AMD Ryzen 7 7700 1.47.22.14 D3D12
AMD Ryzen 7 7700 3.8GHz
NVIDIA GeForce RTX 3090
min:
110.1 fps, P1:
429 fps, max:
757 fps
~ 467 fps
107%
NVIDIA GeForce RTX 3080 Ti:
484 [X] Corsair One i300 1.47.22.14 D3D12
Intel Core i9-12900K 3.2GHz
NVIDIA GeForce RTX 3080 Ti
min:
59.9 fps, P1:
383 fps, max:
668 fps
489 523 [X] 1.47.22.14 D3D12
AMD Ryzen 9 7950X 4.5GHz
NVIDIA GeForce RTX 3080 Ti
min:
60.3 fps, P1:
425 fps, max:
718 fps
~ 499 fps
82%
NVIDIA GeForce RTX 3080:
350 [X] 1.47.22.14 D3D12
AMD Ryzen 9 5900X 3.7GHz
NVIDIA GeForce RTX 3080
min:
98.1 fps, P1:
247 fps, max:
593 fps
416 [X] 1.47.22.14 D3D12
AMD Ryzen 9 5900X 3.7GHz
NVIDIA GeForce RTX 3080
min:
158 fps, P1:
326 fps, max:
578 fps
~ 383 fps
100%
NVIDIA GeForce RTX 3090:
330 [X] 1.47.22.14 D3D12
AMD Ryzen 9 5900X 3.7GHz
NVIDIA GeForce RTX 3090
min:
71.8 fps, P1:
243 fps, max:
562 fps
336 [X] 1.47.22.14 D3D12
Intel Core i5-13400F 2.5GHz
NVIDIA GeForce RTX 3090
min:
63.1 fps, P1:
246 fps, max:
521 fps
358 [X] MSI MEG Z590 ACE 1.47.22.14 D3D12
Intel Core i9-11900K 3.5GHz
NVIDIA GeForce RTX 3090
min:
32.4 fps, P1:
273 fps, max:
593 fps
372 [X] 1.47.22.14 D3D12
AMD Ryzen 9 5900X 3.7GHz
NVIDIA GeForce RTX 3090
min:
197 fps, P1:
271 fps, max:
609 fps
380 [X] 1.47.22.14 D3D12
AMD Ryzen 9 7900X 4.7GHz
NVIDIA GeForce RTX 3090
min:
240 fps, P1:
268 fps, max:
619 fps
398 [X] 1.47.22.14 D3D12
Intel Core i5-13600K 3.5GHz
NVIDIA GeForce RTX 3090
min:
57.7 fps, P1:
288 fps, max:
630 fps
402 [X] 1.47.22.14 D3D12
AMD Ryzen 5 7600X 4.7GHz
NVIDIA GeForce RTX 3090
min:
58.6 fps, P1:
291 fps, max:
720 fps
402 [X] 1.47.22.14 D3D12
Intel Core i9-13900K 3GHz
NVIDIA GeForce RTX 3090
min:
55.4 fps, P1:
289 fps, max:
777 fps
404 [X] AMD Ryzen 9 7950X 1.47.22.14 D3D12
AMD Ryzen 9 7950X 4.5GHz
NVIDIA GeForce RTX 3090
min:
120 fps, P1:
286 fps, max:
608 fps
404 [X] AMD Ryzen 7 7700X 1.47.22.14 D3D12
AMD Ryzen 7 7700X 4.5GHz
NVIDIA GeForce RTX 3090
min:
115.9 fps, P1:
286 fps, max:
673 fps
417 [X] NVIDIA GeForce RTX 3090 Founders Edition 1.47.22.14 D3D12
AMD Ryzen 9 7950X 4.5GHz
NVIDIA GeForce RTX 3090
min:
59.3 fps, P1:
299 fps, max:
655 fps
417 [X] Nvidia GeForce RTX 3090 FE 1.47.22.14 D3D12
AMD Ryzen 9 7950X 4.5GHz
NVIDIA GeForce RTX 3090
min:
195.1 fps, P1:
296 fps, max:
645 fps
433 [X] AMD Ryzen 7 7700 1.47.22.14 D3D12
AMD Ryzen 7 7700 3.8GHz
NVIDIA GeForce RTX 3090
min:
63.6 fps, P1:
311 fps, max:
671 fps
~ 389 fps
104%
NVIDIA GeForce RTX 3080 Ti:
392 [X] Corsair One i300 1.47.22.14 D3D12
Intel Core i9-12900K 3.2GHz
NVIDIA GeForce RTX 3080 Ti
min:
59.7 fps, P1:
282 fps, max:
602 fps
407 415 [X] 1.47.22.14 D3D12
AMD Ryzen 9 7950X 4.5GHz
NVIDIA GeForce RTX 3080 Ti
min:
60 fps, P1:
296 fps, max:
642 fps
~ 405 fps
84%
NVIDIA GeForce RTX 3080:
315 [X] 1.47.22.14 D3D12
AMD Ryzen 9 5900X 3.7GHz
NVIDIA GeForce RTX 3080
min:
87.3 fps, P1:
235 fps, max:
597 fps
336 [X] 1.47.22.14 D3D12
AMD Ryzen 9 5900X 3.7GHz
NVIDIA GeForce RTX 3080
min:
54.3 fps, P1:
241 fps, max:
555 fps
~ 326 fps
100%
NVIDIA GeForce RTX 3090:
315 [X] 1.47.22.14 D3D12
AMD Ryzen 9 5900X 3.7GHz
NVIDIA GeForce RTX 3090
min:
112 fps, P1:
232 fps, max:
541 fps
325 [X] 1.47.22.14 D3D12
Intel Core i5-13400F 2.5GHz
NVIDIA GeForce RTX 3090
min:
60.4 fps, P1:
238 fps, max:
485 fps
329 [X] 1.47.22.14 D3D12
AMD Ryzen 9 7900X 4.7GHz
NVIDIA GeForce RTX 3090
min:
127.3 fps, P1:
237 fps, max:
482 fps
330 [X] 1.47.22.14 D3D12
AMD Ryzen 9 5900X 3.7GHz
NVIDIA GeForce RTX 3090
min:
155 fps, P1:
240 fps, max:
501 fps
334 [X] MSI MEG Z590 ACE 1.47.22.14 D3D12
Intel Core i9-11900K 3.5GHz
NVIDIA GeForce RTX 3090
min:
36.4 fps, P1:
249 fps, max:
541 fps
348 [X] 1.47.22.14 D3D12
Intel Core i5-13600K 3.5GHz
NVIDIA GeForce RTX 3090
min:
59.9 fps, P1:
256 fps, max:
588 fps
350 [X] 1.47.22.14 D3D12
Intel Core i9-13900K 3GHz
NVIDIA GeForce RTX 3090
min:
57.6 fps, P1:
258 fps, max:
542 fps
351 [X] AMD Ryzen 9 7950X 1.47.22.14 D3D12
AMD Ryzen 9 7950X 4.5GHz
NVIDIA GeForce RTX 3090
min:
100.5 fps, P1:
254 fps, max:
587 fps
352 [X] AMD Ryzen 7 7700X 1.47.22.14 D3D12
AMD Ryzen 7 7700X 4.5GHz
NVIDIA GeForce RTX 3090
min:
110.9 fps, P1:
256 fps, max:
616 fps
354 [X] 1.47.22.14 D3D12
AMD Ryzen 5 7600X 4.7GHz
NVIDIA GeForce RTX 3090
min:
60 fps, P1:
259 fps, max:
697 fps
361 [X] NVIDIA GeForce RTX 3090 Founders Edition 1.47.22.14 D3D12
AMD Ryzen 9 7950X 4.5GHz
NVIDIA GeForce RTX 3090
min:
59.3 fps, P1:
263 fps, max:
644 fps
362 [X] Nvidia GeForce RTX 3090 FE 1.47.22.14 D3D12
AMD Ryzen 9 7950X 4.5GHz
NVIDIA GeForce RTX 3090
min:
138.2 fps, P1:
264 fps, max:
648 fps
378 [X] AMD Ryzen 7 7700 1.47.22.14 D3D12
AMD Ryzen 7 7700 3.8GHz
NVIDIA GeForce RTX 3090
min:
125.8 fps, P1:
276 fps, max:
632 fps
~ 345 fps
103%
NVIDIA GeForce RTX 3080 Ti:
345 [X] Corsair One i300 1.47.22.14 D3D12
Intel Core i9-12900K 3.2GHz
NVIDIA GeForce RTX 3080 Ti
min:
60 fps, P1:
254 fps, max:
551 fps
359 360 [X] 1.47.22.14 D3D12
AMD Ryzen 9 7950X 4.5GHz
NVIDIA GeForce RTX 3080 Ti
min:
59.5 fps, P1:
263 fps, max:
584 fps
~ 355 fps
83%
NVIDIA GeForce RTX 3080:
285 [X] 1.47.22.14 D3D12
AMD Ryzen 9 5900X 3.7GHz
NVIDIA GeForce RTX 3080
min:
135 fps, P1:
210 fps, max:
472 fps
289 [X] 1.47.22.14 D3D12
AMD Ryzen 9 5900X 3.7GHz
NVIDIA GeForce RTX 3080
min:
116 fps, P1:
212 fps, max:
510 fps
~ 287 fps
100%
NVIDIA GeForce RTX 3090:
244 [X] 1.47.22.14 D3D12
AMD Ryzen 9 5900X 3.7GHz
NVIDIA GeForce RTX 3090
min:
108 fps, P1:
185 fps, max:
381 fps
249 [X] 1.47.22.14 D3D12
AMD Ryzen 9 7900X 4.7GHz
NVIDIA GeForce RTX 3090
min:
79.9 fps, P1:
187.6 fps, max:
490 fps
255 [X] 1.47.22.14 D3D12
AMD Ryzen 9 5900X 3.7GHz
NVIDIA GeForce RTX 3090
min:
78.4 fps, P1:
195 fps, max:
407 fps
262 [X] MSI MEG Z590 ACE 1.47.22.14 D3D12
Intel Core i9-11900K 3.5GHz
NVIDIA GeForce RTX 3090
min:
29.9 fps, P1:
200 fps, max:
445 fps
263 [X] AMD Ryzen 7 7700X 1.47.22.14 D3D12
AMD Ryzen 7 7700X 4.5GHz
NVIDIA GeForce RTX 3090
min:
74 fps, P1:
203 fps, max:
626 fps
265 [X] 1.47.22.14 D3D12
Intel Core i5-13600K 3.5GHz
NVIDIA GeForce RTX 3090
min:
60 fps, P1:
206 fps, max:
531 fps
265 [X] AMD Ryzen 9 7950X 1.47.22.14 D3D12
AMD Ryzen 9 7950X 4.5GHz
NVIDIA GeForce RTX 3090
min:
105.1 fps, P1:
203 fps, max:
611 fps
266 [X] 1.47.22.14 D3D12
Intel Core i9-13900K 3GHz
NVIDIA GeForce RTX 3090
min:
48.4 fps, P1:
208 fps, max:
631 fps
267 [X] 1.47.22.14 D3D12
Intel Core i5-13400F 2.5GHz
NVIDIA GeForce RTX 3090
min:
60 fps, P1:
206 fps, max:
412 fps
270 [X] 1.47.22.14 D3D12
AMD Ryzen 5 7600X 4.7GHz
NVIDIA GeForce RTX 3090
min:
59.7 fps, P1:
210 fps, max:
632 fps
270 [X] NVIDIA GeForce RTX 3090 Founders Edition 1.47.22.14 D3D12
AMD Ryzen 9 7950X 4.5GHz
NVIDIA GeForce RTX 3090
min:
59.5 fps, P1:
207 fps, max:
554 fps
271 [X] Nvidia GeForce RTX 3090 FE 1.47.22.14 D3D12
AMD Ryzen 9 7950X 4.5GHz
NVIDIA GeForce RTX 3090
min:
141.2 fps, P1:
209 fps, max:
516 fps
282 [X] AMD Ryzen 7 7700 1.47.22.14 D3D12
AMD Ryzen 7 7700 3.8GHz
NVIDIA GeForce RTX 3090
min:
124.9 fps, P1:
217 fps, max:
606 fps
~ 264 fps
101%
NVIDIA GeForce RTX 3080 Ti:
260 [X] Corsair One i300 1.47.22.14 D3D12
Intel Core i9-12900K 3.2GHz
NVIDIA GeForce RTX 3080 Ti
min:
59.9 fps, P1:
200 fps, max:
554 fps
269 270 [X] 1.47.22.14 D3D12
AMD Ryzen 9 7950X 4.5GHz
NVIDIA GeForce RTX 3080 Ti
min:
59 fps, P1:
208 fps, max:
613 fps
~ 266 fps
83%
NVIDIA GeForce RTX 3080:
218 [X] 1.47.22.14 D3D12
AMD Ryzen 9 5900X 3.7GHz
NVIDIA GeForce RTX 3080
min:
83.1 fps, P1:
168 fps, max:
333 fps
220 [X] 1.47.22.14 D3D12
AMD Ryzen 9 5900X 3.7GHz
NVIDIA GeForce RTX 3080
min:
17.7 fps, P1:
169 fps, max:
442 fps
~ 219 fps
100%
NVIDIA GeForce RTX 3090:
150 [X] 1.47.22.14 D3D12
AMD Ryzen 9 5900X 3.7GHz
NVIDIA GeForce RTX 3090
min:
99 fps, P1:
124 fps, max:
238 fps
153.1 [X] 1.47.22.14 D3D12
AMD Ryzen 9 7900X 4.7GHz
NVIDIA GeForce RTX 3090
min:
118.2 fps, P1:
123.8 fps, max:
211 fps
157.6 [X] AMD Ryzen 7 7700X 1.47.22.14 D3D12
AMD Ryzen 7 7700X 4.5GHz
NVIDIA GeForce RTX 3090
min:
63.1 fps, P1:
131.6 fps, max:
593 fps
158 [X] 1.47.22.14 D3D12
AMD Ryzen 9 5900X 3.7GHz
NVIDIA GeForce RTX 3090
min:
92 fps, P1:
129 fps, max:
227 fps
158 [X] MSI MEG Z590 ACE 1.47.22.14 D3D12
Intel Core i9-11900K 3.5GHz
NVIDIA GeForce RTX 3090
min:
32.3 fps, P1:
130 fps, max:
277 fps
158.1 [X] AMD Ryzen 9 7950X 1.47.22.14 D3D12
AMD Ryzen 9 7950X 4.5GHz
NVIDIA GeForce RTX 3090
min:
88.4 fps, P1:
131 fps, max:
514 fps
158.4 [X] 1.47.22.14 D3D12
Intel Core i5-13600K 3.5GHz
NVIDIA GeForce RTX 3090
min:
33.3 fps, P1:
131.9 fps, max:
408 fps
159 [X] 1.47.22.14 D3D12
Intel Core i9-13900K 3GHz
NVIDIA GeForce RTX 3090
min:
84.3 fps, P1:
134.3 fps, max:
419 fps
161.4 [X] 1.47.22.14 D3D12
AMD Ryzen 5 7600X 4.7GHz
NVIDIA GeForce RTX 3090
min:
55.3 fps, P1:
136.1 fps, max:
587 fps
162 [X] 1.47.22.14 D3D12
Intel Core i5-13400F 2.5GHz
NVIDIA GeForce RTX 3090
min:
98.5 fps, P1:
135.9 fps, max:
374 fps
163 [X] Nvidia GeForce RTX 3090 FE 1.47.22.14 D3D12
AMD Ryzen 9 7950X 4.5GHz
NVIDIA GeForce RTX 3090
min:
83.2 fps, P1:
134.9 fps, max:
374 fps
163.2 [X] NVIDIA GeForce RTX 3090 Founders Edition 1.47.22.14 D3D12
AMD Ryzen 9 7950X 4.5GHz
NVIDIA GeForce RTX 3090
min:
60.1 fps, P1:
136.1 fps, max:
584 fps
169 [X] AMD Ryzen 7 7700 1.47.22.14 D3D12
AMD Ryzen 7 7700 3.8GHz
NVIDIA GeForce RTX 3090
min:
107.6 fps, P1:
141.6 fps, max:
524 fps
~ 159 fps
101%
NVIDIA GeForce RTX 3080 Ti:
156 [X] Corsair One i300 1.47.22.14 D3D12
Intel Core i9-12900K 3.2GHz
NVIDIA GeForce RTX 3080 Ti
min:
33.2 fps, P1:
132 fps, max:
403 fps
161 [X] Intel NUC13 Raptor Canyon 1.47.22.14 D3D12
Intel Core i9-13900K 3GHz
NVIDIA GeForce RTX 3080 Ti
min:
123.3 fps, P1:
134.5 fps, max:
336 fps
161.8 [X] 1.47.22.14 D3D12
AMD Ryzen 9 7950X 4.5GHz
NVIDIA GeForce RTX 3080 Ti
min:
38.7 fps, P1:
135.9 fps, max:
423 fps
~ 160 fps
85%
NVIDIA GeForce RTX 3080:
134 [X] 1.47.22.14 D3D12
AMD Ryzen 9 5900X 3.7GHz
NVIDIA GeForce RTX 3080
min:
59.3 fps, P1:
111 fps, max:
180 fps
135 [X] 1.47.22.14 D3D12
AMD Ryzen 9 5900X 3.7GHz
NVIDIA GeForce RTX 3080
min:
96.6 fps, P1:
111 fps, max:
312 fps
~ 135 fps
100%
NVIDIA GeForce RTX 3090:
179 [X] AMD Ryzen 9 5900X 3.7GHz
NVIDIA GeForce RTX 3090
min:
134 fps, max:
241 fps
186 [X] AMD Ryzen 9 5900X 3.7GHz
NVIDIA GeForce RTX 3090
min:
143 fps, max:
256 fps
193 [X] Intel Core i5-13400F 2.5GHz
NVIDIA GeForce RTX 3090
min:
133 fps, max:
247 fps
197 [X] Intel Core i5-12600K Intel Core i5-12600K 2.8GHz
NVIDIA GeForce RTX 3090
min:
153 fps, max:
254 fps
216 226 233 236 [X] Desktop-PC Intel Core i9-12900K 3.2GHz
NVIDIA GeForce RTX 3090
min:
154 fps
238 [X] AMD Ryzen 5 7600X 4.7GHz
NVIDIA GeForce RTX 3090
min:
152 fps, max:
327 fps
239 [X] NVIDIA GeForce RTX 3090 Founders Edition AMD Ryzen 9 7950X 4.5GHz
NVIDIA GeForce RTX 3090
min:
156 fps, max:
315 fps
240 [X] Intel Core i5-13600K 3.5GHz
NVIDIA GeForce RTX 3090
min:
175 fps, max:
314 fps
244 [X] AMD Ryzen 9 7900X 4.7GHz
NVIDIA GeForce RTX 3090
min:
164 fps, max:
331 fps
246 [X] Nvidia GeForce RTX 3090 FE AMD Ryzen 9 7950X 4.5GHz
NVIDIA GeForce RTX 3090
min:
185 fps, max:
336 fps
263 [X] Intel Core i9-13900K 3GHz
NVIDIA GeForce RTX 3090
min:
199 fps, max:
337 fps
271 [X] Nvidia GeForce RTX 3090 FE Intel Core i9-14900K 3.2GHz
NVIDIA GeForce RTX 3090
min:
163 fps, max:
355 fps
271 [X] Nvidia GeForce RTX 3090 FE Intel Core i9-14900K 3.2GHz
NVIDIA GeForce RTX 3090
min:
163 fps, max:
355 fps
~ 230 fps
103%
NVIDIA GeForce RTX 3080 Ti:
230 [X] Corsair One i300 Intel Core i9-12900K 3.2GHz
NVIDIA GeForce RTX 3080 Ti
min:
148 fps, max:
313 fps
239 242 [X] AMD Ryzen 9 7950X 4.5GHz
NVIDIA GeForce RTX 3080 Ti
min:
186 fps, max:
329 fps
~ 237 fps
78%
NVIDIA GeForce RTX 3080:
175 [X] AMD Ryzen 9 5900X 3.7GHz
NVIDIA GeForce RTX 3080
min:
135 fps, max:
238 fps
184 [X] AMD Ryzen 9 5900X 3.7GHz
NVIDIA GeForce RTX 3080
min:
123 fps, max:
256 fps
~ 180 fps
100%
NVIDIA GeForce RTX 3090:
139 162 [X] AMD Ryzen 9 5900X 3.7GHz
NVIDIA GeForce RTX 3090
min:
126 fps, max:
229 fps
162 [X] AMD Ryzen 9 5900X 3.7GHz
NVIDIA GeForce RTX 3090
min:
129 fps, max:
226 fps
168 [X] Intel Core i5-13400F 2.5GHz
NVIDIA GeForce RTX 3090
min:
129 fps, max:
228 fps
196 201 202 208 [X] AMD Ryzen 5 7600X 4.7GHz
NVIDIA GeForce RTX 3090
min:
151 fps, max:
284 fps
209 [X] NVIDIA GeForce RTX 3090 Founders Edition AMD Ryzen 9 7950X 4.5GHz
NVIDIA GeForce RTX 3090
min:
157 fps, max:
288 fps
211 [X] AMD Ryzen 9 7900X 4.7GHz
NVIDIA GeForce RTX 3090
min:
160 fps, max:
297 fps
212 [X] Intel Core i5-13600K 3.5GHz
NVIDIA GeForce RTX 3090
min:
168 fps, max:
290 fps
216 [X] Nvidia GeForce RTX 3090 FE AMD Ryzen 9 7950X 4.5GHz
NVIDIA GeForce RTX 3090
min:
162 fps, max:
302 fps
232 [X] Intel Core i9-13900K 3GHz
NVIDIA GeForce RTX 3090
min:
158 fps, max:
312 fps
236 [X] Nvidia GeForce RTX 3090 FE Intel Core i9-14900K 3.2GHz
NVIDIA GeForce RTX 3090
min:
190 fps, max:
320 fps
236 [X] Nvidia GeForce RTX 3090 FE Intel Core i9-14900K 3.2GHz
NVIDIA GeForce RTX 3090
min:
190 fps, max:
320 fps
~ 199 fps
104%
NVIDIA GeForce RTX 3080 Ti:
200 [X] Corsair One i300 Intel Core i9-12900K 3.2GHz
NVIDIA GeForce RTX 3080 Ti
min:
149 fps, max:
274 fps
208 212 [X] AMD Ryzen 9 7950X 4.5GHz
NVIDIA GeForce RTX 3080 Ti
min:
165 fps, max:
304 fps
~ 207 fps
79%
NVIDIA GeForce RTX 3080:
152 [X] AMD Ryzen 9 5900X 3.7GHz
NVIDIA GeForce RTX 3080
min:
120 fps, max:
211 fps
162 [X] AMD Ryzen 9 5900X 3.7GHz
NVIDIA GeForce RTX 3080
min:
124 fps, max:
221 fps
~ 157 fps
100%
NVIDIA GeForce RTX 3090:
129 153 [X] AMD Ryzen 9 5900X 3.7GHz
NVIDIA GeForce RTX 3090
min:
100 fps, max:
215 fps
155 [X] AMD Ryzen 9 5900X 3.7GHz
NVIDIA GeForce RTX 3090
min:
120 fps, max:
217 fps
162 [X] Intel Core i5-13400F 2.5GHz
NVIDIA GeForce RTX 3090
min:
113 fps, max:
227 fps
189 194 194 196 [X] AMD Ryzen 5 7600X 4.7GHz
NVIDIA GeForce RTX 3090
min:
149 fps, max:
275 fps
201 [X] Intel Core i5-13600K 3.5GHz
NVIDIA GeForce RTX 3090
min:
158 fps, max:
277 fps
203 [X] AMD Ryzen 9 7900X 4.7GHz
NVIDIA GeForce RTX 3090
min:
151 fps, max:
286 fps
203 [X] NVIDIA GeForce RTX 3090 Founders Edition AMD Ryzen 9 7950X 4.5GHz
NVIDIA GeForce RTX 3090
min:
151 fps, max:
282 fps
208 [X] Nvidia GeForce RTX 3090 FE AMD Ryzen 9 7950X 4.5GHz
NVIDIA GeForce RTX 3090
min:
159 fps, max:
293 fps
220 [X] Intel Core i9-13900K 3GHz
NVIDIA GeForce RTX 3090
min:
173 fps, max:
293 fps
225 [X] Nvidia GeForce RTX 3090 FE Intel Core i9-14900K 3.2GHz
NVIDIA GeForce RTX 3090
min:
180 fps, max:
294 fps
225 [X] Nvidia GeForce RTX 3090 FE Intel Core i9-14900K 3.2GHz
NVIDIA GeForce RTX 3090
min:
180 fps, max:
294 fps
~ 190 fps
104%
NVIDIA GeForce RTX 3080 Ti:
190 [X] Corsair One i300 Intel Core i9-12900K 3.2GHz
NVIDIA GeForce RTX 3080 Ti
min:
145 fps, max:
262 fps
198 204 [X] AMD Ryzen 9 7950X 4.5GHz
NVIDIA GeForce RTX 3080 Ti
min:
156 fps, max:
288 fps
~ 197 fps
79%
NVIDIA GeForce RTX 3080:
144 [X] AMD Ryzen 9 5900X 3.7GHz
NVIDIA GeForce RTX 3080
min:
112 fps, max:
205 fps
155 [X] AMD Ryzen 9 5900X 3.7GHz
NVIDIA GeForce RTX 3080
min:
118 fps, max:
214 fps
~ 150 fps
100%
NVIDIA GeForce RTX 3090:
121 141 [X] AMD Ryzen 9 5900X 3.7GHz
NVIDIA GeForce RTX 3090
min:
106 fps, max:
194 fps
142 [X] AMD Ryzen 9 5900X 3.7GHz
NVIDIA GeForce RTX 3090
min:
102 fps, max:
199 fps
151 [X] Intel Core i5-13400F 2.5GHz
NVIDIA GeForce RTX 3090
min:
111 fps, max:
208 fps
158 [X] Intel Core i5-12600K Intel Core i5-12600K 2.8GHz
NVIDIA GeForce RTX 3090
min:
120 fps, max:
225 fps
176 177 177 183 [X] AMD Ryzen 5 7600X 4.7GHz
NVIDIA GeForce RTX 3090
min:
136 fps, max:
251 fps
186 [X] AMD Ryzen 9 7900X 4.7GHz
NVIDIA GeForce RTX 3090
min:
133 fps, max:
258 fps
187 [X] Desktop-PC Intel Core i9-12900K 3.2GHz
NVIDIA GeForce RTX 3090
min:
145 fps
188 [X] Intel Core i5-13600K 3.5GHz
NVIDIA GeForce RTX 3090
min:
143 fps, max:
257 fps
189 [X] NVIDIA GeForce RTX 3090 Founders Edition AMD Ryzen 9 7950X 4.5GHz
NVIDIA GeForce RTX 3090
min:
138 fps, max:
261 fps
192 [X] Nvidia GeForce RTX 3090 FE AMD Ryzen 9 7950X 4.5GHz
NVIDIA GeForce RTX 3090
min:
141 fps, max:
271 fps
205 [X] Intel Core i9-13900K 3GHz
NVIDIA GeForce RTX 3090
min:
155 fps, max:
278 fps
210 [X] Nvidia GeForce RTX 3090 FE Intel Core i9-14900K 3.2GHz
NVIDIA GeForce RTX 3090
min:
159 fps, max:
282 fps
210 [X] Nvidia GeForce RTX 3090 FE Intel Core i9-14900K 3.2GHz
NVIDIA GeForce RTX 3090
min:
159 fps, max:
282 fps
~ 176 fps
104%
NVIDIA GeForce RTX 3080 Ti:
175 [X] Corsair One i300 Intel Core i9-12900K 3.2GHz
NVIDIA GeForce RTX 3080 Ti
min:
134 fps, max:
238 fps
186 188 [X] AMD Ryzen 9 7950X 4.5GHz
NVIDIA GeForce RTX 3080 Ti
min:
137 fps, max:
271 fps
~ 183 fps
80%
NVIDIA GeForce RTX 3080:
135 [X] AMD Ryzen 9 5900X 3.7GHz
NVIDIA GeForce RTX 3080
min:
97 fps, max:
188 fps
145 [X] AMD Ryzen 9 5900X 3.7GHz
NVIDIA GeForce RTX 3080
min:
112 fps, max:
200 fps
~ 140 fps
100%
NVIDIA GeForce RTX 3090:
120 137 [X] AMD Ryzen 9 5900X 3.7GHz
NVIDIA GeForce RTX 3090
min:
96 fps, max:
187 fps
139 [X] AMD Ryzen 9 5900X 3.7GHz
NVIDIA GeForce RTX 3090
min:
106 fps, max:
189 fps
148 [X] Intel Core i5-13400F 2.5GHz
NVIDIA GeForce RTX 3090
min:
111 fps, max:
198 fps
168 169 171 [X] AMD Ryzen 5 7600X 4.7GHz
NVIDIA GeForce RTX 3090
min:
126 fps, max:
217 fps
171 176 [X] AMD Ryzen 9 7900X 4.7GHz
NVIDIA GeForce RTX 3090
min:
139 fps, max:
215 fps
176 [X] NVIDIA GeForce RTX 3090 Founders Edition AMD Ryzen 9 7950X 4.5GHz
NVIDIA GeForce RTX 3090
min:
140 fps, max:
213 fps
177 [X] Intel Core i5-13600K 3.5GHz
NVIDIA GeForce RTX 3090
min:
141 fps, max:
215 fps
178 [X] Nvidia GeForce RTX 3090 FE AMD Ryzen 9 7950X 4.5GHz
NVIDIA GeForce RTX 3090
min:
139 fps, max:
215 fps
186 [X] Intel Core i9-13900K 3GHz
NVIDIA GeForce RTX 3090
min:
151 fps, max:
216 fps
188 [X] Nvidia GeForce RTX 3090 FE Intel Core i9-14900K 3.2GHz
NVIDIA GeForce RTX 3090
min:
161 fps, max:
215 fps
188 [X] Nvidia GeForce RTX 3090 FE Intel Core i9-14900K 3.2GHz
NVIDIA GeForce RTX 3090
min:
161 fps, max:
215 fps
~ 166 fps
105%
NVIDIA GeForce RTX 3080 Ti:
168 [X] Corsair One i300 Intel Core i9-12900K 3.2GHz
NVIDIA GeForce RTX 3080 Ti
min:
134 fps, max:
213 fps
176 177 [X] AMD Ryzen 9 7950X 4.5GHz
NVIDIA GeForce RTX 3080 Ti
min:
143 fps, max:
216 fps
~ 174 fps
81%
NVIDIA GeForce RTX 3080:
132 [X] AMD Ryzen 9 5900X 3.7GHz
NVIDIA GeForce RTX 3080
min:
96 fps, max:
179 fps
137 [X] AMD Ryzen 9 5900X 3.7GHz
NVIDIA GeForce RTX 3080
min:
100 fps, max:
178 fps
~ 135 fps
100%
NVIDIA GeForce RTX 3090:
101 104 105 [X] AMD Ryzen 9 5900X 3.7GHz
NVIDIA GeForce RTX 3090
min:
94 fps, max:
121 fps
105 106 [X] AMD Ryzen 9 5900X 3.7GHz
NVIDIA GeForce RTX 3090
min:
84 fps, max:
123 fps
107 [X] NVIDIA GeForce RTX 3090 Founders Edition AMD Ryzen 9 7950X 4.5GHz
NVIDIA GeForce RTX 3090
min:
96 fps, max:
128 fps
108 [X] Intel Core i5-13600K 3.5GHz
NVIDIA GeForce RTX 3090
min:
98 fps, max:
128 fps
108 [X] Intel Core i5-13400F 2.5GHz
NVIDIA GeForce RTX 3090
min:
97 fps, max:
128 fps
108 [X] Nvidia GeForce RTX 3090 FE Intel Core i9-14900K 3.2GHz
NVIDIA GeForce RTX 3090
min:
95 fps, max:
128 fps
108 [X] Nvidia GeForce RTX 3090 FE Intel Core i9-14900K 3.2GHz
NVIDIA GeForce RTX 3090
min:
95 fps, max:
128 fps
110 [X] AMD Ryzen 9 7900X 4.7GHz
NVIDIA GeForce RTX 3090
min:
99 fps, max:
129 fps
110 [X] Intel Core i9-13900K 3GHz
NVIDIA GeForce RTX 3090
min:
99 fps, max:
129 fps
110 [X] Nvidia GeForce RTX 3090 FE AMD Ryzen 9 7950X 4.5GHz
NVIDIA GeForce RTX 3090
min:
99 fps, max:
130 fps
111 [X] AMD Ryzen 5 7600X 4.7GHz
NVIDIA GeForce RTX 3090
min:
100 fps, max:
129 fps
115 ~ 108 fps
101%
NVIDIA GeForce RTX 3080 Ti:
108 [X] Corsair One i300 Intel Core i9-12900K 3.2GHz
NVIDIA GeForce RTX 3080 Ti
min:
97 fps, max:
128 fps
109 [X] AMD Ryzen 9 7950X 4.5GHz
NVIDIA GeForce RTX 3080 Ti
min:
98 fps, max:
128 fps
109 ~ 109 fps
87%
NVIDIA GeForce RTX 3080:
93 [X] AMD Ryzen 9 5900X 3.7GHz
NVIDIA GeForce RTX 3080
min:
78 fps, max:
109 fps
95 [X] AMD Ryzen 9 5900X 3.7GHz
NVIDIA GeForce RTX 3080
min:
85 fps, max:
107 fps
~ 94 fps
100%
NVIDIA GeForce RTX 3090:
151 [X] AMD Ryzen 9 5900X 3.7GHz
NVIDIA GeForce RTX 3090
157 [X] AMD Ryzen 9 5900X 3.7GHz
NVIDIA GeForce RTX 3090
157.9 [X] Intel Core i5-12600K Intel Core i5-12600K 2.8GHz
NVIDIA GeForce RTX 3090
162.7 [X] Intel Core i5-13400F 2.5GHz
NVIDIA GeForce RTX 3090
164 [X] MSI MEG Z590 ACE Intel Core i9-11900K 3.5GHz
NVIDIA GeForce RTX 3090
200 [X] Intel Core i5-13600K 3.5GHz
NVIDIA GeForce RTX 3090
213 [X] Desktop-PC Intel Core i9-12900K 3.2GHz
NVIDIA GeForce RTX 3090
216 218 221 [X] NVIDIA GeForce RTX 3090 Founders Edition AMD Ryzen 9 7950X 4.5GHz
NVIDIA GeForce RTX 3090
221 [X] Nvidia GeForce RTX 3090 FE AMD Ryzen 9 7950X 4.5GHz
NVIDIA GeForce RTX 3090
224 225 [X] AMD Ryzen 9 7900X 4.7GHz
NVIDIA GeForce RTX 3090
227 [X] AMD Ryzen 5 7600X 4.7GHz
NVIDIA GeForce RTX 3090
234 [X] Intel Core i9-13900K 3GHz
NVIDIA GeForce RTX 3090
252 [X] Nvidia GeForce RTX 3090 FE Intel Core i9-14900K 3.2GHz
NVIDIA GeForce RTX 3090
~ 203 fps
107%
NVIDIA GeForce RTX 3080 Ti:
205 216 [X] AMD Ryzen 9 7950X 4.5GHz
NVIDIA GeForce RTX 3080 Ti
232 ~ 218 fps
81%
NVIDIA GeForce RTX 3080:
163 [X] AMD Ryzen 9 5900X 3.7GHz
NVIDIA GeForce RTX 3080
165 [X] AMD Ryzen 9 5900X 3.7GHz
NVIDIA GeForce RTX 3080
~ 164 fps
100%
NVIDIA GeForce RTX 3090:
126 [X] AMD Ryzen 9 5900X 3.7GHz
NVIDIA GeForce RTX 3090
137 [X] AMD Ryzen 9 5900X 3.7GHz
NVIDIA GeForce RTX 3090
138.2 [X] Intel Core i5-12600K Intel Core i5-12600K 2.8GHz
NVIDIA GeForce RTX 3090
143.3 [X] Intel Core i5-13400F 2.5GHz
NVIDIA GeForce RTX 3090
147 [X] MSI MEG Z590 ACE Intel Core i9-11900K 3.5GHz
NVIDIA GeForce RTX 3090
175.3 [X] Intel Core i5-13600K 3.5GHz
NVIDIA GeForce RTX 3090
187.9 189.1 [X] Desktop-PC Intel Core i9-12900K 3.2GHz
NVIDIA GeForce RTX 3090
190.7 193.6 [X] AMD Ryzen 5 7600X 4.7GHz
NVIDIA GeForce RTX 3090
196.3 196.4 [X] Nvidia GeForce RTX 3090 FE AMD Ryzen 9 7950X 4.5GHz
NVIDIA GeForce RTX 3090
196.7 [X] NVIDIA GeForce RTX 3090 Founders Edition AMD Ryzen 9 7950X 4.5GHz
NVIDIA GeForce RTX 3090
199.2 [X] AMD Ryzen 9 7900X 4.7GHz
NVIDIA GeForce RTX 3090
202 [X] Intel Core i9-13900K 3GHz
NVIDIA GeForce RTX 3090
229 [X] Nvidia GeForce RTX 3090 FE Intel Core i9-14900K 3.2GHz
NVIDIA GeForce RTX 3090
~ 178 fps
106%
NVIDIA GeForce RTX 3080 Ti:
178 182.8 [X] AMD Ryzen 9 7950X 4.5GHz
NVIDIA GeForce RTX 3080 Ti
202 ~ 188 fps
86%
NVIDIA GeForce RTX 3080:
153 [X] AMD Ryzen 9 5900X 3.7GHz
NVIDIA GeForce RTX 3080
153 [X] AMD Ryzen 9 5900X 3.7GHz
NVIDIA GeForce RTX 3080
~ 153 fps
100%
NVIDIA GeForce RTX 3090:
96.8 [X] AMD Ryzen 9 5900X 3.7GHz
NVIDIA GeForce RTX 3090
111 [X] AMD Ryzen 9 5900X 3.7GHz
NVIDIA GeForce RTX 3090
111.1 [X] Intel Core i5-12600K Intel Core i5-12600K 2.8GHz
NVIDIA GeForce RTX 3090
112.1 [X] Intel Core i5-13400F 2.5GHz
NVIDIA GeForce RTX 3090
120 [X] MSI MEG Z590 ACE Intel Core i9-11900K 3.5GHz
NVIDIA GeForce RTX 3090
131.4 [X] Intel Core i5-13600K 3.5GHz
NVIDIA GeForce RTX 3090
141 145.9 147.5 147.7 [X] Desktop-PC Intel Core i9-12900K 3.2GHz
NVIDIA GeForce RTX 3090
148.4 [X] Intel Core i9-13900K 3GHz
NVIDIA GeForce RTX 3090
149.8 [X] Nvidia GeForce RTX 3090 FE AMD Ryzen 9 7950X 4.5GHz
NVIDIA GeForce RTX 3090
151.8 [X] AMD Ryzen 5 7600X 4.7GHz
NVIDIA GeForce RTX 3090
154.7 [X] NVIDIA GeForce RTX 3090 Founders Edition AMD Ryzen 9 7950X 4.5GHz
NVIDIA GeForce RTX 3090
160.9 [X] AMD Ryzen 9 7900X 4.7GHz
NVIDIA GeForce RTX 3090
167.9 [X] Nvidia GeForce RTX 3090 FE Intel Core i9-14900K 3.2GHz
NVIDIA GeForce RTX 3090
~ 137 fps
103%
NVIDIA GeForce RTX 3080 Ti:
135 140.1 [X] AMD Ryzen 9 7950X 4.5GHz
NVIDIA GeForce RTX 3080 Ti
148.8 ~ 141 fps
90%
NVIDIA GeForce RTX 3080:
122.5 [X] AMD Ryzen 9 5900X 3.7GHz
NVIDIA GeForce RTX 3080
123 [X] AMD Ryzen 9 5900X 3.7GHz
NVIDIA GeForce RTX 3080
~ 123 fps
100%
NVIDIA GeForce RTX 3090:
83 [X] AMD Ryzen 9 5900X 3.7GHz
NVIDIA GeForce RTX 3090
92.8 [X] AMD Ryzen 9 5900X 3.7GHz
NVIDIA GeForce RTX 3090
96.4 [X] Intel Core i5-12600K Intel Core i5-12600K 2.8GHz
NVIDIA GeForce RTX 3090
97 [X] Intel Core i5-13400F 2.5GHz
NVIDIA GeForce RTX 3090
103 [X] MSI MEG Z590 ACE Intel Core i9-11900K 3.5GHz
NVIDIA GeForce RTX 3090
112.7 [X] Intel Core i5-13600K 3.5GHz
NVIDIA GeForce RTX 3090
120.5 122.5 124 127.3 [X] Nvidia GeForce RTX 3090 FE AMD Ryzen 9 7950X 4.5GHz
NVIDIA GeForce RTX 3090
127.6 [X] AMD Ryzen 5 7600X 4.7GHz
NVIDIA GeForce RTX 3090
128.4 [X] Intel Core i9-13900K 3GHz
NVIDIA GeForce RTX 3090
129.6 [X] NVIDIA GeForce RTX 3090 Founders Edition AMD Ryzen 9 7950X 4.5GHz
NVIDIA GeForce RTX 3090
133.5 [X] AMD Ryzen 9 7900X 4.7GHz
NVIDIA GeForce RTX 3090
141.5 [X] Nvidia GeForce RTX 3090 FE Intel Core i9-14900K 3.2GHz
NVIDIA GeForce RTX 3090
~ 116 fps
104%
NVIDIA GeForce RTX 3080 Ti:
118 118 [X] AMD Ryzen 9 7950X 4.5GHz
NVIDIA GeForce RTX 3080 Ti
127.3 ~ 121 fps
91%
NVIDIA GeForce RTX 3080:
104.8 [X] AMD Ryzen 9 5900X 3.7GHz
NVIDIA GeForce RTX 3080
105 [X] AMD Ryzen 9 5900X 3.7GHz
NVIDIA GeForce RTX 3080
~ 105 fps
100%
NVIDIA GeForce RTX 3090:
211 [X] 1.3
AMD Ryzen 9 5900X 3.7GHz
NVIDIA GeForce RTX 3090
217 [X] Intel Core i5-12600K 1.3
Intel Core i5-12600K 2.8GHz
NVIDIA GeForce RTX 3090
219 [X] 1.3
AMD Ryzen 9 5900X 3.7GHz
NVIDIA GeForce RTX 3090
223 [X] 1.3
Intel Core i5-13400F 2.5GHz
NVIDIA GeForce RTX 3090
233 [X] 1.3
AMD Ryzen 5 7600X 4.7GHz
NVIDIA GeForce RTX 3090
233 [X] Desktop-PC 1.3
Intel Core i9-12900K 3.2GHz
NVIDIA GeForce RTX 3090
234 [X] 1.3
Intel Core i9-13900K 3GHz
NVIDIA GeForce RTX 3090
235 [X] 1.3
Intel Core i5-13600K 3.5GHz
NVIDIA GeForce RTX 3090
235 [X] NVIDIA GeForce RTX 3090 Founders Edition 1.3
AMD Ryzen 9 7950X 4.5GHz
NVIDIA GeForce RTX 3090
235 235 235 [X] Nvidia GeForce RTX 3090 FE 1.3
AMD Ryzen 9 7950X 4.5GHz
NVIDIA GeForce RTX 3090
235 [X] Nvidia GeForce RTX 3090 FE 1.3
Intel Core i9-14900K 3.2GHz
NVIDIA GeForce RTX 3090
236 [X] 1.3
AMD Ryzen 9 7900X 4.7GHz
NVIDIA GeForce RTX 3090
237 ~ 230 fps
102%
NVIDIA GeForce RTX 3080 Ti:
232 234 235 [X] 1.3
AMD Ryzen 9 7950X 4.5GHz
NVIDIA GeForce RTX 3080 Ti
~ 234 fps
82%
NVIDIA GeForce RTX 3080:
148 [X] 1.3
AMD Ryzen 9 5900X 3.7GHz
NVIDIA GeForce RTX 3080
228 [X] 1.3
AMD Ryzen 9 5900X 3.7GHz
NVIDIA GeForce RTX 3080
~ 188 fps
100%
NVIDIA GeForce RTX 3090:
189 [X] 1.3
AMD Ryzen 9 5900X 3.7GHz
NVIDIA GeForce RTX 3090
190 [X] 1.3
AMD Ryzen 9 5900X 3.7GHz
NVIDIA GeForce RTX 3090
212 [X] Intel Core i5-12600K 1.3
Intel Core i5-12600K 2.8GHz
NVIDIA GeForce RTX 3090
214 [X] MSI MEG Z590 ACE 1.3
Intel Core i9-11900K 3.5GHz
NVIDIA GeForce RTX 3090
216 [X] 1.3
Intel Core i5-13400F 2.5GHz
NVIDIA GeForce RTX 3090
227 [X] 1.3
AMD Ryzen 5 7600X 4.7GHz
NVIDIA GeForce RTX 3090
229 230 [X] 1.3
Intel Core i5-13600K 3.5GHz
NVIDIA GeForce RTX 3090
230 [X] NVIDIA GeForce RTX 3090 Founders Edition 1.3
AMD Ryzen 9 7950X 4.5GHz
NVIDIA GeForce RTX 3090
231 [X] 1.3
AMD Ryzen 9 7900X 4.7GHz
NVIDIA GeForce RTX 3090
233 [X] 1.3
Intel Core i9-13900K 3GHz
NVIDIA GeForce RTX 3090
236 [X] Nvidia GeForce RTX 3090 FE 1.3
AMD Ryzen 9 7950X 4.5GHz
NVIDIA GeForce RTX 3090
236 [X] Nvidia GeForce RTX 3090 FE 1.3
Intel Core i9-14900K 3.2GHz
NVIDIA GeForce RTX 3090
237 ~ 222 fps
103%
NVIDIA GeForce RTX 3080 Ti:
227 229 232 [X] 1.3
AMD Ryzen 9 7950X 4.5GHz
NVIDIA GeForce RTX 3080 Ti
~ 229 fps
76%
NVIDIA GeForce RTX 3080:
132 [X] 1.3
AMD Ryzen 9 5900X 3.7GHz
NVIDIA GeForce RTX 3080
205 [X] 1.3
AMD Ryzen 9 5900X 3.7GHz
NVIDIA GeForce RTX 3080
~ 169 fps
100%
NVIDIA GeForce RTX 3090:
153 [X] 1.3
AMD Ryzen 9 5900X 3.7GHz
NVIDIA GeForce RTX 3090
156 [X] 1.3
AMD Ryzen 9 5900X 3.7GHz
NVIDIA GeForce RTX 3090
170 [X] MSI MEG Z590 ACE 1.3
Intel Core i9-11900K 3.5GHz
NVIDIA GeForce RTX 3090
173.5 [X] Intel Core i5-12600K 1.3
Intel Core i5-12600K 2.8GHz
NVIDIA GeForce RTX 3090
177.2 [X] 1.3
Intel Core i5-13400F 2.5GHz
NVIDIA GeForce RTX 3090
178.3 185.5 [X] Desktop-PC 1.3
Intel Core i9-12900K 3.2GHz
NVIDIA GeForce RTX 3090
187.4 [X] Nvidia GeForce RTX 3090 FE 1.3
AMD Ryzen 9 7950X 4.5GHz
NVIDIA GeForce RTX 3090
188.4 [X] 1.3
AMD Ryzen 5 7600X 4.7GHz
NVIDIA GeForce RTX 3090
188.8 [X] NVIDIA GeForce RTX 3090 Founders Edition 1.3
AMD Ryzen 9 7950X 4.5GHz
NVIDIA GeForce RTX 3090
188.9 [X] 1.3
Intel Core i9-13900K 3GHz
NVIDIA GeForce RTX 3090
189.7 [X] 1.3
Intel Core i5-13600K 3.5GHz
NVIDIA GeForce RTX 3090
190.8 [X] 1.3
AMD Ryzen 9 7900X 4.7GHz
NVIDIA GeForce RTX 3090
193 [X] Nvidia GeForce RTX 3090 FE 1.3
Intel Core i9-14900K 3.2GHz
NVIDIA GeForce RTX 3090
196.1 229 ~ 184 fps
98%
NVIDIA GeForce RTX 3080 Ti:
175 180.6 186.4 [X] 1.3
AMD Ryzen 9 7950X 4.5GHz
NVIDIA GeForce RTX 3080 Ti
~ 181 fps
73%
NVIDIA GeForce RTX 3080:
113 [X] 1.3
AMD Ryzen 9 5900X 3.7GHz
NVIDIA GeForce RTX 3080
156 [X] 1.3
AMD Ryzen 9 5900X 3.7GHz
NVIDIA GeForce RTX 3080
~ 135 fps
100%
NVIDIA GeForce RTX 3090:
128 [X] 1.3
AMD Ryzen 9 5900X 3.7GHz
NVIDIA GeForce RTX 3090
133 [X] 1.3
AMD Ryzen 9 5900X 3.7GHz
NVIDIA GeForce RTX 3090
138.4 139 [X] MSI MEG Z590 ACE 1.3
Intel Core i9-11900K 3.5GHz
NVIDIA GeForce RTX 3090
140.7 [X] 1.3
Intel Core i5-13400F 2.5GHz
NVIDIA GeForce RTX 3090
142.4 143.9 [X] NVIDIA GeForce RTX 3090 Founders Edition 1.3
AMD Ryzen 9 7950X 4.5GHz
NVIDIA GeForce RTX 3090
144.5 [X] Intel Core i5-12600K 1.3
Intel Core i5-12600K 2.8GHz
NVIDIA GeForce RTX 3090
145.6 [X] 1.3
Intel Core i5-13600K 3.5GHz
NVIDIA GeForce RTX 3090
146.6 [X] 1.3
AMD Ryzen 9 7900X 4.7GHz
NVIDIA GeForce RTX 3090
147.1 [X] 1.3
AMD Ryzen 5 7600X 4.7GHz
NVIDIA GeForce RTX 3090
147.4 [X] Nvidia GeForce RTX 3090 FE 1.3
Intel Core i9-14900K 3.2GHz
NVIDIA GeForce RTX 3090
148.2 [X] 1.3
Intel Core i9-13900K 3GHz
NVIDIA GeForce RTX 3090
148.6 [X] Nvidia GeForce RTX 3090 FE 1.3
AMD Ryzen 9 7950X 4.5GHz
NVIDIA GeForce RTX 3090
153 ~ 143 fps
98%
NVIDIA GeForce RTX 3080 Ti:
136 141 142 [X] 1.3
AMD Ryzen 9 7950X 4.5GHz
NVIDIA GeForce RTX 3080 Ti
~ 140 fps
76%
NVIDIA GeForce RTX 3080:
91 [X] 1.3
AMD Ryzen 9 5900X 3.7GHz
NVIDIA GeForce RTX 3080
124 [X] 1.3
AMD Ryzen 9 5900X 3.7GHz
NVIDIA GeForce RTX 3080
~ 108 fps
100%
NVIDIA GeForce RTX 3090:
81.5 [X] 1.3
AMD Ryzen 9 5900X 3.7GHz
NVIDIA GeForce RTX 3090
84.3 85.6 [X] 1.3
Intel Core i5-13400F 2.5GHz
NVIDIA GeForce RTX 3090
86.8 [X] 1.3
Intel Core i5-13600K 3.5GHz
NVIDIA GeForce RTX 3090
86.8 87.1 [X] NVIDIA GeForce RTX 3090 Founders Edition 1.3
AMD Ryzen 9 7950X 4.5GHz
NVIDIA GeForce RTX 3090
87.6 [X] 1.3
AMD Ryzen 9 5900X 3.7GHz
NVIDIA GeForce RTX 3090
87.8 [X] Nvidia GeForce RTX 3090 FE 1.3
AMD Ryzen 9 7950X 4.5GHz
NVIDIA GeForce RTX 3090
88.3 [X] Nvidia GeForce RTX 3090 FE 1.3
Intel Core i9-14900K 3.2GHz
NVIDIA GeForce RTX 3090
88.4 [X] MSI MEG Z590 ACE 1.3
Intel Core i9-11900K 3.5GHz
NVIDIA GeForce RTX 3090
88.5 [X] 1.3
Intel Core i9-13900K 3GHz
NVIDIA GeForce RTX 3090
88.7 [X] Intel Core i5-12600K 1.3
Intel Core i5-12600K 2.8GHz
NVIDIA GeForce RTX 3090
88.8 [X] 1.3
AMD Ryzen 9 7900X 4.7GHz
NVIDIA GeForce RTX 3090
90.6 [X] 1.3
AMD Ryzen 5 7600X 4.7GHz
NVIDIA GeForce RTX 3090
92.4 ~ 88 fps
97%
NVIDIA GeForce RTX 3080 Ti:
84 84.2 86.4 [X] 1.3
AMD Ryzen 9 7950X 4.5GHz
NVIDIA GeForce RTX 3080 Ti
~ 85 fps
81%
NVIDIA GeForce RTX 3080:
66 [X] 1.3
AMD Ryzen 9 5900X 3.7GHz
NVIDIA GeForce RTX 3080
76.1 [X] 1.3
AMD Ryzen 9 5900X 3.7GHz
NVIDIA GeForce RTX 3080
~ 71 fps
100%
NVIDIA GeForce RTX 3090:
264 [X] Nvidia GeForce RTX 3090 FE Intel Core i9-14900K 3.2GHz
NVIDIA GeForce RTX 3090
fps
100%
NVIDIA GeForce RTX 3090:
191 [X] Nvidia GeForce RTX 3090 FE Intel Core i9-14900K 3.2GHz
NVIDIA GeForce RTX 3090
fps
100%
NVIDIA GeForce RTX 3090:
179 [X] Nvidia GeForce RTX 3090 FE Intel Core i9-14900K 3.2GHz
NVIDIA GeForce RTX 3090
fps
100%
NVIDIA GeForce RTX 3090:
157 [X] Nvidia GeForce RTX 3090 FE Intel Core i9-14900K 3.2GHz
NVIDIA GeForce RTX 3090
fps
100%
NVIDIA GeForce RTX 3090:
136 [X] Nvidia GeForce RTX 3090 FE Intel Core i9-14900K 3.2GHz
NVIDIA GeForce RTX 3090
fps
100%
NVIDIA GeForce RTX 3090:
94 [X] Nvidia GeForce RTX 3090 FE Intel Core i9-14900K 3.2GHz
NVIDIA GeForce RTX 3090
fps
100%
NVIDIA GeForce RTX 3090:
300 [X] AMD Ryzen 9 5900X 3.7GHz
NVIDIA GeForce RTX 3090
min:
262 fps, max:
322 fps
391.3 [X] AMD Ryzen 9 5900X 3.7GHz
NVIDIA GeForce RTX 3090
~ 346 fps
141%
NVIDIA GeForce RTX 3080 Ti:
487 [X] Corsair One i300 Intel Core i9-12900K 3.2GHz
NVIDIA GeForce RTX 3080 Ti
min:
179 fps, P0.1:
239 fps, P1:
276 fps, max:
744 fps
488 [X] AMD Ryzen 9 7950X 4.5GHz
NVIDIA GeForce RTX 3080 Ti
min:
193.7 fps, P0.1:
235 fps, P1:
260 fps, max:
815 fps
~ 488 fps
103%
NVIDIA GeForce RTX 3080:
327 [X] AMD Ryzen 9 5900X 3.7GHz
NVIDIA GeForce RTX 3080
min:
300 fps, max:
358 fps
388 [X] AMD Ryzen 9 5900X 3.7GHz
NVIDIA GeForce RTX 3080
min:
368 fps, max:
406 fps
~ 358 fps
100%
NVIDIA GeForce RTX 3090:
263 [X] AMD Ryzen 9 5900X 3.7GHz
NVIDIA GeForce RTX 3090
min:
237 fps, max:
301 fps
283.6 [X] AMD Ryzen 9 5900X 3.7GHz
NVIDIA GeForce RTX 3090
~ 273 fps
133%
NVIDIA GeForce RTX 3080 Ti:
340 [X] Corsair One i300 Intel Core i9-12900K 3.2GHz
NVIDIA GeForce RTX 3080 Ti
min:
186 fps, P0.1:
220 fps, P1:
278 fps, max:
407 fps
388 [X] AMD Ryzen 9 7950X 4.5GHz
NVIDIA GeForce RTX 3080 Ti
min:
69.6 fps, P0.1:
285 fps, P1:
311 fps, max:
474 fps
~ 364 fps
97%
NVIDIA GeForce RTX 3080:
231 [X] AMD Ryzen 9 5900X 3.7GHz
NVIDIA GeForce RTX 3080
min:
214 fps, max:
252 fps
300 [X] AMD Ryzen 9 5900X 3.7GHz
NVIDIA GeForce RTX 3080
min:
282 fps, max:
317 fps
~ 266 fps
100%
NVIDIA GeForce RTX 3090:
257 [X] AMD Ryzen 9 5900X 3.7GHz
NVIDIA GeForce RTX 3090
min:
234 fps, max:
271 fps
269.7 [X] AMD Ryzen 9 5900X 3.7GHz
NVIDIA GeForce RTX 3090
~ 263 fps
103%
NVIDIA GeForce RTX 3080 Ti:
257 [X] Corsair One i300 Intel Core i9-12900K 3.2GHz
NVIDIA GeForce RTX 3080 Ti
min:
87.3 fps, P0.1:
178 fps, P1:
210 fps, max:
355 fps
282 [X] AMD Ryzen 9 7950X 4.5GHz
NVIDIA GeForce RTX 3080 Ti
min:
60.5 fps, P0.1:
206 fps, P1:
226 fps, max:
408 fps
~ 270 fps
93%
NVIDIA GeForce RTX 3080:
217 [X] AMD Ryzen 9 5900X 3.7GHz
NVIDIA GeForce RTX 3080
min:
172 fps, max:
235 fps
273 [X] AMD Ryzen 9 5900X 3.7GHz
NVIDIA GeForce RTX 3080
min:
254 fps, max:
292 fps
~ 245 fps
100%
NVIDIA GeForce RTX 3090:
240 [X] AMD Ryzen 9 5900X 3.7GHz
NVIDIA GeForce RTX 3090
min:
219 fps, max:
261 fps
253.7 [X] AMD Ryzen 9 5900X 3.7GHz
NVIDIA GeForce RTX 3090
~ 247 fps
94%
NVIDIA GeForce RTX 3080 Ti:
221 [X] Corsair One i300 Intel Core i9-12900K 3.2GHz
NVIDIA GeForce RTX 3080 Ti
min:
147 fps, P0.1:
165 fps, P1:
180 fps, max:
343 fps
243 [X] AMD Ryzen 9 7950X 4.5GHz
NVIDIA GeForce RTX 3080 Ti
min:
143.6 fps, P0.1:
193.6 fps, P1:
204 fps, max:
383 fps
~ 232 fps
91%
NVIDIA GeForce RTX 3080:
217 [X] AMD Ryzen 9 5900X 3.7GHz
NVIDIA GeForce RTX 3080
min:
196 fps, max:
238 fps
233 [X] AMD Ryzen 9 5900X 3.7GHz
NVIDIA GeForce RTX 3080
min:
218 fps, max:
258 fps
~ 225 fps
100%
NVIDIA GeForce RTX 3090:
128 [X] AMD Ryzen 9 5900X 3.7GHz
NVIDIA GeForce RTX 3090
min:
117 fps, max:
145 fps
128.1 [X] AMD Ryzen 9 5900X 3.7GHz
NVIDIA GeForce RTX 3090
~ 128 fps
91%
NVIDIA GeForce RTX 3080 Ti:
114 [X] Corsair One i300 Intel Core i9-12900K 3.2GHz
NVIDIA GeForce RTX 3080 Ti
min:
91.8 fps, P0.1:
94.4 fps, P1:
99.3 fps, max:
176 fps
118.8 [X] AMD Ryzen 9 7950X 4.5GHz
NVIDIA GeForce RTX 3080 Ti
min:
52.4 fps, P0.1:
97.6 fps, P1:
104.1 fps, max:
351 fps
~ 116 fps
87%
NVIDIA GeForce RTX 3080:
107 [X] AMD Ryzen 9 5900X 3.7GHz
NVIDIA GeForce RTX 3080
min:
99 fps, max:
120 fps
114 [X] AMD Ryzen 9 5900X 3.7GHz
NVIDIA GeForce RTX 3080
min:
105 fps, max:
133 fps
~ 111 fps
100%
NVIDIA GeForce RTX 3090:
149.1 [X] AMD Ryzen 9 5900X 3.7GHz
NVIDIA GeForce RTX 3090
min:
109.1 fps, max:
-1 fps
169.9 [X] AMD Ryzen 9 5900X 3.7GHz
NVIDIA GeForce RTX 3090
min:
135.9 fps, max:
-1 fps
182.9 [X] MSI MEG Z590 ACE Intel Core i9-11900K 3.5GHz
NVIDIA GeForce RTX 3090
min:
152.6 fps, max:
-1 fps
193.3 [X] Intel Core i5-13400F 2.5GHz
NVIDIA GeForce RTX 3090
min:
164.8 fps, max:
-1 fps
203.6 [X] Intel Core i5-12600K Intel Core i5-12600K 2.8GHz
NVIDIA GeForce RTX 3090
min:
180.1 fps, max:
-1 fps
235.4 [X] Desktop-PC Intel Core i9-12900K 3.2GHz
NVIDIA GeForce RTX 3090
min:
207.6 fps, max:
-1 fps
246.2 [X] Intel Core i5-13600K 3.5GHz
NVIDIA GeForce RTX 3090
min:
214 fps, max:
-1 fps
285.3 [X] Intel Core i9-13900K 3GHz
NVIDIA GeForce RTX 3090
min:
242.4 fps, max:
-1 fps
292.3 292.6 293.1 [X] AMD Ryzen 9 7900X 4.7GHz
NVIDIA GeForce RTX 3090
min:
253 fps, max:
-1 fps
293.1 [X] NVIDIA GeForce RTX 3090 Founders Edition AMD Ryzen 9 7950X 4.5GHz
NVIDIA GeForce RTX 3090
min:
248.4 fps, max:
-1 fps
293.2 299 [X] Nvidia GeForce RTX 3090 FE Intel Core i9-14900K 3.2GHz
NVIDIA GeForce RTX 3090
min:
255 fps, max:
-1 fps
301.3 [X] AMD Ryzen 5 7600X 4.7GHz
NVIDIA GeForce RTX 3090
min:
255.5 fps, max:
-1 fps
305 [X] Nvidia GeForce RTX 3090 FE AMD Ryzen 9 7950X 4.5GHz
NVIDIA GeForce RTX 3090
min:
260.1 fps, max:
-1 fps
~ 252 fps
109%
NVIDIA GeForce RTX 3080 Ti:
240.3 [X] Corsair One i300 Intel Core i9-12900K 3.2GHz
NVIDIA GeForce RTX 3080 Ti
min:
211.7 fps, max:
-1 fps
278.9 305 [X] AMD Ryzen 9 7950X 4.5GHz
NVIDIA GeForce RTX 3080 Ti
min:
248.3 fps, max:
-1 fps
~ 275 fps
67%
NVIDIA GeForce RTX 3080:
124.1 [X] AMD Ryzen 9 5900X 3.7GHz
NVIDIA GeForce RTX 3080
min:
99.1 fps, max:
-1 fps
216.6 [X] AMD Ryzen 9 5900X 3.7GHz
NVIDIA GeForce RTX 3080
min:
180.1 fps, max:
-1 fps
~ 170 fps
100%
NVIDIA GeForce RTX 3090:
139.2 [X] AMD Ryzen 9 5900X 3.7GHz
NVIDIA GeForce RTX 3090
min:
93.8 fps, max:
-1 fps
143.2 [X] AMD Ryzen 9 5900X 3.7GHz
NVIDIA GeForce RTX 3090
min:
118.7 fps, max:
-1 fps
176.8 [X] Intel Core i5-13400F 2.5GHz
NVIDIA GeForce RTX 3090
min:
155.4 fps, max:
-1 fps
176.8 [X] Intel Core i5-13400F 2.5GHz
NVIDIA GeForce RTX 3090
min:
155.4 fps, max:
-1 fps
177.7 [X] MSI MEG Z590 ACE Intel Core i9-11900K 3.5GHz
NVIDIA GeForce RTX 3090
min:
156.1 fps, max:
-1 fps
186.4 [X] Intel Core i5-12600K Intel Core i5-12600K 2.8GHz
NVIDIA GeForce RTX 3090
min:
164.3 fps, max:
-1 fps
214.3 [X] Desktop-PC Intel Core i9-12900K 3.2GHz
NVIDIA GeForce RTX 3090
min:
186.9 fps, max:
-1 fps
224.6 [X] Intel Core i5-13600K 3.5GHz
NVIDIA GeForce RTX 3090
min:
197.2 fps, max:
-1 fps
242.3 256.1 [X] Intel Core i9-13900K 3GHz
NVIDIA GeForce RTX 3090
min:
222.9 fps, max:
-1 fps
256.4 257 [X] AMD Ryzen 9 7900X 4.7GHz
NVIDIA GeForce RTX 3090
min:
224 fps, max:
-1 fps
257.1 [X] NVIDIA GeForce RTX 3090 Founders Edition AMD Ryzen 9 7950X 4.5GHz
NVIDIA GeForce RTX 3090
min:
218.1 fps, max:
-1 fps
259.3 260 [X] AMD Ryzen 5 7600X 4.7GHz
NVIDIA GeForce RTX 3090
min:
224.6 fps, max:
-1 fps
265 [X] Nvidia GeForce RTX 3090 FE Intel Core i9-14900K 3.2GHz
NVIDIA GeForce RTX 3090
min:
227.9 fps, max:
-1 fps
270.3 [X] Nvidia GeForce RTX 3090 FE AMD Ryzen 9 7950X 4.5GHz
NVIDIA GeForce RTX 3090
min:
230.9 fps, max:
-1 fps
~ 221 fps
109%
NVIDIA GeForce RTX 3080 Ti:
214.8 [X] Corsair One i300 Intel Core i9-12900K 3.2GHz
NVIDIA GeForce RTX 3080 Ti
min:
188.8 fps, max:
-1 fps
242.4 266 [X] AMD Ryzen 9 7950X 4.5GHz
NVIDIA GeForce RTX 3080 Ti
min:
228.3 fps, max:
-1 fps
~ 241 fps
70%
NVIDIA GeForce RTX 3080:
113.2 [X] AMD Ryzen 9 5900X 3.7GHz
NVIDIA GeForce RTX 3080
min:
92.1 fps, max:
-1 fps
197.1 [X] AMD Ryzen 9 5900X 3.7GHz
NVIDIA GeForce RTX 3080
min:
163 fps, max:
-1 fps
~ 155 fps
100%
NVIDIA GeForce RTX 3090:
138.4 [X] AMD Ryzen 9 5900X 3.7GHz
NVIDIA GeForce RTX 3090
min:
99.3 fps, max:
-1 fps
144.3 [X] AMD Ryzen 9 5900X 3.7GHz
NVIDIA GeForce RTX 3090
min:
119.3 fps, max:
-1 fps
172.1 [X] Intel Core i5-13400F 2.5GHz
NVIDIA GeForce RTX 3090
min:
150.3 fps, max:
-1 fps
172.1 [X] Intel Core i5-13400F 2.5GHz
NVIDIA GeForce RTX 3090
min:
150.3 fps, max:
-1 fps
174.4 [X] MSI MEG Z590 ACE Intel Core i9-11900K 3.5GHz
NVIDIA GeForce RTX 3090
min:
142.7 fps, max:
-1 fps
179.4 [X] Intel Core i5-12600K Intel Core i5-12600K 2.8GHz
NVIDIA GeForce RTX 3090
min:
155.6 fps, max:
-1 fps
209.6 [X] Desktop-PC Intel Core i9-12900K 3.2GHz
NVIDIA GeForce RTX 3090
min:
181.3 fps, max:
-1 fps
216.8 [X] Intel Core i5-13600K 3.5GHz
NVIDIA GeForce RTX 3090
min:
190.2 fps, max:
-1 fps
233.2 243.7 [X] Intel Core i9-13900K 3GHz
NVIDIA GeForce RTX 3090
min:
209.3 fps, max:
-1 fps
244.9 [X] AMD Ryzen 5 7600X 4.7GHz
NVIDIA GeForce RTX 3090
min:
207.6 fps, max:
-1 fps
248.5 [X] NVIDIA GeForce RTX 3090 Founders Edition AMD Ryzen 9 7950X 4.5GHz
NVIDIA GeForce RTX 3090
min:
210.6 fps, max:
-1 fps
248.5 249.8 250.4 [X] AMD Ryzen 9 7900X 4.7GHz
NVIDIA GeForce RTX 3090
min:
213.8 fps, max:
-1 fps
254 [X] Nvidia GeForce RTX 3090 FE Intel Core i9-14900K 3.2GHz
NVIDIA GeForce RTX 3090
min:
217.4 fps, max:
-1 fps
254.6 [X] Nvidia GeForce RTX 3090 FE AMD Ryzen 9 7950X 4.5GHz
NVIDIA GeForce RTX 3090
min:
217 fps, max:
-1 fps
~ 214 fps
109%
NVIDIA GeForce RTX 3080 Ti:
207.6 [X] Corsair One i300 Intel Core i9-12900K 3.2GHz
NVIDIA GeForce RTX 3080 Ti
min:
181.1 fps, max:
-1 fps
234.1 259 [X] AMD Ryzen 9 7950X 4.5GHz
NVIDIA GeForce RTX 3080 Ti
min:
219.2 fps, max:
-1 fps
~ 234 fps
69%
NVIDIA GeForce RTX 3080:
109.3 [X] AMD Ryzen 9 5900X 3.7GHz
NVIDIA GeForce RTX 3080
min:
87.5 fps, max:
-1 fps
184.4 [X] AMD Ryzen 9 5900X 3.7GHz
NVIDIA GeForce RTX 3080
min:
147.7 fps, max:
-1 fps
~ 147 fps
100%
NVIDIA GeForce RTX 3090:
134.3 [X] AMD Ryzen 9 5900X 3.7GHz
NVIDIA GeForce RTX 3090
min:
93.4 fps, max:
-1 fps
140.3 [X] AMD Ryzen 9 5900X 3.7GHz
NVIDIA GeForce RTX 3090
min:
114.7 fps, max:
-1 fps
163.7 [X] Intel Core i5-13400F 2.5GHz
NVIDIA GeForce RTX 3090
min:
141.6 fps, max:
-1 fps
165.9 [X] MSI MEG Z590 ACE Intel Core i9-11900K 3.5GHz
NVIDIA GeForce RTX 3090
min:
145 fps, max:
-1 fps
171.9 [X] Intel Core i5-12600K Intel Core i5-12600K 2.8GHz
NVIDIA GeForce RTX 3090
min:
149.6 fps, max:
-1 fps
196.8 [X] Desktop-PC Intel Core i9-12900K 3.2GHz
NVIDIA GeForce RTX 3090
min:
171.6 fps, max:
-1 fps
205.4 [X] Intel Core i5-13600K 3.5GHz
NVIDIA GeForce RTX 3090
min:
178.9 fps, max:
-1 fps
219.9 222.3 228.5 [X] AMD Ryzen 5 7600X 4.7GHz
NVIDIA GeForce RTX 3090
min:
193.7 fps, max:
-1 fps
229.2 [X] Intel Core i9-13900K 3GHz
NVIDIA GeForce RTX 3090
min:
192.7 fps, max:
-1 fps
231.1 231.7 [X] AMD Ryzen 9 7900X 4.7GHz
NVIDIA GeForce RTX 3090
min:
196.5 fps, max:
-1 fps
231.7 [X] NVIDIA GeForce RTX 3090 Founders Edition AMD Ryzen 9 7950X 4.5GHz
NVIDIA GeForce RTX 3090
min:
195.5 fps, max:
-1 fps
235 [X] Nvidia GeForce RTX 3090 FE Intel Core i9-14900K 3.2GHz
NVIDIA GeForce RTX 3090
min:
199.3 fps, max:
-1 fps
244.1 [X] Nvidia GeForce RTX 3090 FE AMD Ryzen 9 7950X 4.5GHz
NVIDIA GeForce RTX 3090
min:
209.1 fps, max:
-1 fps
~ 203 fps
106%
NVIDIA GeForce RTX 3080 Ti:
196.1 [X] Corsair One i300 Intel Core i9-12900K 3.2GHz
NVIDIA GeForce RTX 3080 Ti
min:
169.6 fps, max:
-1 fps
216.6 235 [X] AMD Ryzen 9 7950X 4.5GHz
NVIDIA GeForce RTX 3080 Ti
min:
195.7 fps, max:
-1 fps
~ 216 fps
67%
NVIDIA GeForce RTX 3080:
101.1 [X] AMD Ryzen 9 5900X 3.7GHz
NVIDIA GeForce RTX 3080
min:
82.4 fps, max:
-1 fps
168.7 [X] AMD Ryzen 9 5900X 3.7GHz
NVIDIA GeForce RTX 3080
min:
132.8 fps, max:
-1 fps
~ 135 fps
100%
NVIDIA GeForce RTX 3090:
138.6 [X] AMD Ryzen 9 5900X 3.7GHz
NVIDIA GeForce RTX 3090
min:
69.8 fps, max:
-1 fps
142.8 [X] AMD Ryzen 9 5900X 3.7GHz
NVIDIA GeForce RTX 3090
min:
116.2 fps, max:
-1 fps
161.1 [X] Intel Core i5-13400F 2.5GHz
NVIDIA GeForce RTX 3090
min:
137.5 fps, max:
-1 fps
161.1 [X] Intel Core i5-13400F 2.5GHz
NVIDIA GeForce RTX 3090
min:
137.5 fps, max:
-1 fps
161.4 [X] MSI MEG Z590 ACE Intel Core i9-11900K 3.5GHz
NVIDIA GeForce RTX 3090
min:
136.2 fps, max:
-1 fps
169 [X] Intel Core i5-12600K Intel Core i5-12600K 2.8GHz
NVIDIA GeForce RTX 3090
min:
143 fps, max:
-1 fps
200.4 [X] Intel Core i5-13600K 3.5GHz
NVIDIA GeForce RTX 3090
min:
166.9 fps, max:
-1 fps
203.5 208.1 211.3 214.5 [X] AMD Ryzen 5 7600X 4.7GHz
NVIDIA GeForce RTX 3090
min:
175.6 fps, max:
-1 fps
215.9 [X] Intel Core i9-13900K 3GHz
NVIDIA GeForce RTX 3090
min:
177.2 fps, max:
-1 fps
216.7 [X] AMD Ryzen 9 7900X 4.7GHz
NVIDIA GeForce RTX 3090
min:
177 fps, max:
-1 fps
216.9 [X] NVIDIA GeForce RTX 3090 Founders Edition AMD Ryzen 9 7950X 4.5GHz
NVIDIA GeForce RTX 3090
min:
174.1 fps, max:
-1 fps
217.9 [X] Nvidia GeForce RTX 3090 FE AMD Ryzen 9 7950X 4.5GHz
NVIDIA GeForce RTX 3090
min:
173.7 fps, max:
-1 fps
222 [X] Nvidia GeForce RTX 3090 FE Intel Core i9-14900K 3.2GHz
NVIDIA GeForce RTX 3090
min:
179.7 fps, max:
-1 fps
~ 191 fps
109%
NVIDIA GeForce RTX 3080 Ti:
191.5 [X] Corsair One i300 Intel Core i9-12900K 3.2GHz
NVIDIA GeForce RTX 3080 Ti
min:
161.9 fps, max:
-1 fps
211.1 220 [X] AMD Ryzen 9 7950X 4.5GHz
NVIDIA GeForce RTX 3080 Ti
min:
174.4 fps, max:
-1 fps
~ 208 fps
68%
NVIDIA GeForce RTX 3080:
98 [X] AMD Ryzen 9 5900X 3.7GHz
NVIDIA GeForce RTX 3080
min:
79.1 fps, max:
-1 fps
159.1 [X] AMD Ryzen 9 5900X 3.7GHz
NVIDIA GeForce RTX 3080
min:
125.2 fps, max:
-1 fps
~ 129 fps
100%
NVIDIA GeForce RTX 3090:
355 [X] AMD Ryzen 9 5900X 3.7GHz
NVIDIA GeForce RTX 3090
min:
292 fps, max:
419 fps
437.6 [X] AMD Ryzen 9 5900X 3.7GHz
NVIDIA GeForce RTX 3090
480 [X] Intel Core i5-13400F 2.5GHz
NVIDIA GeForce RTX 3090
min:
58.6 fps, P0.1:
220 fps, P1:
360 fps, max:
744 fps
611 [X] Intel Core i5-13600K 3.5GHz
NVIDIA GeForce RTX 3090
min:
87.5 fps, P0.1:
340 fps, P1:
454 fps, max:
1018 fps
644 [X] Desktop-PC Intel Core i9-12900K 3.2GHz
NVIDIA GeForce RTX 3090
min:
12 fps
703 [X] AMD Ryzen 9 7950X AMD Ryzen 9 7950X 4.5GHz
NVIDIA GeForce RTX 3090
min:
623 fps, P1:
625.28 fps, max:
781 fps
710 [X] AMD Ryzen 5 7600X 4.7GHz
NVIDIA GeForce RTX 3090
min:
99.8 fps, P0.1:
384 fps, P1:
495 fps, max:
1262 fps
726 [X] AMD Ryzen 7 7700X AMD Ryzen 7 7700X 4.5GHz
NVIDIA GeForce RTX 3090
min:
642 fps, P1:
648.72 fps, max:
790 fps
752 [X] Intel Core i9-13900K 3GHz
NVIDIA GeForce RTX 3090
min:
33.9 fps, P0.1:
316 fps, P1:
533 fps, max:
1214 fps
756 [X] AMD Ryzen 7 7700 AMD Ryzen 7 7700 3.8GHz
NVIDIA GeForce RTX 3090
min:
630 fps, P1:
637.5 fps, max:
883 fps
773 [X] AMD Ryzen 9 7900X 4.7GHz
NVIDIA GeForce RTX 3090
min:
81.6 fps, P0.1:
345 fps, P1:
543 fps, max:
1294 fps
786 [X] Nvidia GeForce RTX 3090 FE AMD Ryzen 9 7950X 4.5GHz
NVIDIA GeForce RTX 3090
816 [X] NVIDIA GeForce RTX 3090 Founders Edition AMD Ryzen 9 7950X 4.5GHz
NVIDIA GeForce RTX 3090
min:
23.3 fps, P0.1:
360 fps, P1:
567 fps, max:
1364 fps
~ 658 fps
110%
NVIDIA GeForce RTX 3080 Ti:
681 [X] Corsair One i300 Intel Core i9-12900K 3.2GHz
NVIDIA GeForce RTX 3080 Ti
min:
29.2 fps, P0.1:
290 fps, P1:
486 fps, max:
983 fps
702 783 [X] AMD Ryzen 9 7950X 4.5GHz
NVIDIA GeForce RTX 3080 Ti
min:
21.4 fps, P0.1:
250 fps, P1:
527 fps, max:
1361 fps
~ 722 fps
66%
NVIDIA GeForce RTX 3080:
427 [X] AMD Ryzen 9 5900X 3.7GHz
NVIDIA GeForce RTX 3080
min:
363 fps, max:
484 fps
446 [X] AMD Ryzen 9 5900X 3.7GHz
NVIDIA GeForce RTX 3080
min:
375 fps, max:
509 fps
~ 437 fps
100%
NVIDIA GeForce RTX 3090:
335 [X] AMD Ryzen 9 5900X 3.7GHz
NVIDIA GeForce RTX 3090
min:
283 fps, max:
384 fps
418.7 [X] AMD Ryzen 9 5900X 3.7GHz
NVIDIA GeForce RTX 3090
446 [X] Intel Core i5-13400F 2.5GHz
NVIDIA GeForce RTX 3090
min:
59 fps, P0.1:
255 fps, P1:
338 fps, max:
666 fps
529 [X] AMD Ryzen 7 7700X AMD Ryzen 7 7700X 4.5GHz
NVIDIA GeForce RTX 3090
min:
453 fps, P1:
468.12 fps, max:
598 fps
551 [X] Intel Core i5-13600K 3.5GHz
NVIDIA GeForce RTX 3090
min:
121.6 fps, P0.1:
299 fps, P1:
394 fps, max:
869 fps
551 [X] AMD Ryzen 9 7950X AMD Ryzen 9 7950X 4.5GHz
NVIDIA GeForce RTX 3090
min:
478 fps, P1:
479.16 fps, max:
634 fps
566 [X] AMD Ryzen 5 7600X 4.7GHz
NVIDIA GeForce RTX 3090
min:
95.4 fps, P0.1:
286 fps, P1:
387 fps, max:
969 fps
582.2 [X] Nvidia GeForce RTX 3090 FE AMD Ryzen 9 7950X 4.5GHz
NVIDIA GeForce RTX 3090
584 [X] Intel Core i9-13900K 3GHz
NVIDIA GeForce RTX 3090
min:
120 fps, P0.1:
284 fps, P1:
412 fps, max:
988 fps
586 [X] AMD Ryzen 9 7900X 4.7GHz
NVIDIA GeForce RTX 3090
min:
95.2 fps, P0.1:
287 fps, P1:
397 fps, max:
1056 fps
591 [X] AMD Ryzen 7 7700 AMD Ryzen 7 7700 3.8GHz
NVIDIA GeForce RTX 3090
min:
502 fps, P1:
513.6 fps, max:
664 fps
592 [X] NVIDIA GeForce RTX 3090 Founders Edition AMD Ryzen 9 7950X 4.5GHz
NVIDIA GeForce RTX 3090
min:
96.9 fps, P0.1:
311 fps, P1:
429 fps, max:
1030 fps
~ 528 fps
108%
NVIDIA GeForce RTX 3080 Ti:
554 [X] Corsair One i300 Intel Core i9-12900K 3.2GHz
NVIDIA GeForce RTX 3080 Ti
min:
87.5 fps, P0.1:
251 fps, P1:
376 fps, max:
867 fps
564 586 [X] AMD Ryzen 9 7950X 4.5GHz
NVIDIA GeForce RTX 3080 Ti
min:
28.1 fps, P0.1:
272 fps, P1:
413 fps, max:
998 fps
~ 568 fps
75%
NVIDIA GeForce RTX 3080:
375 [X] AMD Ryzen 9 5900X 3.7GHz
NVIDIA GeForce RTX 3080
min:
332 fps, max:
443 fps
413 [X] AMD Ryzen 9 5900X 3.7GHz
NVIDIA GeForce RTX 3080
min:
371 fps, max:
464 fps
~ 394 fps
100%
NVIDIA GeForce RTX 3090:
265 [X] AMD Ryzen 5 7600X 4.7GHz
NVIDIA GeForce RTX 3090
min:
73.6 fps, P0.1:
158.7 fps, P1:
214 fps, max:
634 fps
292 [X] AMD Ryzen 9 5900X 3.7GHz
NVIDIA GeForce RTX 3090
min:
258 fps, max:
325 fps
338.6 [X] AMD Ryzen 9 5900X 3.7GHz
NVIDIA GeForce RTX 3090
344 [X] AMD Ryzen 7 7700X AMD Ryzen 7 7700X 4.5GHz
NVIDIA GeForce RTX 3090
min:
288 fps, P1:
297.69 fps, max:
387 fps
358 [X] AMD Ryzen 9 7950X AMD Ryzen 9 7950X 4.5GHz
NVIDIA GeForce RTX 3090
min:
291 fps, P1:
294.99 fps, max:
404 fps
368 [X] Intel Core i9-13900K 3GHz
NVIDIA GeForce RTX 3090
min:
82.7 fps, P0.1:
219 fps, P1:
304 fps, max:
808 fps
369 [X] Intel Core i5-13600K 3.5GHz
NVIDIA GeForce RTX 3090
min:
20.3 fps, P0.1:
215 fps, P1:
289 fps, max:
710 fps
371.1 [X] Nvidia GeForce RTX 3090 FE AMD Ryzen 9 7950X 4.5GHz
NVIDIA GeForce RTX 3090
379 [X] AMD Ryzen 7 7700 AMD Ryzen 7 7700 3.8GHz
NVIDIA GeForce RTX 3090
min:
335 fps, P1:
335.9 fps, max:
428 fps
381 [X] Intel Core i5-13400F 2.5GHz
NVIDIA GeForce RTX 3090
min:
98.2 fps, P0.1:
195.2 fps, P1:
276 fps, max:
604 fps
384 [X] AMD Ryzen 9 7900X 4.7GHz
NVIDIA GeForce RTX 3090
min:
21.2 fps, P0.1:
198.9 fps, P1:
308 fps, max:
810 fps
393 [X] NVIDIA GeForce RTX 3090 Founders Edition AMD Ryzen 9 7950X 4.5GHz
NVIDIA GeForce RTX 3090
min:
40.2 fps, P0.1:
209 fps, P1:
317 fps, max:
929 fps
~ 354 fps
105%
NVIDIA GeForce RTX 3080 Ti:
365 [X] Corsair One i300 Intel Core i9-12900K 3.2GHz
NVIDIA GeForce RTX 3080 Ti
min:
68.6 fps, P0.1:
182 fps, P1:
288 fps, max:
718 fps
372 [X] AMD Ryzen 9 7950X 4.5GHz
NVIDIA GeForce RTX 3080 Ti
min:
24.9 fps, P0.1:
185.2 fps, P1:
310 fps, max:
858 fps
374 ~ 370 fps
86%
NVIDIA GeForce RTX 3080:
286 [X] AMD Ryzen 9 5900X 3.7GHz
NVIDIA GeForce RTX 3080
min:
258 fps, max:
312 fps
320 [X] AMD Ryzen 9 5900X 3.7GHz
NVIDIA GeForce RTX 3080
min:
290 fps, max:
353 fps
~ 303 fps
100%
NVIDIA GeForce RTX 3090:
160 [X] AMD Ryzen 9 5900X 3.7GHz
NVIDIA GeForce RTX 3090
min:
140 fps, max:
184 fps
168.6 [X] AMD Ryzen 7 7700X ECO 65 W AMD Ryzen 7 7700X 4.5GHz
NVIDIA GeForce RTX 3090
min:
164 fps, P1:
166 fps, max:
171 fps
171.5 [X] AMD Ryzen 9 5900X 3.7GHz
NVIDIA GeForce RTX 3090
172.4 [X] AMD Ryzen 7 7700X AMD Ryzen 7 7700X 4.5GHz
NVIDIA GeForce RTX 3090
min:
152 fps, P1:
152 fps, max:
196 fps
175.2 [X] AMD Ryzen 9 7950X AMD Ryzen 9 7950X 4.5GHz
NVIDIA GeForce RTX 3090
min:
158 fps, P1:
158.56 fps, max:
194 fps
177 [X] AMD Ryzen 9 7950X ECO 65 W AMD Ryzen 9 7950X 4.5GHz
NVIDIA GeForce RTX 3090
min:
152 fps, P1:
173.18 fps, max:
184 fps
177.1 [X] AMD Ryzen 9 7950X ECO 105 W AMD Ryzen 9 7950X 4.5GHz
NVIDIA GeForce RTX 3090
min:
173 fps, P1:
174 fps, max:
181 fps
179.8 [X] Intel Core i9-13900K 3GHz
NVIDIA GeForce RTX 3090
min:
98.3 fps, P0.1:
120.2 fps, P1:
148.7 fps, max:
458 fps
181 [X] Desktop-PC Intel Core i9-12900K 3.2GHz
NVIDIA GeForce RTX 3090
min:
13 fps
183.2 [X] Intel Core i5-13600K 3.5GHz
NVIDIA GeForce RTX 3090
min:
34.9 fps, P0.1:
116.1 fps, P1:
149.9 fps, max:
408 fps
185.5 [X] Nvidia GeForce RTX 3090 FE AMD Ryzen 9 7950X 4.5GHz
NVIDIA GeForce RTX 3090
186.4 [X] AMD Ryzen 5 7600X 4.7GHz
NVIDIA GeForce RTX 3090
min:
85.2 fps, P0.1:
119.4 fps, P1:
152.4 fps, max:
439 fps
187.8 [X] Intel Core i5-13400F 2.5GHz
NVIDIA GeForce RTX 3090
min:
89.8 fps, P0.1:
105.7 fps, P1:
147.9 fps, max:
335 fps
188.1 [X] AMD Ryzen 9 7900X 4.7GHz
NVIDIA GeForce RTX 3090
min:
93.6 fps, P0.1:
119.6 fps, P1:
157 fps, max:
509 fps
192 [X] AMD Ryzen 7 7700 AMD Ryzen 7 7700 3.8GHz
NVIDIA GeForce RTX 3090
min:
167 fps, P1:
167.47 fps, max:
220 fps
192.6 [X] NVIDIA GeForce RTX 3090 Founders Edition AMD Ryzen 9 7950X 4.5GHz
NVIDIA GeForce RTX 3090
min:
60.2 fps, P0.1:
115.6 fps, P1:
159.3 fps, max:
579 fps
~ 180 fps
100%
NVIDIA GeForce RTX 3080 Ti:
174 179.1 [X] Intel NUC13 Raptor Canyon Intel Core i9-13900K 3GHz
NVIDIA GeForce RTX 3080 Ti
min:
88.3 fps, P0.1:
112.8 fps, P1:
149.4 fps, max:
475 fps
183 [X] Corsair One i300 Intel Core i9-12900K 3.2GHz
NVIDIA GeForce RTX 3080 Ti
min:
62.1 fps, P0.1:
107 fps, P1:
149 fps, max:
431 fps
184.6 [X] AMD Ryzen 9 7950X 4.5GHz
NVIDIA GeForce RTX 3080 Ti
min:
67.2 fps, P0.1:
103.2 fps, P1:
158 fps, max:
493 fps
~ 180 fps
83%
NVIDIA GeForce RTX 3080:
145 [X] AMD Ryzen 9 5900X 3.7GHz
NVIDIA GeForce RTX 3080
min:
123 fps, max:
154 fps
152 [X] AMD Ryzen 9 5900X 3.7GHz
NVIDIA GeForce RTX 3080
min:
138 fps, max:
171 fps
~ 149 fps
100%
NVIDIA GeForce RTX 3090:
128 [X] AMD Ryzen 9 5900X 3.7GHz
NVIDIA GeForce RTX 3090
min:
117 fps, max:
138 fps
148 [X] AMD Ryzen 9 5900X 3.7GHz
NVIDIA GeForce RTX 3090
148.3 [X] AMD Ryzen 7 7700X AMD Ryzen 7 7700X 4.5GHz
NVIDIA GeForce RTX 3090
min:
133 fps, P1:
134.14 fps, max:
159 fps
150.9 [X] AMD Ryzen 9 7950X AMD Ryzen 9 7950X 4.5GHz
NVIDIA GeForce RTX 3090
min:
137 fps, P1:
137.57 fps, max:
161 fps
151 [X] Nvidia GeForce RTX 3090 FE AMD Ryzen 9 7950X 4.5GHz
NVIDIA GeForce RTX 3090
151.6 [X] Intel Core i9-13900K 3GHz
NVIDIA GeForce RTX 3090
min:
24.7 fps, P0.1:
114.1 fps, P1:
131.8 fps, max:
659 fps
152.8 [X] Intel Core i5-13600K 3.5GHz
NVIDIA GeForce RTX 3090
min:
88.8 fps, P0.1:
115.3 fps, P1:
132.3 fps, max:
370 fps
155.5 [X] NVIDIA GeForce RTX 3090 Founders Edition AMD Ryzen 9 7950X 4.5GHz
NVIDIA GeForce RTX 3090
min:
28 fps, P0.1:
94.5 fps, P1:
133.8 fps, max:
704 fps
156.4 [X] Intel Core i5-13400F 2.5GHz
NVIDIA GeForce RTX 3090
min:
81.4 fps, P0.1:
110.3 fps, P1:
133.7 fps, max:
399 fps
156.9 [X] AMD Ryzen 9 7900X 4.7GHz
NVIDIA GeForce RTX 3090
min:
22.1 fps, P0.1:
118.6 fps, P1:
136.6 fps, max:
513 fps
158.1 [X] AMD Ryzen 5 7600X 4.7GHz
NVIDIA GeForce RTX 3090
min:
87.2 fps, P0.1:
109 fps, P1:
135.4 fps, max:
524 fps
160.2 [X] AMD Ryzen 7 7700 AMD Ryzen 7 7700 3.8GHz
NVIDIA GeForce RTX 3090
min:
144 fps, P1:
144.92 fps, max:
174 fps
~ 151 fps
101%
NVIDIA GeForce RTX 3080 Ti:
149 149 [X] Corsair One i300 Intel Core i9-12900K 3.2GHz
NVIDIA GeForce RTX 3080 Ti
min:
41.5 fps, P0.1:
102 fps, P1:
127 fps, max:
584 fps
154.9 [X] AMD Ryzen 9 7950X 4.5GHz
NVIDIA GeForce RTX 3080 Ti
min:
54.5 fps, P0.1:
91.3 fps, P1:
134.4 fps, max:
636 fps
156.8 [X] Intel NUC13 Raptor Canyon Intel Core i9-13900K 3GHz
NVIDIA GeForce RTX 3080 Ti
min:
29.3 fps, P0.1:
110.6 fps, P1:
134.2 fps, max:
617 fps
~ 152 fps
76%
NVIDIA GeForce RTX 3080:
114 [X] AMD Ryzen 9 5900X 3.7GHz
NVIDIA GeForce RTX 3080
min:
106 fps, max:
122 fps
115 [X] AMD Ryzen 9 5900X 3.7GHz
NVIDIA GeForce RTX 3080
min:
107 fps, max:
124 fps
~ 115 fps
100%
NVIDIA GeForce RTX 3090:
180 [X] AMD Ryzen 9 5900X 3.7GHz
NVIDIA GeForce RTX 3090
min:
3.47 fps, P1:
111 fps, max:
485 fps
184 [X] AMD Ryzen 9 5900X 3.7GHz
NVIDIA GeForce RTX 3090
min:
2.11 fps, P1:
125 fps, max:
580 fps
186.1 [X] Intel Core i5-12600K Intel Core i5-12600K 2.8GHz
NVIDIA GeForce RTX 3090
min:
2.03 fps, P1:
166.7 fps, max:
287 fps
186.8 [X] Intel Core i5-13400F 2.5GHz
NVIDIA GeForce RTX 3090
min:
6.77 fps, P1:
166.7 fps, max:
467 fps
187 [X] AMD Ryzen 7 7700 AMD Ryzen 7 7700 3.8GHz
NVIDIA GeForce RTX 3090
min:
8.56 fps, P1:
166.7 fps, max:
708 fps
187.4 [X] Desktop-PC Intel Core i9-12900K 3.2GHz
NVIDIA GeForce RTX 3090
min:
41.6 fps, P1:
200 fps, max:
443 fps
187.5 [X] AMD Ryzen 9 7900X 4.7GHz
NVIDIA GeForce RTX 3090
min:
8.3 fps, P1:
200 fps, max:
623 fps
187.5 [X] AMD Ryzen 5 7600X 4.7GHz
NVIDIA GeForce RTX 3090
min:
10.5 fps, P1:
200 fps, max:
530 fps
187.5 [X] Intel Core i5-13600K 3.5GHz
NVIDIA GeForce RTX 3090
min:
1.506 fps, P1:
200 fps, max:
547 fps
187.5 [X] NVIDIA GeForce RTX 3090 Founders Edition AMD Ryzen 9 7950X 4.5GHz
NVIDIA GeForce RTX 3090
min:
8.34 fps, P1:
200 fps, max:
595 fps
187.7 [X] Intel Core i9-13900K 3GHz
NVIDIA GeForce RTX 3090
min:
3.47 fps, P1:
200 fps, max:
694 fps
187.8 [X] AMD Ryzen 9 7950X AMD Ryzen 9 7950X 4.5GHz
NVIDIA GeForce RTX 3090
min:
5.71 fps, P1:
200 fps, max:
670 fps
187.8 [X] AMD Ryzen 7 7700X AMD Ryzen 7 7700X 4.5GHz
NVIDIA GeForce RTX 3090
min:
6.59 fps, P1:
200 fps, max:
798 fps
188 [X] Nvidia GeForce RTX 3090 FE AMD Ryzen 9 7950X 4.5GHz
NVIDIA GeForce RTX 3090
min:
7.14 fps, P1:
200 fps, max:
761 fps
~ 187 fps
101%
NVIDIA GeForce RTX 3080 Ti:
187 [X] Corsair One i300 Intel Core i9-12900K 3.2GHz
NVIDIA GeForce RTX 3080 Ti
min:
2.54 fps, P1:
200 fps, max:
334 fps
187.6 188 [X] AMD Ryzen 9 7950X 4.5GHz
NVIDIA GeForce RTX 3080 Ti
min:
2.61 fps, P1:
200 fps, max:
662 fps
~ 188 fps
99%
NVIDIA GeForce RTX 3080:
182 [X] AMD Ryzen 9 5900X 3.7GHz
NVIDIA GeForce RTX 3080
min:
2.02 fps, P1:
125 fps, max:
451 fps
187 [X] AMD Ryzen 9 5900X 3.7GHz
NVIDIA GeForce RTX 3080
min:
2.01 fps, P1:
125 fps, max:
568 fps
~ 185 fps
100%
NVIDIA GeForce RTX 3090:
174 [X] AMD Ryzen 9 5900X 3.7GHz
NVIDIA GeForce RTX 3090
min:
2.54 fps, P1:
111 fps, max:
439 fps
176 [X] AMD Ryzen 9 5900X 3.7GHz
NVIDIA GeForce RTX 3090
min:
3.25 fps, P1:
111 fps, max:
439 fps
185.6 [X] Intel Core i5-13400F 2.5GHz
NVIDIA GeForce RTX 3090
min:
2.13 fps, P1:
166.7 fps, max:
491 fps
187.5 [X] AMD Ryzen 9 7900X 4.7GHz
NVIDIA GeForce RTX 3090
min:
46.1 fps, P1:
200 fps, max:
360 fps
187.5 [X] AMD Ryzen 5 7600X 4.7GHz
NVIDIA GeForce RTX 3090
min:
9.07 fps, P1:
200 fps, max:
362 fps
187.5 [X] Intel Core i5-13600K 3.5GHz
NVIDIA GeForce RTX 3090
min:
5.1 fps, P1:
200 fps, max:
581 fps
187.5 [X] NVIDIA GeForce RTX 3090 Founders Edition AMD Ryzen 9 7950X 4.5GHz
NVIDIA GeForce RTX 3090
min:
4.18 fps, P1:
200 fps, max:
607 fps
187.6 [X] AMD Ryzen 7 7700X AMD Ryzen 7 7700X 4.5GHz
NVIDIA GeForce RTX 3090
min:
6.02 fps, P1:
200 fps, max:
721 fps
187.6 [X] AMD Ryzen 7 7700 AMD Ryzen 7 7700 3.8GHz
NVIDIA GeForce RTX 3090
min:
9.08 fps, P1:
200 fps, max:
674 fps
187.7 [X] Intel Core i9-13900K 3GHz
NVIDIA GeForce RTX 3090
min:
3.7 fps, P1:
200 fps, max:
613 fps
187.8 [X] AMD Ryzen 9 7950X AMD Ryzen 9 7950X 4.5GHz
NVIDIA GeForce RTX 3090
min:
11.3 fps, P1:
200 fps, max:
631 fps
187.9 [X] Nvidia GeForce RTX 3090 FE AMD Ryzen 9 7950X 4.5GHz
NVIDIA GeForce RTX 3090
min:
2.52 fps, P1:
200 fps, max:
696 fps
~ 185 fps
101%
NVIDIA GeForce RTX 3080 Ti:
187 [X] Corsair One i300 Intel Core i9-12900K 3.2GHz
NVIDIA GeForce RTX 3080 Ti
min:
2.6 fps, P1:
167 fps, max:
348 fps
187.4 187.9 [X] AMD Ryzen 9 7950X 4.5GHz
NVIDIA GeForce RTX 3080 Ti
min:
5.85 fps, P1:
200 fps, max:
705 fps
~ 187 fps
98%
NVIDIA GeForce RTX 3080:
175 [X] AMD Ryzen 9 5900X 3.7GHz
NVIDIA GeForce RTX 3080
min:
3.19 fps, P1:
111 fps, max:
478 fps
187 [X] AMD Ryzen 9 5900X 3.7GHz
NVIDIA GeForce RTX 3080
min:
1.852 fps, P1:
125 fps, max:
536 fps
~ 181 fps
100%
NVIDIA GeForce RTX 3090:
165 168 [X] AMD Ryzen 9 5900X 3.7GHz
NVIDIA GeForce RTX 3090
min:
8.56 fps, P1:
66.7 fps, max:
201 fps
175 [X] AMD Ryzen 9 5900X 3.7GHz
NVIDIA GeForce RTX 3090
min:
3 fps, P1:
125 fps, max:
386 fps
182.1 [X] Intel Core i5-13400F 2.5GHz
NVIDIA GeForce RTX 3090
min:
2.84 fps, P1:
142.9 fps, max:
259 fps
186.4 [X] AMD Ryzen 7 7700X AMD Ryzen 7 7700X 4.5GHz
NVIDIA GeForce RTX 3090
min:
6.14 fps, P1:
166.7 fps, max:
645 fps
186.7 [X] AMD Ryzen 5 7600X 4.7GHz
NVIDIA GeForce RTX 3090
min:
7.46 fps, P1:
166.7 fps, max:
442 fps
186.7 [X] Intel Core i5-13600K 3.5GHz
NVIDIA GeForce RTX 3090
min:
1.624 fps, P1:
166.7 fps, max:
502 fps
187.1 [X] AMD Ryzen 9 7900X 4.7GHz
NVIDIA GeForce RTX 3090
min:
2.81 fps, P1:
200 fps, max:
354 fps
187.2 [X] AMD Ryzen 7 7700 AMD Ryzen 7 7700 3.8GHz
NVIDIA GeForce RTX 3090
min:
7.96 fps, P1:
200 fps, max:
521 fps
187.2 [X] Nvidia GeForce RTX 3090 FE AMD Ryzen 9 7950X 4.5GHz
NVIDIA GeForce RTX 3090
min:
2.42 fps, P1:
166.7 fps, max:
635 fps
187.3 [X] AMD Ryzen 9 7950X AMD Ryzen 9 7950X 4.5GHz
NVIDIA GeForce RTX 3090
min:
4.13 fps, P1:
200 fps, max:
603 fps
187.4 [X] Intel Core i9-13900K 3GHz
NVIDIA GeForce RTX 3090
min:
3.68 fps, P1:
200 fps, max:
521 fps
187.5 [X] NVIDIA GeForce RTX 3090 Founders Edition AMD Ryzen 9 7950X 4.5GHz
NVIDIA GeForce RTX 3090
min:
19.8 fps, P1:
200 fps, max:
411 fps
~ 183 fps
102%
NVIDIA GeForce RTX 3080 Ti:
187 [X] Corsair One i300 Intel Core i9-12900K 3.2GHz
NVIDIA GeForce RTX 3080 Ti
min:
2.5 fps, P1:
167 fps, max:
442 fps
187 187.1 [X] AMD Ryzen 9 7950X 4.5GHz
NVIDIA GeForce RTX 3080 Ti
min:
4.1 fps, P1:
200 fps, max:
639 fps
~ 187 fps
97%
NVIDIA GeForce RTX 3080:
169 [X] AMD Ryzen 9 5900X 3.7GHz
NVIDIA GeForce RTX 3080
min:
3.6 fps, P1:
90.9 fps, max:
375 fps
184 [X] AMD Ryzen 9 5900X 3.7GHz
NVIDIA GeForce RTX 3080
min:
2.21 fps, P1:
125 fps, max:
464 fps
~ 177 fps
100%
NVIDIA GeForce RTX 3090:
104 105 [X] AMD Ryzen 9 5900X 3.7GHz
NVIDIA GeForce RTX 3090
min:
6.33 fps, P1:
43.5 fps, max:
114 fps
114 [X] AMD Ryzen 9 5900X 3.7GHz
NVIDIA GeForce RTX 3090
min:
6.72 fps, P1:
71.4 fps, max:
223 fps
130.5 [X] Intel Core i5-13400F 2.5GHz
NVIDIA GeForce RTX 3090
min:
8.56 fps, P1:
100 fps, max:
218 fps
133 [X] Intel Core i5-12600K Intel Core i5-12600K 2.8GHz
NVIDIA GeForce RTX 3090
min:
5.5 fps, P1:
90.9 fps, max:
206 fps
148.7 [X] Desktop-PC Intel Core i9-12900K 3.2GHz
NVIDIA GeForce RTX 3090
min:
3.1 fps, P1:
111.1 fps, max:
272 fps
154.9 [X] Intel Core i5-13600K 3.5GHz
NVIDIA GeForce RTX 3090
min:
8.8 fps, P1:
125 fps, max:
271 fps
155.2 [X] AMD Ryzen 5 7600X 4.7GHz
NVIDIA GeForce RTX 3090
min:
5.9 fps, P1:
111.1 fps, max:
371 fps
155.4 [X] AMD Ryzen 9 7950X AMD Ryzen 9 7950X 4.5GHz
NVIDIA GeForce RTX 3090
min:
7.73 fps, P1:
111.1 fps, max:
320 fps
155.7 [X] AMD Ryzen 7 7700 AMD Ryzen 7 7700 3.8GHz
NVIDIA GeForce RTX 3090
min:
8.09 fps, P1:
111.1 fps, max:
316 fps
155.8 [X] AMD Ryzen 7 7700X AMD Ryzen 7 7700X 4.5GHz
NVIDIA GeForce RTX 3090
min:
8.41 fps, P1:
111.1 fps, max:
353 fps
161.4 [X] AMD Ryzen 9 7900X 4.7GHz
NVIDIA GeForce RTX 3090
min:
8.93 fps, P1:
125 fps, max:
341 fps
163.6 [X] Nvidia GeForce RTX 3090 FE AMD Ryzen 9 7950X 4.5GHz
NVIDIA GeForce RTX 3090
min:
4.11 fps, P1:
125 fps, max:
356 fps
164.9 [X] NVIDIA GeForce RTX 3090 Founders Edition AMD Ryzen 9 7950X 4.5GHz
NVIDIA GeForce RTX 3090
min:
3.74 fps, P1:
125 fps, max:
280 fps
165.6 [X] Intel Core i9-13900K 3GHz
NVIDIA GeForce RTX 3090
min:
9.1 fps, P1:
125 fps, max:
349 fps
~ 145 fps
109%
NVIDIA GeForce RTX 3080 Ti:
149 [X] Corsair One i300 Intel Core i9-12900K 3.2GHz
NVIDIA GeForce RTX 3080 Ti
min:
8.57 fps, P1:
100 fps, max:
295 fps
161.5 163.6 [X] AMD Ryzen 9 7950X 4.5GHz
NVIDIA GeForce RTX 3080 Ti
min:
8.63 fps, P1:
111.1 fps, max:
329 fps
~ 158 fps
81%
NVIDIA GeForce RTX 3080:
104 [X] AMD Ryzen 9 5900X 3.7GHz
NVIDIA GeForce RTX 3080
min:
7.09 fps, P1:
62.5 fps, max:
221 fps
130 [X] AMD Ryzen 9 5900X 3.7GHz
NVIDIA GeForce RTX 3080
min:
5.89 fps, P1:
76.9 fps, max:
233 fps
~ 117 fps
100%
NVIDIA GeForce RTX 3090:
99.3 100 [X] AMD Ryzen 9 5900X 3.7GHz
NVIDIA GeForce RTX 3090
min:
5.25 fps, P1:
32.3 fps, max:
111 fps
109 [X] AMD Ryzen 9 5900X 3.7GHz
NVIDIA GeForce RTX 3090
min:
4.02 fps, P1:
66.7 fps, max:
212 fps
130.2 [X] Intel Core i5-13400F 2.5GHz
NVIDIA GeForce RTX 3090
min:
6.37 fps, P1:
90.9 fps, max:
260 fps
148 [X] AMD Ryzen 5 7600X 4.7GHz
NVIDIA GeForce RTX 3090
min:
7.61 fps, P1:
111.1 fps, max:
248 fps
148.3 [X] AMD Ryzen 7 7700X AMD Ryzen 7 7700X 4.5GHz
NVIDIA GeForce RTX 3090
min:
6.24 fps, P1:
111.1 fps, max:
241 fps
148.5 [X] Intel Core i5-13600K 3.5GHz
NVIDIA GeForce RTX 3090
min:
7.17 fps, P1:
111.1 fps, max:
222 fps
150.1 [X] AMD Ryzen 9 7950X AMD Ryzen 9 7950X 4.5GHz
NVIDIA GeForce RTX 3090
min:
6.33 fps, P1:
100 fps, max:
239 fps
150.5 [X] AMD Ryzen 7 7700 AMD Ryzen 7 7700 3.8GHz
NVIDIA GeForce RTX 3090
min:
2.71 fps, P1:
111.1 fps, max:
276 fps
151.8 [X] AMD Ryzen 9 7900X 4.7GHz
NVIDIA GeForce RTX 3090
min:
9.58 fps, P1:
111.1 fps, max:
238 fps
155.3 [X] NVIDIA GeForce RTX 3090 Founders Edition AMD Ryzen 9 7950X 4.5GHz
NVIDIA GeForce RTX 3090
min:
3.28 fps, P1:
111.1 fps, max:
279 fps
156.7 [X] Intel Core i9-13900K 3GHz
NVIDIA GeForce RTX 3090
min:
6.95 fps, P1:
111.1 fps, max:
318 fps
156.9 [X] Nvidia GeForce RTX 3090 FE AMD Ryzen 9 7950X 4.5GHz
NVIDIA GeForce RTX 3090
min:
3.18 fps, P1:
111.1 fps, max:
276 fps
~ 139 fps
109%
NVIDIA GeForce RTX 3080 Ti:
147 [X] Corsair One i300 Intel Core i9-12900K 3.2GHz
NVIDIA GeForce RTX 3080 Ti
min:
3.77 fps, P1:
111 fps, max:
255 fps
152.8 157 [X] AMD Ryzen 9 7950X 4.5GHz
NVIDIA GeForce RTX 3080 Ti
min:
3.44 fps, P1:
111.1 fps, max:
246 fps
~ 152 fps
81%
NVIDIA GeForce RTX 3080:
101 [X] AMD Ryzen 9 5900X 3.7GHz
NVIDIA GeForce RTX 3080
min:
5.45 fps, P1:
58.8 fps, max:
235 fps
122 [X] AMD Ryzen 9 5900X 3.7GHz
NVIDIA GeForce RTX 3080
min:
4.32 fps, P1:
66.7 fps, max:
238 fps
~ 112 fps
100%
NVIDIA GeForce RTX 3090:
151 [X] AMD Ryzen 9 5900X 3.7GHz
NVIDIA GeForce RTX 3090
min:
6.66 fps, P1:
33.3 fps, max:
81.5 fps
152 164 [X] AMD Ryzen 9 5900X 3.7GHz
NVIDIA GeForce RTX 3090
min:
2.97 fps, P1:
111 fps, max:
329 fps
176.5 [X] Intel Core i5-13400F 2.5GHz
NVIDIA GeForce RTX 3090
min:
1.802 fps, P1:
125 fps, max:
408 fps
180 [X] AMD Ryzen 7 7700X AMD Ryzen 7 7700X 4.5GHz
NVIDIA GeForce RTX 3090
min:
2.21 fps, P1:
125 fps, max:
612 fps
180.7 [X] Intel Core i5-13600K 3.5GHz
NVIDIA GeForce RTX 3090
min:
1.547 fps, P1:
125 fps, max:
510 fps
181.9 [X] AMD Ryzen 5 7600X 4.7GHz
NVIDIA GeForce RTX 3090
min:
3.65 fps, P1:
142.9 fps, max:
487 fps
181.9 [X] AMD Ryzen 9 7950X AMD Ryzen 9 7950X 4.5GHz
NVIDIA GeForce RTX 3090
min:
5.11 fps, P1:
125 fps, max:
578 fps
182.2 [X] AMD Ryzen 9 7900X 4.7GHz
NVIDIA GeForce RTX 3090
min:
1.569 fps, P1:
142.9 fps, max:
506 fps
182.5 [X] Intel Core i9-13900K 3GHz
NVIDIA GeForce RTX 3090
min:
1.708 fps, P1:
142.9 fps, max:
583 fps
182.5 [X] NVIDIA GeForce RTX 3090 Founders Edition AMD Ryzen 9 7950X 4.5GHz
NVIDIA GeForce RTX 3090
min:
2.85 fps, P1:
142.9 fps, max:
284 fps
183 [X] Nvidia GeForce RTX 3090 FE AMD Ryzen 9 7950X 4.5GHz
NVIDIA GeForce RTX 3090
min:
2.97 fps, P1:
125 fps, max:
634 fps
184.2 [X] AMD Ryzen 7 7700 AMD Ryzen 7 7700 3.8GHz
NVIDIA GeForce RTX 3090
min:
2.15 fps, P1:
142.9 fps, max:
528 fps
~ 176 fps
103%
NVIDIA GeForce RTX 3080 Ti:
180 [X] Corsair One i300 Intel Core i9-12900K 3.2GHz
NVIDIA GeForce RTX 3080 Ti
min:
2.49 fps, P1:
143 fps, max:
329 fps
182 182.6 [X] AMD Ryzen 9 7950X 4.5GHz
NVIDIA GeForce RTX 3080 Ti
min:
2.49 fps, P1:
125 fps, max:
569 fps
~ 182 fps
81%
NVIDIA GeForce RTX 3080:
136 [X] AMD Ryzen 9 5900X 3.7GHz
NVIDIA GeForce RTX 3080
min:
2.5 fps, P1:
111 fps, max:
361 fps
150 [X] AMD Ryzen 9 5900X 3.7GHz
NVIDIA GeForce RTX 3080
min:
12.6 fps, P1:
100 fps, max:
343 fps
~ 143 fps
Average Gaming NVIDIA GeForce RTX 3090 → 100% Average Gaming 30-70 fps → 100%
Average Gaming NVIDIA GeForce RTX 3080 Ti → 107% Average Gaming 30-70 fps → 101%
Average Gaming NVIDIA GeForce RTX 3080 → 90% Average Gaming 30-70 fps → 88%
 Deutsch
 English
 Español
 Français
 Italiano
 Nederlands
 Polski
 Português
 Русский
 Türkçe
 Svenska
 Chinese
 Magyar