NVIDIA GeForce RTX 3070 vs NVIDIA GeForce RTX 3050 vs NVIDIA GeForce RTX 3080 Laptop GPU
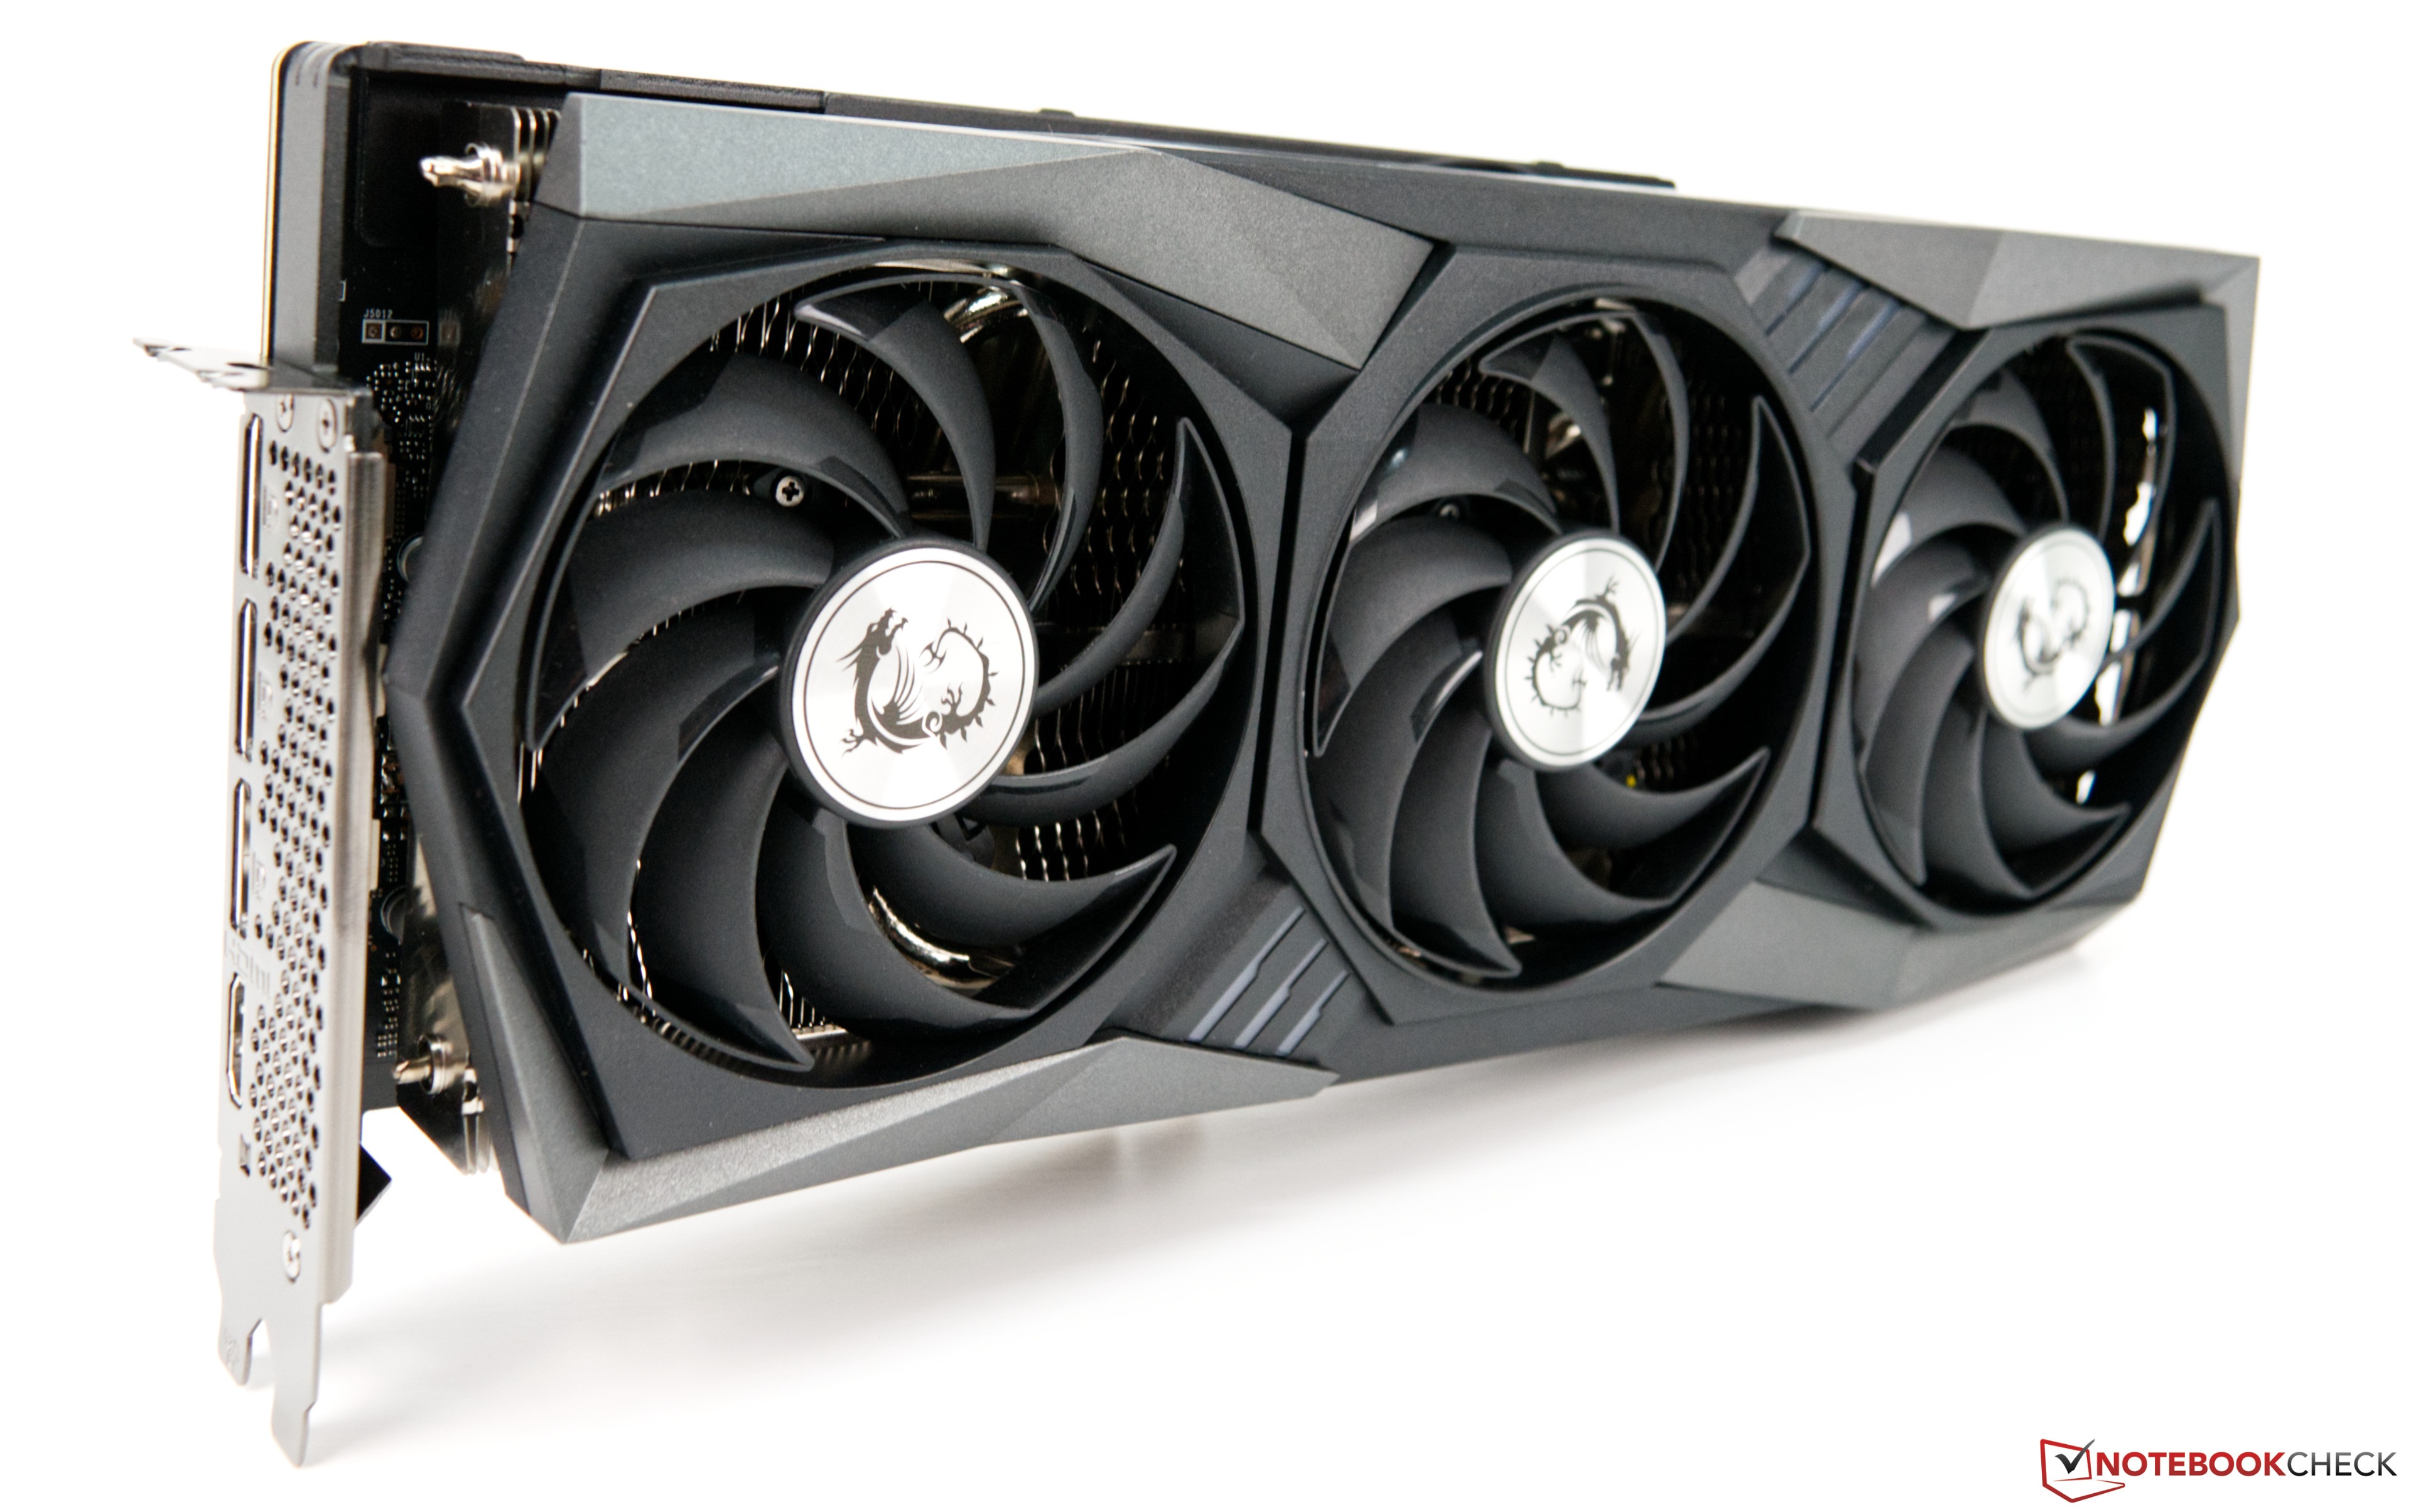
NVIDIA GeForce RTX 3070 ► remove from comparison
The Nvidia GeForce RTX 3070 is a fast desktop graphics card based on the Ampere architecture. It uses the big GA104 chip and offers 5,888 cores and 8 GB GDDR6 graphics memory.
The performance in games and 4k resolution is slightly below a RTX 2080 Ti but clearly faster then the old RTX 2080 Super. For most games, the performance is sufficient for 4k and maximum details. Enabling raytracing however (without DLSS) will lead to a significant lower performance (although the RTX performance was clearly improved compared to the RTX 2000 series).
The GA104 chip is produced in 8nm at Samsung and the power consumption of the RT 3070 is specified with 220 Watt (RTX 2070 Super - 215 Watt).
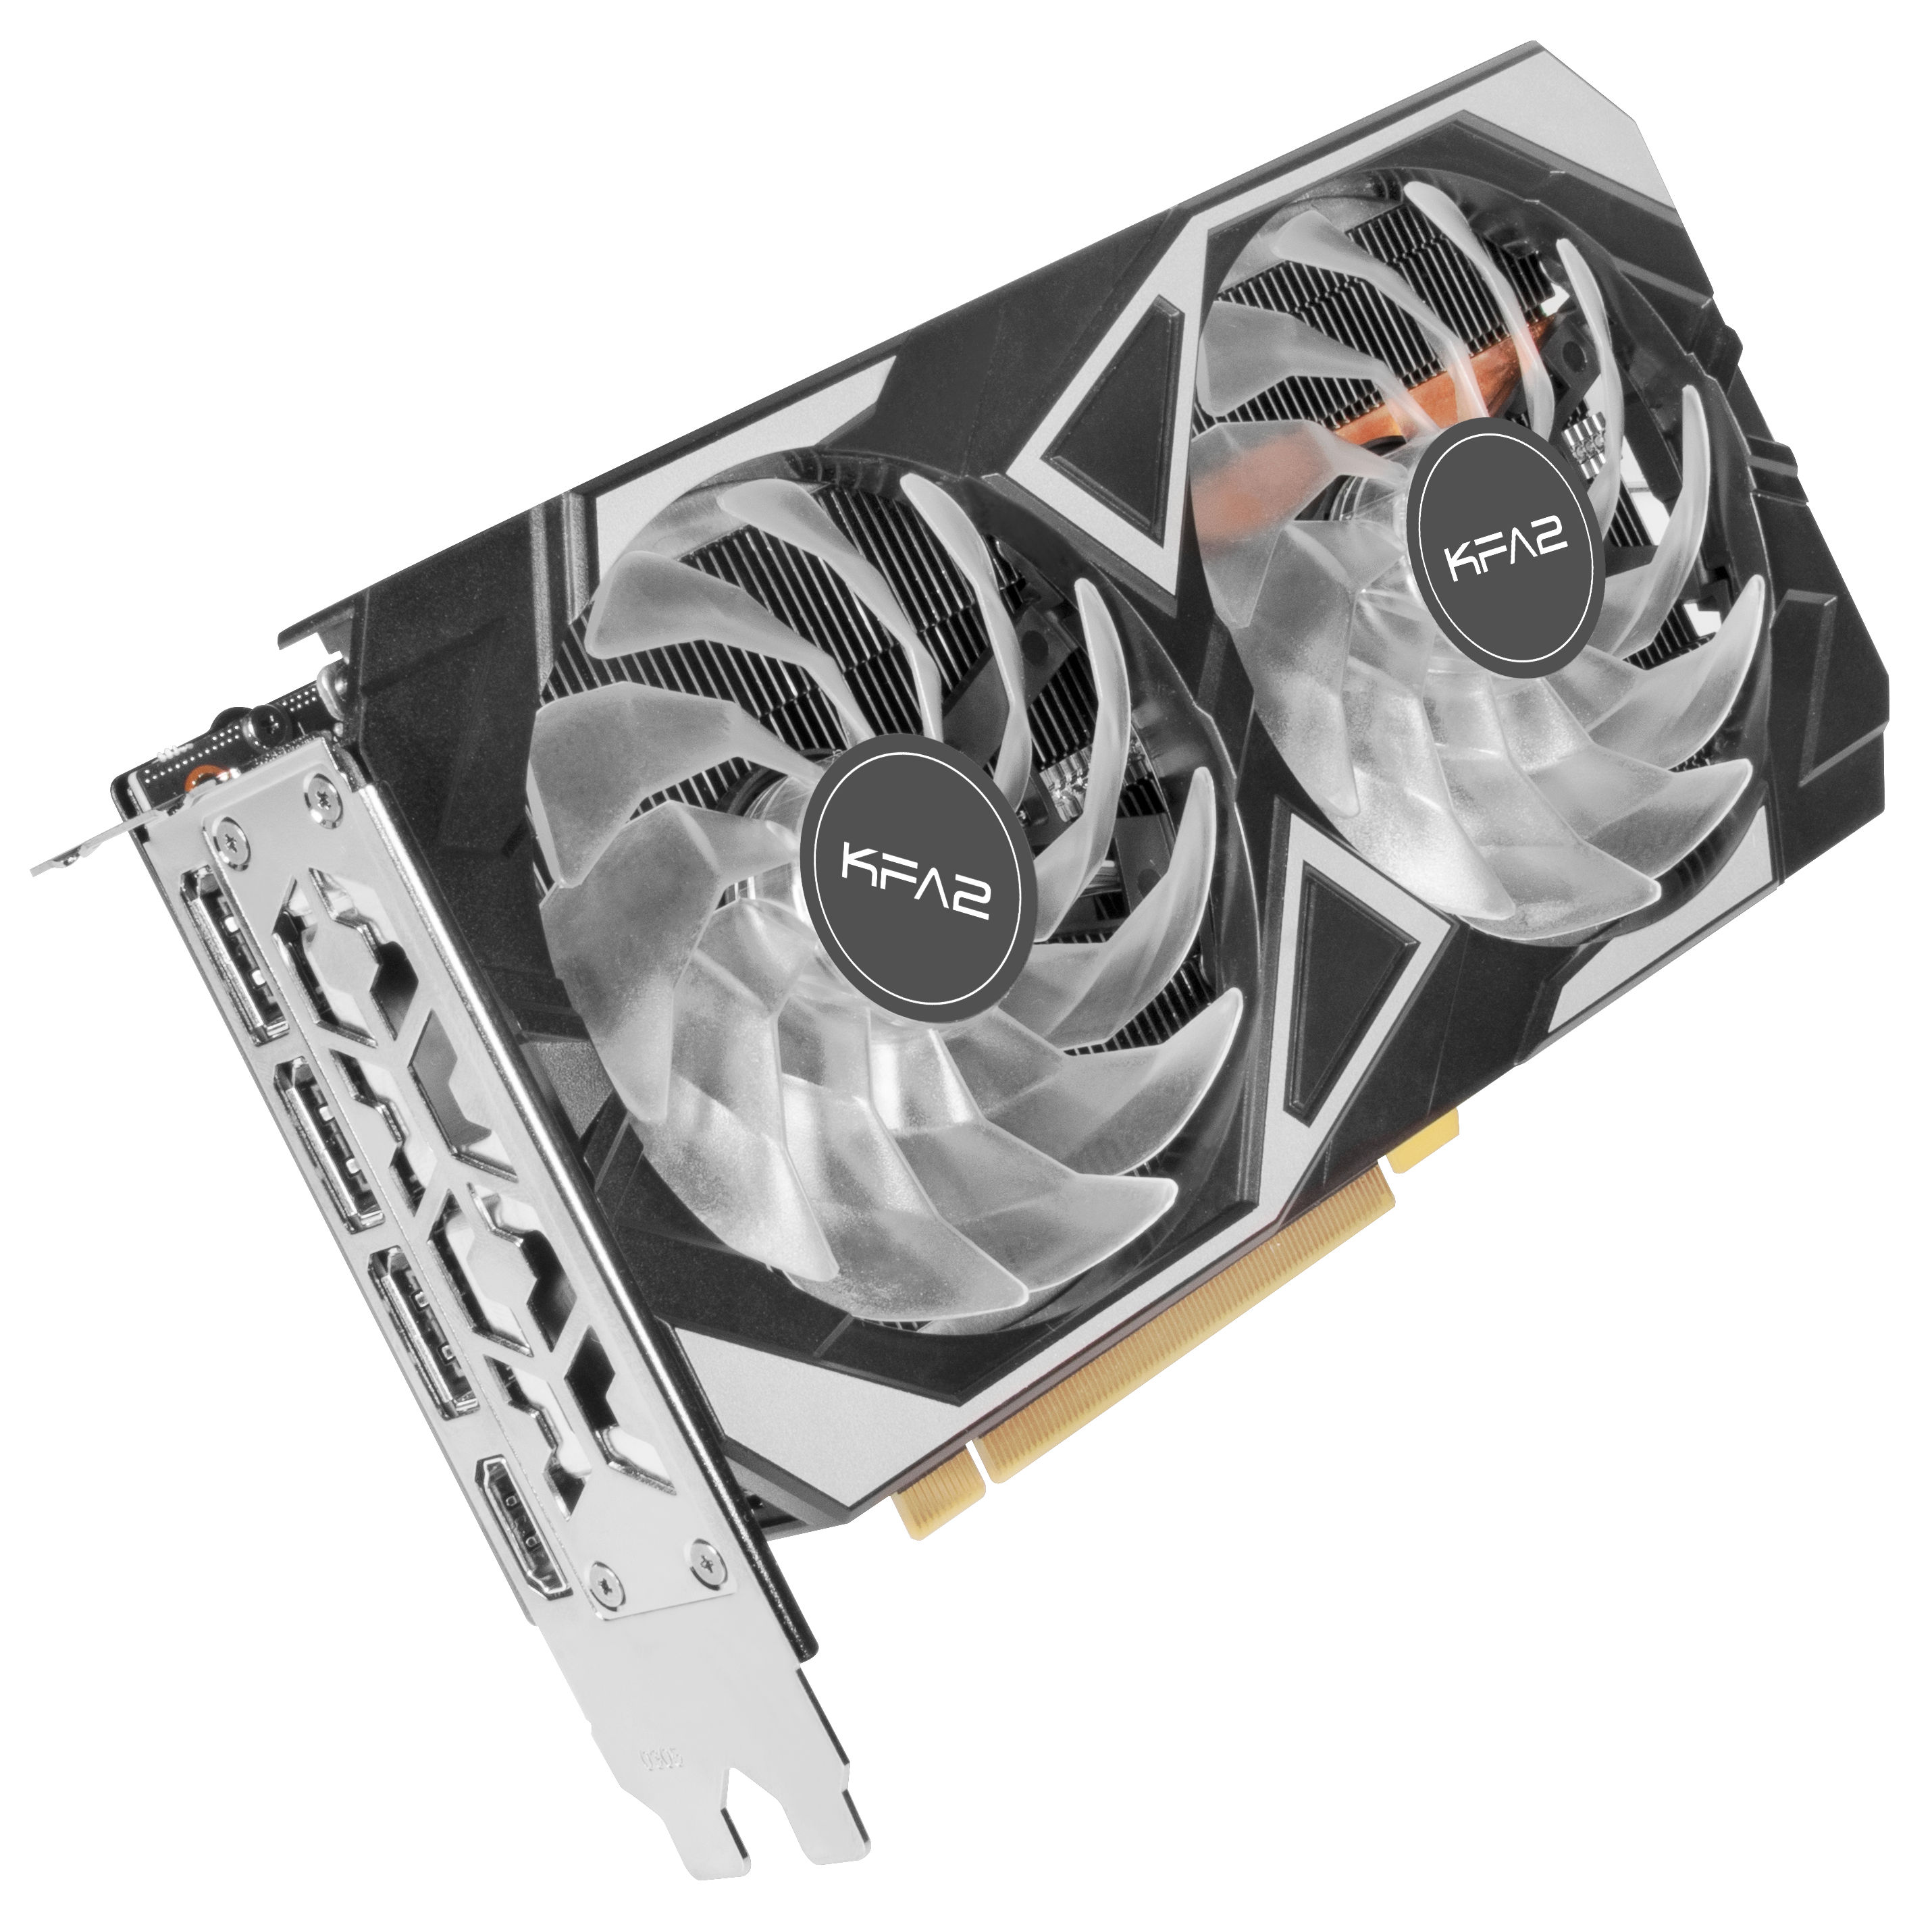
NVIDIA GeForce RTX 3050 ► remove from comparison
The Nvidia GeForce RTX 3050 is a mid-range desktop graphics card. It is based on the GA106 Ampere chip and offers 8 GB GDDR6 graphics memory with a 128 Bit memory bus. It offers 2,560 cores and supports PCIe 4.0.
The performance is similar to the older GeForce RTX 2060 and therefore best suited for 1080p gaming of modern and demanding games in high settings.
The GA106 chip offers 3,840 FP32 ALUs of which half can also execute INT32 instructions (i.e. 1,920 INT32 ALUs). With Turing all shaders could still execute FP32 or INT32 instructions. The raytracing and tensor cores on the chip were also improved according to Nvidia. The Ampere chips also include an improved 5th generation video encoder (NVENC for H.264 and H.265) and a 7th generation decoder (for various formats now including AV1).
The GA106 chip is manufactured by Samsung in 8nm (8N), which is not quite able to keep up with the 7nm node at TSMC (e.g. used by AMD and also for the professional GA100 Ampere chip). The TDP of the RTX 3050 is specified at 130 Watt and therefore better than the previous RTX 2060 (160 Watt).
NVIDIA GeForce RTX 3080 Laptop GPU ► remove from comparison
The Nvidia GeForce RTX 3080 Laptop GPU or 3080 Mobile (for laptops, GN20-E7) is the fastest graphics card for notebooks in early 2021. It is based on the GA104-775-A1 Ampere chip and offers 8 or 16 GB GDDR6 graphics memory with a 256 Bit memory bus. It supports PCIe 4.0 and will be available in different variants from 80 - 150 Watt (TGP) (80, 90, 115, 125, 135, 145 and 150+ Watt). As package the notebook graphic card uses GB5-256 and the chip size is 40x40mm. The GPU supports eDP 1.4b to connect the internal monitor.
There is no more Max-Q variant (formerly used for the low power variants) but every OEM can choose to implement Max-Q technologies (Dynamic Boost, Whispermode).
The performance depends on the TGP setting and cooling of the laptop. At the same TGP level the RTX3080 should be faster than the old top model, the RTX 2080 Super Mobile and similar to the desktop RTX 3070 . This means, the GPU should be well suited for 4k gaming or QHD with high frame rates. The similar named RTX 3080 desktop card is significantly faster.
The GA104 chip offers 6,144 FP32 ALUs of which half can also execute INT32 instructions (i.e. 3,072 INT32 ALUs). With Turing all shaders could still execute FP32 or INT32 instructions. The raytracing and tensor cores on the chip were also improved according to Nvidia. The Ampere chips also include an improved 5th generation video encoder (NVENC for H.264 and H.265) and a 7th generation decoder (for various formats now including AV1).
The GA104 chip is manufactured by Samsung in 8nm (8N), which is not quite able to keep up with the 7nm node at TSMC (e.g. used by AMD and also for the professional GA100 Ampere chip).
NVIDIA GeForce RTX 3070 NVIDIA GeForce RTX 3050 NVIDIA GeForce RTX 3080 Laptop GPU GeForce RTX 3000 Series Codename Ampere GA104 Ampere GA106 GN20-E7 GA104 Architecture Ampere Ampere Ampere Pipelines 5888 - unified 2560 - unified 6144 - unified Core Speed 1500 - 1725 (Boost) MHz 1552 - 1777 (Boost) MHz 780 - 1100 - 1245 - 1710 (Boost) MHz Memory Speed 14000 MHz 1750 MHz 14000 effective = 1750 MHz Memory Bus Width 256 Bit 128 Bit Bit 256 Bit Memory Type GDDR6 GDDR6 GDDR6 Max. Amount of Memory 8 GB 8 GB 16 GB Shared Memory no no no API DirectX 12_2, Shader 6.7, OpenGL 4.6 DirectX 12_2, Shader 6.6, OpenGL 4.6 DirectX 12_2, Shader 6.7, OpenGL 4.6 Power Consumption 220 Watt 130 Watt 150 Watt (80 - 150 Watt TGP) Transistors 17.4 Billion 12 Billion 17.4 Billion technology 8 nm 8 nm 8 nm Date of Announcement 16.09.2020 04.01.2022 12.01.2021 TMUs 192 ROPs 96 Raytracing Cores 48 Memory Bandwidth 448 GB/s Die Size 392 mm² PCIe 4.0 Displays HDMI 2.1, DisplayPort 1.4a Features NVIDIA DLSS, NVIDIA Reflex, Resizable BAR, NVIDIA Broadcast, NVIDIA Ansel, NVIDIA ShadowPlay®, NVIDIA G-SYNC®, Advanced Optimus, Nvidia Max-Q, Dynamic Boost, VR-ready, Nvidia Omniverse Notebook Size large
Benchmarks Performance Rating - 3DMark 11 + Fire Strike + Time Spy - NVIDIA GeForce RTX 3070
14.1 pt (42%)
...
...
Performance Rating - 3DMark 11 + Fire Strike + Time Spy - NVIDIA GeForce RTX 3050
7.1 pt (21%)
...
...
Performance Rating - 3DMark 11 + Fire Strike + Time Spy - GeForce RTX 3080 Laptop GPU
12.4 pt (37%)
...
NVIDIA GeForce RTX 3080 Laptop GPU
Intel Arc A580
...
3DMark - 3DMark Time Spy Score
min: 8113 avg: 11690 median: 12665 (37%) max: 12937 Points
min: 6694 avg: 6726 median: 6725.5 (19%) max: 6757 Points
GPU TDP ? TDP 130 W 100% 60%
min: 6499 avg: 10438 median: 10472.5 (30%) max: 13067 Points
GPU TDP ? TDP 90 W TDP 95 W TDP 100 W TDP 105 W TDP 115 W TDP 125 W TDP 130 W TDP 140 W TDP 150 W TDP 155 W TDP 165 W 86% 68% 75% 81% 82% 85% 89% 85% 94% 93% 100% 95%
3DMark - 3DMark Time Spy Graphics
min: 11043 avg: 12616 median: 12892 (34%) max: 13579 Points
min: 6102 avg: 6150 median: 6150 (16%) max: 6198 Points
GPU TDP ? TDP 130 W 100% 53%
min: 6407 avg: 10695 median: 10773.5 (28%) max: 13210 Points
GPU TDP ? TDP 90 W TDP 95 W TDP 100 W TDP 105 W TDP 115 W TDP 125 W TDP 130 W TDP 140 W TDP 150 W TDP 155 W TDP 165 W 86% 69% 73% 77% 79% 80% 85% 82% 91% 93% 100% 93%
3DMark - 3DMark Ice Storm Unlimited Graphics
min: 479404 avg: 544126 median: 502470 (57%) max: 650505 Points
min: 492229 avg: 580371 median: 580370 (66%) max: 668512 Points
GPU TDP ? TDP 130 W 100% 86%
min: 444648 avg: 542648 median: 541176 (61%) max: 645075 Points
GPU TDP ? TDP 95 W TDP 100 W TDP 105 W TDP 115 W TDP 130 W TDP 150 W TDP 165 W 96% 75% 81% 91% 95% 83% 94% 100%
3DMark - 3DMark Ice Storm Extreme Graphics
min: 284001 avg: 364250 median: 328616 (42%) max: 515764 Points
min: 268651 avg: 276734 median: 276734 (35%) max: 284817 Points
GPU TDP ? TDP 130 W 100% 77%
min: 78873 avg: 169844 median: 92583.5 (12%) max: 415335 Points
GPU TDP ? TDP 115 W TDP 130 W TDP 150 W 66% 19% 65% 100%
3DMark - 3DMark Cloud Gate Score
min: 17089 avg: 48505 median: 53317.5 (57%) max: 63741 Points
min: 53465 avg: 56411 median: 56411 (60%) max: 59357 Points
GPU TDP ? TDP 130 W 94% 100%
min: 30210 avg: 47447 median: 49246 (53%) max: 65479 Points
GPU TDP ? TDP 95 W TDP 100 W TDP 105 W TDP 115 W TDP 125 W TDP 130 W TDP 140 W TDP 150 W TDP 155 W TDP 165 W 85% 68% 87% 81% 80% 97% 91% 100% 81% 100% 92%
3DMark - 3DMark Cloud Gate Graphics
min: 89061 avg: 141234 median: 154864 (41%) max: 175713 Points
min: 89245 avg: 90224 median: 90224 (24%) max: 91203 Points
GPU TDP ? TDP 130 W 100% 67%
min: 38816 avg: 116550 median: 111181 (29%) max: 192950 Points
GPU TDP ? TDP 95 W TDP 100 W TDP 105 W TDP 115 W TDP 125 W TDP 130 W TDP 140 W TDP 150 W TDP 155 W TDP 165 W 65% 51% 54% 54% 43% 65% 51% 83% 54% 100% 72%
3DMark - 3DMark Fire Strike Standard Score
min: 14069 avg: 23482 median: 25739 (45%) max: 29648 Points
min: 14713 avg: 14734 median: 14733.5 (26%) max: 14754 Points
GPU TDP ? TDP 130 W 100% 66%
min: 13393 avg: 22282 median: 22706 (40%) max: 27685 Points
GPU TDP ? TDP 90 W TDP 95 W TDP 100 W TDP 105 W TDP 115 W TDP 125 W TDP 130 W TDP 140 W TDP 150 W TDP 155 W TDP 165 W 88% 64% 82% 88% 87% 93% 98% 93% 100% 93% 99% 98%
3DMark - 3DMark Fire Strike Standard Graphics
min: 20357 avg: 28949 median: 31020 (35%) max: 33270 Points
min: 15545 avg: 15685 median: 15684.5 (18%) max: 15824 Points
GPU TDP ? TDP 130 W 100% 58%
min: 16455 avg: 27464 median: 27266 (31%) max: 32366 Points
GPU TDP ? TDP 90 W TDP 95 W TDP 100 W TDP 105 W TDP 115 W TDP 125 W TDP 130 W TDP 140 W TDP 150 W TDP 155 W TDP 165 W 83% 78% 78% 76% 83% 80% 89% 81% 94% 80% 100% 95%
3DMark - 3DMark Ice Storm Graphics
min: 286573 avg: 382547 median: 358123 (43%) max: 527368 Points
min: 329279 avg: 342986 median: 342986 (41%) max: 356693 Points
GPU TDP ? TDP 130 W 100% 87%
min: 40654 avg: 148189 median: 78986 (9%) max: 462145 Points
GPU TDP ? TDP 115 W TDP 130 W TDP 150 W 89% 24% 100% 76%
3DMark - 3DMark Wild Life Unlimited
79787 Points (40%)
min: 58406 avg: 69705 median: 67162 (34%) max: 81508 Points
GPU TDP ? TDP 95 W TDP 105 W TDP 165 W 100% 73% 83% 95%
3DMark - 3DMark Wild Life Extreme Unlimited
min: 20971 avg: 23404 median: 22308 (26%) max: 26393 Points
GPU TDP ? TDP 105 W TDP 165 W 100% 80% 93%
3DMark - 3DMark Night Raid
min: 52206 avg: 57993 median: 59613 (56%) max: 61129 Points
51635 Points (49%)
min: 27201 avg: 36215 median: 35830 (34%) max: 52124 Points
GPU TDP ? TDP 115 W TDP 150 W 100% 72% 78%
3DMark - 3DMark Night Raid Graphics Score
min: 114931 avg: 124203 median: 124547 (48%) max: 134906 Points
70427 Points (27%)
min: 33157 avg: 63222 median: 56010 (22%) max: 114808 Points
GPU TDP ? TDP 115 W TDP 150 W 100% 56% 74%
3DMark 11 - 3DM11 Performance Score
min: 15985 avg: 30067 median: 31876 (44%) max: 36663 Points
min: 21488 avg: 21938 median: 21937.5 (30%) max: 22387 Points
GPU TDP ? TDP 130 W 100% 73%
min: 22428 avg: 29023 median: 29192 (40%) max: 32922 Points
GPU TDP ? TDP 90 W TDP 95 W TDP 100 W TDP 105 W TDP 115 W TDP 125 W TDP 130 W TDP 140 W TDP 150 W TDP 155 W TDP 165 W 96% 80% 87% 90% 95% 99% 100% 93% 99% 98% 95% 100%
3DMark 11 - 3DM11 Performance GPU
min: 26812 avg: 40835 median: 43005 (37%) max: 46878 Points
min: 21288 avg: 21358 median: 21357.5 (18%) max: 21427 Points
GPU TDP ? TDP 130 W 100% 55%
min: 31288 avg: 38345 median: 38087 (33%) max: 43744 Points
GPU TDP ? TDP 90 W TDP 95 W TDP 100 W TDP 105 W TDP 115 W TDP 125 W TDP 130 W TDP 140 W TDP 150 W TDP 155 W TDP 165 W 91% 79% 78% 80% 84% 83% 90% 84% 93% 97% 100% 95%
3DMark Vantage + NVIDIA GeForce RTX 3070 3DMark Vantage - 3DM Vant. Perf. total
min: 85505 avg: 88420 median: 88744 (26%) max: 91011 Points
3DM Vant. Perf. total + NVIDIA GeForce RTX 3050
min: 72487 avg: 77234 median: 77233.5 (22%) max: 81980 Points
GPU TDP ? TDP 130 W 100% 84%
3DM Vant. Perf. total + NVIDIA GeForce RTX 3080 Laptop GPU
min: 61664 avg: 72825 median: 75159 (22%) max: 81653 Points
GPU TDP ? TDP 115 W TDP 130 W 99% 100% 89%
3DM Vant. Perf. GPU no PhysX + NVIDIA GeForce RTX 3070 3DMark Vantage - 3DM Vant. Perf. GPU no PhysX
min: 89062 avg: 95270 median: 93032 (53%) max: 103716 Points
3DM Vant. Perf. GPU no PhysX + NVIDIA GeForce RTX 3050
min: 70014 avg: 73171 median: 73170.5 (42%) max: 76327 Points
GPU TDP ? TDP 130 W 100% 77%
3DM Vant. Perf. GPU no PhysX + NVIDIA GeForce RTX 3080 Laptop GPU
min: 85368 avg: 88465 median: 89231 (51%) max: 90797 Points
GPU TDP ? TDP 115 W TDP 130 W 99% 100% 77%
3DMark 05 - 3DMark 05 - Standard
min: 51451 avg: 54279 median: 52819 (58%) max: 58568 Points
min: 61355 avg: 72916 median: 72915.5 (80%) max: 84476 Points
GPU TDP ? TDP 130 W 100% 99%
min: 50419 avg: 54967 median: 57220 (63%) max: 57262 Points
GPU TDP ? TDP 115 W TDP 130 W 96% 93% 100%
3DMark 06 3DMark 06 - Standard 1280x1024 + NVIDIA GeForce RTX 3070
min: 42108 avg: 48490 median: 44229 (58%) max: 59134 Points
3DMark 06 - Standard 1280x1024 + NVIDIA GeForce RTX 3050
min: 47305 avg: 56504 median: 56504 (74%) max: 65703 Points
GPU TDP ? TDP 130 W 100% 90%
3DMark 06 - Standard 1280x1024 + NVIDIA GeForce RTX 3080 Laptop GPU
min: 40441 avg: 43967 median: 44856 (59%) max: 46605 Points
GPU TDP ? TDP 115 W TDP 130 W 100% 90% 95%
Unigine Valley 1.0 - Unigine Valley 1.0 DX
min: 155.1 avg: 161.2 median: 157.5 (52%) max: 168.5 fps
min: 72.7 avg: 73.5 median: 73.5 (24%) max: 74.3 fps
GPU TDP ? TDP 130 W 100% 50%
min: 124.6 avg: 127.8 median: 129.2 (42%) max: 129.5 fps
GPU TDP ? TDP 115 W TDP 130 W 100% 91% 51%
Blender - Blender 3.3 Classroom CUDA *
41 Seconds (6%)
GPU TDP ? TDP 115 W 100% 100%
Blender - Blender 3.3 Classroom OPTIX *
min: 23 avg: 23.3 median: 23 (9%) max: 24 Seconds
GPU TDP ? TDP 115 W 100% 100%
SPECviewperf 12 + NVIDIA GeForce RTX 3070 SPECviewperf 12 - specvp12 sw-03
min: 61.7 avg: 75.6 median: 76.1 (19%) max: 88.6 fps
specvp12 sw-03 + NVIDIA GeForce RTX 3050
min: 53.4 avg: 59.3 median: 59.3 (15%) max: 65.2 fps
GPU TDP ? TDP 130 W 100% 73%
specvp12 sw-03 + NVIDIA GeForce RTX 3080 Laptop GPU
min: 69.8 avg: 73.8 median: 75.3 (19%) max: 76.4 fps
GPU TDP ? TDP 115 W TDP 130 W 97% 100% 71%
specvp12 snx-02 + NVIDIA GeForce RTX 3070 SPECviewperf 12 - specvp12 snx-02
min: 12 avg: 12.8 median: 12.8 (2%) max: 13.5 fps
specvp12 snx-02 + NVIDIA GeForce RTX 3050
min: 7.45 avg: 7.6 median: 7.6 (1%) max: 7.83 fps
GPU TDP ? TDP 130 W 100% 63%
specvp12 snx-02 + NVIDIA GeForce RTX 3080 Laptop GPU
min: 12.5 avg: 12.7 median: 12.8 (2%) max: 12.9 fps
GPU TDP ? TDP 115 W TDP 130 W 94% 100% 58%
specvp12 showcase-01 + NVIDIA GeForce RTX 3070 SPECviewperf 12 - specvp12 showcase-01
min: 153.9 avg: 161.2 median: 160 (35%) max: 171 fps
specvp12 showcase-01 + NVIDIA GeForce RTX 3050
min: 74.5 avg: 77 median: 77 (17%) max: 79.4 fps
GPU TDP ? TDP 130 W 100% 55%
specvp12 showcase-01 + NVIDIA GeForce RTX 3080 Laptop GPU
min: 122 avg: 124 median: 125 (27%) max: 125 fps
GPU TDP ? TDP 115 W TDP 130 W 100% 91% 58%
specvp12 mediacal-01 + NVIDIA GeForce RTX 3070 SPECviewperf 12 - specvp12 mediacal-01
min: 36.68 avg: 47.7 median: 43.6 (11%) max: 66.9 fps
specvp12 mediacal-01 + NVIDIA GeForce RTX 3050
min: 31.5 avg: 35.7 median: 35.7 (9%) max: 39.9 fps
GPU TDP ? TDP 130 W 100% 68%
specvp12 maya-04 + NVIDIA GeForce RTX 3070 SPECviewperf 12 - specvp12 maya-04
min: 166 avg: 193.9 median: 188.2 (51%) max: 233 fps
specvp12 maya-04 + NVIDIA GeForce RTX 3050
min: 142 avg: 148 median: 148 (40%) max: 154 fps
GPU TDP ? TDP 130 W 100% 76%
specvp12 maya-04 + NVIDIA GeForce RTX 3080 Laptop GPU
min: 164 avg: 177 median: 183 (50%) max: 184 fps
GPU TDP ? TDP 115 W TDP 130 W 100% 100% 78%
specvp12 energy-01 + NVIDIA GeForce RTX 3070 SPECviewperf 12 - specvp12 energy-01
min: 12.42 avg: 13.1 median: 12.8 (11%) max: 14.3 fps
specvp12 energy-01 + NVIDIA GeForce RTX 3050
min: 7.14 avg: 7.2 median: 7.2 (6%) max: 7.29 fps
GPU TDP ? TDP 130 W 100% 60%
specvp12 creo-01 + NVIDIA GeForce RTX 3070 SPECviewperf 12 - specvp12 creo-01
min: 57.5 avg: 62.1 median: 60.7 (24%) max: 69.4 fps
specvp12 creo-01 + NVIDIA GeForce RTX 3050
min: 43.4 avg: 44.9 median: 44.9 (18%) max: 46.4 fps
GPU TDP ? TDP 130 W 100% 74%
specvp12 creo-01 + NVIDIA GeForce RTX 3080 Laptop GPU
min: 61 avg: 62.1 median: 62.5 (25%) max: 62.8 fps
GPU TDP ? TDP 115 W TDP 130 W 96% 100% 69%
specvp12 catia-04 + NVIDIA GeForce RTX 3070 SPECviewperf 12 - specvp12 catia-04
min: 111.2 avg: 115.6 median: 114.5 (19%) max: 122 fps
specvp12 catia-04 + NVIDIA GeForce RTX 3050
min: 53.4 avg: 55.2 median: 55.2 (9%) max: 56.9 fps
GPU TDP ? TDP 130 W 100% 51%
specvp12 catia-04 + NVIDIA GeForce RTX 3080 Laptop GPU
min: 111 avg: 112 median: 112 (19%) max: 113 fps
GPU TDP ? TDP 115 W TDP 130 W 96% 100% 48%
specvp12 3dsmax-05 + NVIDIA GeForce RTX 3070 SPECviewperf 12 - specvp12 3dsmax-05
min: 213 avg: 256.3 median: 266 (47%) max: 280 fps
specvp12 3dsmax-05 + NVIDIA GeForce RTX 3050
min: 156 avg: 157.5 median: 157.5 (28%) max: 159 fps
GPU TDP ? TDP 130 W 100% 66%
specvp12 3dsmax-05 + NVIDIA GeForce RTX 3080 Laptop GPU
min: 214 avg: 216.7 median: 217 (38%) max: 219 fps
GPU TDP ? TDP 115 W TDP 130 W 100% 94% 68%
SPECviewperf 13 specvp13 sw-04 + NVIDIA GeForce RTX 3070 SPECviewperf 13 - specvp13 sw-04
min: 84.8 avg: 106.6 median: 105.7 (28%) max: 130 fps
specvp13 sw-04 + NVIDIA GeForce RTX 3050
min: 74.5 avg: 87.2 median: 87.2 (23%) max: 99.9 fps
GPU TDP ? TDP 130 W 100% 71%
specvp13 sw-04 + NVIDIA GeForce RTX 3080 Laptop GPU
min: 98.6 avg: 100.5 median: 101 (27%) max: 102 fps
GPU TDP ? TDP 115 W TDP 130 W 100% 95% 72%
specvp13 snx-03 + NVIDIA GeForce RTX 3070 SPECviewperf 13 - specvp13 snx-03
min: 21.9 avg: 23 median: 22.8 (3%) max: 24.3 fps
specvp13 snx-03 + NVIDIA GeForce RTX 3050
min: 13.4 avg: 13.8 median: 13.8 (2%) max: 14.1 fps
GPU TDP ? TDP 130 W 100% 63%
specvp13 snx-03 + NVIDIA GeForce RTX 3080 Laptop GPU
min: 23 avg: 23 median: 23 (3%) max: 23.1 fps
GPU TDP ? TDP 115 W TDP 130 W 94% 100% 58%
specvp13 showcase-02 + NVIDIA GeForce RTX 3070 SPECviewperf 13 - specvp13 showcase-02
min: 145.5 avg: 159.9 median: 161.5 (35%) max: 171 fps
specvp13 showcase-02 + NVIDIA GeForce RTX 3050
min: 74.5 avg: 77 median: 77 (17%) max: 79.5 fps
GPU TDP ? TDP 130 W 100% 56%
specvp13 showcase-02 + NVIDIA GeForce RTX 3080 Laptop GPU
120 fps (26%)
GPU TDP ? TDP 115 W TDP 130 W 100% 88% 58%
specvp13 medical-02 + NVIDIA GeForce RTX 3070 SPECviewperf 13 - specvp13 medical-02
min: 78.3 avg: 80.2 median: 80.4 (17%) max: 81.8 fps
specvp13 medical-02 + NVIDIA GeForce RTX 3050
min: 43.4 avg: 43.6 median: 43.6 (9%) max: 43.8 fps
GPU TDP ? TDP 130 W 100% 60%
specvp13 medical-02 + NVIDIA GeForce RTX 3080 Laptop GPU
min: 58.9 avg: 58.9 median: 58.9 (12%) max: 59 fps
GPU TDP ? TDP 115 W TDP 130 W 100% 86% 64%
specvp13 maya-05 + NVIDIA GeForce RTX 3070 SPECviewperf 13 - specvp13 maya-05
min: 256.5 avg: 348.6 median: 365 (41%) max: 408 fps
specvp13 maya-05 + NVIDIA GeForce RTX 3050
min: 202 avg: 204.5 median: 204.5 (23%) max: 207 fps
GPU TDP ? TDP 130 W 100% 63%
specvp13 maya-05 + NVIDIA GeForce RTX 3080 Laptop GPU
min: 304 avg: 308.3 median: 310 (35%) max: 311 fps
GPU TDP ? TDP 115 W TDP 130 W 100% 96% 64%
specvp13 energy-02 + NVIDIA GeForce RTX 3070 SPECviewperf 13 - specvp13 energy-02
min: 20.6 avg: 26.7 median: 28.5 (9%) max: 29.12 fps
specvp13 energy-02 + NVIDIA GeForce RTX 3050
min: 8.2 avg: 8.2 median: 8.2 (3%) max: 8.23 fps
GPU TDP ? TDP 130 W 100% 36%
specvp13 energy-02 + NVIDIA GeForce RTX 3080 Laptop GPU
24.6 fps (8%)
GPU TDP ? TDP 115 W TDP 130 W 95% 100% 33%
specvp13 creo-02 + NVIDIA GeForce RTX 3070 SPECviewperf 13 - specvp13 creo-02
min: 227.7 avg: 243.2 median: 240.5 (35%) max: 264 fps
specvp13 creo-02 + NVIDIA GeForce RTX 3050
min: 136 avg: 138 median: 138 (20%) max: 140 fps
GPU TDP ? TDP 130 W 100% 61%
specvp13 creo-02 + NVIDIA GeForce RTX 3080 Laptop GPU
min: 215 avg: 215.7 median: 216 (32%) max: 216 fps
GPU TDP ? TDP 115 W TDP 130 W 100% 97% 62%
specvp13 catia-05 + NVIDIA GeForce RTX 3070 SPECviewperf 13 - specvp13 catia-05
min: 168.7 avg: 172.7 median: 173 (19%) max: 176 fps
specvp13 catia-05 + NVIDIA GeForce RTX 3050
min: 76.3 avg: 77.1 median: 77.1 (9%) max: 77.8 fps
GPU TDP ? TDP 130 W 100% 50%
specvp13 catia-05 + NVIDIA GeForce RTX 3080 Laptop GPU
159 fps (18%)
GPU TDP ? TDP 115 W TDP 130 W 98% 100% 48%
specvp13 3dsmax-06 + NVIDIA GeForce RTX 3070 SPECviewperf 13 - specvp13 3dsmax-06
min: 213 avg: 253.3 median: 260.6 (45%) max: 279 fps
specvp13 3dsmax-06 + NVIDIA GeForce RTX 3050
min: 156 avg: 157.5 median: 157.5 (27%) max: 159 fps
GPU TDP ? TDP 130 W 100% 67%
specvp13 3dsmax-06 + NVIDIA GeForce RTX 3080 Laptop GPU
min: 215 avg: 215.3 median: 215 (37%) max: 216 fps
GPU TDP ? TDP 115 W TDP 130 W 100% 94% 68%
SPECviewperf 2020 specvp2020 solidworks-05 4k + NVIDIA GeForce RTX 3070 SPECviewperf 2020 - specvp2020 solidworks-05 4k
min: 122 avg: 125.8 median: 125.5 (37%) max: 130 fps
specvp2020 solidworks-05 4k + NVIDIA GeForce RTX 3050
59.7 fps (18%)
GPU TDP ? TDP 130 W 100% 47%
specvp2020 solidworks-05 4k + NVIDIA GeForce RTX 3080 Laptop GPU
min: 104 avg: 104.7 median: 105 (31%) max: 105 fps
GPU TDP ? TDP 115 W TDP 130 W 100% 88% 50%
specvp2020 snx-04 4k + NVIDIA GeForce RTX 3070 SPECviewperf 2020 - specvp2020 snx-04 4k
min: 18.4 avg: 19.4 median: 19.3 (2%) max: 20.6 fps
specvp2020 snx-04 4k + NVIDIA GeForce RTX 3050
min: 10 avg: 10.3 median: 10.3 (1%) max: 10.5 fps
GPU TDP ? TDP 130 W 100% 57%
specvp2020 snx-04 4k + NVIDIA GeForce RTX 3080 Laptop GPU
min: 18.5 avg: 18.7 median: 18.7 (2%) max: 18.8 fps
GPU TDP ? TDP 115 W TDP 130 W 97% 100% 54%
specvp2020 medical-03 4k + NVIDIA GeForce RTX 3070 SPECviewperf 2020 - specvp2020 medical-03 4k
min: 13.1 avg: 13.5 median: 13.5 (13%) max: 14.06 fps
specvp2020 medical-03 4k + NVIDIA GeForce RTX 3050
min: 6.51 avg: 7.2 median: 7.2 (7%) max: 7.87 fps
GPU TDP ? TDP 130 W 100% 53%
specvp2020 medical-03 4k + NVIDIA GeForce RTX 3080 Laptop GPU
min: 10.4 avg: 10.5 median: 10.5 (10%) max: 10.5 fps
GPU TDP ? TDP 115 W TDP 130 W 100% 88% 55%
specvp2020 maya-06 4k + NVIDIA GeForce RTX 3070 SPECviewperf 2020 - specvp2020 maya-06 4k
min: 237 avg: 246.5 median: 248.1 (40%) max: 253 fps
specvp2020 maya-06 4k + NVIDIA GeForce RTX 3050
min: 120 avg: 121 median: 121 (20%) max: 122 fps
GPU TDP ? TDP 130 W 100% 54%
specvp2020 maya-06 4k + NVIDIA GeForce RTX 3080 Laptop GPU
min: 186 avg: 187 median: 186 (30%) max: 189 fps
GPU TDP ? TDP 115 W TDP 130 W 100% 88% 57%
specvp2020 energy-03 4k + NVIDIA GeForce RTX 3070 SPECviewperf 2020 - specvp2020 energy-03 4k
min: 25.3 avg: 28.9 median: 26.1 (6%) max: 37.99 fps
specvp2020 energy-03 4k + NVIDIA GeForce RTX 3050
min: 9.86 avg: 12.7 median: 12.7 (3%) max: 15.5 fps
GPU TDP ? TDP 130 W 100% 38%
specvp2020 energy-03 4k + NVIDIA GeForce RTX 3080 Laptop GPU
min: 29.5 avg: 29.6 median: 29.6 (6%) max: 29.6 fps
GPU TDP ? TDP 115 W TDP 130 W 92% 100% 33%
specvp2020 creo-03 4k + NVIDIA GeForce RTX 3070 SPECviewperf 2020 - specvp2020 creo-03 4k
min: 74.3 avg: 80.1 median: 78.7 (37%) max: 88.7 fps
specvp2020 creo-03 4k + NVIDIA GeForce RTX 3050
min: 54.2 avg: 55.2 median: 55.2 (26%) max: 56.1 fps
GPU TDP ? TDP 130 W 100% 72%
specvp2020 creo-03 4k + NVIDIA GeForce RTX 3080 Laptop GPU
min: 75.7 avg: 77 median: 76.8 (36%) max: 78.5 fps
GPU TDP ? TDP 115 W TDP 130 W 99% 100% 71%
specvp2020 catia-06 4k + NVIDIA GeForce RTX 3070 SPECviewperf 2020 - specvp2020 catia-06 4k
min: 41.9 avg: 43.1 median: 43.2 (28%) max: 44.3 fps
specvp2020 catia-06 4k + NVIDIA GeForce RTX 3050
min: 21.5 avg: 21.7 median: 21.7 (14%) max: 21.8 fps
GPU TDP ? TDP 130 W 100% 56%
specvp2020 catia-06 4k + NVIDIA GeForce RTX 3080 Laptop GPU
min: 37.7 avg: 37.9 median: 38 (25%) max: 38.1 fps
GPU TDP ? TDP 115 W TDP 130 W 100% 99% 57%
specvp2020 3dsmax-07 4k + NVIDIA GeForce RTX 3070 SPECviewperf 2020 - specvp2020 3dsmax-07 4k
min: 71.6 avg: 82.2 median: 85.2 (36%) max: 86.8 fps
specvp2020 3dsmax-07 4k + NVIDIA GeForce RTX 3050
min: 46.7 avg: 47.1 median: 47.1 (20%) max: 47.5 fps
GPU TDP ? TDP 130 W 100% 62%
specvp2020 3dsmax-07 4k + NVIDIA GeForce RTX 3080 Laptop GPU
min: 86.8 avg: 87.1 median: 87 (36%) max: 87.5 fps
GPU TDP ? TDP 115 W TDP 130 W 91% 100% 54%
Cinebench R10 Cinebench R10 Shading (32bit) + NVIDIA GeForce RTX 3070 Cinebench R10 - Cinebench R10 Shading (32bit)
min: 6817 avg: 6823 median: 6823 (5%) max: 6829 Points
Cinebench R10 Shading (32bit) + NVIDIA GeForce RTX 3080 Laptop GPU
min: 6839 avg: 6844 median: 6842 (5%) max: 6850 Points
GPU TDP ? TDP 115 W 100% 100%
Cinebench R11.5 Cinebench R11.5 OpenGL 64 Bit + NVIDIA GeForce RTX 3070 Cinebench R11.5 - Cinebench R11.5 OpenGL 64 Bit
min: 93 avg: 137.4 median: 137.4 (48%) max: 181.7 fps
Cinebench R11.5 OpenGL 64 Bit + NVIDIA GeForce RTX 3080 Laptop GPU
min: 154.39 avg: 156.5 median: 155.4 (54%) max: 159.82 fps
GPU TDP ? TDP 115 W 91% 100%
Cinebench R15 + NVIDIA GeForce RTX 3070 Cinebench R15 - Cinebench R15 OpenGL 64 Bit
min: 174 avg: 213.5 median: 213.5 (12%) max: 253 fps
Cinebench R15 OpenGL 64 Bit + NVIDIA GeForce RTX 3080 Laptop GPU
min: 115 avg: 180.2 median: 182.3 (11%) max: 250 fps
GPU TDP ? TDP 90 W TDP 95 W TDP 100 W TDP 105 W TDP 115 W TDP 125 W TDP 130 W TDP 140 W TDP 155 W TDP 165 W 97% 93% 75% 69% 83% 100% 78% 73% 81% 71% 85%
Cinebench R15 OpenGL Ref. Match 64 Bit + NVIDIA GeForce RTX 3070 Cinebench R15 - Cinebench R15 OpenGL Ref. Match 64 Bit
99.6 % (100%)
Cinebench R15 OpenGL Ref. Match 64 Bit + NVIDIA GeForce RTX 3080 Laptop GPU
99.6 % (100%)
GPU TDP ? TDP 90 W TDP 95 W TDP 100 W TDP 105 W TDP 115 W TDP 125 W TDP 130 W TDP 140 W TDP 155 W TDP 165 W 100% 100% 100% 100% 100% 100% 100% 100% 100% 100% 100%
Basemark GPU 1.2 - Basemark GPU 1.2 Vulkan Official Medium Offscreen 1080
min: 243 avg: 244.3 median: 245 (2%) max: 245 fps
GPU TDP ? TDP 115 W 100% 99%
Basemark GPU 1.2 - Basemark GPU 1.2 Vulkan Official High Offscreen 2160
min: 16.7 avg: 17.7 median: 18.2 (4%) max: 18.2 fps
GPU TDP ? TDP 115 W 96% 100%
Geekbench 6.2 - Geekbench 6.2 GPU OpenCL
min: 115933 avg: 120618 median: 118546 (34%) max: 129446 Points
GPU TDP ? TDP 115 W TDP 165 W 92% 90% 100%
Geekbench 6.2 - Geekbench 6.2 GPU Vulkan
min: 22054 avg: 42508 median: 22314 (7%) max: 103350 Points
GPU TDP ? TDP 115 W TDP 165 W 22% 21% 100%
LuxMark v2.0 64Bit - LuxMark v2.0 Room GPU
min: 2187 avg: 3588 median: 4284 (19%) max: 4293 Samples/s
min: 980 avg: 1072 median: 1072 (5%) max: 1164 Samples/s
GPU TDP ? TDP 130 W 100% 33%
min: 4895 avg: 4935 median: 4904 (22%) max: 5062 Samples/s
GPU TDP ? TDP 115 W TDP 130 W TDP 150 W 72% 100% 19% 97%
LuxMark v2.0 64Bit - LuxMark v2.0 Sala GPU
min: 10096 avg: 10107 median: 10111 (18%) max: 10115 Samples/s
min: 4579 avg: 4730 median: 4730 (8%) max: 4881 Samples/s
GPU TDP ? TDP 130 W 100% 52%
min: 11081 avg: 11414 median: 11251 (20%) max: 11844 Samples/s
GPU TDP ? TDP 115 W TDP 130 W TDP 150 W 82% 100% 39% 95%
ComputeMark v2.1 - ComputeMark v2.1 Result
min: 29330 avg: 30004 median: 30100 (33%) max: 30581 Points
min: 15271 avg: 15274 median: 15273.5 (17%) max: 15276 Points
GPU TDP ? TDP 130 W 100% 58%
min: 23023 avg: 24530 median: 23340 (25%) max: 28376 Points
GPU TDP ? TDP 115 W TDP 130 W TDP 150 W 95% 88% 58% 100%
Power Consumption - Furmark Stress Test Power Consumption - external Monitor *
min: 281 avg: 348.1 median: 355.8 (51%) max: 393 Watt
250 Watt (36%)
GPU TDP ? TDP 130 W 100% 128%
min: 122 avg: 175.4 median: 168.6 (24%) max: 254 Watt
GPU TDP ? TDP 90 W TDP 95 W TDP 100 W TDP 105 W TDP 115 W TDP 125 W TDP 130 W TDP 140 W TDP 165 W 100% 139% 142% 145% 136% 134% 135% 129% 130% 124%
Power Consumption - The Witcher 3 Power Consumption - external Monitor *
min: 316.5 avg: 401 median: 394.5 (55%) max: 550 Watt
247 Watt (34%)
GPU TDP ? TDP 130 W 100% 149%
min: 124 avg: 183.8 median: 181 (25%) max: 244 Watt
GPU TDP ? TDP 95 W TDP 100 W TDP 105 W TDP 115 W TDP 125 W TDP 130 W TDP 140 W TDP 165 W 100% 151% 156% 145% 136% 142% 138% 137% 134%
Power Consumption - Witcher 3 Power Consumption *
338.1 Watt (74%)
min: 123 avg: 186.6 median: 189 (42%) max: 297 Watt
GPU TDP ? TDP 90 W TDP 95 W TDP 100 W TDP 105 W TDP 125 W TDP 130 W TDP 140 W TDP 155 W TDP 165 W 100% 258% 269% 272% 242% 227% 228% 220% 190% 200%
Power Consumption - Witcher 3 ultra Power Efficiency
0.4 fps per Watt (39%)
min: 0.4141 avg: 0.6 median: 0.6 (56%) max: 0.74 fps per Watt
GPU TDP ? TDP 90 W TDP 95 W TDP 100 W TDP 105 W TDP 125 W TDP 130 W TDP 140 W TDP 155 W TDP 165 W 56% 80% 97% 100% 85% 82% 80% 81% 74% 75%
Power Consumption - Witcher 3 ultra Power Efficiency - external Monitor
min: 0.22 avg: 0.3 median: 0.3 (26%) max: 0.3911 fps per Watt
0.3 fps per Watt (21%)
GPU TDP ? TDP 130 W 100% 79%
min: 0.4696 avg: 0.6 median: 0.6 (47%) max: 0.736 fps per Watt
GPU TDP ? TDP 95 W TDP 100 W TDP 105 W TDP 115 W TDP 125 W TDP 130 W TDP 140 W TDP 165 W 45% 93% 100% 88% 72% 86% 73% 81% 77%
Emissions Witcher 3 Fan Noise + NVIDIA GeForce RTX 3080 Laptop GPU Emissions - Witcher 3 Fan Noise
min: 36.8 avg: 49 median: 49.7 (80%) max: 61 dB(A)
GPU TDP ? TDP 90 W TDP 95 W TDP 100 W TDP 105 W TDP 115 W TDP 125 W TDP 130 W TDP 140 W TDP 155 W TDP 165 W 82% 87% 85% 96% 93% 89% 100% 93% 87% 69% 98%
Clock Speed - GPU Clock Witcher 3 ultra
min: 1260 avg: 1530 median: 1492.5 (59%) max: 1815 MHz
GPU TDP 95 W TDP 100 W TDP 105 W TDP 130 W TDP 140 W TDP 165 W 81% 74% 81% 100% 96% 99%
Clock Speed - GPU Clock Speed Furmark
min: 1440 avg: 1466 median: 1465.5 (58%) max: 1491 MHz
1185 MHz (47%)
GPU TDP ? TDP 130 W 100% 81%
Average Benchmarks NVIDIA GeForce RTX 3070 → 100% n=45 Average Benchmarks NVIDIA GeForce RTX 3050 → 64% n=45 Average Benchmarks NVIDIA GeForce RTX 3080 Laptop GPU → 87% n=45
- Range of benchmark values for this graphics card
- Average benchmark values for this graphics card
* Smaller numbers mean a higher performance
1 This benchmark is not used for the average calculation
Game Benchmarks The following benchmarks stem from our benchmarks of review laptops. The performance depends on the used graphics memory, clock rate, processor, system settings, drivers, and operating systems. So the results don't have to be representative for all laptops with this GPU. For detailed information on the benchmark results, click on the fps number.
GeForce RTX 3080 Laptop GPU:
61.5 [X] Acemagic Tank03 Intel Core i9-12900H 1.8GHz
GeForce RTX 3080 Laptop GPU
min:
16.8 fps, P0.1:
29.3 fps, P1:
34.5 fps, max:
96.4 fps
fps
GeForce RTX 3080 Laptop GPU:
60.8 [X] Acemagic Tank03 Intel Core i9-12900H 1.8GHz
GeForce RTX 3080 Laptop GPU
min:
13.9 fps, P0.1:
29.4 fps, P1:
33.9 fps, max:
93 fps
fps
GeForce RTX 3080 Laptop GPU:
53.6 [X] Acemagic Tank03 Intel Core i9-12900H 1.8GHz
GeForce RTX 3080 Laptop GPU
min:
26.2 fps, P0.1:
35 fps, P1:
41.4 fps, max:
72 fps
fps
GeForce RTX 3080 Laptop GPU:
32.1 [X] Acemagic Tank03 Intel Core i9-12900H 1.8GHz
GeForce RTX 3080 Laptop GPU
min:
25.5 fps, P0.1:
26.1 fps, P1:
27.1 fps, max:
38.9 fps
fps
GeForce RTX 3080 Laptop GPU:
40.7 [X] Acemagic Tank03 Intel Core i9-12900H 1.8GHz
GeForce RTX 3080 Laptop GPU
min:
31.9 fps, P0.1:
32.4 fps, P1:
34.3 fps, max:
49.3 fps
fps
GeForce RTX 3080 Laptop GPU:
36.7 [X] Acemagic Tank03 Intel Core i9-12900H 1.8GHz
GeForce RTX 3080 Laptop GPU
min:
30.1 fps, P0.1:
30.6 fps, P1:
31.3 fps, max:
46.5 fps
fps
GeForce RTX 3080 Laptop GPU:
100.7 [X] Acemagic Tank03 Intel Core i9-12900H 1.8GHz
GeForce RTX 3080 Laptop GPU
min:
71.4 fps, P0.1:
73.2 fps, P1:
81.2 fps, max:
167.4 fps
fps
GeForce RTX 3080 Laptop GPU:
93 [X] Acemagic Tank03 Intel Core i9-12900H 1.8GHz
GeForce RTX 3080 Laptop GPU
min:
71.5 fps, P0.1:
72.1 fps, P1:
75.6 fps, max:
142.5 fps
fps
GeForce RTX 3080 Laptop GPU:
62.7 [X] Acemagic Tank03 Intel Core i9-12900H 1.8GHz
GeForce RTX 3080 Laptop GPU
min:
48.5 fps, P0.1:
48.9 fps, P1:
51.8 fps, max:
96 fps
fps
GeForce RTX 3080 Laptop GPU:
62.6 [X] Acemagic Tank03 Intel Core i9-12900H 1.8GHz
GeForce RTX 3080 Laptop GPU
min:
47.2 fps, P0.1:
48 fps, P1:
51.3 fps, max:
96 fps
74 [X] MSI GE76 Raider 11UH-472US Intel Core i9-11980HK 3.3GHz
GeForce RTX 3080 Laptop GPU
min:
43.9 fps, P0.1:
47.9 fps, P1:
61.6 fps, max:
101.8 fps
~ 68 fps
GeForce RTX 3080 Laptop GPU:
47.9 [X] Acemagic Tank03 Intel Core i9-12900H 1.8GHz
GeForce RTX 3080 Laptop GPU
min:
38.9 fps, P0.1:
39.3 fps, P1:
40.6 fps, max:
65.8 fps
55.9 [X] MSI GE76 Raider 11UH-472US Intel Core i9-11980HK 3.3GHz
GeForce RTX 3080 Laptop GPU
min:
44.1 fps, P0.1:
44.5 fps, P1:
48.5 fps, max:
76.8 fps
~ 52 fps
GeForce RTX 3080 Laptop GPU:
28.9 [X] Acemagic Tank03 Intel Core i9-12900H 1.8GHz
GeForce RTX 3080 Laptop GPU
min:
24.8 fps, P0.1:
24.8 fps, P1:
25.7 fps, max:
38 fps
35.3 [X] MSI GE76 Raider 11UH-472US Intel Core i9-11980HK 3.3GHz
GeForce RTX 3080 Laptop GPU
min:
29.7 fps, P0.1:
29.7 fps, P1:
30.7 fps, max:
50.6 fps
~ 32 fps
GeForce RTX 3080 Laptop GPU:
40.8 [X] Acemagic Tank03 Intel Core i9-12900H 1.8GHz
GeForce RTX 3080 Laptop GPU
min:
34.2 fps, P0.1:
34.7 fps, P1:
35.8 fps, max:
58.7 fps
48.9 [X] MSI GE76 Raider 11UH-472US Intel Core i9-11980HK 3.3GHz
GeForce RTX 3080 Laptop GPU
min:
39.6 fps, P0.1:
40.8 fps, P1:
43.2 fps, max:
58.8 fps
~ 45 fps
GeForce RTX 3080 Laptop GPU:
38.8 [X] Acemagic Tank03 Intel Core i9-12900H 1.8GHz
GeForce RTX 3080 Laptop GPU
min:
32.9 fps, P0.1:
33.1 fps, P1:
33.7 fps, max:
50.9 fps
fps
GeForce RTX 3080 Laptop GPU:
165.1 [X] Acemagic Tank03 Intel Core i9-12900H 1.8GHz
GeForce RTX 3080 Laptop GPU
min:
36.6 fps, P0.1:
78.2 fps, P1:
125.6 fps, max:
350 fps
fps
GeForce RTX 3080 Laptop GPU:
157 [X] Acemagic Tank03 Intel Core i9-12900H 1.8GHz
GeForce RTX 3080 Laptop GPU
min:
10.9 fps, P0.1:
61.2 fps, P1:
112 fps, max:
332 fps
fps
GeForce RTX 3080 Laptop GPU:
155 [X] Acemagic Tank03 Intel Core i9-12900H 1.8GHz
GeForce RTX 3080 Laptop GPU
min:
32.9 fps, P0.1:
59.5 fps, P1:
102.6 fps, max:
303 fps
fps
GeForce RTX 3080 Laptop GPU:
103.2 [X] Acemagic Tank03 Intel Core i9-12900H 1.8GHz
GeForce RTX 3080 Laptop GPU
min:
34 fps, P0.1:
43.6 fps, P1:
68.6 fps, max:
223 fps
fps
GeForce RTX 3080 Laptop GPU:
50.7 [X] Acemagic Tank03 Intel Core i9-12900H 1.8GHz
GeForce RTX 3080 Laptop GPU
min:
8.46 fps, P0.1:
22 fps, P1:
24.1 fps, max:
219 fps
fps
GeForce RTX 3080 Laptop GPU:
20.2 [X] Acemagic Tank03 Intel Core i9-12900H 1.8GHz
GeForce RTX 3080 Laptop GPU
min:
13 fps, P0.1:
14 fps, P1:
16.9 fps, max:
68.1 fps
fps
GeForce RTX 3080 Laptop GPU:
40.3 [X] Acemagic Tank03 Intel Core i9-12900H 1.8GHz
GeForce RTX 3080 Laptop GPU
min:
19.8 fps, P0.1:
19.9 fps, P1:
21.2 fps, max:
143.8 fps
fps
GeForce RTX 3080 Laptop GPU:
55.9 [X] Acemagic Tank03 Intel Core i9-12900H 1.8GHz
GeForce RTX 3080 Laptop GPU
min:
27.4 fps, P0.1:
29.1 fps, P1:
30.6 fps, max:
149.8 fps
fps
GeForce RTX 3080 Laptop GPU:
179.4 [X] Acemagic Tank03 Intel Core i9-12900H 1.8GHz
GeForce RTX 3080 Laptop GPU
min:
21.7 fps, P0.1:
114.2 fps, P1:
148.6 fps, max:
244 fps
fps
GeForce RTX 3080 Laptop GPU:
172.8 [X] Acemagic Tank03 Intel Core i9-12900H 1.8GHz
GeForce RTX 3080 Laptop GPU
min:
17.1 fps, P0.1:
107.3 fps, P1:
143.3 fps, max:
325 fps
fps
GeForce RTX 3080 Laptop GPU:
167.5 [X] Acemagic Tank03 Intel Core i9-12900H 1.8GHz
GeForce RTX 3080 Laptop GPU
min:
19.5 fps, P0.1:
106.7 fps, P1:
136.3 fps, max:
228 fps
fps
GeForce RTX 3080 Laptop GPU:
127.9 [X] Acemagic Tank03 Intel Core i9-12900H 1.8GHz
GeForce RTX 3080 Laptop GPU
min:
19.3 fps, P0.1:
79.6 fps, P1:
102.5 fps, max:
356 fps
fps
GeForce RTX 3080 Laptop GPU:
83 [X] Acemagic Tank03 Intel Core i9-12900H 1.8GHz
GeForce RTX 3080 Laptop GPU
min:
21.4 fps, P0.1:
67.3 fps, P1:
70.8 fps, max:
212 fps
fps
GeForce RTX 3080 Laptop GPU:
40.6 [X] Acemagic Tank03 Intel Core i9-12900H 1.8GHz
GeForce RTX 3080 Laptop GPU
min:
24.2 fps, P0.1:
25.3 fps, P1:
29.1 fps, max:
141.4 fps
fps
GeForce RTX 3080 Laptop GPU:
97 fps
GeForce RTX 3080 Laptop GPU:
90 110 [X] MSI GE76 Raider 11UH-472US Intel Core i9-11980HK 3.3GHz
GeForce RTX 3080 Laptop GPU
min:
46 fps, max:
169 fps
~ 100 fps
GeForce RTX 3080 Laptop GPU:
73 93 [X] MSI GE76 Raider 11UH-472US Intel Core i9-11980HK 3.3GHz
GeForce RTX 3080 Laptop GPU
min:
46 fps, max:
161 fps
~ 83 fps
GeForce RTX 3080 Laptop GPU:
57 73 [X] MSI GE76 Raider 11UH-472US Intel Core i9-11980HK 3.3GHz
GeForce RTX 3080 Laptop GPU
min:
43 fps, max:
126 fps
~ 65 fps
GeForce RTX 3080 Laptop GPU:
45 62 [X] MSI GE76 Raider 11UH-472US Intel Core i9-11980HK 3.3GHz
GeForce RTX 3080 Laptop GPU
min:
41 fps, max:
102 fps
~ 54 fps
GeForce RTX 3080 Laptop GPU:
30 39 [X] MSI GE76 Raider 11UH-472US Intel Core i9-11980HK 3.3GHz
GeForce RTX 3080 Laptop GPU
min:
28 fps, max:
61 fps
~ 35 fps
GeForce RTX 3080 Laptop GPU:
43 51 [X] MSI GE76 Raider 11UH-472US Intel Core i9-11980HK 3.3GHz
GeForce RTX 3080 Laptop GPU
min:
33 fps, max:
97 fps
~ 47 fps
GeForce RTX 3080 Laptop GPU:
39 fps
GeForce RTX 3080 Laptop GPU:
125.9 [X] Acemagic Tank03 Intel Core i9-12900H 1.8GHz
GeForce RTX 3080 Laptop GPU
min:
50.7 fps, P0.1:
96.8 fps, P1:
105.7 fps, max:
154.2 fps
fps
GeForce RTX 3080 Laptop GPU:
95.2 [X] Acemagic Tank03 Intel Core i9-12900H 1.8GHz
GeForce RTX 3080 Laptop GPU
min:
43.7 fps, P0.1:
63.3 fps, P1:
85.4 fps, max:
129.4 fps
fps
GeForce RTX 3080 Laptop GPU:
85.6 [X] Acemagic Tank03 Intel Core i9-12900H 1.8GHz
GeForce RTX 3080 Laptop GPU
min:
43.9 fps, P0.1:
55.4 fps, P1:
76.3 fps, max:
123.5 fps
fps
GeForce RTX 3080 Laptop GPU:
86.3 [X] Acemagic Tank03 Intel Core i9-12900H 1.8GHz
GeForce RTX 3080 Laptop GPU
min:
50.6 fps, P0.1:
70 fps, P1:
76.2 fps, max:
130.9 fps
97.4 [X] MSI GE76 Raider 11UH-472US Intel Core i9-11980HK 3.3GHz
GeForce RTX 3080 Laptop GPU
min:
43.7 fps, P0.1:
57.1 fps, P1:
82.7 fps, max:
133.9 fps
~ 92 fps
GeForce RTX 3080 Laptop GPU:
64.7 [X] Acemagic Tank03 Intel Core i9-12900H 1.8GHz
GeForce RTX 3080 Laptop GPU
min:
44.3 fps, P0.1:
52.3 fps, P1:
57.8 fps, max:
96.6 fps
71.4 [X] MSI GE76 Raider 11UH-472US Intel Core i9-11980HK 3.3GHz
GeForce RTX 3080 Laptop GPU
min:
36 fps, P0.1:
52 fps, P1:
64.8 fps, max:
103.8 fps
~ 68 fps
GeForce RTX 3080 Laptop GPU:
37.6 [X] Acemagic Tank03 Intel Core i9-12900H 1.8GHz
GeForce RTX 3080 Laptop GPU
min:
30.4 fps, P0.1:
32.3 fps, P1:
33.7 fps, max:
44.6 fps
40.9 [X] MSI GE76 Raider 11UH-472US Intel Core i9-11980HK 3.3GHz
GeForce RTX 3080 Laptop GPU
min:
31.3 fps, P0.1:
31.7 fps, P1:
36.8 fps, max:
49.2 fps
~ 39 fps
GeForce RTX 3080 Laptop GPU:
74 [X] Acemagic Tank03 Intel Core i9-12900H 1.8GHz
GeForce RTX 3080 Laptop GPU
min:
40.3 fps, P0.1:
44.5 fps, P1:
58.6 fps, max:
149.6 fps
fps
100%
NVIDIA GeForce RTX 3070:
81.6 [X] Desktop-PC Intel Core i9-13900K 3GHz
NVIDIA GeForce RTX 3070
min:
56.7 fps, P0.1:
59.7 fps, P1:
63.6 fps, max:
149.2 fps
fps
79%
GeForce RTX 3080 Laptop GPU:
64.8 [X] Acemagic Tank03 Intel Core i9-12900H 1.8GHz
GeForce RTX 3080 Laptop GPU
min:
47.3 fps, P0.1:
48.7 fps, P1:
52.4 fps, max:
156.5 fps
fps
100%
NVIDIA GeForce RTX 3070:
68.1 [X] Desktop-PC Intel Core i9-13900K 3GHz
NVIDIA GeForce RTX 3070
min:
48.8 fps, P0.1:
50.2 fps, P1:
53.4 fps, max:
110.7 fps
fps
81%
GeForce RTX 3080 Laptop GPU:
55.3 [X] Acemagic Tank03 Intel Core i9-12900H 1.8GHz
GeForce RTX 3080 Laptop GPU
min:
29.6 fps, P0.1:
42.4 fps, P1:
44.8 fps, max:
166.9 fps
fps
100%
NVIDIA GeForce RTX 3070:
56.7 [X] Desktop-PC Intel Core i9-13900K 3GHz
NVIDIA GeForce RTX 3070
min:
40.9 fps, P0.1:
41.9 fps, P1:
44.4 fps, max:
96.8 fps
fps
90%
GeForce RTX 3080 Laptop GPU:
48.1 [X] Acemagic Tank03 Intel Core i9-12900H 1.8GHz
GeForce RTX 3080 Laptop GPU
min:
16.2 fps, P0.1:
36.2 fps, P1:
38.6 fps, max:
148.7 fps
53.4 [X] MSI GE76 Raider 11UH-472US Intel Core i9-11980HK 3.3GHz
GeForce RTX 3080 Laptop GPU
min:
32.5 fps, P0.1:
36.6 fps, P1:
38.8 fps, max:
111 fps
~ 51 fps
100%
NVIDIA GeForce RTX 3070:
44.9 [X] Desktop-PC Intel Core i9-13900K 3GHz
NVIDIA GeForce RTX 3070
min:
33.9 fps, P0.1:
34.7 fps, P1:
35.9 fps, max:
65.1 fps
fps
89%
GeForce RTX 3080 Laptop GPU:
37.2 [X] Acemagic Tank03 Intel Core i9-12900H 1.8GHz
GeForce RTX 3080 Laptop GPU
min:
25.2 fps, P0.1:
29.8 fps, P1:
31 fps, max:
49.3 fps
42.2 [X] MSI GE76 Raider 11UH-472US Intel Core i9-11980HK 3.3GHz
GeForce RTX 3080 Laptop GPU
min:
27.8 fps, P0.1:
28.5 fps, P1:
31.7 fps, max:
69 fps
~ 40 fps
100%
NVIDIA GeForce RTX 3070:
28.2 [X] Desktop-PC Intel Core i9-13900K 3GHz
NVIDIA GeForce RTX 3070
min:
22.8 fps, P0.1:
23.3 fps, P1:
24.2 fps, max:
37.6 fps
fps
89%
GeForce RTX 3080 Laptop GPU:
23.1 [X] Acemagic Tank03 Intel Core i9-12900H 1.8GHz
GeForce RTX 3080 Laptop GPU
min:
17.2 fps, P0.1:
18.3 fps, P1:
19.9 fps, max:
41.2 fps
26.1 [X] MSI GE76 Raider 11UH-472US Intel Core i9-11980HK 3.3GHz
GeForce RTX 3080 Laptop GPU
min:
19.1 fps, P0.1:
19.2 fps, P1:
21.3 fps, max:
34.2 fps
~ 25 fps
GeForce RTX 3080 Laptop GPU:
34.3 [X] Acemagic Tank03 Intel Core i9-12900H 1.8GHz
GeForce RTX 3080 Laptop GPU
min:
23.4 fps, P0.1:
25 fps, P1:
28.9 fps, max:
48.2 fps
39.9 [X] MSI GE76 Raider 11UH-472US Intel Core i9-11980HK 3.3GHz
GeForce RTX 3080 Laptop GPU
min:
28.6 fps, P0.1:
28.8 fps, P1:
30.8 fps, max:
61 fps
~ 37 fps
GeForce RTX 3080 Laptop GPU:
33.1 [X] Acemagic Tank03 Intel Core i9-12900H 1.8GHz
GeForce RTX 3080 Laptop GPU
min:
27.5 fps, P0.1:
27.8 fps, P1:
28.2 fps, max:
42.2 fps
fps
GeForce RTX 3080 Laptop GPU:
119.9 [X] Acemagic Tank03 Intel Core i9-12900H 1.8GHz
GeForce RTX 3080 Laptop GPU
min:
49 fps, P0.1:
65.2 fps, P1:
93.3 fps, max:
216 fps
fps
100%
NVIDIA GeForce RTX 3070:
173.9 [X] Desktop-PC Intel Core i9-13900K 3GHz
NVIDIA GeForce RTX 3070
min:
72.7 fps, P0.1:
90.2 fps, P1:
136.7 fps, max:
300 fps
fps
67%
GeForce RTX 3080 Laptop GPU:
116.4 [X] Acemagic Tank03 Intel Core i9-12900H 1.8GHz
GeForce RTX 3080 Laptop GPU
min:
9.07 fps, P0.1:
47.5 fps, P1:
86.8 fps, max:
190.5 fps
fps
100%
NVIDIA GeForce RTX 3070:
138.8 [X] Desktop-PC Intel Core i9-13900K 3GHz
NVIDIA GeForce RTX 3070
min:
55 fps, P0.1:
64.5 fps, P1:
107.1 fps, max:
215 fps
fps
74%
GeForce RTX 3080 Laptop GPU:
102.5 [X] Acemagic Tank03 Intel Core i9-12900H 1.8GHz
GeForce RTX 3080 Laptop GPU
min:
44.1 fps, P0.1:
46.7 fps, P1:
76.6 fps, max:
148.5 fps
fps
100%
NVIDIA GeForce RTX 3070:
124.6 [X] Desktop-PC Intel Core i9-13900K 3GHz
NVIDIA GeForce RTX 3070
min:
37.3 fps, P0.1:
71.4 fps, P1:
103.6 fps, max:
202 fps
fps
78%
GeForce RTX 3080 Laptop GPU:
93.1 [X] Acemagic Tank03 Intel Core i9-12900H 1.8GHz
GeForce RTX 3080 Laptop GPU
min:
32.8 fps, P0.1:
71.9 fps, P1:
78.5 fps, max:
133.6 fps
100.5 [X] MSI GE76 Raider 11UH-472US Intel Core i9-11980HK 3.3GHz
GeForce RTX 3080 Laptop GPU
min:
28.6 fps, P0.1:
66.7 fps, P1:
78.2 fps, max:
154.1 fps
~ 97 fps
100%
NVIDIA GeForce RTX 3070:
91.4 [X] Desktop-PC Intel Core i9-13900K 3GHz
NVIDIA GeForce RTX 3070
min:
38.7 fps, P0.1:
46.3 fps, P1:
80.1 fps, max:
175.5 fps
fps
78%
GeForce RTX 3080 Laptop GPU:
65.5 [X] Acemagic Tank03 Intel Core i9-12900H 1.8GHz
GeForce RTX 3080 Laptop GPU
min:
29.2 fps, P0.1:
40.1 fps, P1:
56 fps, max:
149.4 fps
76.4 [X] MSI GE76 Raider 11UH-472US Intel Core i9-11980HK 3.3GHz
GeForce RTX 3080 Laptop GPU
min:
55.3 fps, P0.1:
56.5 fps, P1:
63.6 fps, max:
114.1 fps
~ 71 fps
100%
NVIDIA GeForce RTX 3070:
51.8 [X] Desktop-PC Intel Core i9-13900K 3GHz
NVIDIA GeForce RTX 3070
min:
24.8 fps, P0.1:
38.2 fps, P1:
47.3 fps, max:
127.3 fps
fps
77%
GeForce RTX 3080 Laptop GPU:
35.2 [X] Acemagic Tank03 Intel Core i9-12900H 1.8GHz
GeForce RTX 3080 Laptop GPU
min:
17.1 fps, P0.1:
17.6 fps, P1:
21 fps, max:
123.1 fps
45.1 [X] MSI GE76 Raider 11UH-472US Intel Core i9-11980HK 3.3GHz
GeForce RTX 3080 Laptop GPU
min:
17.3 fps, P0.1:
21.4 fps, P1:
30.5 fps, max:
77.2 fps
~ 40 fps
GeForce RTX 3080 Laptop GPU:
47.4 [X] Acemagic Tank03 Intel Core i9-12900H 1.8GHz
GeForce RTX 3080 Laptop GPU
min:
20.6 fps, P0.1:
36.5 fps, P1:
40.4 fps, max:
114.7 fps
61.8 [X] MSI GE76 Raider 11UH-472US Intel Core i9-11980HK 3.3GHz
GeForce RTX 3080 Laptop GPU
min:
24.3 fps, P0.1:
29.8 fps, P1:
41 fps, max:
105.3 fps
~ 55 fps
100%
NVIDIA GeForce RTX 3070:
359 [X] Desktop-PC Intel Core i9-13900K 3GHz
NVIDIA GeForce RTX 3070
min:
29 fps, P0.1:
231 fps, P1:
332 fps, max:
1054 fps
fps
93%
GeForce RTX 3080 Laptop GPU:
333 [X] Acemagic Tank03 Intel Core i9-12900H 1.8GHz
GeForce RTX 3080 Laptop GPU
min:
19.9 fps, P0.1:
106.9 fps, P1:
208 fps, max:
759 fps
fps
100%
NVIDIA GeForce RTX 3070:
359 [X] Desktop-PC Intel Core i9-13900K 3GHz
NVIDIA GeForce RTX 3070
min:
28.7 fps, P0.1:
288 fps, P1:
328 fps, max:
1043 fps
fps
86%
GeForce RTX 3080 Laptop GPU:
307 [X] Acemagic Tank03 Intel Core i9-12900H 1.8GHz
GeForce RTX 3080 Laptop GPU
min:
20 fps, P0.1:
143.2 fps, P1:
187.4 fps, max:
900 fps
fps
100%
NVIDIA GeForce RTX 3070:
359 [X] Desktop-PC Intel Core i9-13900K 3GHz
NVIDIA GeForce RTX 3070
min:
28.2 fps, P0.1:
265 fps, P1:
328 fps, max:
1047 fps
fps
84%
GeForce RTX 3080 Laptop GPU:
300 [X] Acemagic Tank03 Intel Core i9-12900H 1.8GHz
GeForce RTX 3080 Laptop GPU
min:
19.6 fps, P0.1:
145.8 fps, P1:
178.9 fps, max:
801 fps
fps
100%
NVIDIA GeForce RTX 3070:
359 [X] Desktop-PC Intel Core i9-13900K 3GHz
NVIDIA GeForce RTX 3070
min:
29 fps, P0.1:
255 fps, P1:
325 fps, max:
1082 fps
fps
71%
GeForce RTX 3080 Laptop GPU:
256 [X] Acemagic Tank03 Intel Core i9-12900H 1.8GHz
GeForce RTX 3080 Laptop GPU
min:
18.3 fps, P0.1:
129.8 fps, P1:
149.7 fps, max:
815 fps
fps
100%
NVIDIA GeForce RTX 3070:
230 [X] Desktop-PC Intel Core i9-13900K 3GHz
NVIDIA GeForce RTX 3070
min:
27.9 fps, P0.1:
98 fps, P1:
183.2 fps, max:
676 fps
fps
87%
GeForce RTX 3080 Laptop GPU:
176 [X] Acemagic Tank03 Intel Core i9-12900H 1.8GHz
GeForce RTX 3080 Laptop GPU
min:
17.6 fps, P0.1:
98.6 fps, P1:
126.9 fps, max:
369 fps
222 [X] MSI GE76 Raider 11UH-472US Intel Core i9-11980HK 3.3GHz
GeForce RTX 3080 Laptop GPU
min:
17.7 fps, P0.1:
72.1 fps, P1:
174.2 fps, max:
623 fps
~ 199 fps
GeForce RTX 3080 Laptop GPU:
147.8 [X] Acemagic Tank03 Intel Core i9-12900H 1.8GHz
GeForce RTX 3080 Laptop GPU
min:
6.91 fps, P0.1:
9.95 fps, P1:
29.8 fps, max:
343 fps
fps
100%
NVIDIA GeForce RTX 3070:
294 [X] Desktop-PC Intel Core i9-13900K 3GHz
NVIDIA GeForce RTX 3070
min:
29 fps, P0.1:
105.5 fps, P1:
143.5 fps, max:
642 fps
fps
47%
GeForce RTX 3080 Laptop GPU:
138.2 [X] Acemagic Tank03 Intel Core i9-12900H 1.8GHz
GeForce RTX 3080 Laptop GPU
min:
9.42 fps, P0.1:
56.6 fps, P1:
80.7 fps, max:
341 fps
fps
100%
NVIDIA GeForce RTX 3070:
259 [X] Desktop-PC Intel Core i9-13900K 3GHz
NVIDIA GeForce RTX 3070
min:
51.5 fps, P0.1:
122.8 fps, P1:
130.8 fps, max:
588 fps
fps
47%
GeForce RTX 3080 Laptop GPU:
120.5 [X] Acemagic Tank03 Intel Core i9-12900H 1.8GHz
GeForce RTX 3080 Laptop GPU
min:
11.6 fps, P0.1:
33.1 fps, P1:
71 fps, max:
287 fps
fps
100%
NVIDIA GeForce RTX 3070:
187 [X] Desktop-PC Intel Core i9-13900K 3GHz
NVIDIA GeForce RTX 3070
min:
48.1 fps, P0.1:
102 fps, P1:
109.8 fps, max:
514 fps
fps
64%
GeForce RTX 3080 Laptop GPU:
82.3 [X] Acemagic Tank03 Intel Core i9-12900H 1.8GHz
GeForce RTX 3080 Laptop GPU
min:
31.1 fps, P0.1:
42 fps, P1:
47.2 fps, max:
315 fps
157.4 [X] MSI GE76 Raider 11UH-472US Intel Core i9-11980HK 3.3GHz
GeForce RTX 3080 Laptop GPU
min:
10.7 fps, P0.1:
34.2 fps, P1:
105.9 fps, max:
258 fps
~ 120 fps
100%
NVIDIA GeForce RTX 3070:
115.6 [X] Desktop-PC Intel Core i9-13900K 3GHz
NVIDIA GeForce RTX 3070
min:
43.6 fps, P0.1:
64.5 fps, P1:
67.5 fps, max:
499 fps
fps
76%
GeForce RTX 3080 Laptop GPU:
82 [X] Acemagic Tank03 Intel Core i9-12900H 1.8GHz
GeForce RTX 3080 Laptop GPU
min:
26.5 fps, P0.1:
33.2 fps, P1:
46.6 fps, max:
295 fps
94.7 [X] MSI GE76 Raider 11UH-472US Intel Core i9-11980HK 3.3GHz
GeForce RTX 3080 Laptop GPU
min:
13.9 fps, P0.1:
26.1 fps, P1:
58.6 fps, max:
219 fps
~ 88 fps
100%
NVIDIA GeForce RTX 3070:
53.6 [X] Desktop-PC Intel Core i9-13900K 3GHz
NVIDIA GeForce RTX 3070
min:
27.2 fps, P0.1:
27.4 fps, P1:
28.5 fps, max:
433 fps
fps
76%
GeForce RTX 3080 Laptop GPU:
38 43.1 [X] MSI GE76 Raider 11UH-472US Intel Core i9-11980HK 3.3GHz
GeForce RTX 3080 Laptop GPU
min:
4.36 fps, P0.1:
5.88 fps, P1:
11.2 fps, max:
268 fps
~ 41 fps
GeForce RTX 3080 Laptop GPU:
76.1 [X] MSI GE76 Raider 11UH-472US Intel Core i9-11980HK 3.3GHz
GeForce RTX 3080 Laptop GPU
min:
42.2 fps, P0.1:
42.9 fps, P1:
45 fps, max:
257 fps
fps
100%
NVIDIA GeForce RTX 3070:
269 [X] Desktop-PC Intel Core i9-13900K 3GHz
NVIDIA GeForce RTX 3070
min:
154.8 fps, P0.1:
182.4 fps, P1:
202 fps, max:
472 fps
fps
100%
NVIDIA GeForce RTX 3070:
228 [X] Desktop-PC Intel Core i9-13900K 3GHz
NVIDIA GeForce RTX 3070
min:
130.5 fps, P0.1:
150.8 fps, P1:
173.2 fps, max:
361 fps
fps
100%
NVIDIA GeForce RTX 3070:
174.1 [X] Desktop-PC Intel Core i9-13900K 3GHz
NVIDIA GeForce RTX 3070
min:
114.5 fps, P0.1:
121.6 fps, P1:
133.4 fps, max:
273 fps
fps
81%
GeForce RTX 3080 Laptop GPU:
141.3 [X] MSI GE76 Raider 11UH-472US Intel Core i9-11980HK 3.3GHz
GeForce RTX 3080 Laptop GPU
min:
65.3 fps, P0.1:
88.9 fps, P1:
98.7 fps, max:
235 fps
fps
100%
NVIDIA GeForce RTX 3070:
112 [X] Desktop-PC Intel Core i9-13900K 3GHz
NVIDIA GeForce RTX 3070
min:
84 fps, P0.1:
85.3 fps, P1:
89.2 fps, max:
156.2 fps
fps
79%
GeForce RTX 3080 Laptop GPU:
88.1 [X] MSI GE76 Raider 11UH-472US Intel Core i9-11980HK 3.3GHz
GeForce RTX 3080 Laptop GPU
min:
51.7 fps, P0.1:
59.7 fps, P1:
64.7 fps, max:
165.5 fps
fps
100%
NVIDIA GeForce RTX 3070:
53.9 [X] Desktop-PC Intel Core i9-13900K 3GHz
NVIDIA GeForce RTX 3070
min:
40.8 fps, P0.1:
42 fps, P1:
44.3 fps, max:
66 fps
fps
78%
GeForce RTX 3080 Laptop GPU:
42.3 [X] MSI GE76 Raider 11UH-472US Intel Core i9-11980HK 3.3GHz
GeForce RTX 3080 Laptop GPU
min:
29.4 fps, P0.1:
30.8 fps, P1:
32.7 fps, max:
71.1 fps
fps
GeForce RTX 3080 Laptop GPU:
75 [X] Acemagic Tank03 Intel Core i9-12900H 1.8GHz
GeForce RTX 3080 Laptop GPU
min:
58 fps, max:
96 fps
fps
100%
NVIDIA GeForce RTX 3070:
96 [X] Desktop-PC Intel Core i9-13900K 3GHz
NVIDIA GeForce RTX 3070
min:
76 fps
fps
73%
GeForce RTX 3080 Laptop GPU:
70 [X] Acemagic Tank03 Intel Core i9-12900H 1.8GHz
GeForce RTX 3080 Laptop GPU
min:
54 fps, max:
86 fps
fps
100%
NVIDIA GeForce RTX 3070:
83 [X] Desktop-PC Intel Core i9-13900K 3GHz
NVIDIA GeForce RTX 3070
min:
64 fps
fps
72%
GeForce RTX 3080 Laptop GPU:
60 [X] Acemagic Tank03 Intel Core i9-12900H 1.8GHz
GeForce RTX 3080 Laptop GPU
min:
44 fps, max:
79 fps
fps
100%
NVIDIA GeForce RTX 3070:
64 [X] Desktop-PC Intel Core i9-13900K 3GHz
NVIDIA GeForce RTX 3070
min:
49 fps
fps
72%
GeForce RTX 3080 Laptop GPU:
46 [X] Acemagic Tank03 Intel Core i9-12900H 1.8GHz
GeForce RTX 3080 Laptop GPU
min:
34 fps, max:
61 fps
fps
100%
NVIDIA GeForce RTX 3070:
43 [X] Desktop-PC Intel Core i9-13900K 3GHz
NVIDIA GeForce RTX 3070
min:
34 fps
fps
70%
GeForce RTX 3080 Laptop GPU:
30 [X] Acemagic Tank03 Intel Core i9-12900H 1.8GHz
GeForce RTX 3080 Laptop GPU
min:
23 fps, max:
39 fps
fps
100%
NVIDIA GeForce RTX 3070:
23 [X] Desktop-PC Intel Core i9-13900K 3GHz
NVIDIA GeForce RTX 3070
min:
19 fps
fps
65%
GeForce RTX 3080 Laptop GPU:
15 [X] Acemagic Tank03 Intel Core i9-12900H 1.8GHz
GeForce RTX 3080 Laptop GPU
min:
13 fps, max:
19 fps
fps
GeForce RTX 3080 Laptop GPU:
26 [X] Acemagic Tank03 Intel Core i9-12900H 1.8GHz
GeForce RTX 3080 Laptop GPU
min:
21 fps, max:
35 fps
fps
GeForce RTX 3080 Laptop GPU:
134 fps
GeForce RTX 3080 Laptop GPU:
119 fps
GeForce RTX 3080 Laptop GPU:
94 100 [X] MSI GE76 Raider 11UH-472US Intel Core i9-11980HK 3.3GHz
GeForce RTX 3080 Laptop GPU
P1:
66 fps
~ 97 fps
GeForce RTX 3080 Laptop GPU:
93 96 [X] MSI GE76 Raider 11UH-472US Intel Core i9-11980HK 3.3GHz
GeForce RTX 3080 Laptop GPU
P1:
74 fps
~ 95 fps
GeForce RTX 3080 Laptop GPU:
66 [X] MSI GE76 Raider 11UH-472US Intel Core i9-11980HK 3.3GHz
GeForce RTX 3080 Laptop GPU
P1:
48 fps
89 ~ 78 fps
GeForce RTX 3080 Laptop GPU:
38 [X] MSI GE76 Raider 11UH-472US Intel Core i9-11980HK 3.3GHz
GeForce RTX 3080 Laptop GPU
P1:
24 fps
67 ~ 53 fps
GeForce RTX 3080 Laptop GPU:
125.1 [X] Acemagic Tank03 Intel Core i9-12900H 1.8GHz
GeForce RTX 3080 Laptop GPU
min:
9.76 fps, P0.1:
20.8 fps, P1:
83.3 fps, max:
210 fps
fps
100%
NVIDIA GeForce RTX 3070:
137.4 [X] Desktop-PC Intel Core i9-13900K 3GHz
NVIDIA GeForce RTX 3070
min:
52.4 fps, P0.1:
104 fps, P1:
113.9 fps, max:
220 fps
fps
69%
GeForce RTX 3080 Laptop GPU:
95 [X] Acemagic Tank03 Intel Core i9-12900H 1.8GHz
GeForce RTX 3080 Laptop GPU
min:
18.3 fps, P0.1:
48.4 fps, P1:
77.7 fps, max:
131.7 fps
fps
100%
NVIDIA GeForce RTX 3070:
126.8 [X] Desktop-PC Intel Core i9-13900K 3GHz
NVIDIA GeForce RTX 3070
min:
14 fps, P0.1:
86.2 fps, P1:
108.5 fps, max:
184.5 fps
fps
69%
GeForce RTX 3080 Laptop GPU:
87.6 [X] Acemagic Tank03 Intel Core i9-12900H 1.8GHz
GeForce RTX 3080 Laptop GPU
min:
5.79 fps, P0.1:
20.8 fps, P1:
71.3 fps, max:
118.5 fps
fps
100%
NVIDIA GeForce RTX 3070:
118.3 [X] Desktop-PC Intel Core i9-13900K 3GHz
NVIDIA GeForce RTX 3070
min:
21.3 fps, P0.1:
81.1 fps, P1:
100 fps, max:
232 fps
fps
68%
GeForce RTX 3080 Laptop GPU:
79.6 [X] MSI GE76 Raider 11UH-472US Intel Core i9-11980HK 3.3GHz
GeForce RTX 3080 Laptop GPU
min:
6.04 fps, P0.1:
11.5 fps, P1:
59.2 fps, max:
113.6 fps
81.1 [X] Acemagic Tank03 Intel Core i9-12900H 1.8GHz
GeForce RTX 3080 Laptop GPU
min:
20.3 fps, P0.1:
37.3 fps, P1:
65.4 fps, max:
112.8 fps
~ 80 fps
100%
NVIDIA GeForce RTX 3070:
84.5 [X] Desktop-PC Intel Core i9-13900K 3GHz
NVIDIA GeForce RTX 3070
min:
10.6 fps, P0.1:
55.4 fps, P1:
72.8 fps, max:
174.1 fps
fps
77%
GeForce RTX 3080 Laptop GPU:
61.2 [X] Acemagic Tank03 Intel Core i9-12900H 1.8GHz
GeForce RTX 3080 Laptop GPU
min:
27.1 fps, P0.1:
33.2 fps, P1:
50.7 fps, max:
86.6 fps
69 [X] MSI GE76 Raider 11UH-472US Intel Core i9-11980HK 3.3GHz
GeForce RTX 3080 Laptop GPU
min:
5.28 fps, P0.1:
17.6 fps, P1:
55 fps, max:
97.3 fps
~ 65 fps
100%
NVIDIA GeForce RTX 3070:
48.6 [X] Desktop-PC Intel Core i9-13900K 3GHz
NVIDIA GeForce RTX 3070
min:
12.9 fps, P0.1:
27 fps, P1:
43.5 fps, max:
174.8 fps
fps
78%
GeForce RTX 3080 Laptop GPU:
35 [X] Acemagic Tank03 Intel Core i9-12900H 1.8GHz
GeForce RTX 3080 Laptop GPU
min:
21.6 fps, P0.1:
25.7 fps, P1:
29.5 fps, max:
57.6 fps
40.1 [X] MSI GE76 Raider 11UH-472US Intel Core i9-11980HK 3.3GHz
GeForce RTX 3080 Laptop GPU
min:
26.7 fps, P0.1:
31.8 fps, P1:
34.8 fps, max:
73.9 fps
~ 38 fps
GeForce RTX 3080 Laptop GPU:
50 [X] Acemagic Tank03 Intel Core i9-12900H 1.8GHz
GeForce RTX 3080 Laptop GPU
min:
10 fps, P0.1:
37.1 fps, P1:
42.2 fps, max:
75 fps
fps
GeForce RTX 3080 Laptop GPU:
65.9 [X] Acemagic Tank03 Intel Core i9-12900H 1.8GHz
GeForce RTX 3080 Laptop GPU
min:
29.4 fps, P0.1:
36 fps, P1:
39.5 fps, max:
134 fps
fps
GeForce RTX 3080 Laptop GPU:
61.6 [X] Acemagic Tank03 Intel Core i9-12900H 1.8GHz
GeForce RTX 3080 Laptop GPU
min:
30.6 fps, P0.1:
31.6 fps, P1:
37.5 fps, max:
136.8 fps
fps
GeForce RTX 3080 Laptop GPU:
55.1 [X] Acemagic Tank03 Intel Core i9-12900H 1.8GHz
GeForce RTX 3080 Laptop GPU
min:
29.4 fps, P0.1:
29.9 fps, P1:
34.7 fps, max:
127.7 fps
fps
GeForce RTX 3080 Laptop GPU:
39.1 [X] Acemagic Tank03 Intel Core i9-12900H 1.8GHz
GeForce RTX 3080 Laptop GPU
min:
24.9 fps, P0.1:
25.8 fps, P1:
27.7 fps, max:
92.6 fps
fps
GeForce RTX 3080 Laptop GPU:
20 [X] Acemagic Tank03 Intel Core i9-12900H 1.8GHz
GeForce RTX 3080 Laptop GPU
min:
9.52 fps, P0.1:
10.4 fps, P1:
15.6 fps, max:
54.3 fps
fps
100%
NVIDIA GeForce RTX 3070:
97.4 [X] Desktop-PC Intel Core i9-13900K 3GHz
NVIDIA GeForce RTX 3070
min:
73.2 fps, P0.1:
75.8 fps, P1:
83.4 fps, max:
151.9 fps
fps
100%
NVIDIA GeForce RTX 3070:
71.5 [X] Desktop-PC Intel Core i9-13900K 3GHz
NVIDIA GeForce RTX 3070
min:
23.2 fps, P0.1:
48 fps, P1:
62.4 fps, max:
202 fps
fps
100%
NVIDIA GeForce RTX 3070:
50.3 [X] Desktop-PC Intel Core i9-13900K 3GHz
NVIDIA GeForce RTX 3070
min:
16 fps, P0.1:
31.6 fps, P1:
44.1 fps, max:
196.7 fps
fps
183%
GeForce RTX 3080 Laptop GPU:
92.3 [X] MSI GE76 Raider 11UH-472US Intel Core i9-11980HK 3.3GHz
GeForce RTX 3080 Laptop GPU
min:
48 fps, P0.1:
57.7 fps, P1:
71.5 fps, max:
131.8 fps
fps
100%
NVIDIA GeForce RTX 3070:
35 [X] Desktop-PC Intel Core i9-13900K 3GHz
NVIDIA GeForce RTX 3070
min:
28.2 fps, P0.1:
28.2 fps, P1:
30.9 fps, max:
41.8 fps
fps
100%
NVIDIA GeForce RTX 3070:
18.9 [X] Desktop-PC Intel Core i9-13900K 3GHz
NVIDIA GeForce RTX 3070
min:
15 fps, P0.1:
15 fps, P1:
15.4 fps, max:
27.3 fps
fps
GeForce RTX 3080 Laptop GPU:
349.9 fps
100%
NVIDIA GeForce RTX 3070:
334 [X] Desktop-PC Intel Core i9-13900K 3GHz
NVIDIA GeForce RTX 3070
min:
213 fps
fps
66%
GeForce RTX 3080 Laptop GPU:
220.3 fps
100%
NVIDIA GeForce RTX 3070:
200 [X] Desktop-PC Intel Core i9-13900K 3GHz
NVIDIA GeForce RTX 3070
min:
157 fps
fps
67%
GeForce RTX 3080 Laptop GPU:
133.8 fps
100%
NVIDIA GeForce RTX 3070:
159 [X] Desktop-PC Intel Core i9-13900K 3GHz
NVIDIA GeForce RTX 3070
min:
122 fps
fps
65%
GeForce RTX 3080 Laptop GPU:
103.5 fps
100%
NVIDIA GeForce RTX 3070:
111 [X] Desktop-PC Intel Core i9-13900K 3GHz
NVIDIA GeForce RTX 3070
min:
86 fps
fps
71%
GeForce RTX 3080 Laptop GPU:
78.6 fps
100%
NVIDIA GeForce RTX 3070:
57.7 [X] Desktop-PC Intel Core i9-13900K 3GHz
NVIDIA GeForce RTX 3070
min:
45 fps
fps
73%
GeForce RTX 3080 Laptop GPU:
42.1 fps
GeForce RTX 3080 Laptop GPU:
103 [X] Acemagic Tank03 Intel Core i9-12900H 1.8GHz
GeForce RTX 3080 Laptop GPU
min:
48 fps, P0.1:
61 fps, P1:
82 fps, max:
138 fps
fps
100%
NVIDIA GeForce RTX 3070:
142 [X] Desktop-PC Intel Core i9-13900K 3GHz
NVIDIA GeForce RTX 3070
P0.1:
84 fpsP1:
fps
fps
68%
GeForce RTX 3080 Laptop GPU:
96 [X] Acemagic Tank03 Intel Core i9-12900H 1.8GHz
GeForce RTX 3080 Laptop GPU
min:
34 fps, P0.1:
52 fps, P1:
67 fps, max:
176 fps
fps
100%
NVIDIA GeForce RTX 3070:
135 [X] Desktop-PC Intel Core i9-13900K 3GHz
NVIDIA GeForce RTX 3070
P0.1:
74 fpsP1:
fps
fps
66%
GeForce RTX 3080 Laptop GPU:
89 [X] Acemagic Tank03 Intel Core i9-12900H 1.8GHz
GeForce RTX 3080 Laptop GPU
min:
28 fps, P0.1:
40 fps, P1:
58 fps, max:
173 fps
fps
100%
NVIDIA GeForce RTX 3070:
107 [X] Desktop-PC Intel Core i9-13900K 3GHz
NVIDIA GeForce RTX 3070
P0.1:
47 fpsP1:
fps
fps
68%
GeForce RTX 3080 Laptop GPU:
73 [X] Acemagic Tank03 Intel Core i9-12900H 1.8GHz
GeForce RTX 3080 Laptop GPU
min:
4 fps, P0.1:
24 fps, P1:
48 fps, max:
120 fps
fps
100%
NVIDIA GeForce RTX 3070:
85 [X] Desktop-PC Intel Core i9-13900K 3GHz
NVIDIA GeForce RTX 3070
P0.1:
46 fpsP1:
fps
fps
69%
GeForce RTX 3080 Laptop GPU:
59 [X] Acemagic Tank03 Intel Core i9-12900H 1.8GHz
GeForce RTX 3080 Laptop GPU
min:
6 fps, P0.1:
33 fps, P1:
43 fps, max:
111 fps
fps
100%
NVIDIA GeForce RTX 3070:
51 [X] Desktop-PC Intel Core i9-13900K 3GHz
NVIDIA GeForce RTX 3070
P0.1:
34 fpsP1:
fps
fps
78%
GeForce RTX 3080 Laptop GPU:
40 [X] Acemagic Tank03 Intel Core i9-12900H 1.8GHz
GeForce RTX 3080 Laptop GPU
min:
24 fps, P0.1:
26 fps, P1:
30 fps, max:
121 fps
fps
GeForce RTX 3080 Laptop GPU:
51 [X] Acemagic Tank03 Intel Core i9-12900H 1.8GHz
GeForce RTX 3080 Laptop GPU
min:
6 fps, P0.1:
27 fps, P1:
37 fps, max:
94 fps
fps
GeForce RTX 3080 Laptop GPU:
194.2 [X] Acemagic Tank03 Intel Core i9-12900H 1.8GHz
GeForce RTX 3080 Laptop GPU
min:
87.9 fps, P0.1:
130.5 fps, P1:
149.3 fps, max:
240 fps
fps
GeForce RTX 3080 Laptop GPU:
174.2 [X] Acemagic Tank03 Intel Core i9-12900H 1.8GHz
GeForce RTX 3080 Laptop GPU
min:
28.7 fps, P0.1:
128.4 fps, P1:
142.9 fps, max:
242 fps
fps
GeForce RTX 3080 Laptop GPU:
148.6 [X] Acemagic Tank03 Intel Core i9-12900H 1.8GHz
GeForce RTX 3080 Laptop GPU
min:
29.7 fps, P0.1:
67.4 fps, P1:
107.9 fps, max:
186 fps
fps
GeForce RTX 3080 Laptop GPU:
145.6 [X] Acemagic Tank03 Intel Core i9-12900H 1.8GHz
GeForce RTX 3080 Laptop GPU
min:
51.5 fps, P0.1:
71.5 fps, P1:
118.8 fps, max:
175 fps
151.1 [X] MSI GE76 Raider 11UH-472US Intel Core i9-11980HK 3.3GHz
GeForce RTX 3080 Laptop GPU
min:
62.3 fps, P0.1:
82.3 fps, P1:
114.1 fps, max:
195.1 fps
~ 148 fps
GeForce RTX 3080 Laptop GPU:
124.1 [X] Acemagic Tank03 Intel Core i9-12900H 1.8GHz
GeForce RTX 3080 Laptop GPU
min:
23.9 fps, P0.1:
65.8 fps, P1:
90.7 fps, max:
177.6 fps
135.6 [X] MSI GE76 Raider 11UH-472US Intel Core i9-11980HK 3.3GHz
GeForce RTX 3080 Laptop GPU
min:
70.2 fps, P0.1:
76.8 fps, P1:
104.1 fps, max:
169 fps
~ 130 fps
GeForce RTX 3080 Laptop GPU:
77.1 [X] Acemagic Tank03 Intel Core i9-12900H 1.8GHz
GeForce RTX 3080 Laptop GPU
min:
28 fps, P0.1:
43.5 fps, P1:
64.5 fps, max:
159.3 fps
82.8 [X] MSI GE76 Raider 11UH-472US Intel Core i9-11980HK 3.3GHz
GeForce RTX 3080 Laptop GPU
min:
50.8 fps, P0.1:
53.4 fps, P1:
67.5 fps, max:
158.6 fps
~ 80 fps
GeForce RTX 3080 Laptop GPU:
225 [X] Acemagic Tank03 Intel Core i9-12900H 1.8GHz
GeForce RTX 3080 Laptop GPU
min:
18.9 fps, P0.1:
80.4 fps, P1:
102.9 fps, max:
482 fps
fps
100%
NVIDIA GeForce RTX 3070:
330 [X] Desktop-PC Intel Core i9-13900K 3GHz
NVIDIA GeForce RTX 3070
min:
109.8 fps, P0.1:
135.1 fps, P1:
148.7 fps, max:
867 fps
fps
65%
GeForce RTX 3080 Laptop GPU:
213 [X] Acemagic Tank03 Intel Core i9-12900H 1.8GHz
GeForce RTX 3080 Laptop GPU
min:
48.3 fps, P0.1:
72.2 fps, P1:
96.8 fps, max:
648 fps
fps
100%
NVIDIA GeForce RTX 3070:
288 [X] Desktop-PC Intel Core i9-13900K 3GHz
NVIDIA GeForce RTX 3070
min:
65.9 fps, P0.1:
92.7 fps, P1:
141 fps, max:
767 fps
fps
65%
GeForce RTX 3080 Laptop GPU:
186.5 [X] Acemagic Tank03 Intel Core i9-12900H 1.8GHz
GeForce RTX 3080 Laptop GPU
min:
14.5 fps, P0.1:
20.3 fps, P1:
83.7 fps, max:
544 fps
fps
100%
NVIDIA GeForce RTX 3070:
225 [X] Desktop-PC Intel Core i9-13900K 3GHz
NVIDIA GeForce RTX 3070
min:
68.5 fps, P0.1:
78.9 fps, P1:
123.4 fps, max:
719 fps
fps
57%
GeForce RTX 3080 Laptop GPU:
127.6 [X] Acemagic Tank03 Intel Core i9-12900H 1.8GHz
GeForce RTX 3080 Laptop GPU
min:
14.8 fps, P0.1:
26.7 fps, P1:
62 fps, max:
437 fps
fps
100%
NVIDIA GeForce RTX 3070:
166.9 [X] Desktop-PC Intel Core i9-13900K 3GHz
NVIDIA GeForce RTX 3070
min:
75.2 fps, P0.1:
81.7 fps, P1:
114.5 fps, max:
760 fps
fps
63%
GeForce RTX 3080 Laptop GPU:
105.6 [X] Acemagic Tank03 Intel Core i9-12900H 1.8GHz
GeForce RTX 3080 Laptop GPU
min:
14.5 fps, P0.1:
15.9 fps, P1:
50 fps, max:
494 fps
fps
100%
NVIDIA GeForce RTX 3070:
86.2 [X] Desktop-PC Intel Core i9-13900K 3GHz
NVIDIA GeForce RTX 3070
min:
34.7 fps, P0.1:
43.8 fps, P1:
60 fps, max:
321 fps
fps
71%
GeForce RTX 3080 Laptop GPU:
60.9 [X] Acemagic Tank03 Intel Core i9-12900H 1.8GHz
GeForce RTX 3080 Laptop GPU
min:
14.5 fps, P0.1:
16 fps, P1:
24.6 fps, max:
529 fps
fps
GeForce RTX 3080 Laptop GPU:
117.9 [X] Acemagic Tank03 2.02
Intel Core i9-12900H 1.8GHz
GeForce RTX 3080 Laptop GPU
min:
51.9 fps, max:
155 fps
fps
100%
NVIDIA GeForce RTX 3070:
137 [X] Desktop-PC Intel Core i9-13900K 3GHz
NVIDIA GeForce RTX 3070
min:
69 fps
fps
73%
GeForce RTX 3080 Laptop GPU:
99.8 [X] Acemagic Tank03 2.02
Intel Core i9-12900H 1.8GHz
GeForce RTX 3080 Laptop GPU
min:
40.6 fps, max:
137.7 fps
fps
100%
NVIDIA GeForce RTX 3070:
119 [X] Desktop-PC Intel Core i9-13900K 3GHz
NVIDIA GeForce RTX 3070
min:
92 fps
fps
73%
GeForce RTX 3080 Laptop GPU:
86.3 [X] Acemagic Tank03 2.02
Intel Core i9-12900H 1.8GHz
GeForce RTX 3080 Laptop GPU
min:
42.4 fps, max:
118.6 fps
fps
100%
NVIDIA GeForce RTX 3070:
107 [X] Desktop-PC Intel Core i9-13900K 3GHz
NVIDIA GeForce RTX 3070
min:
83 fps
fps
77%
GeForce RTX 3080 Laptop GPU:
74.4 [X] Acemagic Tank03 2.02
Intel Core i9-12900H 1.8GHz
GeForce RTX 3080 Laptop GPU
min:
42.8 fps, max:
110.2 fps
89.8 [X] MSI GE76 Raider 11UH-472US 2.02
Intel Core i9-11980HK 3.3GHz
GeForce RTX 3080 Laptop GPU
min:
39.9 fps, max:
134.1 fps
~ 82 fps
100%
NVIDIA GeForce RTX 3070:
71 [X] Desktop-PC Intel Core i9-13900K 3GHz
NVIDIA GeForce RTX 3070
min:
59 fps
fps
70%
GeForce RTX 3080 Laptop GPU:
45.8 [X] Acemagic Tank03 2.02
Intel Core i9-12900H 1.8GHz
GeForce RTX 3080 Laptop GPU
min:
33.4 fps, max:
96.5 fps
53.5 [X] MSI GE76 Raider 11UH-472US 2.02
Intel Core i9-11980HK 3.3GHz
GeForce RTX 3080 Laptop GPU
min:
39 fps, max:
73.9 fps
~ 50 fps
100%
NVIDIA GeForce RTX 3070:
34.3 [X] Desktop-PC Intel Core i9-13900K 3GHz
NVIDIA GeForce RTX 3070
min:
29 fps
fps
64%
GeForce RTX 3080 Laptop GPU:
20.8 [X] Acemagic Tank03 2.02
Intel Core i9-12900H 1.8GHz
GeForce RTX 3080 Laptop GPU
min:
16.1 fps, max:
30.5 fps
23.6 [X] MSI GE76 Raider 11UH-472US 2.02
Intel Core i9-11980HK 3.3GHz
GeForce RTX 3080 Laptop GPU
min:
18.8 fps, max:
33.6 fps
~ 22 fps
GeForce RTX 3080 Laptop GPU:
173.4 [X] Acemagic Tank03 Intel Core i9-12900H 1.8GHz
GeForce RTX 3080 Laptop GPU
min:
35.5 fps, P0.1:
97.5 fps, P1:
115.9 fps, max:
291 fps
fps
100%
NVIDIA GeForce RTX 3070:
217 [X] Desktop-PC Intel Core i9-13900K 3GHz
NVIDIA GeForce RTX 3070
min:
21.1 fps, P0.1:
114.3 fps, P1:
138.1 fps, max:
435 fps
fps
70%
GeForce RTX 3080 Laptop GPU:
151.1 [X] Acemagic Tank03 Intel Core i9-12900H 1.8GHz
GeForce RTX 3080 Laptop GPU
min:
79.4 fps, P0.1:
86.3 fps, P1:
100.5 fps, max:
267 fps
fps
100%
NVIDIA GeForce RTX 3070:
185.4 [X] Desktop-PC Intel Core i9-13900K 3GHz
NVIDIA GeForce RTX 3070
min:
94.8 fps, P0.1:
104.2 fps, P1:
119.1 fps, max:
380 fps
fps
70%
GeForce RTX 3080 Laptop GPU:
130.6 [X] Acemagic Tank03 Intel Core i9-12900H 1.8GHz
GeForce RTX 3080 Laptop GPU
min:
56.5 fps, P0.1:
74.7 fps, P1:
85.2 fps, max:
252 fps
fps
100%
NVIDIA GeForce RTX 3070:
167 [X] Desktop-PC Intel Core i9-13900K 3GHz
NVIDIA GeForce RTX 3070
min:
83.5 fps, P0.1:
90.5 fps, P1:
105.4 fps, max:
387 fps
fps
71%
GeForce RTX 3080 Laptop GPU:
117.9 [X] Acemagic Tank03 Intel Core i9-12900H 1.8GHz
GeForce RTX 3080 Laptop GPU
min:
62.6 fps, P0.1:
67.5 fps, P1:
75.7 fps, max:
248 fps
fps
100%
NVIDIA GeForce RTX 3070:
112.7 [X] Desktop-PC Intel Core i9-13900K 3GHz
NVIDIA GeForce RTX 3070
min:
53 fps, P0.1:
58.9 fps, P1:
64 fps, max:
352 fps
fps
69%
GeForce RTX 3080 Laptop GPU:
78.3 [X] Acemagic Tank03 Intel Core i9-12900H 1.8GHz
GeForce RTX 3080 Laptop GPU
min:
38.5 fps, P0.1:
40.5 fps, P1:
44.3 fps, max:
216 fps
fps
100%
NVIDIA GeForce RTX 3070:
59.2 [X] Desktop-PC Intel Core i9-13900K 3GHz
NVIDIA GeForce RTX 3070
min:
26.5 fps, P0.1:
27.9 fps, P1:
29.9 fps, max:
312 fps
fps
70%
GeForce RTX 3080 Laptop GPU:
41.3 [X] Acemagic Tank03 Intel Core i9-12900H 1.8GHz
GeForce RTX 3080 Laptop GPU
min:
19 fps, P0.1:
19.5 fps, P1:
20.2 fps, max:
222 fps
fps
GeForce RTX 3080 Laptop GPU:
63.4 [X] Acemagic Tank03 Intel Core i9-12900H 1.8GHz
GeForce RTX 3080 Laptop GPU
min:
31 fps, P0.1:
33.3 fps, P1:
34.9 fps, max:
207 fps
fps
100%
NVIDIA GeForce RTX 3070:
60 [X] Desktop-PC Intel Core i9-13900K 3GHz
NVIDIA GeForce RTX 3070
min:
59 fps
fps
100%
NVIDIA GeForce RTX 3070:
60 [X] Desktop-PC Intel Core i9-13900K 3GHz
NVIDIA GeForce RTX 3070
min:
59 fps
fps
100%
NVIDIA GeForce RTX 3070:
60 [X] Desktop-PC Intel Core i9-13900K 3GHz
NVIDIA GeForce RTX 3070
min:
59 fps
fps
100%
GeForce RTX 3080 Laptop GPU:
60 [X] MSI GE76 Raider 11UH-472US Intel Core i9-11980HK 3.3GHz
GeForce RTX 3080 Laptop GPU
min:
58 fps, max:
60 fps
fps
100%
NVIDIA GeForce RTX 3070:
60 [X] Desktop-PC Intel Core i9-13900K 3GHz
NVIDIA GeForce RTX 3070
min:
59 fps
fps
97%
GeForce RTX 3080 Laptop GPU:
58 [X] MSI GE76 Raider 11UH-472US Intel Core i9-11980HK 3.3GHz
GeForce RTX 3080 Laptop GPU
min:
54 fps, max:
60 fps
fps
100%
NVIDIA GeForce RTX 3070:
46 [X] Desktop-PC Intel Core i9-13900K 3GHz
NVIDIA GeForce RTX 3070
min:
39 fps
fps
78%
GeForce RTX 3080 Laptop GPU:
36 [X] MSI GE76 Raider 11UH-472US Intel Core i9-11980HK 3.3GHz
GeForce RTX 3080 Laptop GPU
min:
24 fps, max:
44 fps
fps
GeForce RTX 3080 Laptop GPU:
75.4 [X] Acemagic Tank03 Intel Core i9-12900H 1.8GHz
GeForce RTX 3080 Laptop GPU
min:
51.2 fps, P0.1:
53.1 fps, P1:
59.8 fps, max:
142.4 fps
fps
100%
NVIDIA GeForce RTX 3070:
87.1 [X] Desktop-PC Intel Core i9-13900K 3GHz
NVIDIA GeForce RTX 3070
min:
69.8 fps, P0.1:
70.4 fps, P1:
73.4 fps, max:
124.4 fps
fps
72%
GeForce RTX 3080 Laptop GPU:
62.6 [X] Acemagic Tank03 Intel Core i9-12900H 1.8GHz
GeForce RTX 3080 Laptop GPU
min:
46.4 fps, P0.1:
47 fps, P1:
50.1 fps, max:
96.7 fps
fps
100%
NVIDIA GeForce RTX 3070:
66.9 [X] Desktop-PC Intel Core i9-13900K 3GHz
NVIDIA GeForce RTX 3070
min:
22.1 fps, P0.1:
36.9 fps, P1:
53.5 fps, max:
263 fps
fps
77%
GeForce RTX 3080 Laptop GPU:
51.7 [X] Acemagic Tank03 Intel Core i9-12900H 1.8GHz
GeForce RTX 3080 Laptop GPU
min:
38.8 fps, P0.1:
39.9 fps, P1:
41.7 fps, max:
78.9 fps
fps
100%
NVIDIA GeForce RTX 3070:
59.5 [X] Desktop-PC Intel Core i9-13900K 3GHz
NVIDIA GeForce RTX 3070
min:
45.5 fps, P0.1:
46 fps, P1:
47.9 fps, max:
75.2 fps
fps
81%
GeForce RTX 3080 Laptop GPU:
46.9 [X] Acemagic Tank03 Intel Core i9-12900H 1.8GHz
GeForce RTX 3080 Laptop GPU
min:
35.2 fps, P0.1:
35.7 fps, P1:
37.6 fps, max:
69.4 fps
48.7 [X] MSI GE76 Raider 11UH-472US Intel Core i9-11980HK 3.3GHz
GeForce RTX 3080 Laptop GPU
min:
35.1 fps, P0.1:
35.5 fps, P1:
38.5 fps, max:
82.5 fps
~ 48 fps
100%
NVIDIA GeForce RTX 3070:
47.9 [X] Desktop-PC Intel Core i9-13900K 3GHz
NVIDIA GeForce RTX 3070
min:
35.1 fps, P0.1:
35.7 fps, P1:
37.5 fps, max:
59.8 fps
fps
81%
GeForce RTX 3080 Laptop GPU:
37.6 [X] Acemagic Tank03 Intel Core i9-12900H 1.8GHz
GeForce RTX 3080 Laptop GPU
min:
28.9 fps, P0.1:
29 fps, P1:
31.5 fps, max:
49.3 fps
40.1 [X] MSI GE76 Raider 11UH-472US Intel Core i9-11980HK 3.3GHz
GeForce RTX 3080 Laptop GPU
min:
27.6 fps, P0.1:
29.2 fps, P1:
31.7 fps, max:
64.1 fps
~ 39 fps
100%
NVIDIA GeForce RTX 3070:
31.6 [X] Desktop-PC Intel Core i9-13900K 3GHz
NVIDIA GeForce RTX 3070
min:
25.2 fps, P0.1:
25.4 fps, P1:
26.1 fps, max:
40.1 fps
fps
79%
GeForce RTX 3080 Laptop GPU:
23.4 [X] Acemagic Tank03 Intel Core i9-12900H 1.8GHz
GeForce RTX 3080 Laptop GPU
min:
19 fps, P0.1:
19.2 fps, P1:
19.7 fps, max:
27.4 fps
26.9 [X] MSI GE76 Raider 11UH-472US Intel Core i9-11980HK 3.3GHz
GeForce RTX 3080 Laptop GPU
min:
21.8 fps, P0.1:
21.9 fps, P1:
22.6 fps, max:
33.7 fps
~ 25 fps
100%
NVIDIA GeForce RTX 3070:
119.9 [X] Desktop-PC Intel Core i9-13900K 3GHz
NVIDIA GeForce RTX 3070
min:
51.4 fps, P0.1:
89.4 fps, P1:
101.9 fps, max:
193.9 fps
fps
100%
NVIDIA GeForce RTX 3070:
119.8 [X] Desktop-PC Intel Core i9-13900K 3GHz
NVIDIA GeForce RTX 3070
min:
88.8 fps, P0.1:
95.9 fps, P1:
103.6 fps, max:
174.3 fps
fps
100%
NVIDIA GeForce RTX 3070:
119.8 [X] Desktop-PC Intel Core i9-13900K 3GHz
NVIDIA GeForce RTX 3070
min:
31 fps, P0.1:
94 fps, P1:
105.6 fps, max:
174.8 fps
fps
86%
GeForce RTX 3080 Laptop GPU:
103.2 [X] MSI GE76 Raider 11UH-472US Intel Core i9-11980HK 3.3GHz
GeForce RTX 3080 Laptop GPU
min:
54.6 fps, P0.1:
67 fps, P1:
75.4 fps, max:
143 fps
fps
100%
NVIDIA GeForce RTX 3070:
98.2 [X] Desktop-PC Intel Core i9-13900K 3GHz
NVIDIA GeForce RTX 3070
min:
63.2 fps, P0.1:
73.2 fps, P1:
82.3 fps, max:
146.9 fps
fps
90%
GeForce RTX 3080 Laptop GPU:
88.8 [X] MSI GE76 Raider 11UH-472US Intel Core i9-11980HK 3.3GHz
GeForce RTX 3080 Laptop GPU
min:
56.5 fps, P0.1:
59.5 fps, P1:
68.5 fps, max:
122.2 fps
fps
100%
NVIDIA GeForce RTX 3070:
58.3 [X] Desktop-PC Intel Core i9-13900K 3GHz
NVIDIA GeForce RTX 3070
min:
33.6 fps, P0.1:
43.6 fps, P1:
47.8 fps, max:
120.4 fps
fps
93%
GeForce RTX 3080 Laptop GPU:
54 [X] MSI GE76 Raider 11UH-472US Intel Core i9-11980HK 3.3GHz
GeForce RTX 3080 Laptop GPU
min:
26.3 fps, P0.1:
40 fps, P1:
44.8 fps, max:
85.9 fps
fps
GeForce RTX 3080 Laptop GPU:
62.7 [X] Acemagic Tank03 Intel Core i9-12900H 1.8GHz
GeForce RTX 3080 Laptop GPU
min:
25.6 fps, P0.1:
31 fps, P1:
42.9 fps, max:
142.5 fps
fps
GeForce RTX 3080 Laptop GPU:
54.3 [X] Acemagic Tank03 Intel Core i9-12900H 1.8GHz
GeForce RTX 3080 Laptop GPU
min:
25.9 fps, P0.1:
27 fps, P1:
37.1 fps, max:
126 fps
fps
GeForce RTX 3080 Laptop GPU:
48.3 [X] Acemagic Tank03 Intel Core i9-12900H 1.8GHz
GeForce RTX 3080 Laptop GPU
min:
23.6 fps, P0.1:
26.5 fps, P1:
34.8 fps, max:
111.7 fps
fps
GeForce RTX 3080 Laptop GPU:
33.6 [X] Acemagic Tank03 Intel Core i9-12900H 1.8GHz
GeForce RTX 3080 Laptop GPU
min:
21.5 fps, P0.1:
22.2 fps, P1:
24.9 fps, max:
70.3 fps
fps
GeForce RTX 3080 Laptop GPU:
17.9 [X] Acemagic Tank03 Intel Core i9-12900H 1.8GHz
GeForce RTX 3080 Laptop GPU
min:
12.4 fps, P0.1:
12.6 fps, P1:
13.9 fps, max:
25.9 fps
fps
GeForce RTX 3080 Laptop GPU:
135.3 [X] Acemagic Tank03 Intel Core i9-12900H 1.8GHz
GeForce RTX 3080 Laptop GPU
min:
40.2 fps, P0.1:
89.7 fps, P1:
99.3 fps, max:
194 fps
fps
100%
NVIDIA GeForce RTX 3070:
190.1 [X] Desktop-PC Intel Core i9-13900K 3GHz
NVIDIA GeForce RTX 3070
min:
106 fps, P0.1:
137.5 fps, P1:
151.1 fps, max:
288 fps
fps
67%
GeForce RTX 3080 Laptop GPU:
126.7 [X] Acemagic Tank03 Intel Core i9-12900H 1.8GHz
GeForce RTX 3080 Laptop GPU
min:
38.4 fps, P0.1:
71.4 fps, P1:
90.7 fps, max:
191 fps
fps
100%
NVIDIA GeForce RTX 3070:
171.9 [X] Desktop-PC Intel Core i9-13900K 3GHz
NVIDIA GeForce RTX 3070
min:
105.8 fps, P0.1:
132 fps, P1:
139 fps, max:
248 fps
fps
68%
GeForce RTX 3080 Laptop GPU:
116.9 [X] Acemagic Tank03 Intel Core i9-12900H 1.8GHz
GeForce RTX 3080 Laptop GPU
min:
65 fps, P0.1:
77.3 fps, P1:
84.6 fps, max:
176.9 fps
fps
100%
NVIDIA GeForce RTX 3070:
145 [X] Desktop-PC Intel Core i9-13900K 3GHz
NVIDIA GeForce RTX 3070
min:
91.2 fps, P0.1:
110.7 fps, P1:
119 fps, max:
217 fps
fps
67%
GeForce RTX 3080 Laptop GPU:
97 [X] Acemagic Tank03 Intel Core i9-12900H 1.8GHz
GeForce RTX 3080 Laptop GPU
min:
61.8 fps, P0.1:
66.8 fps, P1:
72.6 fps, max:
162.4 fps
fps
100%
NVIDIA GeForce RTX 3070:
101.9 [X] Desktop-PC Intel Core i9-13900K 3GHz
NVIDIA GeForce RTX 3070
min:
82.1 fps, P0.1:
83.3 fps, P1:
86.4 fps, max:
127.8 fps
fps
66%
GeForce RTX 3080 Laptop GPU:
67.4 [X] Acemagic Tank03 Intel Core i9-12900H 1.8GHz
GeForce RTX 3080 Laptop GPU
min:
45.7 fps, P0.1:
47.4 fps, P1:
51.3 fps, max:
98.3 fps
fps
100%
NVIDIA GeForce RTX 3070:
58.3 [X] Desktop-PC Intel Core i9-13900K 3GHz
NVIDIA GeForce RTX 3070
min:
46 fps, P0.1:
46.2 fps, P1:
50.1 fps, max:
71.3 fps
fps
68%
GeForce RTX 3080 Laptop GPU:
39.5 [X] Acemagic Tank03 Intel Core i9-12900H 1.8GHz
GeForce RTX 3080 Laptop GPU
min:
25.6 fps, P0.1:
26.6 fps, P1:
29.1 fps, max:
56 fps
fps
GeForce RTX 3080 Laptop GPU:
121 [X] Acemagic Tank03 Intel Core i9-12900H 1.8GHz
GeForce RTX 3080 Laptop GPU
min:
39.1 fps, P0.1:
43.8 fps, P1:
95.4 fps, max:
219 fps
fps
100%
NVIDIA GeForce RTX 3070:
145.6 [X] Desktop-PC Intel Core i9-13900K 3GHz
NVIDIA GeForce RTX 3070
min:
82.9 fps, P0.1:
121.4 fps, P1:
130.4 fps, max:
249 fps
fps
71%
GeForce RTX 3080 Laptop GPU:
102.9 [X] Acemagic Tank03 Intel Core i9-12900H 1.8GHz
GeForce RTX 3080 Laptop GPU
min:
40.2 fps, P0.1:
46.9 fps, P1:
81.5 fps, max:
192.2 fps
fps
100%
NVIDIA GeForce RTX 3070:
121.6 [X] Desktop-PC Intel Core i9-13900K 3GHz
NVIDIA GeForce RTX 3070
min:
71.8 fps, P0.1:
105.9 fps, P1:
109.2 fps, max:
193.3 fps
fps
74%
GeForce RTX 3080 Laptop GPU:
90.2 [X] Acemagic Tank03 Intel Core i9-12900H 1.8GHz
GeForce RTX 3080 Laptop GPU
min:
36.3 fps, P0.1:
42.7 fps, P1:
74.5 fps, max:
212 fps
fps
100%
NVIDIA GeForce RTX 3070:
120.8 [X] Desktop-PC Intel Core i9-13900K 3GHz
NVIDIA GeForce RTX 3070
min:
68.1 fps, P0.1:
105.2 fps, P1:
108.9 fps, max:
172.4 fps
fps
76%
GeForce RTX 3080 Laptop GPU:
88.4 [X] Acemagic Tank03 Intel Core i9-12900H 1.8GHz
GeForce RTX 3080 Laptop GPU
min:
32.2 fps, P0.1:
37.2 fps, P1:
70.6 fps, max:
183.1 fps
95.1 [X] MSI GE76 Raider 11UH-472US Intel Core i9-11980HK 3.3GHz
GeForce RTX 3080 Laptop GPU
min:
32.1 fps, P0.1:
35 fps, P1:
78.2 fps, max:
208 fps
~ 92 fps
100%
NVIDIA GeForce RTX 3070:
82.3 [X] Desktop-PC Intel Core i9-13900K 3GHz
NVIDIA GeForce RTX 3070
min:
71.5 fps, P0.1:
72.4 fps, P1:
73.9 fps, max:
98.6 fps
fps
77%
GeForce RTX 3080 Laptop GPU:
59.7 [X] Acemagic Tank03 Intel Core i9-12900H 1.8GHz
GeForce RTX 3080 Laptop GPU
min:
26.2 fps, P0.1:
31.4 fps, P1:
46.7 fps, max:
159.2 fps
66 [X] MSI GE76 Raider 11UH-472US Intel Core i9-11980HK 3.3GHz
GeForce RTX 3080 Laptop GPU
min:
28.6 fps, P0.1:
39.4 fps, P1:
55 fps, max:
251 fps
~ 63 fps
100%
NVIDIA GeForce RTX 3070:
44.6 [X] Desktop-PC Intel Core i9-13900K 3GHz
NVIDIA GeForce RTX 3070
min:
39.1 fps, P0.1:
39.4 fps, P1:
40.1 fps, max:
51.4 fps
fps
76%
GeForce RTX 3080 Laptop GPU:
32 [X] Acemagic Tank03 Intel Core i9-12900H 1.8GHz
GeForce RTX 3080 Laptop GPU
min:
25.4 fps, P0.1:
26.5 fps, P1:
27.6 fps, max:
45.4 fps
35.8 [X] MSI GE76 Raider 11UH-472US Intel Core i9-11980HK 3.3GHz
GeForce RTX 3080 Laptop GPU
min:
19.3 fps, P0.1:
23.9 fps, P1:
29.4 fps, max:
120.3 fps
~ 34 fps
GeForce RTX 3080 Laptop GPU:
52.2 [X] Acemagic Tank03 Intel Core i9-12900H 1.8GHz
GeForce RTX 3080 Laptop GPU
min:
29 fps, P0.1:
33.6 fps, P1:
44.7 fps, max:
158.1 fps
58.9 [X] MSI GE76 Raider 11UH-472US Intel Core i9-11980HK 3.3GHz
GeForce RTX 3080 Laptop GPU
min:
24.5 fps, P0.1:
28.2 fps, P1:
39.3 fps, max:
226 fps
~ 56 fps
GeForce RTX 3080 Laptop GPU:
113.8 [X] Acemagic Tank03 Intel Core i9-12900H 1.8GHz
GeForce RTX 3080 Laptop GPU
min:
83 fps, P0.1:
87.1 fps, P1:
93.3 fps, max:
143 fps
fps
100%
NVIDIA GeForce RTX 3070:
110.7 [X] Desktop-PC Intel Core i9-13900K 3GHz
NVIDIA GeForce RTX 3070
min:
84.5 fps, P0.1:
88.7 fps, P1:
91 fps, max:
151.6 fps
fps
91%
GeForce RTX 3080 Laptop GPU:
100.6 [X] Acemagic Tank03 Intel Core i9-12900H 1.8GHz
GeForce RTX 3080 Laptop GPU
min:
72.4 fps, P0.1:
80.1 fps, P1:
82.6 fps, max:
126.2 fps
fps
100%
NVIDIA GeForce RTX 3070:
87.2 [X] Desktop-PC Intel Core i9-13900K 3GHz
NVIDIA GeForce RTX 3070
min:
55 fps, P0.1:
55.9 fps, P1:
57.7 fps, max:
132.5 fps
fps
94%
GeForce RTX 3080 Laptop GPU:
81.6 [X] Acemagic Tank03 Intel Core i9-12900H 1.8GHz
GeForce RTX 3080 Laptop GPU
min:
38.9 fps, P0.1:
46.9 fps, P1:
55.6 fps, max:
115.1 fps
fps
100%
NVIDIA GeForce RTX 3070:
78.8 [X] Desktop-PC Intel Core i9-13900K 3GHz
NVIDIA GeForce RTX 3070
min:
44.6 fps, P0.1:
49.9 fps, P1:
53.3 fps, max:
109.9 fps
fps
92%
GeForce RTX 3080 Laptop GPU:
72.3 [X] Acemagic Tank03 Intel Core i9-12900H 1.8GHz
GeForce RTX 3080 Laptop GPU
min:
35.4 fps, P0.1:
37.2 fps, P1:
46.3 fps, max:
104 fps
fps
100%
NVIDIA GeForce RTX 3070:
64.5 [X] Desktop-PC Intel Core i9-13900K 3GHz
NVIDIA GeForce RTX 3070
min:
41.3 fps, P0.1:
42.2 fps, P1:
43.9 fps, max:
93.6 fps
fps
102%
GeForce RTX 3080 Laptop GPU:
65.9 [X] Acemagic Tank03 Intel Core i9-12900H 1.8GHz
GeForce RTX 3080 Laptop GPU
min:
36.5 fps, P0.1:
38.2 fps, P1:
44.5 fps, max:
95.2 fps
fps
100%
NVIDIA GeForce RTX 3070:
41.7 [X] Desktop-PC Intel Core i9-13900K 3GHz
NVIDIA GeForce RTX 3070
min:
15.5 fps, P0.1:
15.5 fps, P1:
29.4 fps, max:
65.2 fps
fps
149%
GeForce RTX 3080 Laptop GPU:
62.3 [X] Acemagic Tank03 Intel Core i9-12900H 1.8GHz
GeForce RTX 3080 Laptop GPU
min:
22.5 fps, P0.1:
26.1 fps, P1:
41.4 fps, max:
93.3 fps
fps
GeForce RTX 3080 Laptop GPU:
240 [X] Acemagic Tank03 1050579
Intel Core i9-12900H 1.8GHz
GeForce RTX 3080 Laptop GPU
min:
208 fps, P1:
166 fps, max:
264 fps
270 [X] MSI GE76 Raider 11UH-472US 1006145
Intel Core i9-11980HK 3.3GHz
GeForce RTX 3080 Laptop GPU
min:
191 fps, P1:
169 fps, max:
313 fps
~ 255 fps
100%
NVIDIA GeForce RTX 3070:
366 [X] Desktop-PC Intel Core i9-13900K 3GHz
NVIDIA GeForce RTX 3070
min:
324 fps
fps
71%
GeForce RTX 3080 Laptop GPU:
243 [X] Acemagic Tank03 1050579
Intel Core i9-12900H 1.8GHz
GeForce RTX 3080 Laptop GPU
min:
207 fps, P1:
172 fps, max:
266 fps
276 [X] MSI GE76 Raider 11UH-472US 1006145
Intel Core i9-11980HK 3.3GHz
GeForce RTX 3080 Laptop GPU
min:
187 fps, P1:
176 fps, max:
311 fps
~ 260 fps
100%
NVIDIA GeForce RTX 3070:
261 [X] Desktop-PC Intel Core i9-13900K 3GHz
NVIDIA GeForce RTX 3070
min:
232 fps
fps
77%
GeForce RTX 3080 Laptop GPU:
184.4 [X] Acemagic Tank03 1050579
Intel Core i9-12900H 1.8GHz
GeForce RTX 3080 Laptop GPU
min:
162 fps, P1:
137 fps, max:
206 fps
219 [X] MSI GE76 Raider 11UH-472US 1006145
Intel Core i9-11980HK 3.3GHz
GeForce RTX 3080 Laptop GPU
min:
178 fps, P1:
157 fps, max:
243 fps
~ 202 fps
100%
NVIDIA GeForce RTX 3070:
83 [X] Desktop-PC Intel Core i9-13900K 3GHz
NVIDIA GeForce RTX 3070
min:
66 fps
fps
80%
GeForce RTX 3080 Laptop GPU:
59.9 [X] Acemagic Tank03 1050579
Intel Core i9-12900H 1.8GHz
GeForce RTX 3080 Laptop GPU
min:
48 fps, P1:
47 fps, max:
69 fps
72.3 [X] MSI GE76 Raider 11UH-472US 1006145
Intel Core i9-11980HK 3.3GHz
GeForce RTX 3080 Laptop GPU
min:
57 fps, P1:
57 fps, max:
87 fps
~ 66 fps
100%
NVIDIA GeForce RTX 3070:
53 [X] Desktop-PC Intel Core i9-13900K 3GHz
NVIDIA GeForce RTX 3070
min:
41 fps
fps
72%
GeForce RTX 3080 Laptop GPU:
37.9 [X] MSI GE76 Raider 11UH-472US 1006145
Intel Core i9-11980HK 3.3GHz
GeForce RTX 3080 Laptop GPU
min:
31 fps, P1:
29 fps, max:
43 fps
38.6 [X] Acemagic Tank03 1050579
Intel Core i9-12900H 1.8GHz
GeForce RTX 3080 Laptop GPU
min:
30 fps, P1:
29 fps, max:
45 fps
~ 38 fps
100%
NVIDIA GeForce RTX 3070:
25 [X] Desktop-PC Intel Core i9-13900K 3GHz
NVIDIA GeForce RTX 3070
min:
19 fps
fps
84%
GeForce RTX 3080 Laptop GPU:
18.6 [X] Acemagic Tank03 1050579
Intel Core i9-12900H 1.8GHz
GeForce RTX 3080 Laptop GPU
min:
14 fps, P1:
14 fps, max:
21 fps
23.8 [X] MSI GE76 Raider 11UH-472US 1006145
Intel Core i9-11980HK 3.3GHz
GeForce RTX 3080 Laptop GPU
min:
18 fps, P1:
18 fps, max:
28 fps
~ 21 fps
GeForce RTX 3080 Laptop GPU:
33 [X] Acemagic Tank03 1050579
Intel Core i9-12900H 1.8GHz
GeForce RTX 3080 Laptop GPU
min:
25 fps, P1:
25 fps, max:
38 fps
fps
GeForce RTX 3080 Laptop GPU:
223 [X] Acemagic Tank03 Intel Core i9-12900H 1.8GHz
GeForce RTX 3080 Laptop GPU
min:
71.5 fps, P0.1:
129.1 fps, P1:
163 fps, max:
310 fps
fps
GeForce RTX 3080 Laptop GPU:
203 [X] Acemagic Tank03 Intel Core i9-12900H 1.8GHz
GeForce RTX 3080 Laptop GPU
min:
59.8 fps, P0.1:
114.1 fps, P1:
143.7 fps, max:
298 fps
fps
GeForce RTX 3080 Laptop GPU:
186.8 [X] Acemagic Tank03 Intel Core i9-12900H 1.8GHz
GeForce RTX 3080 Laptop GPU
min:
64 fps, P0.1:
105.4 fps, P1:
127.1 fps, max:
322 fps
fps
GeForce RTX 3080 Laptop GPU:
158.1 [X] Acemagic Tank03 Intel Core i9-12900H 1.8GHz
GeForce RTX 3080 Laptop GPU
min:
55.5 fps, P0.1:
86.7 fps, P1:
109 fps, max:
320 fps
184.6 ~ 171 fps
GeForce RTX 3080 Laptop GPU:
105.5 [X] Acemagic Tank03 Intel Core i9-12900H 1.8GHz
GeForce RTX 3080 Laptop GPU
min:
48.8 fps, P0.1:
63.3 fps, P1:
79.3 fps, max:
334 fps
124 ~ 115 fps
GeForce RTX 3080 Laptop GPU:
56.5 [X] Acemagic Tank03 Intel Core i9-12900H 1.8GHz
GeForce RTX 3080 Laptop GPU
min:
35.2 fps, P0.1:
41.7 fps, P1:
45.2 fps, max:
96.2 fps
65.5 ~ 61 fps
GeForce RTX 3080 Laptop GPU:
83.5 [X] Acemagic Tank03 Intel Core i9-12900H 1.8GHz
GeForce RTX 3080 Laptop GPU
min:
29.2 fps, P0.1:
40.2 fps, P1:
58.7 fps, max:
144.4 fps
fps
GeForce RTX 3080 Laptop GPU:
73 [X] Acemagic Tank03 Intel Core i9-12900H 1.8GHz
GeForce RTX 3080 Laptop GPU
min:
29 fps, P0.1:
34.2 fps, P1:
53.1 fps, max:
127.4 fps
fps
GeForce RTX 3080 Laptop GPU:
68.1 [X] Acemagic Tank03 Intel Core i9-12900H 1.8GHz
GeForce RTX 3080 Laptop GPU
min:
33 fps, P0.1:
35.5 fps, P1:
48.2 fps, max:
128.4 fps
fps
GeForce RTX 3080 Laptop GPU:
65.3 [X] Acemagic Tank03 Intel Core i9-12900H 1.8GHz
GeForce RTX 3080 Laptop GPU
min:
23.2 fps, P0.1:
29.9 fps, P1:
45.5 fps, max:
134.9 fps
69.4 [X] MSI GE76 Raider 11UH-472US Intel Core i9-11980HK 3.3GHz
GeForce RTX 3080 Laptop GPU
min:
28.9 fps, P0.1:
39.6 fps, P1:
52.2 fps, max:
113.9 fps
~ 67 fps
GeForce RTX 3080 Laptop GPU:
45.1 [X] MSI GE76 Raider 11UH-472US Intel Core i9-11980HK 3.3GHz
GeForce RTX 3080 Laptop GPU
min:
25.1 fps, P0.1:
30.8 fps, P1:
34.4 fps, max:
113.6 fps
fps
GeForce RTX 3080 Laptop GPU:
23.2 [X] MSI GE76 Raider 11UH-472US Intel Core i9-11980HK 3.3GHz
GeForce RTX 3080 Laptop GPU
min:
17.7 fps, P0.1:
17.9 fps, P1:
18.6 fps, max:
33.5 fps
fps
GeForce RTX 3080 Laptop GPU:
187 [X] Acemagic Tank03 Intel Core i9-12900H 1.8GHz
GeForce RTX 3080 Laptop GPU
min:
27.1 fps, P0.1:
114.6 fps, P1:
141.7 fps, max:
260 fps
fps
GeForce RTX 3080 Laptop GPU:
178.4 [X] Acemagic Tank03 Intel Core i9-12900H 1.8GHz
GeForce RTX 3080 Laptop GPU
min:
21.6 fps, P0.1:
93.7 fps, P1:
129 fps, max:
251 fps
fps
GeForce RTX 3080 Laptop GPU:
158.2 [X] Acemagic Tank03 Intel Core i9-12900H 1.8GHz
GeForce RTX 3080 Laptop GPU
min:
63.9 fps, P0.1:
83.9 fps, P1:
118.5 fps, max:
230 fps
fps
GeForce RTX 3080 Laptop GPU:
123.3 [X] Acemagic Tank03 Intel Core i9-12900H 1.8GHz
GeForce RTX 3080 Laptop GPU
min:
17.3 fps, P0.1:
21.3 fps, P1:
93.3 fps, max:
221 fps
fps
GeForce RTX 3080 Laptop GPU:
85.7 [X] Acemagic Tank03 Intel Core i9-12900H 1.8GHz
GeForce RTX 3080 Laptop GPU
min:
50.3 fps, P0.1:
54.9 fps, P1:
61.4 fps, max:
230 fps
fps
GeForce RTX 3080 Laptop GPU:
43.8 [X] Acemagic Tank03 Intel Core i9-12900H 1.8GHz
GeForce RTX 3080 Laptop GPU
min:
21.6 fps, P0.1:
23 fps, P1:
25.2 fps, max:
182.6 fps
fps
100%
NVIDIA GeForce RTX 3070:
126.7 [X] Desktop-PC Intel Core i9-12900K 3.2GHz
NVIDIA GeForce RTX 3070
min:
57.3 fps, P0.1:
70.1 fps, P1:
91.6 fps, max:
182.6 fps
fps
78%
GeForce RTX 3080 Laptop GPU:
99.4 [X] Acemagic Tank03 Intel Core i9-12900H 1.8GHz
GeForce RTX 3080 Laptop GPU
min:
21.9 fps, P0.1:
50.5 fps, P1:
70.1 fps, max:
152.5 fps
fps
100%
NVIDIA GeForce RTX 3070:
107.2 [X] Desktop-PC Intel Core i9-12900K 3.2GHz
NVIDIA GeForce RTX 3070
min:
58 fps, P0.1:
67.5 fps, P1:
84.7 fps, max:
150.8 fps
fps
77%
GeForce RTX 3080 Laptop GPU:
82.8 [X] Acemagic Tank03 Intel Core i9-12900H 1.8GHz
GeForce RTX 3080 Laptop GPU
min:
42.1 fps, P0.1:
48.4 fps, P1:
60.6 fps, max:
116.8 fps
fps
100%
NVIDIA GeForce RTX 3070:
97.5 [X] Desktop-PC Intel Core i9-12900K 3.2GHz
NVIDIA GeForce RTX 3070
min:
52.9 fps, P0.1:
71.2 fps, P1:
81.7 fps, max:
136.6 fps
fps
78%
GeForce RTX 3080 Laptop GPU:
75.6 [X] Acemagic Tank03 Intel Core i9-12900H 1.8GHz
GeForce RTX 3080 Laptop GPU
min:
46.4 fps, P0.1:
50.1 fps, P1:
58 fps, max:
107 fps
fps
100%
NVIDIA GeForce RTX 3070:
79.1 [X] Desktop-PC Intel Core i9-12900K 3.2GHz
NVIDIA GeForce RTX 3070
min:
8.14 fps, P0.1:
20.6 fps, P1:
60.2 fps, max:
120.7 fps
fps
82%
GeForce RTX 3080 Laptop GPU:
64.8 [X] Acemagic Tank03 Intel Core i9-12900H 1.8GHz
GeForce RTX 3080 Laptop GPU
min:
38.2 fps, P0.1:
47.5 fps, P1:
53 fps, max:
89.1 fps
fps
100%
NVIDIA GeForce RTX 3070:
48.8 [X] Desktop-PC Intel Core i9-12900K 3.2GHz
NVIDIA GeForce RTX 3070
min:
14.5 fps, P0.1:
18.5 fps, P1:
33.1 fps, max:
78.4 fps
fps
89%
GeForce RTX 3080 Laptop GPU:
43.4 [X] Acemagic Tank03 Intel Core i9-12900H 1.8GHz
GeForce RTX 3080 Laptop GPU
min:
27.5 fps, P0.1:
29.8 fps, P1:
34.9 fps, max:
59 fps
fps
100%
NVIDIA GeForce RTX 3070:
21.6 [X] Desktop-PC Intel Core i9-12900K 3.2GHz
NVIDIA GeForce RTX 3070
min:
3.55 fps, P0.1:
3.78 fps, P1:
6.25 fps, max:
36.1 fps
fps
97%
GeForce RTX 3080 Laptop GPU:
20.9 [X] Acemagic Tank03 Intel Core i9-12900H 1.8GHz
GeForce RTX 3080 Laptop GPU
min:
12.7 fps, P0.1:
14 fps, P1:
16.6 fps, max:
66 fps
fps
100%
NVIDIA GeForce RTX 3070:
37.9 [X] Desktop-PC Intel Core i9-12900K 3.2GHz
NVIDIA GeForce RTX 3070
min:
12.2 fps, P0.1:
13.9 fps, P1:
25.2 fps, max:
63.4 fps
fps
89%
GeForce RTX 3080 Laptop GPU:
33.7 [X] Acemagic Tank03 Intel Core i9-12900H 1.8GHz
GeForce RTX 3080 Laptop GPU
min:
20.2 fps, P0.1:
22.4 fps, P1:
25.1 fps, max:
185 fps
fps
100%
NVIDIA GeForce RTX 3070:
197.8 [X] Desktop-PC Intel Core i9-12900K 3.2GHz
NVIDIA GeForce RTX 3070
min:
35.6 fps, P0.1:
120.2 fps, P1:
170.5 fps, max:
265 fps
fps
71%
GeForce RTX 3080 Laptop GPU:
139.6 [X] Acemagic Tank03 Intel Core i9-12900H 1.8GHz
GeForce RTX 3080 Laptop GPU
min:
19.2 fps, P0.1:
82 fps, P1:
117.7 fps, max:
202 fps
fps
100%
NVIDIA GeForce RTX 3070:
138.9 [X] Desktop-PC Intel Core i9-12900K 3.2GHz
NVIDIA GeForce RTX 3070
min:
36.1 fps, P0.1:
95.6 fps, P1:
118 fps, max:
197 fps
fps
75%
GeForce RTX 3080 Laptop GPU:
103.7 [X] Acemagic Tank03 Intel Core i9-12900H 1.8GHz
GeForce RTX 3080 Laptop GPU
min:
22.1 fps, P0.1:
71 fps, P1:
86.9 fps, max:
151.2 fps
fps
100%
NVIDIA GeForce RTX 3070:
129.4 [X] Desktop-PC Intel Core i9-12900K 3.2GHz
NVIDIA GeForce RTX 3070
min:
40.7 fps, P0.1:
82.1 fps, P1:
109.6 fps, max:
187.9 fps
fps
73%
GeForce RTX 3080 Laptop GPU:
94.4 [X] Acemagic Tank03 Intel Core i9-12900H 1.8GHz
GeForce RTX 3080 Laptop GPU
min:
20.1 fps, P0.1:
70.4 fps, P1:
78.9 fps, max:
141.2 fps
fps
100%
NVIDIA GeForce RTX 3070:
95 [X] Desktop-PC Intel Core i9-12900K 3.2GHz
NVIDIA GeForce RTX 3070
min:
33.5 fps, P0.1:
50.2 fps, P1:
70.5 fps, max:
117.7 fps
fps
78%
GeForce RTX 3080 Laptop GPU:
70.8 [X] Acemagic Tank03 Intel Core i9-12900H 1.8GHz
GeForce RTX 3080 Laptop GPU
min:
22.6 fps, P0.1:
31.6 fps, P1:
53.6 fps, max:
94.6 fps
76.2 [X] MSI GE76 Raider 11UH-472US Intel Core i9-11980HK 3.3GHz
GeForce RTX 3080 Laptop GPU
min:
25.8 fps, P0.1:
37.8 fps, P1:
55.3 fps, max:
96.7 fps
~ 74 fps
100%
NVIDIA GeForce RTX 3070:
71.4 [X] Desktop-PC Intel Core i9-12900K 3.2GHz
NVIDIA GeForce RTX 3070
min:
21.5 fps, P0.1:
43 fps, P1:
55.1 fps, max:
89.6 fps
fps
77%
GeForce RTX 3080 Laptop GPU:
52.6 [X] Acemagic Tank03 Intel Core i9-12900H 1.8GHz
GeForce RTX 3080 Laptop GPU
min:
22.9 fps, P0.1:
34.3 fps, P1:
41.2 fps, max:
81.6 fps
57.3 [X] MSI GE76 Raider 11UH-472US Intel Core i9-11980HK 3.3GHz
GeForce RTX 3080 Laptop GPU
min:
27.9 fps, P0.1:
35.1 fps, P1:
45.8 fps, max:
70.2 fps
~ 55 fps
GeForce RTX 3080 Laptop GPU:
30.9 [X] Acemagic Tank03 Intel Core i9-12900H 1.8GHz
GeForce RTX 3080 Laptop GPU
min:
22.8 fps, P0.1:
24.2 fps, P1:
25.5 fps, max:
45 fps
33.5 [X] MSI GE76 Raider 11UH-472US Intel Core i9-11980HK 3.3GHz
GeForce RTX 3080 Laptop GPU
min:
3.02 fps, P0.1:
4.83 fps, P1:
28.3 fps, max:
67.9 fps
~ 32 fps
NVIDIA GeForce RTX 3050:
146.5 [X] PNY GeForce RTX 3050 XLR8 AMD Ryzen 9 7950X 4.5GHz
NVIDIA GeForce RTX 3050
fps
GeForce RTX 3080 Laptop GPU:
161.6 [X] Acemagic Tank03 Intel Core i9-12900H 1.8GHz
GeForce RTX 3080 Laptop GPU
P0.1:
57 fpsP1:
87 fps
fps
100%
NVIDIA GeForce RTX 3070:
234 [X] Desktop-PC Intel Core i9-12900K 3.2GHz
NVIDIA GeForce RTX 3070
min:
62 fps
fps
53%
NVIDIA GeForce RTX 3050:
124.5 [X] PNY GeForce RTX 3050 XLR8 AMD Ryzen 9 7950X 4.5GHz
NVIDIA GeForce RTX 3050
fps
62%
GeForce RTX 3080 Laptop GPU:
145 [X] Acemagic Tank03 Intel Core i9-12900H 1.8GHz
GeForce RTX 3080 Laptop GPU
P0.1:
49 fpsP1:
79 fps
fps
100%
NVIDIA GeForce RTX 3070:
181 [X] Desktop-PC Intel Core i9-12900K 3.2GHz
NVIDIA GeForce RTX 3070
min:
75 fps
fps
50%
NVIDIA GeForce RTX 3050:
90.2 [X] PNY GeForce RTX 3050 XLR8 AMD Ryzen 9 7950X 4.5GHz
NVIDIA GeForce RTX 3050
fps
63%
GeForce RTX 3080 Laptop GPU:
114.4 [X] Acemagic Tank03 Intel Core i9-12900H 1.8GHz
GeForce RTX 3080 Laptop GPU
P0.1:
44 fpsP1:
71 fps
fps
100%
NVIDIA GeForce RTX 3070:
179 [X] Desktop-PC Intel Core i9-12900K 3.2GHz
NVIDIA GeForce RTX 3070
min:
69 fps
fps
50%
NVIDIA GeForce RTX 3050:
89.9 [X] PNY GeForce RTX 3050 XLR8 AMD Ryzen 9 7950X 4.5GHz
NVIDIA GeForce RTX 3050
fps
71%
GeForce RTX 3080 Laptop GPU:
113.6 [X] Acemagic Tank03 Intel Core i9-12900H 1.8GHz
GeForce RTX 3080 Laptop GPU
P0.1:
44 fpsP1:
71 fps
141 [X] MSI GE76 Raider 11UH-472US Intel Core i9-11980HK 3.3GHz
GeForce RTX 3080 Laptop GPU
P0.1:
45 fpsP1:
72 fps
~ 127 fps
100%
NVIDIA GeForce RTX 3070:
135 [X] Desktop-PC Intel Core i9-12900K 3.2GHz
NVIDIA GeForce RTX 3070
min:
69 fps
fps
48%
NVIDIA GeForce RTX 3050:
64.9 [X] PNY GeForce RTX 3050 XLR8 AMD Ryzen 9 7950X 4.5GHz
NVIDIA GeForce RTX 3050
fps
70%
GeForce RTX 3080 Laptop GPU:
85.7 [X] Acemagic Tank03 Intel Core i9-12900H 1.8GHz
GeForce RTX 3080 Laptop GPU
P0.1:
45 fpsP1:
56 fps
105 [X] MSI GE76 Raider 11UH-472US Intel Core i9-11980HK 3.3GHz
GeForce RTX 3080 Laptop GPU
P0.1:
41 fpsP1:
54 fps
~ 95 fps
100%
NVIDIA GeForce RTX 3070:
76.9 [X] Desktop-PC Intel Core i9-12900K 3.2GHz
NVIDIA GeForce RTX 3070
min:
41 fps
fps
48%
NVIDIA GeForce RTX 3050:
36.7 [X] PNY GeForce RTX 3050 XLR8 AMD Ryzen 9 7950X 4.5GHz
NVIDIA GeForce RTX 3050
fps
74%
GeForce RTX 3080 Laptop GPU:
50.6 [X] Acemagic Tank03 Intel Core i9-12900H 1.8GHz
GeForce RTX 3080 Laptop GPU
P0.1:
28 fpsP1:
33 fps
63.7 [X] MSI GE76 Raider 11UH-472US Intel Core i9-11980HK 3.3GHz
GeForce RTX 3080 Laptop GPU
P0.1:
15 fpsP1:
32.8 fps
~ 57 fps
100%
NVIDIA GeForce RTX 3070:
114.7 [X] Desktop-PC Intel Core i9-12900K 3.2GHz
NVIDIA GeForce RTX 3070
min:
47 fps, P0.1:
57.8 fps, P1:
85.7 fps, max:
158.1 fps
fps
71%
GeForce RTX 3080 Laptop GPU:
81.9 [X] Acemagic Tank03 Intel Core i9-12900H 1.8GHz
GeForce RTX 3080 Laptop GPU
min:
4.42 fps, P0.1:
25.8 fps, P1:
62.2 fps, max:
149.1 fps
fps
100%
NVIDIA GeForce RTX 3070:
104.4 [X] Desktop-PC Intel Core i9-12900K 3.2GHz
NVIDIA GeForce RTX 3070
min:
51.6 fps, P0.1:
63.1 fps, P1:
75.9 fps, max:
169.8 fps
fps
58%
NVIDIA GeForce RTX 3050:
60.2 [X] PNY GeForce RTX 3050 XLR8 AMD Ryzen 9 7950X 4.5GHz
NVIDIA GeForce RTX 3050
min:
45.9 fps, P0.1:
47.6 fps, P1:
48.9 fps, max:
85.7 fps
fps
77%
GeForce RTX 3080 Laptop GPU:
80.5 [X] Acemagic Tank03 Intel Core i9-12900H 1.8GHz
GeForce RTX 3080 Laptop GPU
min:
42.8 fps, P0.1:
57.1 fps, P1:
64.9 fps, max:
124.4 fps
fps
100%
NVIDIA GeForce RTX 3070:
103.3 [X] Desktop-PC Intel Core i9-12900K 3.2GHz
NVIDIA GeForce RTX 3070
min:
47 fps, P0.1:
69.7 fps, P1:
76.1 fps, max:
144.8 fps
fps
54%
NVIDIA GeForce RTX 3050:
56.2 [X] PNY GeForce RTX 3050 XLR8 AMD Ryzen 9 7950X 4.5GHz
NVIDIA GeForce RTX 3050
min:
34.7 fps, P0.1:
38.8 fps, P1:
43.6 fps, max:
84.3 fps
fps
74%
GeForce RTX 3080 Laptop GPU:
76.7 [X] Acemagic Tank03 Intel Core i9-12900H 1.8GHz
GeForce RTX 3080 Laptop GPU
min:
45.3 fps, P0.1:
46.3 fps, P1:
59.7 fps, max:
117 fps
fps
100%
NVIDIA GeForce RTX 3070:
102 [X] Desktop-PC Intel Core i9-12900K 3.2GHz
NVIDIA GeForce RTX 3070
min:
37.4 fps, P0.1:
57.8 fps, P1:
70.5 fps, max:
148 fps
fps
64%
NVIDIA GeForce RTX 3050:
54.9 [X] PNY GeForce RTX 3050 XLR8 AMD Ryzen 9 7950X 4.5GHz
NVIDIA GeForce RTX 3050
min:
30.9 fps, P0.1:
40.7 fps, P1:
42.7 fps, max:
87.3 fps
75.6 [X] PNY GeForce RTX 3050 XLR8 AMD Ryzen 9 7950X 4.5GHz
NVIDIA GeForce RTX 3050
min:
43.4 fps, P0.1:
52.8 fps, P1:
56.9 fps, max:
146.8 fps
~ 65 fps
71%
GeForce RTX 3080 Laptop GPU:
69.3 [X] MSI GE76 Raider 11UH-472US Intel Core i9-11980HK 3.3GHz
GeForce RTX 3080 Laptop GPU
min:
11.8 fps, P0.1:
12.8 fps, P1:
14.7 fps, max:
122.5 fps
75.6 [X] Acemagic Tank03 Intel Core i9-12900H 1.8GHz
GeForce RTX 3080 Laptop GPU
min:
28.7 fps, P0.1:
37 fps, P1:
51.3 fps, max:
109.6 fps
~ 72 fps
100%
NVIDIA GeForce RTX 3070:
82.3 [X] Desktop-PC Intel Core i9-12900K 3.2GHz
NVIDIA GeForce RTX 3070
min:
45.7 fps, P0.1:
54.5 fps, P1:
61.1 fps, max:
123.6 fps
fps
48%
NVIDIA GeForce RTX 3050:
39.8 [X] PNY GeForce RTX 3050 XLR8 AMD Ryzen 9 7950X 4.5GHz
NVIDIA GeForce RTX 3050
min:
29.2 fps, P0.1:
30 fps, P1:
31.4 fps, max:
52.6 fps
fps
77%
GeForce RTX 3080 Laptop GPU:
63.2 [X] MSI GE76 Raider 11UH-472US Intel Core i9-11980HK 3.3GHz
GeForce RTX 3080 Laptop GPU
min:
12.4 fps, P0.1:
13 fps, P1:
14 fps, max:
114.9 fps
63.3 [X] Acemagic Tank03 Intel Core i9-12900H 1.8GHz
GeForce RTX 3080 Laptop GPU
min:
31.1 fps, P0.1:
35.6 fps, P1:
44.2 fps, max:
100.6 fps
~ 63 fps
100%
NVIDIA GeForce RTX 3070:
50.5 [X] Desktop-PC Intel Core i9-12900K 3.2GHz
NVIDIA GeForce RTX 3070
min:
33.1 fps, P0.1:
35.4 fps, P1:
40.7 fps, max:
97.9 fps
fps
47%
NVIDIA GeForce RTX 3050:
23.7 [X] PNY GeForce RTX 3050 XLR8 AMD Ryzen 9 7950X 4.5GHz
NVIDIA GeForce RTX 3050
min:
18.2 fps, P0.1:
18.3 fps, P1:
19.5 fps, max:
29 fps
fps
89%
GeForce RTX 3080 Laptop GPU:
38.7 [X] Acemagic Tank03 Intel Core i9-12900H 1.8GHz
GeForce RTX 3080 Laptop GPU
min:
22.9 fps, P0.1:
24.7 fps, P1:
30.1 fps, max:
106.4 fps
51 [X] MSI GE76 Raider 11UH-472US Intel Core i9-11980HK 3.3GHz
GeForce RTX 3080 Laptop GPU
min:
5.94 fps, P0.1:
11.7 fps, P1:
13.3 fps, max:
118.7 fps
~ 45 fps
100%
NVIDIA GeForce RTX 3070:
263 [X] Desktop-PC Intel Core i9-12900K 3.2GHz
NVIDIA GeForce RTX 3070
min:
95.3 fps, P0.1:
185.8 fps, P1:
211 fps, max:
346 fps
fps
48%
NVIDIA GeForce RTX 3050:
127.3 [X] PNY GeForce RTX 3050 XLR8 AMD Ryzen 9 7950X 4.5GHz
NVIDIA GeForce RTX 3050
min:
65.9 fps, P0.1:
103.7 fps, P1:
112.4 fps, max:
258 fps
fps
66%
GeForce RTX 3080 Laptop GPU:
174.7 [X] Acemagic Tank03 Intel Core i9-12900H 1.8GHz
GeForce RTX 3080 Laptop GPU
min:
47.4 fps, P0.1:
96.1 fps, P1:
131.7 fps, max:
216 fps
fps
100%
NVIDIA GeForce RTX 3070:
195.9 [X] Desktop-PC Intel Core i9-12900K 3.2GHz
NVIDIA GeForce RTX 3070
min:
113.3 fps, P0.1:
145.6 fps, P1:
161.5 fps, max:
276 fps
fps
50%
NVIDIA GeForce RTX 3050:
98.6 [X] PNY GeForce RTX 3050 XLR8 AMD Ryzen 9 7950X 4.5GHz
NVIDIA GeForce RTX 3050
min:
62 fps, P0.1:
80.2 fps, P1:
86.2 fps, max:
176 fps
fps
71%
GeForce RTX 3080 Laptop GPU:
138.5 [X] Acemagic Tank03 Intel Core i9-12900H 1.8GHz
GeForce RTX 3080 Laptop GPU
min:
40.9 fps, P0.1:
84.6 fps, P1:
108.2 fps, max:
183.1 fps
fps
100%
NVIDIA GeForce RTX 3070:
112.9 [X] Desktop-PC Intel Core i9-12900K 3.2GHz
NVIDIA GeForce RTX 3070
min:
69.7 fps, P0.1:
92.3 fps, P1:
97.4 fps, max:
160.9 fps
fps
50%
NVIDIA GeForce RTX 3050:
56.9 [X] PNY GeForce RTX 3050 XLR8 AMD Ryzen 9 7950X 4.5GHz
NVIDIA GeForce RTX 3050
min:
18 fps, P0.1:
49.9 fps, P1:
51.5 fps, max:
186.8 fps
fps
75%
GeForce RTX 3080 Laptop GPU:
84.8 [X] Acemagic Tank03 Intel Core i9-12900H 1.8GHz
GeForce RTX 3080 Laptop GPU
min:
45.4 fps, P0.1:
63.2 fps, P1:
68.3 fps, max:
132.5 fps
fps
100%
NVIDIA GeForce RTX 3070:
91.7 [X] Desktop-PC Intel Core i9-12900K 3.2GHz
NVIDIA GeForce RTX 3070
min:
69.3 fps, P0.1:
73.4 fps, P1:
78.7 fps, max:
129.2 fps
fps
49%
NVIDIA GeForce RTX 3050:
44.7 [X] PNY GeForce RTX 3050 XLR8 AMD Ryzen 9 7950X 4.5GHz
NVIDIA GeForce RTX 3050
min:
22.2 fps, P0.1:
39.4 fps, P1:
40.3 fps, max:
122.6 fps
fps
76%
GeForce RTX 3080 Laptop GPU:
66.5 [X] Acemagic Tank03 Intel Core i9-12900H 1.8GHz
GeForce RTX 3080 Laptop GPU
min:
25.9 fps, P0.1:
52.5 fps, P1:
55.5 fps, max:
109.8 fps
73.8 [X] MSI GE76 Raider 11UH-472US Intel Core i9-11980HK 3.3GHz
GeForce RTX 3080 Laptop GPU
min:
48.1 fps, P0.1:
58.2 fps, P1:
65.9 fps, max:
112.4 fps
~ 70 fps
100%
NVIDIA GeForce RTX 3070:
71.6 [X] Desktop-PC Intel Core i9-12900K 3.2GHz
NVIDIA GeForce RTX 3070
min:
58.8 fps, P0.1:
60.3 fps, P1:
62.5 fps, max:
87.5 fps
fps
47%
NVIDIA GeForce RTX 3050:
33.9 [X] PNY GeForce RTX 3050 XLR8 AMD Ryzen 9 7950X 4.5GHz
NVIDIA GeForce RTX 3050
min:
18.5 fps, P0.1:
29.9 fps, P1:
30.8 fps, max:
105.4 fps
fps
75%
GeForce RTX 3080 Laptop GPU:
51 [X] Acemagic Tank03 Intel Core i9-12900H 1.8GHz
GeForce RTX 3080 Laptop GPU
min:
35.4 fps, P0.1:
40.5 fps, P1:
43 fps, max:
82.9 fps
57.6 [X] MSI GE76 Raider 11UH-472US Intel Core i9-11980HK 3.3GHz
GeForce RTX 3080 Laptop GPU
min:
44.7 fps, P0.1:
49.3 fps, P1:
52.2 fps, max:
72.2 fps
~ 54 fps
100%
NVIDIA GeForce RTX 3070:
43.8 [X] Desktop-PC Intel Core i9-12900K 3.2GHz
NVIDIA GeForce RTX 3070
min:
37.5 fps, P0.1:
38.2 fps, P1:
39.8 fps, max:
53.2 fps
fps
45%
NVIDIA GeForce RTX 3050:
19.6 [X] PNY GeForce RTX 3050 XLR8 AMD Ryzen 9 7950X 4.5GHz
NVIDIA GeForce RTX 3050
min:
14.6 fps, P0.1:
17.6 fps, P1:
18.1 fps, max:
23.6 fps
fps
75%
GeForce RTX 3080 Laptop GPU:
30.8 [X] Acemagic Tank03 Intel Core i9-12900H 1.8GHz
GeForce RTX 3080 Laptop GPU
min:
22.7 fps, P0.1:
23.7 fps, P1:
25.6 fps, max:
42.8 fps
35.7 [X] MSI GE76 Raider 11UH-472US Intel Core i9-11980HK 3.3GHz
GeForce RTX 3080 Laptop GPU
min:
27.7 fps, P0.1:
30.8 fps, P1:
32.2 fps, max:
50.6 fps
~ 33 fps
NVIDIA GeForce RTX 3050:
70 [X] PNY GeForce RTX 3050 XLR8 AMD Ryzen 9 7950X 4.5GHz
NVIDIA GeForce RTX 3050
fps
GeForce RTX 3080 Laptop GPU:
102 [X] Acemagic Tank03 Intel Core i9-12900H 1.8GHz
GeForce RTX 3080 Laptop GPU
min:
51 fps, max:
216 fps
fps
100%
NVIDIA GeForce RTX 3070:
127 [X] Desktop-PC Intel Core i9-12900K 3.2GHz
NVIDIA GeForce RTX 3070
min:
65 fps
fps
53%
NVIDIA GeForce RTX 3050:
67 [X] PNY GeForce RTX 3050 XLR8 AMD Ryzen 9 7950X 4.5GHz
NVIDIA GeForce RTX 3050
fps
77%
GeForce RTX 3080 Laptop GPU:
98 [X] Acemagic Tank03 Intel Core i9-12900H 1.8GHz
GeForce RTX 3080 Laptop GPU
min:
52 fps, max:
182 fps
fps
100%
NVIDIA GeForce RTX 3070:
117 [X] Desktop-PC Intel Core i9-12900K 3.2GHz
NVIDIA GeForce RTX 3070
min:
56 fps
fps
51%
NVIDIA GeForce RTX 3050:
60 [X] PNY GeForce RTX 3050 XLR8 AMD Ryzen 9 7950X 4.5GHz
NVIDIA GeForce RTX 3050
fps
76%
GeForce RTX 3080 Laptop GPU:
89 [X] Acemagic Tank03 Intel Core i9-12900H 1.8GHz
GeForce RTX 3080 Laptop GPU
min:
54 fps, max:
143 fps
fps
100%
NVIDIA GeForce RTX 3070:
102 [X] Desktop-PC Intel Core i9-12900K 3.2GHz
NVIDIA GeForce RTX 3070
min:
53 fps
fps
49%
NVIDIA GeForce RTX 3050:
50 [X] PNY GeForce RTX 3050 XLR8 AMD Ryzen 9 7950X 4.5GHz
NVIDIA GeForce RTX 3050
fps
79%
GeForce RTX 3080 Laptop GPU:
77 [X] Acemagic Tank03 Intel Core i9-12900H 1.8GHz
GeForce RTX 3080 Laptop GPU
min:
44 fps, max:
127 fps
84 [X] MSI GE76 Raider 11UH-472US Intel Core i9-11980HK 3.3GHz
GeForce RTX 3080 Laptop GPU
min:
48 fps, max:
146 fps
~ 81 fps
100%
NVIDIA GeForce RTX 3070:
78 [X] Desktop-PC Intel Core i9-12900K 3.2GHz
NVIDIA GeForce RTX 3070
min:
40 fps
fps
47%
NVIDIA GeForce RTX 3050:
37 [X] PNY GeForce RTX 3050 XLR8 AMD Ryzen 9 7950X 4.5GHz
NVIDIA GeForce RTX 3050
fps
79%
GeForce RTX 3080 Laptop GPU:
58 [X] Acemagic Tank03 Intel Core i9-12900H 1.8GHz
GeForce RTX 3080 Laptop GPU
min:
25 fps, max:
139 fps
65 [X] MSI GE76 Raider 11UH-472US Intel Core i9-11980HK 3.3GHz
GeForce RTX 3080 Laptop GPU
min:
44 fps, max:
118 fps
~ 62 fps
100%
NVIDIA GeForce RTX 3070:
46 [X] Desktop-PC Intel Core i9-12900K 3.2GHz
NVIDIA GeForce RTX 3070
min:
29 fps
fps
46%
NVIDIA GeForce RTX 3050:
21 [X] PNY GeForce RTX 3050 XLR8 AMD Ryzen 9 7950X 4.5GHz
NVIDIA GeForce RTX 3050
fps
76%
GeForce RTX 3080 Laptop GPU:
33 [X] Acemagic Tank03 Intel Core i9-12900H 1.8GHz
GeForce RTX 3080 Laptop GPU
min:
16 fps, max:
58 fps
37 [X] MSI GE76 Raider 11UH-472US Intel Core i9-11980HK 3.3GHz
GeForce RTX 3080 Laptop GPU
min:
24 fps, max:
74 fps
~ 35 fps
NVIDIA GeForce RTX 3050:
86.8 [X] PNY GeForce RTX 3050 XLR8 AMD Ryzen 9 7950X 4.5GHz
NVIDIA GeForce RTX 3050
min:
42.3 fps, P0.1:
60 fps, P1:
72.6 fps, max:
150.5 fps
fps
GeForce RTX 3080 Laptop GPU:
113.3 [X] Acemagic Tank03 Intel Core i9-12900H 1.8GHz
GeForce RTX 3080 Laptop GPU
min:
43.6 fps, P0.1:
64.9 fps, P1:
88.7 fps, max:
139.7 fps
fps
100%
NVIDIA GeForce RTX 3070:
125.2 [X] Desktop-PC Intel Core i9-12900K 3.2GHz
NVIDIA GeForce RTX 3070
min:
41.3 fps, P0.1:
57 fps, P1:
83.7 fps, max:
174.2 fps
fps
54%
NVIDIA GeForce RTX 3050:
67.2 [X] PNY GeForce RTX 3050 XLR8 AMD Ryzen 9 7950X 4.5GHz
NVIDIA GeForce RTX 3050
min:
28.9 fps, P0.1:
47.3 fps, P1:
56.3 fps, max:
119.5 fps
fps
81%
GeForce RTX 3080 Laptop GPU:
101.2 [X] Acemagic Tank03 Intel Core i9-12900H 1.8GHz
GeForce RTX 3080 Laptop GPU
min:
29.9 fps, P0.1:
55 fps, P1:
71.6 fps, max:
125.2 fps
fps
100%
NVIDIA GeForce RTX 3070:
104.6 [X] Desktop-PC Intel Core i9-12900K 3.2GHz
NVIDIA GeForce RTX 3070
min:
47.4 fps, P0.1:
51.4 fps, P1:
73.2 fps, max:
158.6 fps
fps
51%
NVIDIA GeForce RTX 3050:
53 [X] PNY GeForce RTX 3050 XLR8 AMD Ryzen 9 7950X 4.5GHz
NVIDIA GeForce RTX 3050
min:
30.5 fps, P0.1:
41.3 fps, P1:
44.8 fps, max:
93.4 fps
fps
73%
GeForce RTX 3080 Laptop GPU:
76.5 [X] Acemagic Tank03 Intel Core i9-12900H 1.8GHz
GeForce RTX 3080 Laptop GPU
min:
8.73 fps, P0.1:
30.6 fps, P1:
42.4 fps, max:
111.1 fps
fps
100%
NVIDIA GeForce RTX 3070:
80.9 [X] Desktop-PC Intel Core i9-12900K 3.2GHz
NVIDIA GeForce RTX 3070
min:
25.7 fps, P0.1:
34.3 fps, P1:
52.7 fps, max:
154.1 fps
fps
52%
NVIDIA GeForce RTX 3050:
42.2 [X] PNY GeForce RTX 3050 XLR8 AMD Ryzen 9 7950X 4.5GHz
NVIDIA GeForce RTX 3050
min:
12.7 fps, P0.1:
25.9 fps, P1:
32.7 fps, max:
104.9 fps
fps
87%
GeForce RTX 3080 Laptop GPU:
68.4 [X] Acemagic Tank03 Intel Core i9-12900H 1.8GHz
GeForce RTX 3080 Laptop GPU
min:
18.4 fps, P0.1:
25.7 fps, P1:
42.7 fps, max:
106.3 fps
72.5 [X] MSI GE76 Raider 11UH-472US Intel Core i9-11980HK 3.3GHz
GeForce RTX 3080 Laptop GPU
min:
22.9 fps, P0.1:
28.1 fps, P1:
45.2 fps, max:
102.6 fps
~ 70 fps
100%
NVIDIA GeForce RTX 3070:
63.3 [X] Desktop-PC Intel Core i9-12900K 3.2GHz
NVIDIA GeForce RTX 3070
min:
25.9 fps, P0.1:
29.6 fps, P1:
41.1 fps, max:
133.1 fps
fps
46%
NVIDIA GeForce RTX 3050:
29.2 [X] PNY GeForce RTX 3050 XLR8 AMD Ryzen 9 7950X 4.5GHz
NVIDIA GeForce RTX 3050
min:
16.4 fps, P0.1:
19.2 fps, P1:
23.7 fps, max:
95.6 fps
fps
76%
GeForce RTX 3080 Laptop GPU:
48 [X] MSI GE76 Raider 11UH-472US Intel Core i9-11980HK 3.3GHz
GeForce RTX 3080 Laptop GPU
min:
24.5 fps, P0.1:
26.7 fps, P1:
32.4 fps, max:
76.3 fps
48.2 [X] Acemagic Tank03 Intel Core i9-12900H 1.8GHz
GeForce RTX 3080 Laptop GPU
min:
16.5 fps, P0.1:
20.6 fps, P1:
33.2 fps, max:
89.9 fps
~ 48 fps
100%
NVIDIA GeForce RTX 3070:
35 [X] Desktop-PC Intel Core i9-12900K 3.2GHz
NVIDIA GeForce RTX 3070
min:
22.9 fps, P0.1:
24.2 fps, P1:
26.3 fps, max:
110.5 fps
fps
43%
NVIDIA GeForce RTX 3050:
15.2 [X] PNY GeForce RTX 3050 XLR8 AMD Ryzen 9 7950X 4.5GHz
NVIDIA GeForce RTX 3050
min:
10.7 fps, P0.1:
11.1 fps, P1:
12.9 fps, max:
19.6 fps
fps
83%
GeForce RTX 3080 Laptop GPU:
26.3 [X] Acemagic Tank03 Intel Core i9-12900H 1.8GHz
GeForce RTX 3080 Laptop GPU
min:
12 fps, P0.1:
13.8 fps, P1:
19.7 fps, max:
94.6 fps
30.9 [X] MSI GE76 Raider 11UH-472US Intel Core i9-11980HK 3.3GHz
GeForce RTX 3080 Laptop GPU
min:
15.6 fps, P0.1:
15.7 fps, P1:
22.5 fps, max:
79.7 fps
~ 29 fps
100%
NVIDIA GeForce RTX 3070:
95 [X] Desktop-PC Intel Core i9-12900K 3.2GHz
NVIDIA GeForce RTX 3070
min:
34.7 fps, P0.1:
37.7 fps, P1:
64.3 fps, max:
495 fps
fps
63%
NVIDIA GeForce RTX 3050:
59.6 [X] PNY GeForce RTX 3050 XLR8 AMD Ryzen 9 7950X 4.5GHz
NVIDIA GeForce RTX 3050
min:
21.1 fps, P0.1:
31.9 fps, P1:
44.6 fps, max:
420 fps
fps
93%
GeForce RTX 3080 Laptop GPU:
88.6 [X] Acemagic Tank03 Intel Core i9-12900H 1.8GHz
GeForce RTX 3080 Laptop GPU
min:
32.9 fps, P0.1:
36 fps, P1:
47.4 fps, max:
383 fps
fps
100%
NVIDIA GeForce RTX 3070:
92.5 [X] Desktop-PC Intel Core i9-12900K 3.2GHz
NVIDIA GeForce RTX 3070
min:
35.9 fps, P0.1:
53.9 fps, P1:
61.6 fps, max:
204 fps
fps
62%
NVIDIA GeForce RTX 3050:
57 [X] PNY GeForce RTX 3050 XLR8 AMD Ryzen 9 7950X 4.5GHz
NVIDIA GeForce RTX 3050
min:
27.4 fps, P0.1:
37.4 fps, P1:
42.9 fps, max:
172.2 fps
fps
93%
GeForce RTX 3080 Laptop GPU:
85.6 [X] Acemagic Tank03 Intel Core i9-12900H 1.8GHz
GeForce RTX 3080 Laptop GPU
min:
32.7 fps, P0.1:
35.7 fps, P1:
45.1 fps, max:
416 fps
fps
100%
NVIDIA GeForce RTX 3070:
81.2 [X] Desktop-PC Intel Core i9-12900K 3.2GHz
NVIDIA GeForce RTX 3070
min:
34.8 fps, P0.1:
46.2 fps, P1:
55.9 fps, max:
198.4 fps
fps
62%
NVIDIA GeForce RTX 3050:
50.1 [X] PNY GeForce RTX 3050 XLR8 AMD Ryzen 9 7950X 4.5GHz
NVIDIA GeForce RTX 3050
min:
17.6 fps, P0.1:
33.4 fps, P1:
38.4 fps, max:
325 fps
fps
92%
GeForce RTX 3080 Laptop GPU:
74.7 [X] Acemagic Tank03 Intel Core i9-12900H 1.8GHz
GeForce RTX 3080 Laptop GPU
min:
35.4 fps, P0.1:
38.1 fps, P1:
43 fps, max:
404 fps
fps
100%
NVIDIA GeForce RTX 3070:
75.8 [X] Desktop-PC Intel Core i9-12900K 3.2GHz
NVIDIA GeForce RTX 3070
min:
26.2 fps, P0.1:
33.6 fps, P1:
52.9 fps, max:
332 fps
fps
64%
NVIDIA GeForce RTX 3050:
48.5 [X] PNY GeForce RTX 3050 XLR8 AMD Ryzen 9 7950X 4.5GHz
NVIDIA GeForce RTX 3050
min:
34.5 fps, P0.1:
34.7 fps, P1:
37.2 fps, max:
69.7 fps
fps
97%
GeForce RTX 3080 Laptop GPU:
73.6 [X] Acemagic Tank03 Intel Core i9-12900H 1.8GHz
GeForce RTX 3080 Laptop GPU
min:
30.8 fps, P0.1:
34 fps, P1:
41.1 fps, max:
409 fps
fps
100%
NVIDIA GeForce RTX 3070:
52 [X] Desktop-PC Intel Core i9-12900K 3.2GHz
NVIDIA GeForce RTX 3070
min:
23.1 fps, P0.1:
28.4 fps, P1:
37.8 fps, max:
121.4 fps
fps
62%
NVIDIA GeForce RTX 3050:
32 [X] PNY GeForce RTX 3050 XLR8 AMD Ryzen 9 7950X 4.5GHz
NVIDIA GeForce RTX 3050
min:
23.1 fps, P0.1:
23.2 fps, P1:
25.4 fps, max:
40.1 fps
fps
98%
GeForce RTX 3080 Laptop GPU:
51.1 [X] Acemagic Tank03 Intel Core i9-12900H 1.8GHz
GeForce RTX 3080 Laptop GPU
min:
28.1 fps, P0.1:
28.5 fps, P1:
34.9 fps, max:
200 fps
fps
100%
NVIDIA GeForce RTX 3070:
24.9 [X] Desktop-PC Intel Core i9-12900K 3.2GHz
NVIDIA GeForce RTX 3070
min:
16.3 fps, P0.1:
16.3 fps, P1:
16.9 fps, max:
51.7 fps
fps
65%
NVIDIA GeForce RTX 3050:
16.1 [X] PNY GeForce RTX 3050 XLR8 AMD Ryzen 9 7950X 4.5GHz
NVIDIA GeForce RTX 3050
min:
12.4 fps, P0.1:
12.9 fps, P1:
13.7 fps, max:
25.5 fps
fps
107%
GeForce RTX 3080 Laptop GPU:
26.7 [X] Acemagic Tank03 Intel Core i9-12900H 1.8GHz
GeForce RTX 3080 Laptop GPU
min:
19 fps, P0.1:
19.2 fps, P1:
20.2 fps, max:
44.4 fps
fps
NVIDIA GeForce RTX 3050:
145.8 [X] PNY GeForce RTX 3050 XLR8 AMD Ryzen 9 7950X 4.5GHz
NVIDIA GeForce RTX 3050
min:
19 fps, P0.1:
93 fps, P1:
107.8 fps, max:
358 fps
fps
GeForce RTX 3080 Laptop GPU:
189.3 [X] XMG Neo 15 @165 W TGP Intel Core i7-11800H 2.3GHz
GeForce RTX 3080 Laptop GPU
min:
9.59 fps, P0.1:
28.5 fps, P1:
129.3 fps, max:
276 fps
198.1 [X] Acemagic Tank03 Intel Core i9-12900H 1.8GHz
GeForce RTX 3080 Laptop GPU
min:
45.6 fps, P0.1:
115.2 fps, P1:
150.5 fps, max:
270 fps
~ 194 fps
100%
NVIDIA GeForce RTX 3070:
226 [X] Desktop-PC Intel Core i9-12900K 3.2GHz
NVIDIA GeForce RTX 3070
min:
10.6 fps, P0.1:
43.2 fps, P1:
154.5 fps, max:
377 fps
fps
57%
NVIDIA GeForce RTX 3050:
128.2 [X] PNY GeForce RTX 3050 XLR8 AMD Ryzen 9 7950X 4.5GHz
NVIDIA GeForce RTX 3050
min:
76.5 fps, P0.1:
89.2 fps, P1:
96.4 fps, max:
229 fps
fps
73%
GeForce RTX 3080 Laptop GPU:
164.4 [X] XMG Neo 15 @165 W TGP Intel Core i7-11800H 2.3GHz
GeForce RTX 3080 Laptop GPU
min:
50.2 fps, P0.1:
95.1 fps, P1:
120.2 fps, max:
244 fps
164.9 [X] Acemagic Tank03 Intel Core i9-12900H 1.8GHz
GeForce RTX 3080 Laptop GPU
min:
12.4 fps, P0.1:
98.1 fps, P1:
115 fps, max:
235 fps
~ 165 fps
100%
NVIDIA GeForce RTX 3070:
188.2 [X] Desktop-PC Intel Core i9-12900K 3.2GHz
NVIDIA GeForce RTX 3070
min:
17.3 fps, P0.1:
118.8 fps, P1:
136.2 fps, max:
291 fps
fps
47%
NVIDIA GeForce RTX 3050:
88.7 [X] PNY GeForce RTX 3050 XLR8 AMD Ryzen 9 7950X 4.5GHz
NVIDIA GeForce RTX 3050
min:
45.1 fps, P0.1:
62.6 fps, P1:
69.7 fps, max:
139.6 fps
fps
74%
GeForce RTX 3080 Laptop GPU:
137.1 [X] Acemagic Tank03 Intel Core i9-12900H 1.8GHz
GeForce RTX 3080 Laptop GPU
min:
50.7 fps, P0.1:
79.7 fps, P1:
96.6 fps, max:
217 fps
142.2 [X] XMG Neo 15 @165 W TGP Intel Core i7-11800H 2.3GHz
GeForce RTX 3080 Laptop GPU
min:
49.6 fps, P0.1:
92.1 fps, P1:
105.1 fps, max:
213 fps
~ 140 fps
100%
NVIDIA GeForce RTX 3070:
151.5 [X] Desktop-PC Intel Core i9-12900K 3.2GHz
NVIDIA GeForce RTX 3070
min:
56.1 fps, P0.1:
93.8 fps, P1:
105.3 fps, max:
266 fps
fps
47%
NVIDIA GeForce RTX 3050:
70.7 [X] PNY GeForce RTX 3050 XLR8 AMD Ryzen 9 7950X 4.5GHz
NVIDIA GeForce RTX 3050
min:
41.5 fps, P0.1:
53 fps, P1:
58.2 fps, max:
173.8 fps
fps
76%
GeForce RTX 3080 Laptop GPU:
110 [X] Acemagic Tank03 Intel Core i9-12900H 1.8GHz
GeForce RTX 3080 Laptop GPU
min:
34.2 fps, P0.1:
61.9 fps, P1:
75 fps, max:
196.8 fps
120.9 [X] XMG Neo 15 @165 W TGP Intel Core i7-11800H 2.3GHz
GeForce RTX 3080 Laptop GPU
min:
48.9 fps, P0.1:
72.1 fps, P1:
82.2 fps, max:
194 fps
~ 115 fps
100%
NVIDIA GeForce RTX 3070:
109.9 [X] Desktop-PC Intel Core i9-12900K 3.2GHz
NVIDIA GeForce RTX 3070
min:
63 fps, P0.1:
68.6 fps, P1:
78.3 fps, max:
200 fps
fps
46%
NVIDIA GeForce RTX 3050:
50.4 [X] PNY GeForce RTX 3050 XLR8 AMD Ryzen 9 7950X 4.5GHz
NVIDIA GeForce RTX 3050
min:
15.6 fps, P0.1:
38.7 fps, P1:
43.7 fps, max:
175.7 fps
fps
76%
GeForce RTX 3080 Laptop GPU:
82.1 [X] Acemagic Tank03 Intel Core i9-12900H 1.8GHz
GeForce RTX 3080 Laptop GPU
min:
31.2 fps, P0.1:
51.4 fps, P1:
58.6 fps, max:
176.4 fps
85.8 [X] XMG Neo 15 @165 W TGP Intel Core i7-11800H 2.3GHz
GeForce RTX 3080 Laptop GPU
min:
36.5 fps, P0.1:
54.8 fps, P1:
60.9 fps, max:
166.8 fps
~ 84 fps
100%
NVIDIA GeForce RTX 3070:
61.9 [X] Desktop-PC Intel Core i9-12900K 3.2GHz
NVIDIA GeForce RTX 3070
min:
39.4 fps, P0.1:
42.5 fps, P1:
47.9 fps, max:
144.1 fps
fps
46%
NVIDIA GeForce RTX 3050:
28.2 [X] PNY GeForce RTX 3050 XLR8 AMD Ryzen 9 7950X 4.5GHz
NVIDIA GeForce RTX 3050
min:
17.5 fps, P0.1:
23.5 fps, P1:
25.3 fps, max:
67.7 fps
fps
75%
GeForce RTX 3080 Laptop GPU:
46.4 [X] Acemagic Tank03 Intel Core i9-12900H 1.8GHz
GeForce RTX 3080 Laptop GPU
min:
17.4 fps, P0.1:
32.3 fps, P1:
36.7 fps, max:
125.4 fps
fps
100%
NVIDIA GeForce RTX 3070:
324 [X] Desktop-PC Intel Core i9-12900K 3.2GHz
NVIDIA GeForce RTX 3070
min:
92.8 fps, P0.1:
149.8 fps, P1:
207 fps, max:
509 fps
fps
55%
NVIDIA GeForce RTX 3050:
176.7 [X] PNY GeForce RTX 3050 XLR8 AMD Ryzen 9 7950X 4.5GHz
NVIDIA GeForce RTX 3050
min:
32.6 fps, P0.1:
84.2 fps, P1:
91 fps, max:
438 fps
fps
63%
GeForce RTX 3080 Laptop GPU:
204 [X] Acemagic Tank03 Intel Core i9-12900H 1.8GHz
GeForce RTX 3080 Laptop GPU
min:
47.3 fps, P0.1:
109 fps, P1:
144.9 fps, max:
309 fps
fps
100%
NVIDIA GeForce RTX 3070:
219 [X] Desktop-PC Intel Core i9-12900K 3.2GHz
NVIDIA GeForce RTX 3070
min:
56.8 fps, P0.1:
105.7 fps, P1:
134.9 fps, max:
395 fps
fps
50%
NVIDIA GeForce RTX 3050:
108.8 [X] PNY GeForce RTX 3050 XLR8 AMD Ryzen 9 7950X 4.5GHz
NVIDIA GeForce RTX 3050
min:
30.5 fps, P0.1:
52.9 fps, P1:
69.9 fps, max:
320 fps
fps
81%
GeForce RTX 3080 Laptop GPU:
177.2 [X] Acemagic Tank03 Intel Core i9-12900H 1.8GHz
GeForce RTX 3080 Laptop GPU
min:
17.6 fps, P0.1:
71.5 fps, P1:
108.6 fps, max:
296 fps
fps
100%
NVIDIA GeForce RTX 3070:
171.5 [X] Desktop-PC Intel Core i9-12900K 3.2GHz
NVIDIA GeForce RTX 3070
min:
52.3 fps, P0.1:
77.7 fps, P1:
106.4 fps, max:
293 fps
fps
47%
NVIDIA GeForce RTX 3050:
80.7 [X] PNY GeForce RTX 3050 XLR8 AMD Ryzen 9 7950X 4.5GHz
NVIDIA GeForce RTX 3050
min:
30.2 fps, P0.1:
38.8 fps, P1:
52.3 fps, max:
248 fps
fps
78%
GeForce RTX 3080 Laptop GPU:
133 [X] Acemagic Tank03 Intel Core i9-12900H 1.8GHz
GeForce RTX 3080 Laptop GPU
min:
45.4 fps, P0.1:
54.8 fps, P1:
80.9 fps, max:
279 fps
fps
100%
NVIDIA GeForce RTX 3070:
136.2 [X] Desktop-PC Intel Core i9-12900K 3.2GHz
NVIDIA GeForce RTX 3070
min:
61.1 fps, P0.1:
66.2 fps, P1:
88.7 fps, max:
238 fps
fps
47%
NVIDIA GeForce RTX 3050:
64.2 [X] PNY GeForce RTX 3050 XLR8 AMD Ryzen 9 7950X 4.5GHz
NVIDIA GeForce RTX 3050
min:
32.7 fps, P0.1:
34.2 fps, P1:
40.8 fps, max:
234 fps
fps
81%
GeForce RTX 3080 Laptop GPU:
109.8 [X] Acemagic Tank03 Intel Core i9-12900H 1.8GHz
GeForce RTX 3080 Laptop GPU
min:
33.8 fps, P0.1:
46.1 fps, P1:
66.9 fps, max:
248 fps
fps
100%
NVIDIA GeForce RTX 3070:
84.8 [X] Desktop-PC Intel Core i9-12900K 3.2GHz
NVIDIA GeForce RTX 3070
min:
37.8 fps, P0.1:
42.7 fps, P1:
55.8 fps, max:
236 fps
fps
45%
NVIDIA GeForce RTX 3050:
38.2 [X] PNY GeForce RTX 3050 XLR8 AMD Ryzen 9 7950X 4.5GHz
NVIDIA GeForce RTX 3050
min:
14.8 fps, P0.1:
16 fps, P1:
20.5 fps, max:
236 fps
fps
79%
GeForce RTX 3080 Laptop GPU:
67 [X] Acemagic Tank03 Intel Core i9-12900H 1.8GHz
GeForce RTX 3080 Laptop GPU
min:
26.7 fps, P0.1:
30.2 fps, P1:
42.5 fps, max:
233 fps
fps
100%
NVIDIA GeForce RTX 3070:
35.9 [X] Desktop-PC Intel Core i9-12900K 3.2GHz
NVIDIA GeForce RTX 3070
min:
14.9 fps, P0.1:
15.8 fps, P1:
19.2 fps, max:
177.4 fps
fps
43%
NVIDIA GeForce RTX 3050:
15.5 [X] PNY GeForce RTX 3050 XLR8 AMD Ryzen 9 7950X 4.5GHz
NVIDIA GeForce RTX 3050
min:
6.33 fps, P0.1:
6.63 fps, P1:
7.32 fps, max:
211 fps
fps
80%
GeForce RTX 3080 Laptop GPU:
28.8 [X] Acemagic Tank03 Intel Core i9-12900H 1.8GHz
GeForce RTX 3080 Laptop GPU
min:
10.6 fps, P0.1:
14.2 fps, P1:
15.3 fps, max:
202 fps
fps
NVIDIA GeForce RTX 3050:
108.2 [X] PNY GeForce RTX 3050 XLR8 AMD Ryzen 9 7950X 4.5GHz
NVIDIA GeForce RTX 3050
fps
GeForce RTX 3080 Laptop GPU:
149.2 fps
100%
NVIDIA GeForce RTX 3070:
151 [X] Desktop-PC Intel Core i9-12900K 3.2GHz
NVIDIA GeForce RTX 3070
fps
48%
NVIDIA GeForce RTX 3050:
72.5 [X] PNY GeForce RTX 3050 XLR8 AMD Ryzen 9 7950X 4.5GHz
NVIDIA GeForce RTX 3050
fps
81%
GeForce RTX 3080 Laptop GPU:
118 [X] XMG Neo 15 @165 W TGP Intel Core i7-11800H 2.3GHz
GeForce RTX 3080 Laptop GPU
127.9 ~ 123 fps
100%
NVIDIA GeForce RTX 3070:
101 [X] Desktop-PC Intel Core i9-12900K 3.2GHz
NVIDIA GeForce RTX 3070
fps
68%
NVIDIA GeForce RTX 3050:
69 [X] PNY GeForce RTX 3050 XLR8 AMD Ryzen 9 7950X 4.5GHz
NVIDIA GeForce RTX 3050
fps
103%
GeForce RTX 3080 Laptop GPU:
86.5 [X] XMG Neo 15 @165 W TGP Intel Core i7-11800H 2.3GHz
GeForce RTX 3080 Laptop GPU
121.4 ~ 104 fps
100%
NVIDIA GeForce RTX 3070:
100 [X] Desktop-PC Intel Core i9-12900K 3.2GHz
NVIDIA GeForce RTX 3070
fps
44%
NVIDIA GeForce RTX 3050:
44.1 [X] PNY GeForce RTX 3050 XLR8 AMD Ryzen 9 7950X 4.5GHz
NVIDIA GeForce RTX 3050
fps
85%
GeForce RTX 3080 Laptop GPU:
83.6 85.8 [X] XMG Neo 15 @165 W TGP Intel Core i7-11800H 2.3GHz
GeForce RTX 3080 Laptop GPU
~ 85 fps
100%
NVIDIA GeForce RTX 3070:
74 [X] Desktop-PC Intel Core i9-12900K 3.2GHz
NVIDIA GeForce RTX 3070
fps
44%
NVIDIA GeForce RTX 3050:
32.4 [X] PNY GeForce RTX 3050 XLR8 AMD Ryzen 9 7950X 4.5GHz
NVIDIA GeForce RTX 3050
fps
85%
GeForce RTX 3080 Laptop GPU:
62.3 [X] XMG Neo 15 @165 W TGP Intel Core i7-11800H 2.3GHz
GeForce RTX 3080 Laptop GPU
63 ~ 63 fps
100%
NVIDIA GeForce RTX 3070:
43.5 [X] Desktop-PC Intel Core i9-12900K 3.2GHz
NVIDIA GeForce RTX 3070
fps
43%
NVIDIA GeForce RTX 3050:
18.7 [X] PNY GeForce RTX 3050 XLR8 AMD Ryzen 9 7950X 4.5GHz
NVIDIA GeForce RTX 3050
fps
85%
GeForce RTX 3080 Laptop GPU:
35.8 [X] XMG Neo 15 @165 W TGP Intel Core i7-11800H 2.3GHz
GeForce RTX 3080 Laptop GPU
38.9 ~ 37 fps
NVIDIA GeForce RTX 3050:
123.5 [X] PNY GeForce RTX 3050 XLR8 AMD Ryzen 9 7950X 4.5GHz
NVIDIA GeForce RTX 3050
min:
76.1 fps, P0.1:
84.5 fps, P1:
95.7 fps, max:
197.9 fps
175.2 [X] PNY GeForce RTX 3050 XLR8 AMD Ryzen 9 7950X 4.5GHz
NVIDIA GeForce RTX 3050
min:
42.9 fps, P0.1:
83.8 fps, P1:
122.4 fps, max:
228 fps
~ 149 fps
GeForce RTX 3080 Laptop GPU:
117.5 [X] XMG Neo 15 @165 W TGP Intel Core i7-11800H 2.3GHz
GeForce RTX 3080 Laptop GPU
min:
17.2 fps, P0.1:
30.1 fps, P1:
57.3 fps, max:
163.8 fps
146.1 [X] Acemagic Tank03 Intel Core i9-12900H 1.8GHz
GeForce RTX 3080 Laptop GPU
min:
26.7 fps, P0.1:
65.2 fps, P1:
104.2 fps, max:
367 fps
~ 132 fps
100%
NVIDIA GeForce RTX 3070:
178.7 [X] Desktop-PC Intel Core i9-12900K 3.2GHz
NVIDIA GeForce RTX 3070
min:
93.8 fps, P0.1:
103.9 fps, P1:
134.2 fps, max:
231 fps
fps
58%
NVIDIA GeForce RTX 3050:
104.1 [X] PNY GeForce RTX 3050 XLR8 AMD Ryzen 9 7950X 4.5GHz
NVIDIA GeForce RTX 3050
min:
41.6 fps, P0.1:
68.2 fps, P1:
81.1 fps, max:
181.9 fps
fps
69%
GeForce RTX 3080 Laptop GPU:
112.5 [X] XMG Neo 15 @165 W TGP Intel Core i7-11800H 2.3GHz
GeForce RTX 3080 Laptop GPU
min:
8.57 fps, P0.1:
34.5 fps, P1:
63.9 fps, max:
161.1 fps
133.8 [X] Acemagic Tank03 Intel Core i9-12900H 1.8GHz
GeForce RTX 3080 Laptop GPU
min:
39.1 fps, P0.1:
70.2 fps, P1:
93 fps, max:
380 fps
~ 123 fps
100%
NVIDIA GeForce RTX 3070:
154.6 [X] Desktop-PC Intel Core i9-12900K 3.2GHz
NVIDIA GeForce RTX 3070
min:
34.2 fps, P0.1:
56.6 fps, P1:
110.1 fps, max:
208 fps
fps
54%
NVIDIA GeForce RTX 3050:
83.5 [X] PNY GeForce RTX 3050 XLR8 AMD Ryzen 9 7950X 4.5GHz
NVIDIA GeForce RTX 3050
min:
56.1 fps, P0.1:
61.7 fps, P1:
67.9 fps, max:
156.7 fps
fps
69%
GeForce RTX 3080 Laptop GPU:
100.4 [X] XMG Neo 15 @165 W TGP Intel Core i7-11800H 2.3GHz
GeForce RTX 3080 Laptop GPU
min:
6.78 fps, P0.1:
30.5 fps, P1:
55.9 fps, max:
142.8 fps
110.8 [X] Acemagic Tank03 Intel Core i9-12900H 1.8GHz
GeForce RTX 3080 Laptop GPU
min:
52.6 fps, P0.1:
71.1 fps, P1:
82 fps, max:
259 fps
~ 106 fps
100%
NVIDIA GeForce RTX 3070:
133 [X] Desktop-PC Intel Core i9-12900K 3.2GHz
NVIDIA GeForce RTX 3070
min:
22.6 fps, P0.1:
57.3 fps, P1:
94.8 fps, max:
198.8 fps
fps
53%
NVIDIA GeForce RTX 3050:
70.7 [X] PNY GeForce RTX 3050 XLR8 AMD Ryzen 9 7950X 4.5GHz
NVIDIA GeForce RTX 3050
min:
33.1 fps, P0.1:
47.4 fps, P1:
51.2 fps, max:
121.4 fps
fps
76%
GeForce RTX 3080 Laptop GPU:
93.1 [X] XMG Neo 15 @165 W TGP Intel Core i7-11800H 2.3GHz
GeForce RTX 3080 Laptop GPU
min:
18.2 fps, P0.1:
22.5 fps, P1:
43.7 fps, max:
135.6 fps
109.6 [X] Acemagic Tank03 Intel Core i9-12900H 1.8GHz
GeForce RTX 3080 Laptop GPU
min:
6.75 fps, P0.1:
71.2 fps, P1:
81.1 fps, max:
248 fps
~ 101 fps
100%
NVIDIA GeForce RTX 3070:
101 [X] Desktop-PC Intel Core i9-12900K 3.2GHz
NVIDIA GeForce RTX 3070
min:
12.2 fps, P0.1:
35.6 fps, P1:
78.6 fps, max:
154.4 fps
fps
48%
NVIDIA GeForce RTX 3050:
48.4 [X] PNY GeForce RTX 3050 XLR8 AMD Ryzen 9 7950X 4.5GHz
NVIDIA GeForce RTX 3050
min:
16.1 fps, P0.1:
32.8 fps, P1:
37.7 fps, max:
73.9 fps
fps
79%
GeForce RTX 3080 Laptop GPU:
79.3 [X] Acemagic Tank03 Intel Core i9-12900H 1.8GHz
GeForce RTX 3080 Laptop GPU
min:
52.7 fps, P0.1:
59 fps, P1:
63.9 fps, max:
131.3 fps
79.9 [X] XMG Neo 15 @165 W TGP Intel Core i7-11800H 2.3GHz
GeForce RTX 3080 Laptop GPU
min:
18.3 fps, P0.1:
26.9 fps, P1:
48.9 fps, max:
116.2 fps
~ 80 fps
100%
NVIDIA GeForce RTX 3070:
50.3 [X] Desktop-PC Intel Core i9-12900K 3.2GHz
NVIDIA GeForce RTX 3070
min:
13.3 fps, P0.1:
30 fps, P1:
39.4 fps, max:
91.9 fps
fps
49%
NVIDIA GeForce RTX 3050:
24.6 [X] PNY GeForce RTX 3050 XLR8 AMD Ryzen 9 7950X 4.5GHz
NVIDIA GeForce RTX 3050
min:
19.2 fps, P0.1:
19.3 fps, P1:
19.5 fps, max:
35.6 fps
fps
86%
GeForce RTX 3080 Laptop GPU:
43.2 [X] Acemagic Tank03 Intel Core i9-12900H 1.8GHz
GeForce RTX 3080 Laptop GPU
min:
31.5 fps, P0.1:
34.2 fps, P1:
35.9 fps, max:
72.8 fps
fps
NVIDIA GeForce RTX 3050:
96.9 [X] PNY GeForce RTX 3050 XLR8 AMD Ryzen 9 7950X 4.5GHz
NVIDIA GeForce RTX 3050
min:
60.9 fps, P0.1:
71.2 fps, P1:
75.5 fps, max:
172.7 fps
fps
GeForce RTX 3080 Laptop GPU:
123.7 [X] Acemagic Tank03 Intel Core i9-12900H 1.8GHz
GeForce RTX 3080 Laptop GPU
min:
61.3 fps, P0.1:
68.7 fps, P1:
96.8 fps, max:
158.6 fps
fps
100%
NVIDIA GeForce RTX 3070:
147.3 [X] Desktop-PC Intel Core i9-12900K 3.2GHz
NVIDIA GeForce RTX 3070
min:
73.4 fps, P0.1:
88.1 fps, P1:
117.7 fps, max:
172 fps
fps
58%
NVIDIA GeForce RTX 3050:
85 [X] PNY GeForce RTX 3050 XLR8 AMD Ryzen 9 7950X 4.5GHz
NVIDIA GeForce RTX 3050
min:
66.5 fps, P0.1:
67.6 fps, P1:
70.2 fps, max:
135.8 fps
fps
78%
GeForce RTX 3080 Laptop GPU:
110.8 [X] XMG Neo 15 @165 W TGP Intel Core i7-11800H 2.3GHz
GeForce RTX 3080 Laptop GPU
min:
28 fps, P0.1:
35.1 fps, P1:
73.7 fps, max:
134.4 fps
118.2 [X] Acemagic Tank03 Intel Core i9-12900H 1.8GHz
GeForce RTX 3080 Laptop GPU
min:
61.6 fps, P0.1:
66.9 fps, P1:
88 fps, max:
155.3 fps
~ 115 fps
100%
NVIDIA GeForce RTX 3070:
138.1 [X] Desktop-PC Intel Core i9-12900K 3.2GHz
NVIDIA GeForce RTX 3070
min:
78.7 fps, P0.1:
81.5 fps, P1:
107.8 fps, max:
164.9 fps
fps
58%
NVIDIA GeForce RTX 3050:
79.7 [X] PNY GeForce RTX 3050 XLR8 AMD Ryzen 9 7950X 4.5GHz
NVIDIA GeForce RTX 3050
min:
57.1 fps, P0.1:
63.9 fps, P1:
66.4 fps, max:
163.9 fps
fps
77%
GeForce RTX 3080 Laptop GPU:
103.6 [X] XMG Neo 15 @165 W TGP Intel Core i7-11800H 2.3GHz
GeForce RTX 3080 Laptop GPU
min:
20.7 fps, P0.1:
28.3 fps, P1:
68.6 fps, max:
135.5 fps
109.8 [X] Acemagic Tank03 Intel Core i9-12900H 1.8GHz
GeForce RTX 3080 Laptop GPU
min:
58.9 fps, P0.1:
61.6 fps, P1:
81.3 fps, max:
153.4 fps
~ 107 fps
100%
NVIDIA GeForce RTX 3070:
129.2 [X] Desktop-PC Intel Core i9-12900K 3.2GHz
NVIDIA GeForce RTX 3070
min:
75.7 fps, P0.1:
78.9 fps, P1:
104.8 fps, max:
156.2 fps
fps
55%
NVIDIA GeForce RTX 3050:
70.5 [X] PNY GeForce RTX 3050 XLR8 AMD Ryzen 9 7950X 4.5GHz
NVIDIA GeForce RTX 3050
min:
13.5 fps, P0.1:
29.5 fps, P1:
61.5 fps, max:
112.9 fps
fps
79%
GeForce RTX 3080 Laptop GPU:
101 [X] Acemagic Tank03 Intel Core i9-12900H 1.8GHz
GeForce RTX 3080 Laptop GPU
min:
42.2 fps, P0.1:
63.4 fps, P1:
76.1 fps, max:
123.7 fps
102 [X] XMG Neo 15 @165 W TGP Intel Core i7-11800H 2.3GHz
GeForce RTX 3080 Laptop GPU
min:
34.4 fps, P0.1:
37.9 fps, P1:
63.4 fps, max:
145 fps
~ 102 fps
100%
NVIDIA GeForce RTX 3070:
96.2 [X] Desktop-PC Intel Core i9-12900K 3.2GHz
NVIDIA GeForce RTX 3070
min:
52 fps, P0.1:
58.6 fps, P1:
79.5 fps, max:
113.6 fps
fps
54%
NVIDIA GeForce RTX 3050:
51.5 [X] PNY GeForce RTX 3050 XLR8 AMD Ryzen 9 7950X 4.5GHz
NVIDIA GeForce RTX 3050
min:
41.5 fps, P0.1:
42.2 fps, P1:
44.1 fps, max:
78.4 fps
fps
81%
GeForce RTX 3080 Laptop GPU:
76.1 [X] XMG Neo 15 @165 W TGP Intel Core i7-11800H 2.3GHz
GeForce RTX 3080 Laptop GPU
min:
6.18 fps, P0.1:
17.7 fps, P1:
49.6 fps, max:
100.7 fps
79.6 [X] Acemagic Tank03 Intel Core i9-12900H 1.8GHz
GeForce RTX 3080 Laptop GPU
min:
55 fps, P0.1:
62.8 fps, P1:
66.5 fps, max:
152.2 fps
~ 78 fps
100%
NVIDIA GeForce RTX 3070:
50.8 [X] Desktop-PC Intel Core i9-12900K 3.2GHz
NVIDIA GeForce RTX 3070
min:
25.7 fps, P0.1:
34.3 fps, P1:
42.9 fps, max:
57.4 fps
fps
56%
NVIDIA GeForce RTX 3050:
28.3 [X] PNY GeForce RTX 3050 XLR8 AMD Ryzen 9 7950X 4.5GHz
NVIDIA GeForce RTX 3050
min:
19.3 fps, P0.1:
20.9 fps, P1:
24.9 fps, max:
60.4 fps
fps
106%
GeForce RTX 3080 Laptop GPU:
44.3 [X] XMG Neo 15 @165 W TGP Intel Core i7-11800H 2.3GHz
GeForce RTX 3080 Laptop GPU
min:
30.8 fps, P0.1:
34.4 fps, P1:
40.7 fps, max:
50.1 fps
63.9 [X] Acemagic Tank03 Intel Core i9-12900H 1.8GHz
GeForce RTX 3080 Laptop GPU
min:
51.8 fps, P0.1:
53 fps, P1:
56.6 fps, max:
95.9 fps
~ 54 fps
NVIDIA GeForce RTX 3050:
94 [X] PNY GeForce RTX 3050 XLR8 AMD Ryzen 9 7950X 4.5GHz
NVIDIA GeForce RTX 3050
fps
100%
NVIDIA GeForce RTX 3070:
159 [X] Desktop-PC Intel Core i9-12900K 3.2GHz
NVIDIA GeForce RTX 3070
min:
111 fps
fps
60%
NVIDIA GeForce RTX 3050:
96 [X] PNY GeForce RTX 3050 XLR8 AMD Ryzen 9 7950X 4.5GHz
NVIDIA GeForce RTX 3050
fps
89%
GeForce RTX 3080 Laptop GPU:
142 [X] XMG Neo 15 @165 W TGP Intel Core i7-11800H 2.3GHz
GeForce RTX 3080 Laptop GPU
min:
100 fps
fps
100%
NVIDIA GeForce RTX 3070:
121 [X] Desktop-PC Intel Core i9-12900K 3.2GHz
NVIDIA GeForce RTX 3070
min:
67 fps
fps
55%
NVIDIA GeForce RTX 3050:
66 [X] PNY GeForce RTX 3050 XLR8 AMD Ryzen 9 7950X 4.5GHz
NVIDIA GeForce RTX 3050
fps
88%
GeForce RTX 3080 Laptop GPU:
106 [X] XMG Neo 15 @165 W TGP Intel Core i7-11800H 2.3GHz
GeForce RTX 3080 Laptop GPU
min:
59 fps
fps
100%
NVIDIA GeForce RTX 3070:
118 [X] Desktop-PC Intel Core i9-12900K 3.2GHz
NVIDIA GeForce RTX 3070
min:
67 fps
fps
53%
NVIDIA GeForce RTX 3050:
62 [X] PNY GeForce RTX 3050 XLR8 AMD Ryzen 9 7950X 4.5GHz
NVIDIA GeForce RTX 3050
fps
87%
GeForce RTX 3080 Laptop GPU:
103 [X] XMG Neo 15 @165 W TGP Intel Core i7-11800H 2.3GHz
GeForce RTX 3080 Laptop GPU
min:
56 fps
fps
100%
NVIDIA GeForce RTX 3070:
82 [X] Desktop-PC Intel Core i9-12900K 3.2GHz
NVIDIA GeForce RTX 3070
min:
42 fps
fps
54%
NVIDIA GeForce RTX 3050:
44 [X] PNY GeForce RTX 3050 XLR8 AMD Ryzen 9 7950X 4.5GHz
NVIDIA GeForce RTX 3050
fps
88%
GeForce RTX 3080 Laptop GPU:
72 [X] XMG Neo 15 @165 W TGP Intel Core i7-11800H 2.3GHz
GeForce RTX 3080 Laptop GPU
min:
33 fps
fps
100%
NVIDIA GeForce RTX 3070:
49 [X] Desktop-PC Intel Core i9-12900K 3.2GHz
NVIDIA GeForce RTX 3070
min:
21 fps
fps
55%
NVIDIA GeForce RTX 3050:
27 [X] PNY GeForce RTX 3050 XLR8 AMD Ryzen 9 7950X 4.5GHz
NVIDIA GeForce RTX 3050
fps
86%
GeForce RTX 3080 Laptop GPU:
42 [X] XMG Neo 15 @165 W TGP Intel Core i7-11800H 2.3GHz
GeForce RTX 3080 Laptop GPU
min:
18 fps
fps
NVIDIA GeForce RTX 3050:
50 [X] PNY GeForce RTX 3050 XLR8 AMD Ryzen 9 7950X 4.5GHz
NVIDIA GeForce RTX 3050
fps
NVIDIA GeForce RTX 3050:
61 [X] PNY GeForce RTX 3050 XLR8 AMD Ryzen 9 7950X 4.5GHz
NVIDIA GeForce RTX 3050
min:
35.7 fps, P0.1:
55.6 fps, P1:
57.7 fps, max:
151.7 fps
fps
GeForce RTX 3080 Laptop GPU:
82.7 [X] Acemagic Tank03 Intel Core i9-12900H 1.8GHz
GeForce RTX 3080 Laptop GPU
min:
43.4 fps, P0.1:
56.7 fps, P1:
71.8 fps, max:
98.1 fps
fps
100%
NVIDIA GeForce RTX 3070:
98.3 [X] Desktop-PC Intel Core i9-12900K 3.2GHz
NVIDIA GeForce RTX 3070
min:
40.5 fps, P0.1:
80.8 fps, P1:
85.7 fps, max:
122.9 fps
fps
59%
NVIDIA GeForce RTX 3050:
58.2 [X] PNY GeForce RTX 3050 XLR8 AMD Ryzen 9 7950X 4.5GHz
NVIDIA GeForce RTX 3050
min:
52.5 fps, P0.1:
53 fps, P1:
53.8 fps, max:
64.2 fps
fps
84%
GeForce RTX 3080 Laptop GPU:
80.4 [X] Acemagic Tank03 Intel Core i9-12900H 1.8GHz
GeForce RTX 3080 Laptop GPU
min:
55.7 fps, P0.1:
62.5 fps, P1:
71.1 fps, max:
123.8 fps
86.2 [X] XMG Neo 15 @165 W TGP Intel Core i7-11800H 2.3GHz
GeForce RTX 3080 Laptop GPU
min:
17.5 fps, P0.1:
50.2 fps, P1:
70.6 fps, max:
113.3 fps
~ 83 fps
100%
NVIDIA GeForce RTX 3070:
92.8 [X] Desktop-PC Intel Core i9-12900K 3.2GHz
NVIDIA GeForce RTX 3070
min:
48.4 fps, P0.1:
69.5 fps, P1:
80.2 fps, max:
154.2 fps
fps
59%
NVIDIA GeForce RTX 3050:
54.7 [X] PNY GeForce RTX 3050 XLR8 AMD Ryzen 9 7950X 4.5GHz
NVIDIA GeForce RTX 3050
min:
47.6 fps, P0.1:
47.8 fps, P1:
48.9 fps, max:
62.5 fps
fps
84%
GeForce RTX 3080 Laptop GPU:
75.9 [X] Acemagic Tank03 Intel Core i9-12900H 1.8GHz
GeForce RTX 3080 Laptop GPU
min:
52.2 fps, P0.1:
59.4 fps, P1:
67.2 fps, max:
129.7 fps
80.6 [X] XMG Neo 15 @165 W TGP Intel Core i7-11800H 2.3GHz
GeForce RTX 3080 Laptop GPU
min:
3.14 fps, P0.1:
12.4 fps, P1:
66.8 fps, max:
120.4 fps
~ 78 fps
100%
NVIDIA GeForce RTX 3070:
89.4 [X] Desktop-PC Intel Core i9-12900K 3.2GHz
NVIDIA GeForce RTX 3070
min:
52 fps, P0.1:
62.2 fps, P1:
77.4 fps, max:
161 fps
fps
58%
NVIDIA GeForce RTX 3050:
52 [X] PNY GeForce RTX 3050 XLR8 AMD Ryzen 9 7950X 4.5GHz
NVIDIA GeForce RTX 3050
min:
45.6 fps, P0.1:
46 fps, P1:
46.9 fps, max:
65.4 fps
fps
85%
GeForce RTX 3080 Laptop GPU:
73 [X] Acemagic Tank03 Intel Core i9-12900H 1.8GHz
GeForce RTX 3080 Laptop GPU
min:
38.5 fps, P0.1:
55.1 fps, P1:
66 fps, max:
135.7 fps
79.8 [X] XMG Neo 15 @165 W TGP Intel Core i7-11800H 2.3GHz
GeForce RTX 3080 Laptop GPU
min:
26.3 fps, P0.1:
30.6 fps, P1:
67.6 fps, max:
115.3 fps
~ 76 fps
100%
NVIDIA GeForce RTX 3070:
70 [X] Desktop-PC Intel Core i9-12900K 3.2GHz
NVIDIA GeForce RTX 3070
min:
42.7 fps, P0.1:
43.2 fps, P1:
63.6 fps, max:
172.8 fps
fps
52%
NVIDIA GeForce RTX 3050:
36.2 [X] PNY GeForce RTX 3050 XLR8 AMD Ryzen 9 7950X 4.5GHz
NVIDIA GeForce RTX 3050
min:
31.7 fps, P0.1:
31.9 fps, P1:
33 fps, max:
39 fps
fps
83%
GeForce RTX 3080 Laptop GPU:
57.2 [X] Acemagic Tank03 Intel Core i9-12900H 1.8GHz
GeForce RTX 3080 Laptop GPU
min:
35.3 fps, P0.1:
40.3 fps, P1:
52 fps, max:
109.3 fps
59.7 [X] XMG Neo 15 @165 W TGP Intel Core i7-11800H 2.3GHz
GeForce RTX 3080 Laptop GPU
min:
36.8 fps, P0.1:
38.7 fps, P1:
55.7 fps, max:
108.4 fps
~ 58 fps
100%
NVIDIA GeForce RTX 3070:
40.9 [X] Desktop-PC Intel Core i9-12900K 3.2GHz
NVIDIA GeForce RTX 3070
min:
23.5 fps, P0.1:
23.6 fps, P1:
37.4 fps, max:
135.6 fps
fps
38%
NVIDIA GeForce RTX 3050:
15.7 [X] PNY GeForce RTX 3050 XLR8 AMD Ryzen 9 7950X 4.5GHz
NVIDIA GeForce RTX 3050
min:
5.39 fps, P0.1:
6.22 fps, P1:
13.7 fps, max:
137.9 fps
fps
83%
GeForce RTX 3080 Laptop GPU:
32.1 [X] Acemagic Tank03 Intel Core i9-12900H 1.8GHz
GeForce RTX 3080 Laptop GPU
min:
18.4 fps, P0.1:
26.4 fps, P1:
29.1 fps, max:
99.2 fps
36.1 [X] XMG Neo 15 @165 W TGP Intel Core i7-11800H 2.3GHz
GeForce RTX 3080 Laptop GPU
min:
14.3 fps, P0.1:
20.7 fps, P1:
32.3 fps, max:
77.9 fps
~ 34 fps
NVIDIA GeForce RTX 3050:
76.6 [X] PNY GeForce RTX 3050 XLR8 AMD Ryzen 9 7950X 4.5GHz
NVIDIA GeForce RTX 3050
min:
43.6 fps, P0.1:
49.7 fps, P1:
61.5 fps, max:
135.9 fps
fps
GeForce RTX 3080 Laptop GPU:
113.7 [X] Acemagic Tank03 Intel Core i9-12900H 1.8GHz
GeForce RTX 3080 Laptop GPU
min:
38.4 fps, P0.1:
53.1 fps, P1:
86.2 fps, max:
173.6 fps
fps
100%
NVIDIA GeForce RTX 3070:
87 [X] Desktop-PC Intel Core i9-12900K 3.2GHz
NVIDIA GeForce RTX 3070
min:
51 fps, P0.1:
62.6 fps, P1:
69.5 fps, max:
154.1 fps
fps
66%
NVIDIA GeForce RTX 3050:
57.8 [X] PNY GeForce RTX 3050 XLR8 AMD Ryzen 9 7950X 4.5GHz
NVIDIA GeForce RTX 3050
min:
18 fps, P0.1:
31 fps, P1:
48.2 fps, max:
168.3 fps
fps
91%
GeForce RTX 3080 Laptop GPU:
70.3 [X] XMG Neo 15 @165 W TGP Intel Core i7-11800H 2.3GHz
GeForce RTX 3080 Laptop GPU
min:
8.09 fps, P0.1:
10.9 fps, P1:
37.6 fps, max:
141.9 fps
87.2 [X] Acemagic Tank03 Intel Core i9-12900H 1.8GHz
GeForce RTX 3080 Laptop GPU
min:
33.6 fps, P0.1:
40.6 fps, P1:
66.5 fps, max:
159.8 fps
~ 79 fps
100%
NVIDIA GeForce RTX 3070:
75.3 [X] Desktop-PC Intel Core i9-12900K 3.2GHz
NVIDIA GeForce RTX 3070
min:
52.5 fps, P0.1:
54.1 fps, P1:
60.4 fps, max:
165.1 fps
fps
56%
NVIDIA GeForce RTX 3050:
42.1 [X] PNY GeForce RTX 3050 XLR8 AMD Ryzen 9 7950X 4.5GHz
NVIDIA GeForce RTX 3050
min:
30.6 fps, P0.1:
32.1 fps, P1:
36.4 fps, max:
71.7 fps
fps
82%
GeForce RTX 3080 Laptop GPU:
59.4 [X] XMG Neo 15 @165 W TGP Intel Core i7-11800H 2.3GHz
GeForce RTX 3080 Laptop GPU
min:
9.58 fps, P0.1:
27.4 fps, P1:
32.5 fps, max:
135.4 fps
64.3 [X] Acemagic Tank03 Intel Core i9-12900H 1.8GHz
GeForce RTX 3080 Laptop GPU
min:
25.1 fps, P0.1:
41.5 fps, P1:
52 fps, max:
121.3 fps
~ 62 fps
100%
NVIDIA GeForce RTX 3070:
65.5 [X] Desktop-PC Intel Core i9-12900K 3.2GHz
NVIDIA GeForce RTX 3070
min:
37.6 fps, P0.1:
46 fps, P1:
52.5 fps, max:
173.7 fps
fps
49%
NVIDIA GeForce RTX 3050:
31.9 [X] PNY GeForce RTX 3050 XLR8 AMD Ryzen 9 7950X 4.5GHz
NVIDIA GeForce RTX 3050
min:
17 fps, P0.1:
21.8 fps, P1:
27.1 fps, max:
81.5 fps
fps
78%
GeForce RTX 3080 Laptop GPU:
49.1 [X] Acemagic Tank03 Intel Core i9-12900H 1.8GHz
GeForce RTX 3080 Laptop GPU
min:
29.8 fps, P0.1:
32.4 fps, P1:
38.4 fps, max:
118.1 fps
51.8 [X] XMG Neo 15 @165 W TGP Intel Core i7-11800H 2.3GHz
GeForce RTX 3080 Laptop GPU
min:
7.31 fps, P0.1:
23.1 fps, P1:
34 fps, max:
124.7 fps
51.9 [X] MSI GE76 Raider 11UH-472US Intel Core i9-11980HK 3.3GHz
GeForce RTX 3080 Laptop GPU
min:
15 fps, P0.1:
15.4 fps, P1:
17.9 fps, max:
143 fps
~ 51 fps
100%
NVIDIA GeForce RTX 3070:
47.4 [X] Desktop-PC Intel Core i9-12900K 3.2GHz
NVIDIA GeForce RTX 3070
min:
35.5 fps, P0.1:
37.4 fps, P1:
40 fps, max:
63 fps
fps
46%
NVIDIA GeForce RTX 3050:
22 [X] PNY GeForce RTX 3050 XLR8 AMD Ryzen 9 7950X 4.5GHz
NVIDIA GeForce RTX 3050
min:
17.9 fps, P0.1:
18 fps, P1:
19.3 fps, max:
27.4 fps
fps
80%
GeForce RTX 3080 Laptop GPU:
35.8 [X] Acemagic Tank03 Intel Core i9-12900H 1.8GHz
GeForce RTX 3080 Laptop GPU
min:
24.3 fps, P0.1:
25.7 fps, P1:
28.1 fps, max:
59.5 fps
38.2 [X] XMG Neo 15 @165 W TGP Intel Core i7-11800H 2.3GHz
GeForce RTX 3080 Laptop GPU
min:
25.5 fps, P0.1:
27 fps, P1:
30.4 fps, max:
92.3 fps
38.6 [X] MSI GE76 Raider 11UH-472US Intel Core i9-11980HK 3.3GHz
GeForce RTX 3080 Laptop GPU
min:
15 fps, P0.1:
15.5 fps, P1:
18.1 fps, max:
126.2 fps
~ 38 fps
100%
NVIDIA GeForce RTX 3070:
27.2 [X] Desktop-PC Intel Core i9-12900K 3.2GHz
NVIDIA GeForce RTX 3070
min:
22.8 fps, P0.1:
23.3 fps, P1:
23.8 fps, max:
34.3 fps
fps
45%
NVIDIA GeForce RTX 3050:
12.3 [X] PNY GeForce RTX 3050 XLR8 AMD Ryzen 9 7950X 4.5GHz
NVIDIA GeForce RTX 3050
min:
10.2 fps, P0.1:
10.4 fps, P1:
10.9 fps, max:
14.4 fps
fps
81%
GeForce RTX 3080 Laptop GPU:
20.3 [X] Acemagic Tank03 Intel Core i9-12900H 1.8GHz
GeForce RTX 3080 Laptop GPU
min:
15.1 fps, P0.1:
15.9 fps, P1:
16.6 fps, max:
26.6 fps
22.6 [X] XMG Neo 15 @165 W TGP Intel Core i7-11800H 2.3GHz
GeForce RTX 3080 Laptop GPU
min:
18.3 fps, P0.1:
18.8 fps, P1:
19.4 fps, max:
28.6 fps
23.4 [X] MSI GE76 Raider 11UH-472US Intel Core i9-11980HK 3.3GHz
GeForce RTX 3080 Laptop GPU
min:
17.6 fps, P0.1:
18 fps, P1:
20.4 fps, max:
46.1 fps
~ 22 fps
NVIDIA GeForce RTX 3050:
213 [X] PNY GeForce RTX 3050 XLR8 AMD Ryzen 9 7950X 4.5GHz
NVIDIA GeForce RTX 3050
min:
119.2 fps, P0.1:
148.6 fps, P1:
161 fps, max:
314 fps
fps
100%
NVIDIA GeForce RTX 3070:
208 [X] Desktop-PC Intel Core i9-12900K 3.2GHz
NVIDIA GeForce RTX 3070
min:
30.2 fps, P0.1:
126.5 fps, P1:
148.5 fps, max:
260 fps
fps
98%
NVIDIA GeForce RTX 3050:
204 [X] PNY GeForce RTX 3050 XLR8 AMD Ryzen 9 7950X 4.5GHz
NVIDIA GeForce RTX 3050
min:
98 fps, P0.1:
143 fps, P1:
154.9 fps, max:
318 fps
fps
66%
GeForce RTX 3080 Laptop GPU:
138.2 [X] XMG Neo 15 @165 W TGP Intel Core i7-11800H 2.3GHz
GeForce RTX 3080 Laptop GPU
min:
23.2 fps, P0.1:
40.6 fps, P1:
75.6 fps, max:
195.8 fps
fps
100%
NVIDIA GeForce RTX 3070:
197.4 [X] Desktop-PC Intel Core i9-12900K 3.2GHz
NVIDIA GeForce RTX 3070
min:
102.3 fps, P0.1:
123.3 fps, P1:
141.1 fps, max:
253 fps
fps
67%
NVIDIA GeForce RTX 3050:
131.9 [X] PNY GeForce RTX 3050 XLR8 AMD Ryzen 9 7950X 4.5GHz
NVIDIA GeForce RTX 3050
min:
75.1 fps, P0.1:
95.5 fps, P1:
108.2 fps, max:
247 fps
fps
65%
GeForce RTX 3080 Laptop GPU:
128.4 [X] XMG Neo 15 @165 W TGP Intel Core i7-11800H 2.3GHz
GeForce RTX 3080 Laptop GPU
min:
19 fps, P0.1:
38 fps, P1:
61.4 fps, max:
183.2 fps
fps
100%
NVIDIA GeForce RTX 3070:
189.9 [X] Desktop-PC Intel Core i9-12900K 3.2GHz
NVIDIA GeForce RTX 3070
min:
58.7 fps, P0.1:
112.1 fps, P1:
134.2 fps, max:
242 fps
fps
69%
NVIDIA GeForce RTX 3050:
130.2 [X] PNY GeForce RTX 3050 XLR8 AMD Ryzen 9 7950X 4.5GHz
NVIDIA GeForce RTX 3050
min:
54.4 fps, P0.1:
89.9 fps, P1:
99.2 fps, max:
279 fps
fps
67%
GeForce RTX 3080 Laptop GPU:
127 [X] XMG Neo 15 @165 W TGP Intel Core i7-11800H 2.3GHz
GeForce RTX 3080 Laptop GPU
min:
22 fps, P0.1:
37.9 fps, P1:
66.6 fps, max:
175.2 fps
fps
100%
NVIDIA GeForce RTX 3070:
163.6 [X] Desktop-PC Intel Core i9-12900K 3.2GHz
NVIDIA GeForce RTX 3070
min:
103.7 fps, P0.1:
108.1 fps, P1:
118 fps, max:
223 fps
fps
62%
NVIDIA GeForce RTX 3050:
100.9 [X] PNY GeForce RTX 3050 XLR8 AMD Ryzen 9 7950X 4.5GHz
NVIDIA GeForce RTX 3050
min:
55.8 fps, P0.1:
82.5 fps, P1:
86.7 fps, max:
252 fps
fps
77%
GeForce RTX 3080 Laptop GPU:
126 [X] XMG Neo 15 @165 W TGP Intel Core i7-11800H 2.3GHz
GeForce RTX 3080 Laptop GPU
min:
23.9 fps, P0.1:
34.1 fps, P1:
63.6 fps, max:
170.9 fps
fps
100%
NVIDIA GeForce RTX 3070:
105.9 [X] Desktop-PC Intel Core i9-12900K 3.2GHz
NVIDIA GeForce RTX 3070
min:
39.7 fps, P0.1:
73.3 fps, P1:
80.7 fps, max:
173.9 fps
fps
55%
NVIDIA GeForce RTX 3050:
57.9 [X] PNY GeForce RTX 3050 XLR8 AMD Ryzen 9 7950X 4.5GHz
NVIDIA GeForce RTX 3050
min:
45.3 fps, P0.1:
48.1 fps, P1:
53.1 fps, max:
79.4 fps
fps
82%
GeForce RTX 3080 Laptop GPU:
86.9 [X] XMG Neo 15 @165 W TGP Intel Core i7-11800H 2.3GHz
GeForce RTX 3080 Laptop GPU
min:
27.4 fps, P0.1:
35 fps, P1:
61.3 fps, max:
156 fps
fps
NVIDIA GeForce RTX 3050:
105.7 [X] PNY GeForce RTX 3050 XLR8 AMD Ryzen 9 7950X 4.5GHz
NVIDIA GeForce RTX 3050
min:
33.8 fps, P0.1:
45.9 fps, P1:
90.4 fps, max:
284 fps
fps
GeForce RTX 3080 Laptop GPU:
152.5 [X] Acemagic Tank03 Intel Core i9-12900H 1.8GHz
GeForce RTX 3080 Laptop GPU
min:
30.3 fps, P0.1:
63 fps, P1:
105.7 fps, max:
245 fps
fps
NVIDIA GeForce RTX 3050:
76.9 [X] PNY GeForce RTX 3050 XLR8 AMD Ryzen 9 7950X 4.5GHz
NVIDIA GeForce RTX 3050
min:
22.7 fps, P0.1:
40.4 fps, P1:
61.7 fps, max:
223 fps
fps
GeForce RTX 3080 Laptop GPU:
116.8 [X] Acemagic Tank03 Intel Core i9-12900H 1.8GHz
GeForce RTX 3080 Laptop GPU
min:
26.9 fps, P0.1:
41.8 fps, P1:
87.6 fps, max:
191.9 fps
126 [X] XMG Neo 15 @165 W TGP Intel Core i7-11800H 2.3GHz
GeForce RTX 3080 Laptop GPU
min:
29.7 fps, P0.1:
57.3 fps, P1:
85 fps, max:
208 fps
~ 121 fps
NVIDIA GeForce RTX 3050:
62.5 [X] PNY GeForce RTX 3050 XLR8 AMD Ryzen 9 7950X 4.5GHz
NVIDIA GeForce RTX 3050
min:
24.7 fps, P0.1:
28.6 fps, P1:
50.1 fps, max:
249 fps
fps
GeForce RTX 3080 Laptop GPU:
96.6 [X] Acemagic Tank03 Intel Core i9-12900H 1.8GHz
GeForce RTX 3080 Laptop GPU
min:
18.6 fps, P0.1:
36.3 fps, P1:
74.9 fps, max:
170 fps
102.8 [X] XMG Neo 15 @165 W TGP Intel Core i7-11800H 2.3GHz
GeForce RTX 3080 Laptop GPU
min:
18 fps, P0.1:
40.6 fps, P1:
76.3 fps, max:
194.6 fps
~ 100 fps
NVIDIA GeForce RTX 3050:
49 [X] PNY GeForce RTX 3050 XLR8 AMD Ryzen 9 7950X 4.5GHz
NVIDIA GeForce RTX 3050
min:
22.7 fps, P0.1:
23.9 fps, P1:
40.9 fps, max:
185.3 fps
fps
GeForce RTX 3080 Laptop GPU:
77.9 [X] Acemagic Tank03 Intel Core i9-12900H 1.8GHz
GeForce RTX 3080 Laptop GPU
min:
16.4 fps, P0.1:
21.1 fps, P1:
59.9 fps, max:
178.5 fps
81.8 [X] XMG Neo 15 @165 W TGP Intel Core i7-11800H 2.3GHz
GeForce RTX 3080 Laptop GPU
min:
32.6 fps, P0.1:
37.5 fps, P1:
65.7 fps, max:
185.3 fps
~ 80 fps
NVIDIA GeForce RTX 3050:
33.4 [X] PNY GeForce RTX 3050 XLR8 AMD Ryzen 9 7950X 4.5GHz
NVIDIA GeForce RTX 3050
min:
13.2 fps, P0.1:
14.7 fps, P1:
25 fps, max:
100.4 fps
fps
GeForce RTX 3080 Laptop GPU:
54.3 [X] Acemagic Tank03 Intel Core i9-12900H 1.8GHz
GeForce RTX 3080 Laptop GPU
min:
14.7 fps, P0.1:
20.5 fps, P1:
41.7 fps, max:
182.5 fps
56.9 [X] XMG Neo 15 @165 W TGP Intel Core i7-11800H 2.3GHz
GeForce RTX 3080 Laptop GPU
min:
24.4 fps, P0.1:
25.3 fps, P1:
46.2 fps, max:
152.6 fps
~ 56 fps
NVIDIA GeForce RTX 3050:
10.3 [X] PNY GeForce RTX 3050 XLR8 AMD Ryzen 9 7950X 4.5GHz
NVIDIA GeForce RTX 3050
min:
5.54 fps, P0.1:
5.6 fps, P1:
5.99 fps, max:
15.9 fps
fps
GeForce RTX 3080 Laptop GPU:
29.8 [X] Acemagic Tank03 Intel Core i9-12900H 1.8GHz
GeForce RTX 3080 Laptop GPU
min:
11.2 fps, P0.1:
12.2 fps, P1:
20.6 fps, max:
86.6 fps
31.4 [X] XMG Neo 15 @165 W TGP Intel Core i7-11800H 2.3GHz
GeForce RTX 3080 Laptop GPU
min:
9.91 fps, P0.1:
11.6 fps, P1:
21.9 fps, max:
111.3 fps
~ 31 fps
100%
NVIDIA GeForce RTX 3070:
258 fps
81%
NVIDIA GeForce RTX 3050:
209 [X] PNY GeForce RTX 3050 XLR8 959964
AMD Ryzen 9 7950X 4.5GHz
NVIDIA GeForce RTX 3050
min:
182 fps, P1:
157 fps, max:
251 fps
fps
96%
GeForce RTX 3080 Laptop GPU:
247 [X] Acemagic Tank03 959964
Intel Core i9-12900H 1.8GHz
GeForce RTX 3080 Laptop GPU
min:
195 fps, P1:
138 fps, max:
297 fps
fps
100%
NVIDIA GeForce RTX 3070:
249 fps
74%
NVIDIA GeForce RTX 3050:
185.2 [X] PNY GeForce RTX 3050 XLR8 959964
AMD Ryzen 9 7950X 4.5GHz
NVIDIA GeForce RTX 3050
min:
164 fps, P1:
142 fps, max:
211 fps
fps
95%
GeForce RTX 3080 Laptop GPU:
229 [X] XMG Neo 15 @165 W TGP Intel Core i7-11800H 2.3GHz
GeForce RTX 3080 Laptop GPU
min:
165 fps
245 [X] Acemagic Tank03 959964
Intel Core i9-12900H 1.8GHz
GeForce RTX 3080 Laptop GPU
min:
189 fps, P1:
135 fps, max:
282 fps
~ 237 fps
100%
NVIDIA GeForce RTX 3070:
228 fps
58%
NVIDIA GeForce RTX 3050:
132.2 [X] PNY GeForce RTX 3050 XLR8 959964
AMD Ryzen 9 7950X 4.5GHz
NVIDIA GeForce RTX 3050
min:
115 fps, P1:
106 fps, max:
152 fps
fps
87%
GeForce RTX 3080 Laptop GPU:
195.4 [X] Acemagic Tank03 959964
Intel Core i9-12900H 1.8GHz
GeForce RTX 3080 Laptop GPU
min:
166 fps, P1:
117 fps, max:
225 fps
201 [X] XMG Neo 15 @165 W TGP Intel Core i7-11800H 2.3GHz
GeForce RTX 3080 Laptop GPU
min:
156 fps
~ 198 fps
100%
NVIDIA GeForce RTX 3070:
81 fps
49%
NVIDIA GeForce RTX 3050:
39.9 [X] PNY GeForce RTX 3050 XLR8 959964
AMD Ryzen 9 7950X 4.5GHz
NVIDIA GeForce RTX 3050
min:
33 fps, P1:
33 fps, max:
47 fps
fps
84%
GeForce RTX 3080 Laptop GPU:
65.2 [X] Acemagic Tank03 959964
Intel Core i9-12900H 1.8GHz
GeForce RTX 3080 Laptop GPU
min:
56 fps, P1:
53 fps, max:
77 fps
70 [X] XMG Neo 15 @165 W TGP Intel Core i7-11800H 2.3GHz
GeForce RTX 3080 Laptop GPU
min:
60 fps
~ 68 fps
100%
NVIDIA GeForce RTX 3070:
52 fps
48%
NVIDIA GeForce RTX 3050:
24.9 [X] PNY GeForce RTX 3050 XLR8 959964
AMD Ryzen 9 7950X 4.5GHz
NVIDIA GeForce RTX 3050
min:
21 fps, P1:
21 fps, max:
30 fps
fps
83%
GeForce RTX 3080 Laptop GPU:
42 [X] Acemagic Tank03 959964
Intel Core i9-12900H 1.8GHz
GeForce RTX 3080 Laptop GPU
min:
36 fps, P1:
33 fps, max:
49 fps
43 [X] XMG Neo 15 @165 W TGP Intel Core i7-11800H 2.3GHz
GeForce RTX 3080 Laptop GPU
min:
36 fps
~ 43 fps
100%
NVIDIA GeForce RTX 3070:
25 fps
48%
NVIDIA GeForce RTX 3050:
12 [X] PNY GeForce RTX 3050 XLR8 959964
AMD Ryzen 9 7950X 4.5GHz
NVIDIA GeForce RTX 3050
min:
10 fps, P1:
10 fps, max:
14 fps
fps
84%
GeForce RTX 3080 Laptop GPU:
20.1 [X] Acemagic Tank03 959964
Intel Core i9-12900H 1.8GHz
GeForce RTX 3080 Laptop GPU
min:
17 fps, P1:
16 fps, max:
23 fps
22 [X] XMG Neo 15 @165 W TGP Intel Core i7-11800H 2.3GHz
GeForce RTX 3080 Laptop GPU
min:
19 fps
~ 21 fps
100%
NVIDIA GeForce RTX 3070:
299 [X] Desktop-PC Intel Core i9-12900K 3.2GHz
NVIDIA GeForce RTX 3070
min:
96.4 fps, P0.1:
188.8 fps, P1:
225 fps, max:
543 fps
fps
85%
GeForce RTX 3080 Laptop GPU:
253 [X] XMG Neo 15 @165 W TGP Intel Core i7-11800H 2.3GHz
GeForce RTX 3080 Laptop GPU
min:
21.7 fps, P0.1:
118.8 fps, P1:
173.9 fps, max:
432 fps
fps
100%
NVIDIA GeForce RTX 3070:
279 [X] Desktop-PC Intel Core i9-12900K 3.2GHz
NVIDIA GeForce RTX 3070
min:
150 fps, P0.1:
186.9 fps, P1:
212 fps, max:
478 fps
fps
85%
GeForce RTX 3080 Laptop GPU:
238 [X] XMG Neo 15 @165 W TGP Intel Core i7-11800H 2.3GHz
GeForce RTX 3080 Laptop GPU
min:
41.2 fps, P0.1:
91 fps, P1:
158.8 fps, max:
452 fps
fps
100%
NVIDIA GeForce RTX 3070:
266 [X] Desktop-PC Intel Core i9-12900K 3.2GHz
NVIDIA GeForce RTX 3070
min:
51.6 fps, P0.1:
172.8 fps, P1:
199.6 fps, max:
443 fps
fps
84%
GeForce RTX 3080 Laptop GPU:
224 [X] XMG Neo 15 @165 W TGP Intel Core i7-11800H 2.3GHz
GeForce RTX 3080 Laptop GPU
min:
25.8 fps, P0.1:
119.6 fps, P1:
155 fps, max:
396 fps
fps
100%
NVIDIA GeForce RTX 3070:
181.3 [X] Desktop-PC Intel Core i9-12900K 3.2GHz
NVIDIA GeForce RTX 3070
min:
56.7 fps, P0.1:
124.3 fps, P1:
138.7 fps, max:
348 fps
fps
83%
GeForce RTX 3080 Laptop GPU:
150 [X] XMG Neo 15 @165 W TGP Intel Core i7-11800H 2.3GHz
GeForce RTX 3080 Laptop GPU
min:
51.1 fps, P0.1:
82.3 fps, P1:
113 fps, max:
304 fps
fps
100%
NVIDIA GeForce RTX 3070:
95.9 [X] Desktop-PC Intel Core i9-12900K 3.2GHz
NVIDIA GeForce RTX 3070
min:
42.1 fps, P0.1:
61.4 fps, P1:
72.6 fps, max:
218 fps
fps
81%
GeForce RTX 3080 Laptop GPU:
78 [X] XMG Neo 15 @165 W TGP Intel Core i7-11800H 2.3GHz
GeForce RTX 3080 Laptop GPU
min:
48.6 fps, P0.1:
52 fps, P1:
58.8 fps, max:
278 fps
fps
NVIDIA GeForce RTX 3050:
115.9 [X] PNY GeForce RTX 3050 XLR8 AMD Ryzen 9 7950X 4.5GHz
NVIDIA GeForce RTX 3050
min:
37 fps, P0.1:
67.4 fps, P1:
72.6 fps, max:
303 fps
fps
GeForce RTX 3080 Laptop GPU:
161.9 [X] Acemagic Tank03 Intel Core i9-12900H 1.8GHz
GeForce RTX 3080 Laptop GPU
min:
46 fps, P0.1:
81.1 fps, P1:
119.4 fps, max:
208 fps
fps
100%
NVIDIA GeForce RTX 3070:
200 [X] Desktop-PC Intel Core i9-12900K 3.2GHz
NVIDIA GeForce RTX 3070
min:
31.8 fps, P0.1:
60.6 fps, P1:
129.9 fps, max:
346 fps
fps
55%
NVIDIA GeForce RTX 3050:
109.2 [X] PNY GeForce RTX 3050 XLR8 AMD Ryzen 9 7950X 4.5GHz
NVIDIA GeForce RTX 3050
min:
54.1 fps, P0.1:
62.7 fps, P1:
66.6 fps, max:
288 fps
fps
82%
GeForce RTX 3080 Laptop GPU:
154.6 [X] Acemagic Tank03 Intel Core i9-12900H 1.8GHz
GeForce RTX 3080 Laptop GPU
min:
45.7 fps, P0.1:
73.8 fps, P1:
112.1 fps, max:
207 fps
171.5 [X] XMG Neo 15 @165 W TGP Intel Core i7-11800H 2.3GHz
GeForce RTX 3080 Laptop GPU
min:
32.4 fps, P0.1:
61 fps, P1:
114.4 fps, max:
288 fps
~ 163 fps
100%
NVIDIA GeForce RTX 3070:
198 [X] Desktop-PC Intel Core i9-12900K 3.2GHz
NVIDIA GeForce RTX 3070
min:
46.3 fps, P0.1:
56.4 fps, P1:
128.5 fps, max:
354 fps
fps
55%
NVIDIA GeForce RTX 3050:
108.2 [X] PNY GeForce RTX 3050 XLR8 AMD Ryzen 9 7950X 4.5GHz
NVIDIA GeForce RTX 3050
min:
53.1 fps, P0.1:
61.6 fps, P1:
66 fps, max:
291 fps
fps
81%
GeForce RTX 3080 Laptop GPU:
152.9 [X] Acemagic Tank03 Intel Core i9-12900H 1.8GHz
GeForce RTX 3080 Laptop GPU
min:
41.9 fps, P0.1:
59.8 fps, P1:
108.6 fps, max:
210 fps
166.8 [X] XMG Neo 15 @165 W TGP Intel Core i7-11800H 2.3GHz
GeForce RTX 3080 Laptop GPU
min:
25.3 fps, P0.1:
58.7 fps, P1:
116 fps, max:
279 fps
~ 160 fps
100%
NVIDIA GeForce RTX 3070:
195.1 [X] Desktop-PC Intel Core i9-12900K 3.2GHz
NVIDIA GeForce RTX 3070
min:
38.1 fps, P0.1:
60.2 fps, P1:
132.3 fps, max:
331 fps
fps
54%
NVIDIA GeForce RTX 3050:
106.2 [X] PNY GeForce RTX 3050 XLR8 AMD Ryzen 9 7950X 4.5GHz
NVIDIA GeForce RTX 3050
min:
59.2 fps, P0.1:
60.5 fps, P1:
64.6 fps, max:
290 fps
fps
79%
GeForce RTX 3080 Laptop GPU:
147.8 [X] Acemagic Tank03 Intel Core i9-12900H 1.8GHz
GeForce RTX 3080 Laptop GPU
min:
51.7 fps, P0.1:
78.4 fps, P1:
100.5 fps, max:
201 fps
162.5 [X] XMG Neo 15 @165 W TGP Intel Core i7-11800H 2.3GHz
GeForce RTX 3080 Laptop GPU
min:
22.3 fps, P0.1:
56.5 fps, P1:
115.7 fps, max:
255 fps
~ 155 fps
100%
NVIDIA GeForce RTX 3070:
130.4 [X] Desktop-PC Intel Core i9-12900K 3.2GHz
NVIDIA GeForce RTX 3070
min:
31.5 fps, P0.1:
55.2 fps, P1:
83.1 fps, max:
258 fps
fps
50%
NVIDIA GeForce RTX 3050:
65.3 [X] PNY GeForce RTX 3050 XLR8 AMD Ryzen 9 7950X 4.5GHz
NVIDIA GeForce RTX 3050
min:
33.6 fps, P0.1:
35.4 fps, P1:
36.2 fps, max:
286 fps
fps
77%
GeForce RTX 3080 Laptop GPU:
94.8 [X] Acemagic Tank03 Intel Core i9-12900H 1.8GHz
GeForce RTX 3080 Laptop GPU
min:
44 fps, P0.1:
50 fps, P1:
57.5 fps, max:
197.8 fps
105.1 [X] XMG Neo 15 @165 W TGP Intel Core i7-11800H 2.3GHz
GeForce RTX 3080 Laptop GPU
min:
37.9 fps, P0.1:
50.8 fps, P1:
65.8 fps, max:
236 fps
~ 100 fps
100%
NVIDIA GeForce RTX 3070:
63.9 [X] Desktop-PC Intel Core i9-12900K 3.2GHz
NVIDIA GeForce RTX 3070
min:
17.8 fps, P0.1:
30.9 fps, P1:
37 fps, max:
218 fps
fps
47%
NVIDIA GeForce RTX 3050:
30.3 [X] PNY GeForce RTX 3050 XLR8 AMD Ryzen 9 7950X 4.5GHz
NVIDIA GeForce RTX 3050
min:
15.4 fps, P0.1:
15.4 fps, P1:
15.7 fps, max:
260 fps
fps
78%
GeForce RTX 3080 Laptop GPU:
47.1 [X] Acemagic Tank03 Intel Core i9-12900H 1.8GHz
GeForce RTX 3080 Laptop GPU
min:
24.8 fps, P0.1:
25.3 fps, P1:
26.3 fps, max:
184.6 fps
52.1 [X] XMG Neo 15 @165 W TGP Intel Core i7-11800H 2.3GHz
GeForce RTX 3080 Laptop GPU
min:
16.9 fps, P0.1:
27.1 fps, P1:
29.4 fps, max:
215 fps
~ 50 fps
100%
NVIDIA GeForce RTX 3070:
248 fps
58%
NVIDIA GeForce RTX 3050:
142.6 [X] PNY GeForce RTX 3050 XLR8 AMD Ryzen 9 7950X 4.5GHz
NVIDIA GeForce RTX 3050
fps
83%
GeForce RTX 3080 Laptop GPU:
205 208 ~ 207 fps
100%
NVIDIA GeForce RTX 3070:
204 221 [X] Desktop-PC Intel Core i9-12900K 3.2GHz
NVIDIA GeForce RTX 3070
~ 213 fps
53%
NVIDIA GeForce RTX 3050:
112.5 [X] PNY GeForce RTX 3050 XLR8 AMD Ryzen 9 7950X 4.5GHz
NVIDIA GeForce RTX 3050
fps
84%
GeForce RTX 3080 Laptop GPU:
167.9 191 [X] XMG Neo 15 @165 W TGP Intel Core i7-11800H 2.3GHz
GeForce RTX 3080 Laptop GPU
~ 179 fps
100%
NVIDIA GeForce RTX 3070:
145.8 155 [X] Desktop-PC Intel Core i9-12900K 3.2GHz
NVIDIA GeForce RTX 3070
~ 150 fps
49%
NVIDIA GeForce RTX 3050:
73.6 [X] PNY GeForce RTX 3050 XLR8 AMD Ryzen 9 7950X 4.5GHz
NVIDIA GeForce RTX 3050
fps
81%
GeForce RTX 3080 Laptop GPU:
113.2 131 [X] XMG Neo 15 @165 W TGP Intel Core i7-11800H 2.3GHz
GeForce RTX 3080 Laptop GPU
~ 122 fps
100%
NVIDIA GeForce RTX 3070:
113.9 121 [X] Desktop-PC Intel Core i9-12900K 3.2GHz
NVIDIA GeForce RTX 3070
~ 117 fps
48%
NVIDIA GeForce RTX 3050:
56.3 [X] PNY GeForce RTX 3050 XLR8 AMD Ryzen 9 7950X 4.5GHz
NVIDIA GeForce RTX 3050
fps
81%
GeForce RTX 3080 Laptop GPU:
88.3 102 [X] XMG Neo 15 @165 W TGP Intel Core i7-11800H 2.3GHz
GeForce RTX 3080 Laptop GPU
~ 95 fps
100%
NVIDIA GeForce RTX 3070:
80.7 85 [X] Desktop-PC Intel Core i9-12900K 3.2GHz
NVIDIA GeForce RTX 3070
~ 83 fps
47%
NVIDIA GeForce RTX 3050:
39 [X] PNY GeForce RTX 3050 XLR8 AMD Ryzen 9 7950X 4.5GHz
NVIDIA GeForce RTX 3050
fps
81%
GeForce RTX 3080 Laptop GPU:
62.9 70.6 [X] XMG Neo 15 @165 W TGP Intel Core i7-11800H 2.3GHz
GeForce RTX 3080 Laptop GPU
~ 67 fps
100%
NVIDIA GeForce RTX 3070:
44.4 46.4 [X] Desktop-PC Intel Core i9-12900K 3.2GHz
NVIDIA GeForce RTX 3070
~ 45 fps
46%
NVIDIA GeForce RTX 3050:
20.5 [X] PNY GeForce RTX 3050 XLR8 AMD Ryzen 9 7950X 4.5GHz
NVIDIA GeForce RTX 3050
fps
80%
GeForce RTX 3080 Laptop GPU:
34 38.5 [X] XMG Neo 15 @165 W TGP Intel Core i7-11800H 2.3GHz
GeForce RTX 3080 Laptop GPU
~ 36 fps
100%
NVIDIA GeForce RTX 3070:
146.7 fps
72%
NVIDIA GeForce RTX 3050:
105.8 [X] PNY GeForce RTX 3050 XLR8 AMD Ryzen 9 7950X 4.5GHz
NVIDIA GeForce RTX 3050
fps
85%
GeForce RTX 3080 Laptop GPU:
115.7 [X] Acemagic Tank03 1.6
Intel Core i9-12900H 1.8GHz
GeForce RTX 3080 Laptop GPU
min:
39.3 fps, max:
155.8 fps
133.9 [X] MSI GE76 Raider 11UH-472US 1.61
Intel Core i9-11980HK 3.3GHz
GeForce RTX 3080 Laptop GPU
min:
60.6 fps, max:
206 fps
~ 125 fps
100%
NVIDIA GeForce RTX 3070:
133 [X] MSI GeForce RTX 3070 Ventus 3X Intel Core i9-9900K 3.6GHz
NVIDIA GeForce RTX 3070
min:
53 fps
145.1 ~ 139 fps
59%
NVIDIA GeForce RTX 3050:
82.7 [X] PNY GeForce RTX 3050 XLR8 AMD Ryzen 9 7950X 4.5GHz
NVIDIA GeForce RTX 3050
fps
76%
GeForce RTX 3080 Laptop GPU:
96.2 [X] Acemagic Tank03 1.6
Intel Core i9-12900H 1.8GHz
GeForce RTX 3080 Laptop GPU
min:
39.9 fps, max:
145.4 fps
116.5 [X] MSI GE76 Raider 11UH-472US 1.61
Intel Core i9-11980HK 3.3GHz
GeForce RTX 3080 Laptop GPU
min:
38.2 fps, max:
179.4 fps
~ 106 fps
100%
NVIDIA GeForce RTX 3070:
116 [X] MSI GeForce RTX 3070 Ventus 3X Intel Core i9-9900K 3.6GHz
NVIDIA GeForce RTX 3070
min:
72 fps
136 ~ 126 fps
48%
NVIDIA GeForce RTX 3050:
61.1 [X] PNY GeForce RTX 3050 XLR8 AMD Ryzen 9 7950X 4.5GHz
NVIDIA GeForce RTX 3050
fps
72%
GeForce RTX 3080 Laptop GPU:
83.4 [X] Acemagic Tank03 1.6
Intel Core i9-12900H 1.8GHz
GeForce RTX 3080 Laptop GPU
min:
44.9 fps, max:
124.2 fps
99.1 [X] MSI GE76 Raider 11UH-472US 1.61
Intel Core i9-11980HK 3.3GHz
GeForce RTX 3080 Laptop GPU
min:
60 fps, max:
157.9 fps
~ 91 fps
100%
NVIDIA GeForce RTX 3070:
90.3 114 [X] MSI GeForce RTX 3070 Ventus 3X Intel Core i9-9900K 3.6GHz
NVIDIA GeForce RTX 3070
min:
69 fps
~ 102 fps
59%
NVIDIA GeForce RTX 3050:
60.5 [X] PNY GeForce RTX 3050 XLR8 AMD Ryzen 9 7950X 4.5GHz
NVIDIA GeForce RTX 3050
fps
81%
GeForce RTX 3080 Laptop GPU:
75.6 [X] Acemagic Tank03 1.6
Intel Core i9-12900H 1.8GHz
GeForce RTX 3080 Laptop GPU
min:
41.4 fps, max:
124.3 fps
89.8 [X] MSI GE76 Raider 11UH-472US 1.61
Intel Core i9-11980HK 3.3GHz
GeForce RTX 3080 Laptop GPU
min:
46.3 fps, max:
150.6 fps
~ 83 fps
100%
NVIDIA GeForce RTX 3070:
60.6 62.7 [X] MSI GeForce RTX 3070 Ventus 3X Intel Core i9-9900K 3.6GHz
NVIDIA GeForce RTX 3070
min:
43 fps
~ 62 fps
48%
NVIDIA GeForce RTX 3050:
29.8 [X] PNY GeForce RTX 3050 XLR8 AMD Ryzen 9 7950X 4.5GHz
NVIDIA GeForce RTX 3050
fps
77%
GeForce RTX 3080 Laptop GPU:
47.9 [X] Acemagic Tank03 1.6
Intel Core i9-12900H 1.8GHz
GeForce RTX 3080 Laptop GPU
min:
30.9 fps, max:
82.5 fps
fps
100%
NVIDIA GeForce RTX 3070:
29 30.2 [X] MSI GeForce RTX 3070 Ventus 3X Intel Core i9-9900K 3.6GHz
NVIDIA GeForce RTX 3070
min:
21 fps
~ 30 fps
41%
NVIDIA GeForce RTX 3050:
12.2 [X] PNY GeForce RTX 3050 XLR8 AMD Ryzen 9 7950X 4.5GHz
NVIDIA GeForce RTX 3050
fps
77%
GeForce RTX 3080 Laptop GPU:
23 [X] Acemagic Tank03 1.6
Intel Core i9-12900H 1.8GHz
GeForce RTX 3080 Laptop GPU
min:
12.1 fps, max:
36.9 fps
fps
100%
NVIDIA GeForce RTX 3070:
97 [X] MSI GeForce RTX 3070 Ventus 3X Intel Core i9-9900K 3.6GHz
NVIDIA GeForce RTX 3070
min:
36.9 fps, P0.1:
43.2 fps, P1:
70.7 fps, max:
139 fps
fps
101%
GeForce RTX 3080 Laptop GPU:
97.9 [X] XMG Neo 15 @165 W TGP Intel Core i7-11800H 2.3GHz
GeForce RTX 3080 Laptop GPU
min:
32 fps, P0.1:
48.5 fps, P1:
68.9 fps, max:
152 fps
fps
100%
NVIDIA GeForce RTX 3070:
87.2 [X] MSI GeForce RTX 3070 Ventus 3X Intel Core i9-9900K 3.6GHz
NVIDIA GeForce RTX 3070
min:
22.1 fps, P0.1:
54.4 fps, P1:
66 fps, max:
127 fps
fps
101%
GeForce RTX 3080 Laptop GPU:
88.1 [X] XMG Neo 15 @165 W TGP Intel Core i7-11800H 2.3GHz
GeForce RTX 3080 Laptop GPU
min:
32.7 fps, P0.1:
38.5 fps, P1:
67.6 fps, max:
137 fps
fps
100%
NVIDIA GeForce RTX 3070:
82.8 [X] MSI GeForce RTX 3070 Ventus 3X Intel Core i9-9900K 3.6GHz
NVIDIA GeForce RTX 3070
min:
32.7 fps, P0.1:
39 fps, P1:
62.3 fps, max:
121 fps
fps
102%
GeForce RTX 3080 Laptop GPU:
84.8 [X] XMG Neo 15 @165 W TGP Intel Core i7-11800H 2.3GHz
GeForce RTX 3080 Laptop GPU
min:
36.5 fps, P0.1:
45.1 fps, P1:
63.6 fps, max:
136 fps
fps
100%
NVIDIA GeForce RTX 3070:
74.9 [X] MSI GeForce RTX 3070 Ventus 3X Intel Core i9-9900K 3.6GHz
NVIDIA GeForce RTX 3070
min:
45.2 fps, P0.1:
47.6 fps, P1:
52.6 fps, max:
108 fps
fps
88%
GeForce RTX 3080 Laptop GPU:
65.9 [X] XMG Neo 15 @165 W TGP Intel Core i7-11800H 2.3GHz
GeForce RTX 3080 Laptop GPU
min:
41.6 fps, P0.1:
49.8 fps, P1:
55.5 fps, max:
88.8 fps
fps
100%
NVIDIA GeForce RTX 3070:
44.9 [X] MSI GeForce RTX 3070 Ventus 3X Intel Core i9-9900K 3.6GHz
NVIDIA GeForce RTX 3070
min:
22.3 fps, P0.1:
30.2 fps, P1:
37.3 fps, max:
81.3 fps
fps
86%
GeForce RTX 3080 Laptop GPU:
38.7 [X] XMG Neo 15 @165 W TGP Intel Core i7-11800H 2.3GHz
GeForce RTX 3080 Laptop GPU
min:
30.2 fps, P0.1:
31.7 fps, P1:
33.6 fps, max:
54.1 fps
fps
100%
NVIDIA GeForce RTX 3070:
249 fps
76%
NVIDIA GeForce RTX 3050:
188.5 [X] PNY GeForce RTX 3050 XLR8 712825
AMD Ryzen 9 7950X 4.5GHz
NVIDIA GeForce RTX 3050
min:
59.7 fps, max:
350 fps
fps
62%
GeForce RTX 3080 Laptop GPU:
154.5 [X] Acemagic Tank03 800660
Intel Core i9-12900H 1.8GHz
GeForce RTX 3080 Laptop GPU
min:
70 fps, max:
311 fps
fps
100%
NVIDIA GeForce RTX 3070:
154 [X] MSI GeForce RTX 3070 Ventus 3X Intel Core i9-9900K 3.6GHz
NVIDIA GeForce RTX 3070
min:
117 fps
224 ~ 189 fps
76%
NVIDIA GeForce RTX 3050:
144.2 [X] PNY GeForce RTX 3050 XLR8 712825
AMD Ryzen 9 7950X 4.5GHz
NVIDIA GeForce RTX 3050
min:
72.2 fps, max:
296 fps
fps
93%
GeForce RTX 3080 Laptop GPU:
139.9 [X] Acemagic Tank03 800660
Intel Core i9-12900H 1.8GHz
GeForce RTX 3080 Laptop GPU
min:
60.7 fps, max:
283 fps
210 [X] XMG Neo 15 @165 W TGP Intel Core i7-11800H 2.3GHz
GeForce RTX 3080 Laptop GPU
min:
164 fps
~ 175 fps
100%
NVIDIA GeForce RTX 3070:
134 [X] MSI GeForce RTX 3070 Ventus 3X Intel Core i9-9900K 3.6GHz
NVIDIA GeForce RTX 3070
min:
105 fps
198 ~ 166 fps
70%
NVIDIA GeForce RTX 3050:
116.6 [X] PNY GeForce RTX 3050 XLR8 712825
AMD Ryzen 9 7950X 4.5GHz
NVIDIA GeForce RTX 3050
min:
69 fps, max:
239 fps
fps
91%
GeForce RTX 3080 Laptop GPU:
131 [X] Acemagic Tank03 800660
Intel Core i9-12900H 1.8GHz
GeForce RTX 3080 Laptop GPU
min:
62 fps, max:
247 fps
171 [X] XMG Neo 15 @165 W TGP Intel Core i7-11800H 2.3GHz
GeForce RTX 3080 Laptop GPU
min:
134 fps
~ 151 fps
100%
NVIDIA GeForce RTX 3070:
123 [X] MSI GeForce RTX 3070 Ventus 3X Intel Core i9-9900K 3.6GHz
NVIDIA GeForce RTX 3070
min:
100 fps
151 ~ 137 fps
63%
NVIDIA GeForce RTX 3050:
85.7 [X] PNY GeForce RTX 3050 XLR8 712825
AMD Ryzen 9 7950X 4.5GHz
NVIDIA GeForce RTX 3050
min:
56 fps, max:
177.6 fps
fps
88%
GeForce RTX 3080 Laptop GPU:
115.8 [X] Acemagic Tank03 800660
Intel Core i9-12900H 1.8GHz
GeForce RTX 3080 Laptop GPU
min:
62.1 fps, max:
196.4 fps
127 [X] XMG Neo 15 @165 W TGP Intel Core i7-11800H 2.3GHz
GeForce RTX 3080 Laptop GPU
min:
94 fps
~ 121 fps
100%
NVIDIA GeForce RTX 3070:
121 [X] MSI GeForce RTX 3070 Ventus 3X Intel Core i9-9900K 3.6GHz
NVIDIA GeForce RTX 3070
min:
92 fps
127 ~ 124 fps
54%
NVIDIA GeForce RTX 3050:
67.3 [X] PNY GeForce RTX 3050 XLR8 712825
AMD Ryzen 9 7950X 4.5GHz
NVIDIA GeForce RTX 3050
min:
39.9 fps, max:
222 fps
fps
81%
GeForce RTX 3080 Laptop GPU:
97.7 [X] Acemagic Tank03 800660
Intel Core i9-12900H 1.8GHz
GeForce RTX 3080 Laptop GPU
min:
49.5 fps, max:
154.9 fps
103 [X] XMG Neo 15 @165 W TGP Intel Core i7-11800H 2.3GHz
GeForce RTX 3080 Laptop GPU
min:
81 fps
~ 100 fps
100%
NVIDIA GeForce RTX 3070:
80.4 [X] MSI GeForce RTX 3070 Ventus 3X Intel Core i9-9900K 3.6GHz
NVIDIA GeForce RTX 3070
min:
64 fps
84 ~ 82 fps
51%
NVIDIA GeForce RTX 3050:
42 [X] PNY GeForce RTX 3050 XLR8 712825
AMD Ryzen 9 7950X 4.5GHz
NVIDIA GeForce RTX 3050
min:
35.5 fps, max:
52.2 fps
fps
80%
GeForce RTX 3080 Laptop GPU:
64.6 [X] Acemagic Tank03 800660
Intel Core i9-12900H 1.8GHz
GeForce RTX 3080 Laptop GPU
min:
43.7 fps, max:
138.5 fps
67.8 [X] XMG Neo 15 @165 W TGP Intel Core i7-11800H 2.3GHz
GeForce RTX 3080 Laptop GPU
min:
55 fps
~ 66 fps
NVIDIA GeForce RTX 3050:
60 [X] PNY GeForce RTX 3050 XLR8 AMD Ryzen 9 7950X 4.5GHz
NVIDIA GeForce RTX 3050
min:
35.2 fps, P0.1:
40.8 fps, P1:
55.8 fps, max:
136.6 fps
fps
100%
NVIDIA GeForce RTX 3070:
59.3 [X] MSI GeForce RTX 3070 Ventus 3X Intel Core i9-9900K 3.6GHz
NVIDIA GeForce RTX 3070
min:
33.3 fps, P0.1:
37.2 fps, P1:
44.9 fps, max:
84.1 fps
fps
101%
NVIDIA GeForce RTX 3050:
60 [X] PNY GeForce RTX 3050 XLR8 AMD Ryzen 9 7950X 4.5GHz
NVIDIA GeForce RTX 3050
min:
35.8 fps, P0.1:
41.8 fps, P1:
56.2 fps, max:
122.3 fps
fps
100%
GeForce RTX 3080 Laptop GPU:
59.5 [X] XMG Neo 15 @165 W TGP Intel Core i7-11800H 2.3GHz
GeForce RTX 3080 Laptop GPU
min:
35 fps, P0.1:
37.7 fps, P1:
45.4 fps, max:
98.2 fps
fps
100%
NVIDIA GeForce RTX 3070:
58.8 [X] MSI GeForce RTX 3070 Ventus 3X Intel Core i9-9900K 3.6GHz
NVIDIA GeForce RTX 3070
min:
28.9 fps, P0.1:
31.9 fps, P1:
39.3 fps, max:
88.4 fps
fps
102%
NVIDIA GeForce RTX 3050:
60 [X] PNY GeForce RTX 3050 XLR8 AMD Ryzen 9 7950X 4.5GHz
NVIDIA GeForce RTX 3050
min:
34.6 fps, P0.1:
41.8 fps, P1:
55.9 fps, max:
138.2 fps
fps
101%
GeForce RTX 3080 Laptop GPU:
59.2 [X] XMG Neo 15 @165 W TGP Intel Core i7-11800H 2.3GHz
GeForce RTX 3080 Laptop GPU
min:
34 fps, P0.1:
34.5 fps, P1:
43.5 fps, max:
91 fps
fps
100%
NVIDIA GeForce RTX 3070:
58.6 [X] MSI GeForce RTX 3070 Ventus 3X Intel Core i9-9900K 3.6GHz
NVIDIA GeForce RTX 3070
min:
32.4 fps, P0.1:
33.3 fps, P1:
38.4 fps, max:
78.6 fps
fps
102%
NVIDIA GeForce RTX 3050:
60 [X] PNY GeForce RTX 3050 XLR8 AMD Ryzen 9 7950X 4.5GHz
NVIDIA GeForce RTX 3050
min:
36.2 fps, P0.1:
42.3 fps, P1:
54.9 fps, max:
115.1 fps
fps
101%
GeForce RTX 3080 Laptop GPU:
59.1 [X] XMG Neo 15 @165 W TGP Intel Core i7-11800H 2.3GHz
GeForce RTX 3080 Laptop GPU
min:
34.2 fps, P0.1:
35.8 fps, P1:
42.8 fps, max:
86.1 fps
fps
100%
NVIDIA GeForce RTX 3070:
58.5 [X] MSI GeForce RTX 3070 Ventus 3X Intel Core i9-9900K 3.6GHz
NVIDIA GeForce RTX 3070
min:
28.4 fps, P0.1:
29.4 fps, P1:
38.5 fps, max:
83.5 fps
fps
88%
NVIDIA GeForce RTX 3050:
51.6 [X] PNY GeForce RTX 3050 XLR8 AMD Ryzen 9 7950X 4.5GHz
NVIDIA GeForce RTX 3050
min:
31.7 fps, P0.1:
35.7 fps, P1:
44.8 fps, max:
111.1 fps
fps
101%
GeForce RTX 3080 Laptop GPU:
59 [X] XMG Neo 15 @165 W TGP Intel Core i7-11800H 2.3GHz
GeForce RTX 3080 Laptop GPU
min:
32.6 fps, P0.1:
34.9 fps, P1:
41.8 fps, max:
91.4 fps
fps
100%
NVIDIA GeForce RTX 3070:
57.1 [X] MSI GeForce RTX 3070 Ventus 3X Intel Core i9-9900K 3.6GHz
NVIDIA GeForce RTX 3070
min:
29.1 fps, P0.1:
29.2 fps, P1:
36.9 fps, max:
79.3 fps
fps
54%
NVIDIA GeForce RTX 3050:
31.1 [X] PNY GeForce RTX 3050 XLR8 AMD Ryzen 9 7950X 4.5GHz
NVIDIA GeForce RTX 3050
min:
22.4 fps, P0.1:
24.6 fps, P1:
27.3 fps, max:
54.5 fps
fps
89%
GeForce RTX 3080 Laptop GPU:
50.7 [X] XMG Neo 15 @165 W TGP Intel Core i7-11800H 2.3GHz
GeForce RTX 3080 Laptop GPU
min:
20.4 fps, P0.1:
28.5 fps, P1:
37 fps, max:
85.1 fps
fps
NVIDIA GeForce RTX 3050:
64 [X] AMD Ryzen 9 5900X 3.7GHz
NVIDIA GeForce RTX 3050
min:
26.9 fps, P0.1:
38.5 fps, P1:
56.8 fps, max:
77.7 fps
fps
100%
NVIDIA GeForce RTX 3070:
108 [X] MSI GeForce RTX 3070 Ventus 3X Intel Core i9-9900K 3.6GHz
NVIDIA GeForce RTX 3070
min:
51.2 fps, P0.1:
59.5 fps, P1:
92 fps, max:
146 fps
fps
50%
NVIDIA GeForce RTX 3050:
54.3 [X] AMD Ryzen 9 5900X 3.7GHz
NVIDIA GeForce RTX 3050
min:
21.5 fps, P0.1:
27.3 fps, P1:
50.1 fps, max:
64.1 fps
fps
92%
GeForce RTX 3080 Laptop GPU:
99.6 [X] XMG Neo 15 @165 W TGP Intel Core i7-11800H 2.3GHz
GeForce RTX 3080 Laptop GPU
min:
42.7 fps, P0.1:
72.3 fps, P1:
88.7 fps, max:
122 fps
fps
100%
NVIDIA GeForce RTX 3070:
97.8 [X] MSI GeForce RTX 3070 Ventus 3X Intel Core i9-9900K 3.6GHz
NVIDIA GeForce RTX 3070
min:
52.8 fps, P0.1:
57.1 fps, P1:
86.1 fps, max:
133 fps
fps
49%
NVIDIA GeForce RTX 3050:
48.3 [X] AMD Ryzen 9 5900X 3.7GHz
NVIDIA GeForce RTX 3050
min:
23 fps, P0.1:
23.9 fps, P1:
44.7 fps, max:
56.8 fps
fps
89%
GeForce RTX 3080 Laptop GPU:
87.3 [X] XMG Neo 15 @165 W TGP Intel Core i7-11800H 2.3GHz
GeForce RTX 3080 Laptop GPU
min:
39.7 fps, P0.1:
70.6 fps, P1:
79.6 fps, max:
103 fps
fps
100%
NVIDIA GeForce RTX 3070:
70.1 [X] MSI GeForce RTX 3070 Ventus 3X Intel Core i9-9900K 3.6GHz
NVIDIA GeForce RTX 3070
min:
46.9 fps, P0.1:
55.6 fps, P1:
65.1 fps, max:
83.4 fps
fps
47%
NVIDIA GeForce RTX 3050:
32.6 [X] AMD Ryzen 9 5900X 3.7GHz
NVIDIA GeForce RTX 3050
min:
20.1 fps, P0.1:
20.2 fps, P1:
30.3 fps, max:
39.2 fps
fps
88%
GeForce RTX 3080 Laptop GPU:
61.8 [X] XMG Neo 15 @165 W TGP Intel Core i7-11800H 2.3GHz
GeForce RTX 3080 Laptop GPU
min:
32.9 fps, P0.1:
44.9 fps, P1:
56.3 fps, max:
72.9 fps
fps
100%
NVIDIA GeForce RTX 3070:
38.2 [X] MSI GeForce RTX 3070 Ventus 3X Intel Core i9-9900K 3.6GHz
NVIDIA GeForce RTX 3070
min:
28 fps, P0.1:
28.7 fps, P1:
34.4 fps, max:
46.1 fps
fps
43%
NVIDIA GeForce RTX 3050:
16.5 [X] AMD Ryzen 9 5900X 3.7GHz
NVIDIA GeForce RTX 3050
min:
11.7 fps, P0.1:
11.8 fps, P1:
15.2 fps, max:
20.4 fps
fps
89%
GeForce RTX 3080 Laptop GPU:
34 [X] XMG Neo 15 @165 W TGP Intel Core i7-11800H 2.3GHz
GeForce RTX 3080 Laptop GPU
min:
20.1 fps, P0.1:
22.2 fps, P1:
31.1 fps, max:
39.8 fps
fps
NVIDIA GeForce RTX 3050:
169 [X] AMD Ryzen 9 5900X 3.7GHz
NVIDIA GeForce RTX 3050
fps
100%
NVIDIA GeForce RTX 3070:
266 [X] MSI GeForce RTX 3070 Ventus 3X Intel Core i9-9900K 3.6GHz
NVIDIA GeForce RTX 3070
min:
205 fps
fps
51%
NVIDIA GeForce RTX 3050:
135 [X] AMD Ryzen 9 5900X 3.7GHz
NVIDIA GeForce RTX 3050
fps
84%
GeForce RTX 3080 Laptop GPU:
223 [X] XMG Neo 15 @165 W TGP Intel Core i7-11800H 2.3GHz
GeForce RTX 3080 Laptop GPU
min:
171 fps
fps
100%
NVIDIA GeForce RTX 3070:
259 [X] MSI GeForce RTX 3070 Ventus 3X Intel Core i9-9900K 3.6GHz
NVIDIA GeForce RTX 3070
min:
200 fps
fps
51%
NVIDIA GeForce RTX 3050:
132 [X] AMD Ryzen 9 5900X 3.7GHz
NVIDIA GeForce RTX 3050
fps
84%
GeForce RTX 3080 Laptop GPU:
218 [X] XMG Neo 15 @165 W TGP Intel Core i7-11800H 2.3GHz
GeForce RTX 3080 Laptop GPU
min:
161 fps
fps
100%
NVIDIA GeForce RTX 3070:
199 [X] MSI GeForce RTX 3070 Ventus 3X Intel Core i9-9900K 3.6GHz
NVIDIA GeForce RTX 3070
min:
113 fps
fps
51%
NVIDIA GeForce RTX 3050:
102 [X] AMD Ryzen 9 5900X 3.7GHz
NVIDIA GeForce RTX 3050
fps
85%
GeForce RTX 3080 Laptop GPU:
170 [X] XMG Neo 15 @165 W TGP Intel Core i7-11800H 2.3GHz
GeForce RTX 3080 Laptop GPU
min:
104 fps
fps
100%
NVIDIA GeForce RTX 3070:
132 [X] MSI GeForce RTX 3070 Ventus 3X Intel Core i9-9900K 3.6GHz
NVIDIA GeForce RTX 3070
min:
74 fps
fps
50%
NVIDIA GeForce RTX 3050:
66 [X] AMD Ryzen 9 5900X 3.7GHz
NVIDIA GeForce RTX 3050
fps
84%
GeForce RTX 3080 Laptop GPU:
111 [X] XMG Neo 15 @165 W TGP Intel Core i7-11800H 2.3GHz
GeForce RTX 3080 Laptop GPU
min:
59 fps
fps
100%
NVIDIA GeForce RTX 3070:
68 [X] MSI GeForce RTX 3070 Ventus 3X Intel Core i9-9900K 3.6GHz
NVIDIA GeForce RTX 3070
min:
35 fps
fps
49%
NVIDIA GeForce RTX 3050:
33 [X] AMD Ryzen 9 5900X 3.7GHz
NVIDIA GeForce RTX 3050
fps
84%
GeForce RTX 3080 Laptop GPU:
57 [X] XMG Neo 15 @165 W TGP Intel Core i7-11800H 2.3GHz
GeForce RTX 3080 Laptop GPU
min:
29 fps
fps
100%
NVIDIA GeForce RTX 3070:
142.3 142.3 ~ 142 fps
67%
NVIDIA GeForce RTX 3050:
88.6 [X] AMD Ryzen 9 5900X 3.7GHz
NVIDIA GeForce RTX 3050
min:
21.2 fps, P0.1:
53.6 fps, P1:
76.6 fps, max:
228 fps
100.7 [X] PNY GeForce RTX 3050 XLR8 AMD Ryzen 9 7950X 4.5GHz
NVIDIA GeForce RTX 3050
min:
61.5 fps, P0.1:
67.8 fps, P1:
87.9 fps, max:
206 fps
~ 95 fps
93%
GeForce RTX 3080 Laptop GPU:
131.7 [X] Acemagic Tank03 Intel Core i9-12900H 1.8GHz
GeForce RTX 3080 Laptop GPU
min:
77.2 fps, P0.1:
87.5 fps, P1:
97.4 fps, max:
247 fps
fps
100%
NVIDIA GeForce RTX 3070:
132 [X] MSI GeForce RTX 3070 Ventus 3X Intel Core i9-9900K 3.6GHz
NVIDIA GeForce RTX 3070
min:
62.7 fps, P0.1:
81.9 fps, P1:
97.3 fps, max:
231 fps
140.5 140.5 ~ 138 fps
57%
NVIDIA GeForce RTX 3050:
73.2 [X] AMD Ryzen 9 5900X 3.7GHz
NVIDIA GeForce RTX 3050
min:
41.2 fps, P0.1:
58.9 fps, P1:
65 fps, max:
192 fps
84.4 [X] PNY GeForce RTX 3050 XLR8 AMD Ryzen 9 7950X 4.5GHz
NVIDIA GeForce RTX 3050
min:
41.6 fps, P0.1:
49.1 fps, P1:
74 fps, max:
230 fps
~ 79 fps
83%
GeForce RTX 3080 Laptop GPU:
112.3 [X] Acemagic Tank03 Intel Core i9-12900H 1.8GHz
GeForce RTX 3080 Laptop GPU
min:
59.2 fps, P0.1:
79.2 fps, P1:
87.8 fps, max:
242 fps
116 [X] XMG Neo 15 @165 W TGP Intel Core i7-11800H 2.3GHz
GeForce RTX 3080 Laptop GPU
min:
42.2 fps, P0.1:
65.5 fps, P1:
86.9 fps, max:
309 fps
~ 114 fps
100%
NVIDIA GeForce RTX 3070:
116 [X] MSI GeForce RTX 3070 Ventus 3X Intel Core i9-9900K 3.6GHz
NVIDIA GeForce RTX 3070
min:
51.1 fps, P0.1:
71.5 fps, P1:
86.5 fps, max:
247 fps
117.8 117.8 ~ 117 fps
53%
NVIDIA GeForce RTX 3050:
57.2 [X] AMD Ryzen 9 5900X 3.7GHz
NVIDIA GeForce RTX 3050
min:
43.3 fps, P0.1:
46.3 fps, P1:
51.4 fps, max:
82.2 fps
66.2 [X] PNY GeForce RTX 3050 XLR8 AMD Ryzen 9 7950X 4.5GHz
NVIDIA GeForce RTX 3050
min:
32.2 fps, P0.1:
41.9 fps, P1:
58.1 fps, max:
304 fps
~ 62 fps
80%
GeForce RTX 3080 Laptop GPU:
91 [X] Acemagic Tank03 Intel Core i9-12900H 1.8GHz
GeForce RTX 3080 Laptop GPU
min:
59.8 fps, P0.1:
63.7 fps, P1:
75.7 fps, max:
174.8 fps
96.1 [X] XMG Neo 15 @165 W TGP Intel Core i7-11800H 2.3GHz
GeForce RTX 3080 Laptop GPU
min:
52.5 fps, P0.1:
64.9 fps, P1:
76.2 fps, max:
196 fps
~ 94 fps
100%
NVIDIA GeForce RTX 3070:
83.5 83.5 83.6 [X] MSI GeForce RTX 3070 Ventus 3X Intel Core i9-9900K 3.6GHz
NVIDIA GeForce RTX 3070
min:
56.7 fps, P0.1:
61 fps, P1:
68.7 fps, max:
123 fps
~ 84 fps
49%
NVIDIA GeForce RTX 3050:
38.2 [X] AMD Ryzen 9 5900X 3.7GHz
NVIDIA GeForce RTX 3050
min:
27.3 fps, P0.1:
29 fps, P1:
33.4 fps, max:
54 fps
44 [X] PNY GeForce RTX 3050 XLR8 AMD Ryzen 9 7950X 4.5GHz
NVIDIA GeForce RTX 3050
min:
30.1 fps, P0.1:
32.3 fps, P1:
38 fps, max:
77.2 fps
~ 41 fps
79%
GeForce RTX 3080 Laptop GPU:
65.3 [X] Acemagic Tank03 Intel Core i9-12900H 1.8GHz
GeForce RTX 3080 Laptop GPU
min:
45.8 fps, P0.1:
51.3 fps, P1:
54.5 fps, max:
153.6 fps
67.5 [X] XMG Neo 15 @165 W TGP Intel Core i7-11800H 2.3GHz
GeForce RTX 3080 Laptop GPU
min:
45 fps, P0.1:
55.2 fps, P1:
58.3 fps, max:
128 fps
~ 66 fps
100%
NVIDIA GeForce RTX 3070:
69 [X] MSI GeForce RTX 3070 Ventus 3X Intel Core i9-9900K 3.6GHz
NVIDIA GeForce RTX 3070
min:
49.7 fps, P0.1:
54.6 fps, P1:
58.6 fps, max:
102 fps
69.3 69.3 ~ 69 fps
51%
NVIDIA GeForce RTX 3050:
32.6 [X] AMD Ryzen 9 5900X 3.7GHz
NVIDIA GeForce RTX 3050
min:
25.8 fps, P0.1:
28.2 fps, P1:
29.3 fps, max:
40.6 fps
36.6 [X] PNY GeForce RTX 3050 XLR8 AMD Ryzen 9 7950X 4.5GHz
NVIDIA GeForce RTX 3050
min:
26.1 fps, P0.1:
30 fps, P1:
32.7 fps, max:
55.9 fps
~ 35 fps
81%
GeForce RTX 3080 Laptop GPU:
55.6 [X] Acemagic Tank03 Intel Core i9-12900H 1.8GHz
GeForce RTX 3080 Laptop GPU
min:
41.8 fps, P0.1:
47 fps, P1:
48.4 fps, max:
70.2 fps
56.1 [X] XMG Neo 15 @165 W TGP Intel Core i7-11800H 2.3GHz
GeForce RTX 3080 Laptop GPU
min:
42.3 fps, P0.1:
46.3 fps, P1:
49.3 fps, max:
101 fps
~ 56 fps
100%
NVIDIA GeForce RTX 3070:
47.1 [X] MSI GeForce RTX 3070 Ventus 3X Intel Core i9-9900K 3.6GHz
NVIDIA GeForce RTX 3070
min:
38.7 fps, P0.1:
38.9 fps, P1:
41.7 fps, max:
64.3 fps
49.8 49.8 ~ 49 fps
47%
NVIDIA GeForce RTX 3050:
22.7 [X] AMD Ryzen 9 5900X 3.7GHz
NVIDIA GeForce RTX 3050
min:
19.9 fps, P0.1:
20.1 fps, P1:
20.3 fps, max:
27.5 fps
23.3 [X] PNY GeForce RTX 3050 XLR8 AMD Ryzen 9 7950X 4.5GHz
NVIDIA GeForce RTX 3050
min:
20.7 fps, P0.1:
20.7 fps, P1:
21.2 fps, max:
26.8 fps
~ 23 fps
78%
GeForce RTX 3080 Laptop GPU:
37.6 [X] Acemagic Tank03 Intel Core i9-12900H 1.8GHz
GeForce RTX 3080 Laptop GPU
min:
32.6 fps, P0.1:
33.1 fps, P1:
33.8 fps, max:
45 fps
38.7 [X] XMG Neo 15 @165 W TGP Intel Core i7-11800H 2.3GHz
GeForce RTX 3080 Laptop GPU
min:
25 fps, P0.1:
27.1 fps, P1:
34.5 fps, max:
71.6 fps
~ 38 fps
100%
NVIDIA GeForce RTX 3070:
149 [X] MSI GeForce RTX 3070 Ventus 3X Intel Core i9-9900K 3.6GHz
NVIDIA GeForce RTX 3070
min:
56.1 fps, P0.1:
81.1 fps, P1:
99 fps, max:
341 fps
fps
61%
NVIDIA GeForce RTX 3050:
90.9 [X] AMD Ryzen 9 5900X 3.7GHz
NVIDIA GeForce RTX 3050
min:
36.1 fps, P0.1:
56.2 fps, P1:
69.6 fps, max:
310 fps
fps
85%
GeForce RTX 3080 Laptop GPU:
118 133 [X] XMG Neo 15 @165 W TGP Intel Core i7-11800H 2.3GHz
GeForce RTX 3080 Laptop GPU
min:
52.3 fps, P0.1:
71.3 fps, P1:
92.6 fps, max:
314 fps
~ 126 fps
100%
NVIDIA GeForce RTX 3070:
129 [X] MSI GeForce RTX 3070 Ventus 3X Intel Core i9-9900K 3.6GHz
NVIDIA GeForce RTX 3070
min:
45.3 fps, P0.1:
73.9 fps, P1:
89.3 fps, max:
253 fps
fps
61%
NVIDIA GeForce RTX 3050:
78.5 [X] AMD Ryzen 9 5900X 3.7GHz
NVIDIA GeForce RTX 3050
min:
36.9 fps, P0.1:
42.5 fps, P1:
63 fps, max:
266 fps
fps
83%
GeForce RTX 3080 Laptop GPU:
101 113 [X] XMG Neo 15 @165 W TGP Intel Core i7-11800H 2.3GHz
GeForce RTX 3080 Laptop GPU
min:
45.6 fps, P0.1:
57.6 fps, P1:
78.7 fps, max:
232 fps
~ 107 fps
100%
NVIDIA GeForce RTX 3070:
121 [X] MSI GeForce RTX 3070 Ventus 3X Intel Core i9-9900K 3.6GHz
NVIDIA GeForce RTX 3070
min:
29.4 fps, P0.1:
51.5 fps, P1:
84.5 fps, max:
225 fps
fps
61%
NVIDIA GeForce RTX 3050:
73.8 [X] AMD Ryzen 9 5900X 3.7GHz
NVIDIA GeForce RTX 3050
min:
40.9 fps, P0.1:
46.8 fps, P1:
60.2 fps, max:
221 fps
fps
83%
GeForce RTX 3080 Laptop GPU:
96.1 106 [X] XMG Neo 15 @165 W TGP Intel Core i7-11800H 2.3GHz
GeForce RTX 3080 Laptop GPU
min:
36.3 fps, P0.1:
57 fps, P1:
76.8 fps, max:
217 fps
~ 101 fps
100%
NVIDIA GeForce RTX 3070:
92.3 [X] MSI GeForce RTX 3070 Ventus 3X Intel Core i9-9900K 3.6GHz
NVIDIA GeForce RTX 3070
min:
38.7 fps, P0.1:
52.4 fps, P1:
69.7 fps, max:
211 fps
fps
76%
NVIDIA GeForce RTX 3050:
70.4 [X] AMD Ryzen 9 5900X 3.7GHz
NVIDIA GeForce RTX 3050
min:
29.3 fps, P0.1:
41.3 fps, P1:
54.4 fps, max:
318 fps
fps
81%
GeForce RTX 3080 Laptop GPU:
70.4 79.5 [X] XMG Neo 15 @165 W TGP Intel Core i7-11800H 2.3GHz
GeForce RTX 3080 Laptop GPU
min:
44.8 fps, P0.1:
48.7 fps, P1:
60.1 fps, max:
188 fps
~ 75 fps
100%
NVIDIA GeForce RTX 3070:
52.9 [X] MSI GeForce RTX 3070 Ventus 3X Intel Core i9-9900K 3.6GHz
NVIDIA GeForce RTX 3070
min:
32.7 fps, P0.1:
35.2 fps, P1:
43 fps, max:
119 fps
fps
122%
NVIDIA GeForce RTX 3050:
64.5 [X] AMD Ryzen 9 5900X 3.7GHz
NVIDIA GeForce RTX 3050
min:
8.86 fps, P0.1:
22.5 fps, P1:
46.1 fps, max:
207 fps
fps
81%
GeForce RTX 3080 Laptop GPU:
40.2 46.2 [X] XMG Neo 15 @165 W TGP Intel Core i7-11800H 2.3GHz
GeForce RTX 3080 Laptop GPU
min:
20.7 fps, P0.1:
27.6 fps, P1:
37.5 fps, max:
129 fps
~ 43 fps
NVIDIA GeForce RTX 3050:
271 [X] AMD Ryzen 9 5900X 3.7GHz
NVIDIA GeForce RTX 3050
min:
15 fps, P0.1:
28.2 fps, P1:
153 fps, max:
369 fps
fps
100%
NVIDIA GeForce RTX 3070:
178 [X] MSI GeForce RTX 3070 Ventus 3X Intel Core i9-9900K 3.6GHz
NVIDIA GeForce RTX 3070
min:
23 fps, P0.1:
88.5 fps, P1:
134 fps, max:
269 fps
fps
89%
NVIDIA GeForce RTX 3050:
159 [X] AMD Ryzen 9 5900X 3.7GHz
NVIDIA GeForce RTX 3050
min:
8.42 fps, P0.1:
19.8 fps, P1:
102 fps, max:
255 fps
fps
106%
GeForce RTX 3080 Laptop GPU:
188 [X] XMG Neo 15 @165 W TGP Intel Core i7-11800H 2.3GHz
GeForce RTX 3080 Laptop GPU
min:
7.15 fps, P0.1:
23.7 fps, P1:
136 fps, max:
287 fps
fps
100%
NVIDIA GeForce RTX 3070:
153 [X] MSI GeForce RTX 3070 Ventus 3X Intel Core i9-9900K 3.6GHz
NVIDIA GeForce RTX 3070
min:
54.2 fps, P0.1:
79.9 fps, P1:
114 fps, max:
211 fps
fps
62%
NVIDIA GeForce RTX 3050:
95.4 [X] AMD Ryzen 9 5900X 3.7GHz
NVIDIA GeForce RTX 3050
min:
2.2 fps, P0.1:
4.48 fps, P1:
9.17 fps, max:
200 fps
fps
108%
GeForce RTX 3080 Laptop GPU:
165 [X] XMG Neo 15 @165 W TGP Intel Core i7-11800H 2.3GHz
GeForce RTX 3080 Laptop GPU
min:
19.3 fps, P0.1:
72.6 fps, P1:
123 fps, max:
231 fps
fps
100%
NVIDIA GeForce RTX 3070:
137 [X] MSI GeForce RTX 3070 Ventus 3X Intel Core i9-9900K 3.6GHz
NVIDIA GeForce RTX 3070
min:
56.6 fps, P0.1:
77 fps, P1:
94.2 fps, max:
201 fps
fps
70%
NVIDIA GeForce RTX 3050:
95.5 [X] AMD Ryzen 9 5900X 3.7GHz
NVIDIA GeForce RTX 3050
fps
104%
GeForce RTX 3080 Laptop GPU:
142 [X] XMG Neo 15 @165 W TGP Intel Core i7-11800H 2.3GHz
GeForce RTX 3080 Laptop GPU
min:
48.5 fps, P0.1:
77.5 fps, P1:
99.7 fps, max:
205 fps
fps
100%
NVIDIA GeForce RTX 3070:
135 [X] MSI GeForce RTX 3070 Ventus 3X Intel Core i9-9900K 3.6GHz
NVIDIA GeForce RTX 3070
min:
57.2 fps, P0.1:
74.1 fps, P1:
96.8 fps, max:
212 fps
fps
54%
NVIDIA GeForce RTX 3050:
73.3 [X] AMD Ryzen 9 5900X 3.7GHz
NVIDIA GeForce RTX 3050
min:
21.3 fps, P0.1:
44.5 fps, P1:
56.3 fps, max:
136 fps
fps
99%
GeForce RTX 3080 Laptop GPU:
134 [X] XMG Neo 15 @165 W TGP Intel Core i7-11800H 2.3GHz
GeForce RTX 3080 Laptop GPU
min:
18.3 fps, P0.1:
63.7 fps, P1:
97.2 fps, max:
181 fps
fps
100%
NVIDIA GeForce RTX 3070:
106 [X] MSI GeForce RTX 3070 Ventus 3X Intel Core i9-9900K 3.6GHz
NVIDIA GeForce RTX 3070
min:
42.7 fps, P0.1:
56.2 fps, P1:
76.8 fps, max:
185 fps
fps
42%
NVIDIA GeForce RTX 3050:
44.5 [X] AMD Ryzen 9 5900X 3.7GHz
NVIDIA GeForce RTX 3050
min:
17.2 fps, P0.1:
28.2 fps, P1:
36.1 fps, max:
111 fps
fps
83%
GeForce RTX 3080 Laptop GPU:
88.5 [X] XMG Neo 15 @165 W TGP Intel Core i7-11800H 2.3GHz
GeForce RTX 3080 Laptop GPU
min:
11.8 fps, P0.1:
15.4 fps, P1:
23.6 fps, max:
139 fps
fps
NVIDIA GeForce RTX 3050:
152 [X] AMD Ryzen 9 5900X 3.7GHz
NVIDIA GeForce RTX 3050
min:
20.4 fps, P0.1:
84 fps, P1:
112 fps, max:
206 fps
fps
GeForce RTX 3080 Laptop GPU:
133 fps
100%
NVIDIA GeForce RTX 3070:
132 [X] MSI GeForce RTX 3070 Ventus 3X Intel Core i9-9900K 3.6GHz
NVIDIA GeForce RTX 3070
min:
64.6 fps, P0.1:
67.4 fps, P1:
98.1 fps, max:
172 fps
fps
68%
NVIDIA GeForce RTX 3050:
89.5 [X] AMD Ryzen 9 5900X 3.7GHz
NVIDIA GeForce RTX 3050
min:
62 fps, P0.1:
65.2 fps, P1:
72.1 fps, max:
158 fps
fps
90%
GeForce RTX 3080 Laptop GPU:
110 128 [X] XMG Neo 15 @165 W TGP Intel Core i7-11800H 2.3GHz
GeForce RTX 3080 Laptop GPU
min:
14.8 fps, P0.1:
40.8 fps, P1:
70.4 fps, max:
190 fps
~ 119 fps
100%
NVIDIA GeForce RTX 3070:
126 [X] MSI GeForce RTX 3070 Ventus 3X Intel Core i9-9900K 3.6GHz
NVIDIA GeForce RTX 3070
min:
17.2 fps, P0.1:
62 fps, P1:
89.2 fps, max:
169 fps
fps
60%
NVIDIA GeForce RTX 3050:
75.7 [X] AMD Ryzen 9 5900X 3.7GHz
NVIDIA GeForce RTX 3050
min:
51 fps, P0.1:
54 fps, P1:
58.9 fps, max:
121 fps
fps
87%
GeForce RTX 3080 Laptop GPU:
99.8 119 [X] XMG Neo 15 @165 W TGP Intel Core i7-11800H 2.3GHz
GeForce RTX 3080 Laptop GPU
min:
52.1 fps, P0.1:
57.7 fps, P1:
83.8 fps, max:
178 fps
~ 109 fps
100%
NVIDIA GeForce RTX 3070:
116 [X] MSI GeForce RTX 3070 Ventus 3X Intel Core i9-9900K 3.6GHz
NVIDIA GeForce RTX 3070
min:
7.04 fps, P0.1:
31.5 fps, P1:
82 fps, max:
166 fps
fps
57%
NVIDIA GeForce RTX 3050:
65.6 [X] AMD Ryzen 9 5900X 3.7GHz
NVIDIA GeForce RTX 3050
min:
41.7 fps, P0.1:
45.6 fps, P1:
49.4 fps, max:
136 fps
fps
83%
GeForce RTX 3080 Laptop GPU:
88.7 104 [X] XMG Neo 15 @165 W TGP Intel Core i7-11800H 2.3GHz
GeForce RTX 3080 Laptop GPU
min:
36.6 fps, P0.1:
50.9 fps, P1:
70.1 fps, max:
160 fps
~ 96 fps
100%
NVIDIA GeForce RTX 3070:
96.8 [X] MSI GeForce RTX 3070 Ventus 3X Intel Core i9-9900K 3.6GHz
NVIDIA GeForce RTX 3070
min:
6.18 fps, P0.1:
12.1 fps, P1:
68.5 fps, max:
160 fps
fps
52%
NVIDIA GeForce RTX 3050:
50.2 [X] AMD Ryzen 9 5900X 3.7GHz
NVIDIA GeForce RTX 3050
min:
5.29 fps, P0.1:
11.9 fps, P1:
38.7 fps, max:
128 fps
fps
77%
GeForce RTX 3080 Laptop GPU:
69.9 79.9 [X] XMG Neo 15 @165 W TGP Intel Core i7-11800H 2.3GHz
GeForce RTX 3080 Laptop GPU
min:
6.97 fps, P0.1:
14.1 fps, P1:
56.4 fps, max:
153 fps
~ 75 fps
100%
NVIDIA GeForce RTX 3070:
60.2 [X] MSI GeForce RTX 3070 Ventus 3X Intel Core i9-9900K 3.6GHz
NVIDIA GeForce RTX 3070
min:
21.2 fps, P0.1:
30.6 fps, P1:
45 fps, max:
133 fps
fps
49%
NVIDIA GeForce RTX 3050:
29.6 [X] AMD Ryzen 9 5900X 3.7GHz
NVIDIA GeForce RTX 3050
min:
3.99 fps, P0.1:
9.61 fps, P1:
24.8 fps, max:
96.3 fps
fps
78%
GeForce RTX 3080 Laptop GPU:
43 50.2 [X] XMG Neo 15 @165 W TGP Intel Core i7-11800H 2.3GHz
GeForce RTX 3080 Laptop GPU
min:
21 fps, P0.1:
27 fps, P1:
37.4 fps, max:
121 fps
~ 47 fps
100%
NVIDIA GeForce RTX 3070:
247 fps
81%
NVIDIA GeForce RTX 3050:
199 [X] AMD Ryzen 9 5900X 3.7GHz
NVIDIA GeForce RTX 3050
200 [X] PNY GeForce RTX 3050 XLR8 AMD Ryzen 9 7950X 4.5GHz
NVIDIA GeForce RTX 3050
~ 200 fps
85%
GeForce RTX 3080 Laptop GPU:
207 214 ~ 211 fps
100%
NVIDIA GeForce RTX 3070:
147 [X] MSI GeForce RTX 3070 Ventus 3X Intel Core i9-9900K 3.6GHz
NVIDIA GeForce RTX 3070
171 ~ 159 fps
68%
NVIDIA GeForce RTX 3050:
103 [X] AMD Ryzen 9 5900X 3.7GHz
NVIDIA GeForce RTX 3050
112 [X] PNY GeForce RTX 3050 XLR8 AMD Ryzen 9 7950X 4.5GHz
NVIDIA GeForce RTX 3050
~ 108 fps
89%
GeForce RTX 3080 Laptop GPU:
131 146 [X] XMG Neo 15 @165 W TGP Intel Core i7-11800H 2.3GHz
GeForce RTX 3080 Laptop GPU
149 ~ 142 fps
100%
NVIDIA GeForce RTX 3070:
136 [X] MSI GeForce RTX 3070 Ventus 3X Intel Core i9-9900K 3.6GHz
NVIDIA GeForce RTX 3070
160 ~ 148 fps
64%
NVIDIA GeForce RTX 3050:
91 [X] AMD Ryzen 9 5900X 3.7GHz
NVIDIA GeForce RTX 3050
96 [X] PNY GeForce RTX 3050 XLR8 AMD Ryzen 9 7950X 4.5GHz
NVIDIA GeForce RTX 3050
~ 94 fps
89%
GeForce RTX 3080 Laptop GPU:
122 134 [X] XMG Neo 15 @165 W TGP Intel Core i7-11800H 2.3GHz
GeForce RTX 3080 Laptop GPU
136 ~ 131 fps
100%
NVIDIA GeForce RTX 3070:
97 [X] MSI GeForce RTX 3070 Ventus 3X Intel Core i9-9900K 3.6GHz
NVIDIA GeForce RTX 3070
115 ~ 106 fps
51%
NVIDIA GeForce RTX 3050:
52 [X] AMD Ryzen 9 5900X 3.7GHz
NVIDIA GeForce RTX 3050
55 [X] PNY GeForce RTX 3050 XLR8 AMD Ryzen 9 7950X 4.5GHz
NVIDIA GeForce RTX 3050
~ 54 fps
78%
GeForce RTX 3080 Laptop GPU:
81 84 [X] XMG Neo 15 @165 W TGP Intel Core i7-11800H 2.3GHz
GeForce RTX 3080 Laptop GPU
84 ~ 83 fps
100%
NVIDIA GeForce RTX 3070:
85 [X] MSI GeForce RTX 3070 Ventus 3X Intel Core i9-9900K 3.6GHz
NVIDIA GeForce RTX 3070
100 ~ 93 fps
48%
NVIDIA GeForce RTX 3050:
43 [X] AMD Ryzen 9 5900X 3.7GHz
NVIDIA GeForce RTX 3050
47 [X] PNY GeForce RTX 3050 XLR8 AMD Ryzen 9 7950X 4.5GHz
NVIDIA GeForce RTX 3050
~ 45 fps
75%
GeForce RTX 3080 Laptop GPU:
67 71 73 [X] XMG Neo 15 @165 W TGP Intel Core i7-11800H 2.3GHz
GeForce RTX 3080 Laptop GPU
~ 70 fps
100%
NVIDIA GeForce RTX 3070:
62 [X] MSI GeForce RTX 3070 Ventus 3X Intel Core i9-9900K 3.6GHz
NVIDIA GeForce RTX 3070
73 ~ 68 fps
46%
NVIDIA GeForce RTX 3050:
29 [X] AMD Ryzen 9 5900X 3.7GHz
NVIDIA GeForce RTX 3050
33 [X] PNY GeForce RTX 3050 XLR8 AMD Ryzen 9 7950X 4.5GHz
NVIDIA GeForce RTX 3050
~ 31 fps
75%
GeForce RTX 3080 Laptop GPU:
48 49 55 [X] XMG Neo 15 @165 W TGP Intel Core i7-11800H 2.3GHz
GeForce RTX 3080 Laptop GPU
~ 51 fps
NVIDIA GeForce RTX 3050:
91.3 [X] AMD Ryzen 9 5900X 3.7GHz
NVIDIA GeForce RTX 3050
min:
62.8 fps, P0.1:
79.3 fps, P1:
81.8 fps, max:
190 fps
fps
100%
NVIDIA GeForce RTX 3070:
157 [X] MSI GeForce RTX 3070 Ventus 3X Intel Core i9-9900K 3.6GHz
NVIDIA GeForce RTX 3070
min:
100 fps, P0.1:
116 fps, P1:
126 fps, max:
316 fps
fps
59%
NVIDIA GeForce RTX 3050:
93 [X] AMD Ryzen 9 5900X 3.7GHz
NVIDIA GeForce RTX 3050
min:
69.7 fps, P0.1:
78.2 fps, P1:
81.2 fps, max:
130 fps
fps
87%
GeForce RTX 3080 Laptop GPU:
136 [X] XMG Neo 15 @165 W TGP Intel Core i7-11800H 2.3GHz
GeForce RTX 3080 Laptop GPU
min:
78.3 fps, P0.1:
98.9 fps, P1:
110 fps, max:
383 fps
fps
100%
NVIDIA GeForce RTX 3070:
144 [X] MSI GeForce RTX 3070 Ventus 3X Intel Core i9-9900K 3.6GHz
NVIDIA GeForce RTX 3070
min:
90.8 fps, P0.1:
103 fps, P1:
111 fps, max:
317 fps
fps
51%
NVIDIA GeForce RTX 3050:
73.7 [X] AMD Ryzen 9 5900X 3.7GHz
NVIDIA GeForce RTX 3050
min:
43.6 fps, P0.1:
49 fps, P1:
61.7 fps, max:
109 fps
fps
87%
GeForce RTX 3080 Laptop GPU:
125 [X] XMG Neo 15 @165 W TGP Intel Core i7-11800H 2.3GHz
GeForce RTX 3080 Laptop GPU
min:
70.5 fps, P0.1:
90.9 fps, P1:
101 fps, max:
301 fps
fps
100%
NVIDIA GeForce RTX 3070:
131 [X] MSI GeForce RTX 3070 Ventus 3X Intel Core i9-9900K 3.6GHz
NVIDIA GeForce RTX 3070
min:
68 fps, P0.1:
95.5 fps, P1:
104 fps, max:
349 fps
fps
50%
NVIDIA GeForce RTX 3050:
65.5 [X] AMD Ryzen 9 5900X 3.7GHz
NVIDIA GeForce RTX 3050
min:
44 fps, P0.1:
46.5 fps, P1:
56.3 fps, max:
89.8 fps
fps
87%
GeForce RTX 3080 Laptop GPU:
114 [X] XMG Neo 15 @165 W TGP Intel Core i7-11800H 2.3GHz
GeForce RTX 3080 Laptop GPU
min:
44 fps, P0.1:
82.9 fps, P1:
93.6 fps, max:
299 fps
fps
100%
NVIDIA GeForce RTX 3070:
98.1 [X] MSI GeForce RTX 3070 Ventus 3X Intel Core i9-9900K 3.6GHz
NVIDIA GeForce RTX 3070
min:
68.9 fps, P0.1:
74.6 fps, P1:
81 fps, max:
159 fps
fps
48%
NVIDIA GeForce RTX 3050:
47.4 [X] AMD Ryzen 9 5900X 3.7GHz
NVIDIA GeForce RTX 3050
min:
18.4 fps, P0.1:
29.1 fps, P1:
41.7 fps, max:
249 fps
fps
85%
GeForce RTX 3080 Laptop GPU:
83.5 [X] XMG Neo 15 @165 W TGP Intel Core i7-11800H 2.3GHz
GeForce RTX 3080 Laptop GPU
min:
61.1 fps, P0.1:
66.4 fps, P1:
71 fps, max:
152 fps
fps
100%
NVIDIA GeForce RTX 3070:
56.8 [X] MSI GeForce RTX 3070 Ventus 3X Intel Core i9-9900K 3.6GHz
NVIDIA GeForce RTX 3070
min:
46.7 fps, P0.1:
48 fps, P1:
50.1 fps, max:
78 fps
fps
42%
NVIDIA GeForce RTX 3050:
24.1 [X] AMD Ryzen 9 5900X 3.7GHz
NVIDIA GeForce RTX 3050
min:
18.2 fps, P0.1:
19.2 fps, P1:
21.2 fps, max:
32.2 fps
fps
85%
GeForce RTX 3080 Laptop GPU:
48.1 [X] XMG Neo 15 @165 W TGP Intel Core i7-11800H 2.3GHz
GeForce RTX 3080 Laptop GPU
min:
37.3 fps, P0.1:
41.1 fps, P1:
43 fps, max:
81.5 fps
fps
NVIDIA GeForce RTX 3050:
167 [X] AMD Ryzen 9 5900X 3.7GHz
NVIDIA GeForce RTX 3050
fps
GeForce RTX 3080 Laptop GPU:
155 fps
100%
NVIDIA GeForce RTX 3070:
139 [X] MSI GeForce RTX 3070 Ventus 3X Intel Core i9-9900K 3.6GHz
NVIDIA GeForce RTX 3070
min:
111 fps
fps
70%
NVIDIA GeForce RTX 3050:
97 [X] AMD Ryzen 9 5900X 3.7GHz
NVIDIA GeForce RTX 3050
fps
106%
GeForce RTX 3080 Laptop GPU:
137 156 [X] XMG Neo 15 @165 W TGP Intel Core i7-11800H 2.3GHz
GeForce RTX 3080 Laptop GPU
min:
125 fps
~ 147 fps
100%
NVIDIA GeForce RTX 3070:
124 [X] MSI GeForce RTX 3070 Ventus 3X Intel Core i9-9900K 3.6GHz
NVIDIA GeForce RTX 3070
min:
99 fps
fps
62%
NVIDIA GeForce RTX 3050:
77 [X] AMD Ryzen 9 5900X 3.7GHz
NVIDIA GeForce RTX 3050
fps
97%
GeForce RTX 3080 Laptop GPU:
113 127 [X] XMG Neo 15 @165 W TGP Intel Core i7-11800H 2.3GHz
GeForce RTX 3080 Laptop GPU
min:
107 fps
~ 120 fps
100%
NVIDIA GeForce RTX 3070:
118 [X] MSI GeForce RTX 3070 Ventus 3X Intel Core i9-9900K 3.6GHz
NVIDIA GeForce RTX 3070
min:
92 fps
fps
58%
NVIDIA GeForce RTX 3050:
69 [X] AMD Ryzen 9 5900X 3.7GHz
NVIDIA GeForce RTX 3050
fps
93%
GeForce RTX 3080 Laptop GPU:
104 115 [X] XMG Neo 15 @165 W TGP Intel Core i7-11800H 2.3GHz
GeForce RTX 3080 Laptop GPU
min:
95 fps
~ 110 fps
100%
NVIDIA GeForce RTX 3070:
92 [X] MSI GeForce RTX 3070 Ventus 3X Intel Core i9-9900K 3.6GHz
NVIDIA GeForce RTX 3070
min:
76 fps
fps
53%
NVIDIA GeForce RTX 3050:
49 [X] AMD Ryzen 9 5900X 3.7GHz
NVIDIA GeForce RTX 3050
fps
86%
GeForce RTX 3080 Laptop GPU:
74 84 [X] XMG Neo 15 @165 W TGP Intel Core i7-11800H 2.3GHz
GeForce RTX 3080 Laptop GPU
min:
72 fps
~ 79 fps
100%
NVIDIA GeForce RTX 3070:
54 [X] MSI GeForce RTX 3070 Ventus 3X Intel Core i9-9900K 3.6GHz
NVIDIA GeForce RTX 3070
min:
47 fps
fps
46%
NVIDIA GeForce RTX 3050:
25 [X] AMD Ryzen 9 5900X 3.7GHz
NVIDIA GeForce RTX 3050
fps
81%
GeForce RTX 3080 Laptop GPU:
41 47 [X] XMG Neo 15 @165 W TGP Intel Core i7-11800H 2.3GHz
GeForce RTX 3080 Laptop GPU
min:
41 fps
~ 44 fps
NVIDIA GeForce RTX 3050:
106 [X] PNY GeForce RTX 3050 XLR8 AMD Ryzen 9 7950X 4.5GHz
NVIDIA GeForce RTX 3050
151 [X] AMD Ryzen 9 5900X 3.7GHz
NVIDIA GeForce RTX 3050
~ 129 fps
GeForce RTX 3080 Laptop GPU:
130 138 ~ 134 fps
100%
NVIDIA GeForce RTX 3070:
111 [X] MSI GeForce RTX 3070 Ventus 3X Intel Core i9-9900K 3.6GHz
NVIDIA GeForce RTX 3070
min:
65 fps
fps
89%
NVIDIA GeForce RTX 3050:
96 [X] AMD Ryzen 9 5900X 3.7GHz
NVIDIA GeForce RTX 3050
102 [X] PNY GeForce RTX 3050 XLR8 AMD Ryzen 9 7950X 4.5GHz
NVIDIA GeForce RTX 3050
~ 99 fps
121%
GeForce RTX 3080 Laptop GPU:
122 138 141 [X] XMG Neo 15 @165 W TGP Intel Core i7-11800H 2.3GHz
GeForce RTX 3080 Laptop GPU
min:
86 fps
~ 134 fps
100%
NVIDIA GeForce RTX 3070:
100 [X] MSI GeForce RTX 3070 Ventus 3X Intel Core i9-9900K 3.6GHz
NVIDIA GeForce RTX 3070
min:
77 fps
fps
98%
NVIDIA GeForce RTX 3050:
95 [X] AMD Ryzen 9 5900X 3.7GHz
NVIDIA GeForce RTX 3050
101 [X] PNY GeForce RTX 3050 XLR8 AMD Ryzen 9 7950X 4.5GHz
NVIDIA GeForce RTX 3050
~ 98 fps
134%
GeForce RTX 3080 Laptop GPU:
124 137 140 [X] XMG Neo 15 @165 W TGP Intel Core i7-11800H 2.3GHz
GeForce RTX 3080 Laptop GPU
min:
88 fps
~ 134 fps
100%
NVIDIA GeForce RTX 3070:
109 [X] MSI GeForce RTX 3070 Ventus 3X Intel Core i9-9900K 3.6GHz
NVIDIA GeForce RTX 3070
min:
63 fps
fps
86%
NVIDIA GeForce RTX 3050:
91 [X] AMD Ryzen 9 5900X 3.7GHz
NVIDIA GeForce RTX 3050
96 [X] PNY GeForce RTX 3050 XLR8 AMD Ryzen 9 7950X 4.5GHz
NVIDIA GeForce RTX 3050
~ 94 fps
120%
GeForce RTX 3080 Laptop GPU:
122 135 137 [X] XMG Neo 15 @165 W TGP Intel Core i7-11800H 2.3GHz
GeForce RTX 3080 Laptop GPU
min:
87 fps
~ 131 fps
100%
NVIDIA GeForce RTX 3070:
107 [X] MSI GeForce RTX 3070 Ventus 3X Intel Core i9-9900K 3.6GHz
NVIDIA GeForce RTX 3070
min:
68 fps
fps
58%
NVIDIA GeForce RTX 3050:
58 [X] AMD Ryzen 9 5900X 3.7GHz
NVIDIA GeForce RTX 3050
66 [X] PNY GeForce RTX 3050 XLR8 AMD Ryzen 9 7950X 4.5GHz
NVIDIA GeForce RTX 3050
~ 62 fps
95%
GeForce RTX 3080 Laptop GPU:
95 103 108 [X] XMG Neo 15 @165 W TGP Intel Core i7-11800H 2.3GHz
GeForce RTX 3080 Laptop GPU
min:
79 fps
~ 102 fps
100%
NVIDIA GeForce RTX 3070:
69 [X] MSI GeForce RTX 3070 Ventus 3X Intel Core i9-9900K 3.6GHz
NVIDIA GeForce RTX 3070
min:
55 fps
fps
49%
NVIDIA GeForce RTX 3050:
32 [X] AMD Ryzen 9 5900X 3.7GHz
NVIDIA GeForce RTX 3050
35 [X] PNY GeForce RTX 3050 XLR8 AMD Ryzen 9 7950X 4.5GHz
NVIDIA GeForce RTX 3050
~ 34 fps
83%
GeForce RTX 3080 Laptop GPU:
55 56 60 [X] XMG Neo 15 @165 W TGP Intel Core i7-11800H 2.3GHz
GeForce RTX 3080 Laptop GPU
min:
48 fps
~ 57 fps
100%
NVIDIA GeForce RTX 3070:
295 [X] MSI GeForce RTX 3070 Ventus 3X Intel Core i9-9900K 3.6GHz
NVIDIA GeForce RTX 3070
min:
120 fps, P0.1:
145 fps, P1:
176 fps, max:
502 fps
fps
54%
NVIDIA GeForce RTX 3050:
158 [X] AMD Ryzen 9 5900X 3.7GHz
NVIDIA GeForce RTX 3050
min:
82.9 fps, P0.1:
87.7 fps, P1:
99.6 fps, max:
318 fps
fps
95%
GeForce RTX 3080 Laptop GPU:
281 [X] XMG Neo 15 @165 W TGP Intel Core i7-11800H 2.3GHz
GeForce RTX 3080 Laptop GPU
min:
44.4 fps, P0.1:
139 fps, P1:
180 fps, max:
499 fps
fps
100%
NVIDIA GeForce RTX 3070:
260 [X] MSI GeForce RTX 3070 Ventus 3X Intel Core i9-9900K 3.6GHz
NVIDIA GeForce RTX 3070
min:
30.6 fps, P0.1:
128 fps, P1:
155 fps, max:
468 fps
fps
52%
NVIDIA GeForce RTX 3050:
135 [X] AMD Ryzen 9 5900X 3.7GHz
NVIDIA GeForce RTX 3050
min:
73.3 fps, P0.1:
77.6 fps, P1:
84.6 fps, max:
283 fps
fps
90%
GeForce RTX 3080 Laptop GPU:
235 [X] XMG Neo 15 @165 W TGP Intel Core i7-11800H 2.3GHz
GeForce RTX 3080 Laptop GPU
min:
38.8 fps, P0.1:
121 fps, P1:
148 fps, max:
477 fps
fps
100%
NVIDIA GeForce RTX 3070:
248 [X] MSI GeForce RTX 3070 Ventus 3X Intel Core i9-9900K 3.6GHz
NVIDIA GeForce RTX 3070
min:
62.8 fps, P0.1:
128 fps, P1:
155 fps, max:
465 fps
fps
50%
NVIDIA GeForce RTX 3050:
125 [X] AMD Ryzen 9 5900X 3.7GHz
NVIDIA GeForce RTX 3050
min:
65.5 fps, P0.1:
70.6 fps, P1:
77 fps, max:
294 fps
fps
89%
GeForce RTX 3080 Laptop GPU:
220 [X] XMG Neo 15 @165 W TGP Intel Core i7-11800H 2.3GHz
GeForce RTX 3080 Laptop GPU
min:
43.6 fps, P0.1:
105 fps, P1:
141 fps, max:
476 fps
fps
100%
NVIDIA GeForce RTX 3070:
179 [X] MSI GeForce RTX 3070 Ventus 3X Intel Core i9-9900K 3.6GHz
NVIDIA GeForce RTX 3070
min:
59.9 fps, P0.1:
90.4 fps, P1:
117 fps, max:
359 fps
fps
46%
NVIDIA GeForce RTX 3050:
82.9 [X] AMD Ryzen 9 5900X 3.7GHz
NVIDIA GeForce RTX 3050
min:
41 fps, P0.1:
43 fps, P1:
47.6 fps, max:
249 fps
fps
82%
GeForce RTX 3080 Laptop GPU:
146 [X] XMG Neo 15 @165 W TGP Intel Core i7-11800H 2.3GHz
GeForce RTX 3080 Laptop GPU
min:
25.2 fps, P0.1:
53 fps, P1:
101 fps, max:
357 fps
fps
100%
NVIDIA GeForce RTX 3070:
96.4 [X] MSI GeForce RTX 3070 Ventus 3X Intel Core i9-9900K 3.6GHz
NVIDIA GeForce RTX 3070
min:
44.5 fps, P0.1:
50.9 fps, P1:
61.7 fps, max:
294 fps
fps
43%
NVIDIA GeForce RTX 3050:
41.5 [X] AMD Ryzen 9 5900X 3.7GHz
NVIDIA GeForce RTX 3050
min:
19.9 fps, P0.1:
20.2 fps, P1:
21.7 fps, max:
219 fps
fps
79%
GeForce RTX 3080 Laptop GPU:
76.6 [X] XMG Neo 15 @165 W TGP Intel Core i7-11800H 2.3GHz
GeForce RTX 3080 Laptop GPU
min:
15.4 fps, P0.1:
21.6 fps, P1:
45.9 fps, max:
352 fps
fps
100%
NVIDIA GeForce RTX 3070:
154.9 fps
108%
NVIDIA GeForce RTX 3050:
156 [X] AMD Ryzen 9 5900X 3.7GHz
NVIDIA GeForce RTX 3050
min:
134 fps, max:
182 fps
179.4 [X] PNY GeForce RTX 3050 XLR8 AMD Ryzen 9 7950X 4.5GHz
NVIDIA GeForce RTX 3050
min:
160 fps, max:
205 fps
~ 168 fps
76%
GeForce RTX 3080 Laptop GPU:
101 101 148.8 [X] Acemagic Tank03 Intel Core i9-12900H 1.8GHz
GeForce RTX 3080 Laptop GPU
min:
132 fps, max:
189 fps
~ 117 fps
100%
NVIDIA GeForce RTX 3070:
102 [X] MSI GeForce RTX 3070 Ventus 3X Intel Core i9-9900K 3.6GHz
NVIDIA GeForce RTX 3070
min:
65 fps
138.3 ~ 120 fps
84%
NVIDIA GeForce RTX 3050:
95.4 [X] AMD Ryzen 9 5900X 3.7GHz
NVIDIA GeForce RTX 3050
min:
89 fps, max:
105 fps
105.8 [X] PNY GeForce RTX 3050 XLR8 AMD Ryzen 9 7950X 4.5GHz
NVIDIA GeForce RTX 3050
min:
98 fps, max:
118 fps
~ 101 fps
83%
GeForce RTX 3080 Laptop GPU:
73 82 113 [X] XMG Neo 15 @165 W TGP Intel Core i7-11800H 2.3GHz
GeForce RTX 3080 Laptop GPU
min:
91 fps
126.5 [X] Acemagic Tank03 Intel Core i9-12900H 1.8GHz
GeForce RTX 3080 Laptop GPU
min:
106 fps, max:
148 fps
~ 99 fps
100%
NVIDIA GeForce RTX 3070:
96 [X] MSI GeForce RTX 3070 Ventus 3X Intel Core i9-9900K 3.6GHz
NVIDIA GeForce RTX 3070
min:
58 fps
121.1 ~ 109 fps
78%
NVIDIA GeForce RTX 3050:
81.4 [X] AMD Ryzen 9 5900X 3.7GHz
NVIDIA GeForce RTX 3050
min:
75 fps, max:
90 fps
88.9 [X] PNY GeForce RTX 3050 XLR8 AMD Ryzen 9 7950X 4.5GHz
NVIDIA GeForce RTX 3050
min:
80 fps, max:
98 fps
~ 85 fps
81%
GeForce RTX 3080 Laptop GPU:
65 75 102 [X] XMG Neo 15 @165 W TGP Intel Core i7-11800H 2.3GHz
GeForce RTX 3080 Laptop GPU
min:
80 fps
111.9 [X] Acemagic Tank03 Intel Core i9-12900H 1.8GHz
GeForce RTX 3080 Laptop GPU
min:
93 fps, max:
126 fps
~ 88 fps
100%
NVIDIA GeForce RTX 3070:
91 [X] MSI GeForce RTX 3070 Ventus 3X Intel Core i9-9900K 3.6GHz
NVIDIA GeForce RTX 3070
min:
54 fps
114.2 ~ 103 fps
72%
NVIDIA GeForce RTX 3050:
72.4 [X] AMD Ryzen 9 5900X 3.7GHz
NVIDIA GeForce RTX 3050
min:
60 fps, max:
81 fps
75.5 [X] PNY GeForce RTX 3050 XLR8 AMD Ryzen 9 7950X 4.5GHz
NVIDIA GeForce RTX 3050
min:
56 fps, max:
86 fps
~ 74 fps
75%
GeForce RTX 3080 Laptop GPU:
55 70 79 [X] XMG Neo 15 @165 W TGP Intel Core i7-11800H 2.3GHz
GeForce RTX 3080 Laptop GPU
min:
68 fps
104 [X] Acemagic Tank03 Intel Core i9-12900H 1.8GHz
GeForce RTX 3080 Laptop GPU
min:
93 fps, max:
117 fps
~ 77 fps
100%
NVIDIA GeForce RTX 3070:
87 [X] MSI GeForce RTX 3070 Ventus 3X Intel Core i9-9900K 3.6GHz
NVIDIA GeForce RTX 3070
min:
51 fps
95.9 ~ 91 fps
57%
NVIDIA GeForce RTX 3050:
51.6 [X] AMD Ryzen 9 5900X 3.7GHz
NVIDIA GeForce RTX 3050
min:
47 fps, max:
56 fps
53 [X] PNY GeForce RTX 3050 XLR8 AMD Ryzen 9 7950X 4.5GHz
NVIDIA GeForce RTX 3050
min:
35 fps, max:
58 fps
~ 52 fps
77%
GeForce RTX 3080 Laptop GPU:
62 69 [X] XMG Neo 15 @165 W TGP Intel Core i7-11800H 2.3GHz
GeForce RTX 3080 Laptop GPU
min:
39 fps
78.2 [X] Acemagic Tank03 Intel Core i9-12900H 1.8GHz
GeForce RTX 3080 Laptop GPU
min:
70 fps, max:
85 fps
~ 70 fps
100%
NVIDIA GeForce RTX 3070:
26.4 57 [X] MSI GeForce RTX 3070 Ventus 3X Intel Core i9-9900K 3.6GHz
NVIDIA GeForce RTX 3070
min:
33 fps
~ 42 fps
17%
NVIDIA GeForce RTX 3050:
5.3 [X] AMD Ryzen 9 5900X 3.7GHz
NVIDIA GeForce RTX 3050
min:
3 fps, max:
6 fps
8.3 [X] PNY GeForce RTX 3050 XLR8 AMD Ryzen 9 7950X 4.5GHz
NVIDIA GeForce RTX 3050
min:
7 fps, max:
9 fps
~ 7 fps
107%
GeForce RTX 3080 Laptop GPU:
40 44.9 [X] Acemagic Tank03 Intel Core i9-12900H 1.8GHz
GeForce RTX 3080 Laptop GPU
min:
37 fps, max:
49 fps
50 [X] XMG Neo 15 @165 W TGP Intel Core i7-11800H 2.3GHz
GeForce RTX 3080 Laptop GPU
min:
37 fps
~ 45 fps
100%
NVIDIA GeForce RTX 3070:
104 [X] MSI GeForce RTX 3070 Ventus 3X Intel Core i9-9900K 3.6GHz
NVIDIA GeForce RTX 3070
min:
42.3 fps, P0.1:
43.5 fps, P1:
61.4 fps, max:
234 fps
fps
130%
NVIDIA GeForce RTX 3050:
135 [X] AMD Ryzen 9 5900X 3.7GHz
NVIDIA GeForce RTX 3050
min:
29.7 fps, P0.1:
52.5 fps, P1:
100 fps, max:
236 fps
fps
106%
GeForce RTX 3080 Laptop GPU:
99.5 [X] XMG Neo 15 @165 W TGP Intel Core i7-11800H 2.3GHz
GeForce RTX 3080 Laptop GPU
min:
39.3 fps, P0.1:
44.6 fps, P1:
75.9 fps, max:
240 fps
121 ~ 110 fps
100%
NVIDIA GeForce RTX 3070:
101 [X] MSI GeForce RTX 3070 Ventus 3X Intel Core i9-9900K 3.6GHz
NVIDIA GeForce RTX 3070
min:
40.1 fps, P0.1:
45.8 fps, P1:
59.5 fps, max:
220 fps
fps
130%
NVIDIA GeForce RTX 3050:
131 [X] AMD Ryzen 9 5900X 3.7GHz
NVIDIA GeForce RTX 3050
min:
28.3 fps, P0.1:
50.8 fps, P1:
100 fps, max:
210 fps
fps
102%
GeForce RTX 3080 Laptop GPU:
95 [X] XMG Neo 15 @165 W TGP Intel Core i7-11800H 2.3GHz
GeForce RTX 3080 Laptop GPU
min:
34 fps, P0.1:
43.2 fps, P1:
73.6 fps, max:
232 fps
111 ~ 103 fps
100%
NVIDIA GeForce RTX 3070:
98.1 [X] MSI GeForce RTX 3070 Ventus 3X Intel Core i9-9900K 3.6GHz
NVIDIA GeForce RTX 3070
min:
26.9 fps, P0.1:
44.4 fps, P1:
59.7 fps, max:
226 fps
fps
119%
NVIDIA GeForce RTX 3050:
117 [X] AMD Ryzen 9 5900X 3.7GHz
NVIDIA GeForce RTX 3050
min:
28.3 fps, P0.1:
51.6 fps, P1:
79.8 fps, max:
162 fps
fps
102%
GeForce RTX 3080 Laptop GPU:
91 [X] XMG Neo 15 @165 W TGP Intel Core i7-11800H 2.3GHz
GeForce RTX 3080 Laptop GPU
min:
42.4 fps, P0.1:
44.4 fps, P1:
73.3 fps, max:
185 fps
108 ~ 100 fps
100%
NVIDIA GeForce RTX 3070:
84.3 [X] MSI GeForce RTX 3070 Ventus 3X Intel Core i9-9900K 3.6GHz
NVIDIA GeForce RTX 3070
min:
37 fps, P0.1:
41.9 fps, P1:
54.9 fps, max:
129 fps
fps
82%
NVIDIA GeForce RTX 3050:
69.3 [X] AMD Ryzen 9 5900X 3.7GHz
NVIDIA GeForce RTX 3050
min:
25.4 fps, P0.1:
46.3 fps, P1:
53 fps, max:
137 fps
fps
82%
GeForce RTX 3080 Laptop GPU:
64.6 73.9 [X] XMG Neo 15 @165 W TGP Intel Core i7-11800H 2.3GHz
GeForce RTX 3080 Laptop GPU
min:
31.6 fps, P0.1:
41.4 fps, P1:
62.1 fps, max:
101 fps
~ 69 fps
100%
NVIDIA GeForce RTX 3070:
265 [X] MSI GeForce RTX 3070 Ventus 3X Intel Core i9-9900K 3.6GHz
NVIDIA GeForce RTX 3070
min:
132 fps, P0.1:
163 fps, P1:
182 fps, max:
363 fps
fps
117%
GeForce RTX 3080 Laptop GPU:
309 [X] XMG Neo 15 @165 W TGP Intel Core i7-11800H 2.3GHz
GeForce RTX 3080 Laptop GPU
min:
34.5 fps, P0.1:
144 fps, P1:
204 fps, max:
460 fps
fps
100%
NVIDIA GeForce RTX 3070:
264 [X] MSI GeForce RTX 3070 Ventus 3X Intel Core i9-9900K 3.6GHz
NVIDIA GeForce RTX 3070
min:
125 fps, P0.1:
158 fps, P1:
180 fps, max:
371 fps
fps
103%
GeForce RTX 3080 Laptop GPU:
273 [X] XMG Neo 15 @165 W TGP Intel Core i7-11800H 2.3GHz
GeForce RTX 3080 Laptop GPU
min:
84.8 fps, P0.1:
156 fps, P1:
199 fps, max:
400 fps
fps
100%
NVIDIA GeForce RTX 3070:
264 [X] MSI GeForce RTX 3070 Ventus 3X Intel Core i9-9900K 3.6GHz
NVIDIA GeForce RTX 3070
min:
74.9 fps, P0.1:
146 fps, P1:
180 fps, max:
369 fps
fps
103%
GeForce RTX 3080 Laptop GPU:
271 [X] XMG Neo 15 @165 W TGP Intel Core i7-11800H 2.3GHz
GeForce RTX 3080 Laptop GPU
min:
46.4 fps, P0.1:
117 fps, P1:
199 fps, max:
409 fps
fps
100%
NVIDIA GeForce RTX 3070:
261 [X] MSI GeForce RTX 3070 Ventus 3X Intel Core i9-9900K 3.6GHz
NVIDIA GeForce RTX 3070
min:
96.5 fps, P0.1:
155 fps, P1:
176 fps, max:
364 fps
fps
101%
GeForce RTX 3080 Laptop GPU:
263 [X] XMG Neo 15 @165 W TGP Intel Core i7-11800H 2.3GHz
GeForce RTX 3080 Laptop GPU
min:
46.9 fps, P0.1:
148 fps, P1:
193 fps, max:
362 fps
fps
100%
NVIDIA GeForce RTX 3070:
259 [X] MSI GeForce RTX 3070 Ventus 3X Intel Core i9-9900K 3.6GHz
NVIDIA GeForce RTX 3070
min:
96.1 fps, P0.1:
147 fps, P1:
174 fps, max:
370 fps
fps
93%
GeForce RTX 3080 Laptop GPU:
242 [X] XMG Neo 15 @165 W TGP Intel Core i7-11800H 2.3GHz
GeForce RTX 3080 Laptop GPU
min:
74.6 fps, P0.1:
102 fps, P1:
175 fps, max:
359 fps
fps
100%
NVIDIA GeForce RTX 3070:
166.9 fps
96%
NVIDIA GeForce RTX 3050:
161 [X] AMD Ryzen 9 5900X 3.7GHz
NVIDIA GeForce RTX 3050
min:
47.7 fps, P0.1:
78 fps, P1:
106 fps, max:
386 fps
fps
100%
NVIDIA GeForce RTX 3070:
78.2 [X] MSI GeForce RTX 3070 Ventus 3X Intel Core i9-9900K 3.6GHz
NVIDIA GeForce RTX 3070
min:
35.5 fps, P0.1:
39 fps, P1:
47.3 fps, max:
165 fps
139.5 ~ 109 fps
73%
NVIDIA GeForce RTX 3050:
79.1 [X] AMD Ryzen 9 5900X 3.7GHz
NVIDIA GeForce RTX 3050
min:
48.7 fps, P0.1:
50.6 fps, P1:
58.8 fps, max:
159 fps
fps
83%
GeForce RTX 3080 Laptop GPU:
80.8 83.3 [X] XMG Neo 15 @165 W TGP Intel Core i7-11800H 2.3GHz
GeForce RTX 3080 Laptop GPU
min:
33.6 fps, P0.1:
37.5 fps, P1:
47 fps, max:
173 fps
95.7 105.4 ~ 91 fps
100%
NVIDIA GeForce RTX 3070:
73.4 [X] MSI GeForce RTX 3070 Ventus 3X Intel Core i9-9900K 3.6GHz
NVIDIA GeForce RTX 3070
min:
27.4 fps, P0.1:
34.3 fps, P1:
41.5 fps, max:
161 fps
128.3 ~ 101 fps
68%
NVIDIA GeForce RTX 3050:
68.5 [X] AMD Ryzen 9 5900X 3.7GHz
NVIDIA GeForce RTX 3050
min:
44.4 fps, P0.1:
45.6 fps, P1:
50.5 fps, max:
120 fps
fps
85%
GeForce RTX 3080 Laptop GPU:
75.1 80.8 [X] XMG Neo 15 @165 W TGP Intel Core i7-11800H 2.3GHz
GeForce RTX 3080 Laptop GPU
min:
23 fps, P0.1:
35.3 fps, P1:
42.7 fps, max:
153 fps
91.3 96.7 ~ 86 fps
100%
NVIDIA GeForce RTX 3070:
68.6 [X] MSI GeForce RTX 3070 Ventus 3X Intel Core i9-9900K 3.6GHz
NVIDIA GeForce RTX 3070
min:
30.1 fps, P0.1:
33.3 fps, P1:
39.5 fps, max:
153 fps
117.5 ~ 93 fps
66%
NVIDIA GeForce RTX 3050:
61.6 [X] AMD Ryzen 9 5900X 3.7GHz
NVIDIA GeForce RTX 3050
min:
36 fps, P0.1:
37.4 fps, P1:
44.4 fps, max:
130 fps
fps
86%
GeForce RTX 3080 Laptop GPU:
71.5 74.9 [X] XMG Neo 15 @165 W TGP Intel Core i7-11800H 2.3GHz
GeForce RTX 3080 Laptop GPU
min:
26.1 fps, P0.1:
33.4 fps, P1:
40.3 fps, max:
170 fps
84 90.4 ~ 80 fps
100%
NVIDIA GeForce RTX 3070:
66.2 [X] MSI GeForce RTX 3070 Ventus 3X Intel Core i9-9900K 3.6GHz
NVIDIA GeForce RTX 3070
min:
19.1 fps, P0.1:
31 fps, P1:
40 fps, max:
148 fps
95 ~ 81 fps
50%
NVIDIA GeForce RTX 3050:
40.9 [X] AMD Ryzen 9 5900X 3.7GHz
NVIDIA GeForce RTX 3050
min:
25.5 fps, P0.1:
27.8 fps, P1:
31.8 fps, max:
61.7 fps
fps
80%
GeForce RTX 3080 Laptop GPU:
63.3 67.2 [X] XMG Neo 15 @165 W TGP Intel Core i7-11800H 2.3GHz
GeForce RTX 3080 Laptop GPU
min:
29.5 fps, P0.1:
31.2 fps, P1:
37 fps, max:
153 fps
~ 65 fps
100%
NVIDIA GeForce RTX 3070:
48.9 52.6 [X] MSI GeForce RTX 3070 Ventus 3X Intel Core i9-9900K 3.6GHz
NVIDIA GeForce RTX 3070
min:
25.5 fps, P0.1:
30.7 fps, P1:
35.8 fps, max:
107 fps
~ 51 fps
55%
NVIDIA GeForce RTX 3050:
28.1 [X] AMD Ryzen 9 5900X 3.7GHz
NVIDIA GeForce RTX 3050
min:
14.6 fps, P0.1:
18.7 fps, P1:
22.9 fps, max:
110 fps
fps
78%
GeForce RTX 3080 Laptop GPU:
37.1 42.9 [X] XMG Neo 15 @165 W TGP Intel Core i7-11800H 2.3GHz
GeForce RTX 3080 Laptop GPU
min:
20.5 fps, P0.1:
20.9 fps, P1:
27.3 fps, max:
92 fps
~ 40 fps
100%
NVIDIA GeForce RTX 3070:
119 [X] MSI GeForce RTX 3070 Ventus 3X Intel Core i9-9900K 3.6GHz
NVIDIA GeForce RTX 3070
min:
84.7 fps, P0.1:
98.7 fps, P1:
105 fps, max:
157 fps
fps
101%
GeForce RTX 3080 Laptop GPU:
120 [X] XMG Neo 15 @165 W TGP Intel Core i7-11800H 2.3GHz
GeForce RTX 3080 Laptop GPU
min:
28.3 fps, P0.1:
93.8 fps, P1:
107 fps, max:
149 fps
fps
100%
NVIDIA GeForce RTX 3070:
119 [X] MSI GeForce RTX 3070 Ventus 3X Intel Core i9-9900K 3.6GHz
NVIDIA GeForce RTX 3070
min:
80.8 fps, P0.1:
88.4 fps, P1:
100 fps, max:
147 fps
fps
95%
GeForce RTX 3080 Laptop GPU:
113 [X] XMG Neo 15 @165 W TGP Intel Core i7-11800H 2.3GHz
GeForce RTX 3080 Laptop GPU
min:
46.5 fps, P0.1:
74.4 fps, P1:
93.4 fps, max:
166 fps
fps
100%
NVIDIA GeForce RTX 3070:
109 [X] MSI GeForce RTX 3070 Ventus 3X Intel Core i9-9900K 3.6GHz
NVIDIA GeForce RTX 3070
min:
75.8 fps, P0.1:
79.2 fps, P1:
85.4 fps, max:
146 fps
fps
98%
GeForce RTX 3080 Laptop GPU:
107 [X] XMG Neo 15 @165 W TGP Intel Core i7-11800H 2.3GHz
GeForce RTX 3080 Laptop GPU
min:
41 fps, P0.1:
65.8 fps, P1:
82.5 fps, max:
160 fps
fps
100%
NVIDIA GeForce RTX 3070:
82.9 [X] MSI GeForce RTX 3070 Ventus 3X Intel Core i9-9900K 3.6GHz
NVIDIA GeForce RTX 3070
min:
14.5 fps, P0.1:
17.2 fps, P1:
62.1 fps, max:
121 fps
fps
97%
GeForce RTX 3080 Laptop GPU:
80.3 [X] XMG Neo 15 @165 W TGP Intel Core i7-11800H 2.3GHz
GeForce RTX 3080 Laptop GPU
min:
38.8 fps, P0.1:
59.9 fps, P1:
65.6 fps, max:
108 fps
fps
100%
NVIDIA GeForce RTX 3070:
49.7 [X] MSI GeForce RTX 3070 Ventus 3X Intel Core i9-9900K 3.6GHz
NVIDIA GeForce RTX 3070
min:
14.5 fps, P0.1:
16.4 fps, P1:
42.5 fps, max:
62.1 fps
fps
90%
GeForce RTX 3080 Laptop GPU:
44.9 [X] XMG Neo 15 @165 W TGP Intel Core i7-11800H 2.3GHz
GeForce RTX 3080 Laptop GPU
min:
30.1 fps, P0.1:
37.6 fps, P1:
39.8 fps, max:
54.3 fps
fps
100%
NVIDIA GeForce RTX 3070:
407 fps
106%
NVIDIA GeForce RTX 3050:
425 [X] 852849
AMD Ryzen 9 5900X 3.7GHz
NVIDIA GeForce RTX 3050
min:
353 fps, P1:
285 fps, max:
504 fps
436 [X] PNY GeForce RTX 3050 XLR8 874931
AMD Ryzen 9 7950X 4.5GHz
NVIDIA GeForce RTX 3050
min:
365 fps, P1:
302 fps, max:
511 fps
~ 431 fps
74%
GeForce RTX 3080 Laptop GPU:
246 [X] Acer Nitro 5 AN517-41-R9S5 797778
AMD Ryzen 7 5800H 3.2GHz
GeForce RTX 3080 Laptop GPU
min:
208 fps, P1:
194 fps, max:
266 fps
314 344 [X] Acemagic Tank03 874931
Intel Core i9-12900H 1.8GHz
GeForce RTX 3080 Laptop GPU
min:
290 fps, P1:
241 fps, max:
364 fps
~ 301 fps
100%
NVIDIA GeForce RTX 3070:
259 [X] MSI GeForce RTX 3070 Ventus 3X Intel Core i9-9900K 3.6GHz
NVIDIA GeForce RTX 3070
min:
202 fps
361 ~ 310 fps
70%
NVIDIA GeForce RTX 3050:
214 [X] 852849
AMD Ryzen 9 5900X 3.7GHz
NVIDIA GeForce RTX 3050
min:
182 fps, P1:
181 fps, max:
246 fps
217 [X] PNY GeForce RTX 3050 XLR8 874931
AMD Ryzen 9 7950X 4.5GHz
NVIDIA GeForce RTX 3050
min:
188 fps, P1:
183 fps, max:
256 fps
~ 216 fps
74%
GeForce RTX 3080 Laptop GPU:
192 [X] Acer Nitro 5 AN517-41-R9S5 797778
AMD Ryzen 7 5800H 3.2GHz
GeForce RTX 3080 Laptop GPU
min:
161 fps, P1:
93 fps, max:
210 fps
219 280 [X] Acemagic Tank03 874931
Intel Core i9-12900H 1.8GHz
GeForce RTX 3080 Laptop GPU
min:
235 fps, P1:
175 fps, max:
318 fps
~ 230 fps
100%
NVIDIA GeForce RTX 3070:
250 [X] MSI GeForce RTX 3070 Ventus 3X Intel Core i9-9900K 3.6GHz
NVIDIA GeForce RTX 3070
min:
184 fps
304 ~ 277 fps
61%
NVIDIA GeForce RTX 3050:
168.7 [X] PNY GeForce RTX 3050 XLR8 874931
AMD Ryzen 9 7950X 4.5GHz
NVIDIA GeForce RTX 3050
min:
147 fps, P1:
143 fps, max:
190 fps
169 [X] 852849
AMD Ryzen 9 5900X 3.7GHz
NVIDIA GeForce RTX 3050
min:
145 fps, P1:
144 fps, max:
191 fps
~ 169 fps
66%
GeForce RTX 3080 Laptop GPU:
156 [X] Acer Nitro 5 AN517-41-R9S5 797778
AMD Ryzen 7 5800H 3.2GHz
GeForce RTX 3080 Laptop GPU
min:
125 fps, P1:
86 fps, max:
174 fps
165 172 190 235 [X] Acemagic Tank03 874931
Intel Core i9-12900H 1.8GHz
GeForce RTX 3080 Laptop GPU
min:
194 fps, P1:
151 fps, max:
252 fps
~ 184 fps
100%
NVIDIA GeForce RTX 3070:
148 [X] MSI GeForce RTX 3070 Ventus 3X Intel Core i9-9900K 3.6GHz
NVIDIA GeForce RTX 3070
min:
129 fps
158 ~ 153 fps
54%
NVIDIA GeForce RTX 3050:
81.6 [X] 852849
AMD Ryzen 9 5900X 3.7GHz
NVIDIA GeForce RTX 3050
min:
68 fps, P1:
68 fps, max:
92 fps
82.2 [X] PNY GeForce RTX 3050 XLR8 874931
AMD Ryzen 9 7950X 4.5GHz
NVIDIA GeForce RTX 3050
min:
69 fps, P1:
69 fps, max:
92 fps
~ 82 fps
70%
GeForce RTX 3080 Laptop GPU:
74.9 [X] SCHENKER XMG Pro 15 (Late 2021) 831795, Stromsparmodus
Intel Core i7-11800H 2.3GHz
GeForce RTX 3080 Laptop GPU
min:
63 fps, P1:
61 fps, max:
84 fps
97.2 [X] SCHENKER XMG Pro 15 (Late 2021) 831795, Lautlosmodus
Intel Core i7-11800H 2.3GHz
GeForce RTX 3080 Laptop GPU
min:
71 fps, P1:
66 fps, max:
108 fps
106 [X] Acer Nitro 5 AN517-41-R9S5 797778
AMD Ryzen 7 5800H 3.2GHz
GeForce RTX 3080 Laptop GPU
min:
88 fps, P1:
81 fps, max:
115 fps
110 111 114 [X] SCHENKER XMG Pro 15 (Late 2021) 831795, Unterhaltungsmodus
Intel Core i7-11800H 2.3GHz
GeForce RTX 3080 Laptop GPU
min:
99 fps, P1:
88 fps, max:
125 fps
117 123.7 [X] Acemagic Tank03 874931
Intel Core i9-12900H 1.8GHz
GeForce RTX 3080 Laptop GPU
min:
101 fps, P1:
91 fps, max:
139 fps
~ 107 fps
100%
NVIDIA GeForce RTX 3070:
113 [X] MSI GeForce RTX 3070 Ventus 3X Intel Core i9-9900K 3.6GHz
NVIDIA GeForce RTX 3070
min:
97 fps
118 ~ 116 fps
51%
NVIDIA GeForce RTX 3050:
59 [X] PNY GeForce RTX 3050 XLR8 874931
AMD Ryzen 9 7950X 4.5GHz
NVIDIA GeForce RTX 3050
min:
50 fps, P1:
50 fps, max:
65 fps
59.2 [X] 852849
AMD Ryzen 9 5900X 3.7GHz
NVIDIA GeForce RTX 3050
min:
50 fps, P1:
50 fps, max:
66 fps
~ 59 fps
75%
GeForce RTX 3080 Laptop GPU:
84 87.4 90.4 [X] Acemagic Tank03 874931
Intel Core i9-12900H 1.8GHz
GeForce RTX 3080 Laptop GPU
min:
77 fps, P1:
71 fps, max:
100 fps
~ 87 fps
100%
NVIDIA GeForce RTX 3070:
64 [X] MSI GeForce RTX 3070 Ventus 3X Intel Core i9-9900K 3.6GHz
NVIDIA GeForce RTX 3070
min:
57 fps
67.3 ~ 66 fps
48%
NVIDIA GeForce RTX 3050:
32 [X] PNY GeForce RTX 3050 XLR8 874931
AMD Ryzen 9 7950X 4.5GHz
NVIDIA GeForce RTX 3050
min:
27 fps, P1:
27 fps, max:
36 fps
32.4 [X] 852849
AMD Ryzen 9 5900X 3.7GHz
NVIDIA GeForce RTX 3050
min:
28 fps, P1:
28 fps, max:
36 fps
~ 32 fps
68%
GeForce RTX 3080 Laptop GPU:
32.5 [X] SCHENKER XMG Pro 15 (Late 2021) 831795, Stromsparmodus
Intel Core i7-11800H 2.3GHz
GeForce RTX 3080 Laptop GPU
min:
28 fps, P1:
28 fps, max:
36 fps
42.1 [X] SCHENKER XMG Pro 15 (Late 2021) 831795, Lautlosmodus
Intel Core i7-11800H 2.3GHz
GeForce RTX 3080 Laptop GPU
min:
36 fps, P1:
35 fps, max:
48 fps
47 47.5 [X] SCHENKER XMG Pro 15 (Late 2021) 831795, Unterhaltungsmodus
Intel Core i7-11800H 2.3GHz
GeForce RTX 3080 Laptop GPU
min:
41 fps, P1:
40 fps, max:
53 fps
49.6 51.5 [X] Acemagic Tank03 874931
Intel Core i9-12900H 1.8GHz
GeForce RTX 3080 Laptop GPU
min:
45 fps, P1:
42 fps, max:
58 fps
~ 45 fps
100%
NVIDIA GeForce RTX 3070:
144 [X] MSI GeForce RTX 3070 Ventus 3X Intel Core i9-9900K 3.6GHz
NVIDIA GeForce RTX 3070
min:
78.6 fps, P0.1:
112 fps, P1:
122 fps, max:
177 fps
fps
100%
GeForce RTX 3080 Laptop GPU:
144 [X] XMG Neo 15 @165 W TGP Intel Core i7-11800H 2.3GHz
GeForce RTX 3080 Laptop GPU
min:
65.4 fps, P0.1:
97.5 fps, P1:
113 fps, max:
238 fps
fps
100%
NVIDIA GeForce RTX 3070:
144 [X] MSI GeForce RTX 3070 Ventus 3X Intel Core i9-9900K 3.6GHz
NVIDIA GeForce RTX 3070
min:
77.9 fps, P0.1:
100 fps, P1:
121 fps, max:
177 fps
fps
100%
GeForce RTX 3080 Laptop GPU:
144 [X] XMG Neo 15 @165 W TGP Intel Core i7-11800H 2.3GHz
GeForce RTX 3080 Laptop GPU
min:
62.4 fps, P0.1:
91.1 fps, P1:
113 fps, max:
230 fps
144 [X] MSI GS76 Stealth 11UH Intel Core i9-11900H 2.5GHz
GeForce RTX 3080 Laptop GPU
min:
94 fps, P0.1:
110 fps, P1:
117 fps, max:
210 fps
~ 144 fps
100%
NVIDIA GeForce RTX 3070:
144 [X] MSI GeForce RTX 3070 Ventus 3X Intel Core i9-9900K 3.6GHz
NVIDIA GeForce RTX 3070
min:
48.1 fps, P0.1:
92.2 fps, P1:
100 fps, max:
167 fps
fps
100%
GeForce RTX 3080 Laptop GPU:
143 [X] MSI GS76 Stealth 11UH Intel Core i9-11900H 2.5GHz
GeForce RTX 3080 Laptop GPU
min:
46.2 fps, P0.1:
95.2 fps, P1:
109 fps, max:
178 fps
144 [X] XMG Neo 15 @165 W TGP Intel Core i7-11800H 2.3GHz
GeForce RTX 3080 Laptop GPU
min:
47.1 fps, P0.1:
106 fps, P1:
115 fps, max:
228 fps
~ 144 fps
100%
NVIDIA GeForce RTX 3070:
144 [X] MSI GeForce RTX 3070 Ventus 3X Intel Core i9-9900K 3.6GHz
NVIDIA GeForce RTX 3070
min:
37.3 fps, P0.1:
108 fps, P1:
121 fps, max:
185 fps
fps
91%
GeForce RTX 3080 Laptop GPU:
118 [X] MSI GS76 Stealth 11UH Intel Core i9-11900H 2.5GHz
GeForce RTX 3080 Laptop GPU
min:
58.7 fps, P0.1:
66.6 fps, P1:
91.2 fps, max:
143 fps
144 [X] XMG Neo 15 @165 W TGP Intel Core i7-11800H 2.3GHz
GeForce RTX 3080 Laptop GPU
min:
32.6 fps, P0.1:
84.9 fps, P1:
112 fps, max:
180 fps
~ 131 fps
GeForce RTX 3080 Laptop GPU:
175 [X] Aorus 17G YD Intel Core i7-11800H 2.3GHz
GeForce RTX 3080 Laptop GPU
min:
41.1 fps, P0.1:
58.5 fps, P1:
97.5 fps, max:
328 fps
186 [X] Lenovo Legion 7 16ACHg6 AMD Ryzen 9 5900HX 3.3GHz
GeForce RTX 3080 Laptop GPU
min:
44.1 fps, P0.1:
53.5 fps, P1:
97.1 fps, max:
298 fps
~ 181 fps
100%
NVIDIA GeForce RTX 3070:
165 [X] MSI GeForce RTX 3070 Ventus 3X Intel Core i9-9900K 3.6GHz
NVIDIA GeForce RTX 3070
min:
38.1 fps, P0.1:
55.6 fps, P1:
97.5 fps, max:
261 fps
fps
90%
GeForce RTX 3080 Laptop GPU:
139 [X] Aorus 17G YD Intel Core i7-11800H 2.3GHz
GeForce RTX 3080 Laptop GPU
min:
38.7 fps, P0.1:
55.9 fps, P1:
79.2 fps, max:
294 fps
157 [X] Lenovo Legion 7 16ACHg6 AMD Ryzen 9 5900HX 3.3GHz
GeForce RTX 3080 Laptop GPU
min:
42.3 fps, P0.1:
53.2 fps, P1:
94.1 fps, max:
288 fps
~ 148 fps
100%
NVIDIA GeForce RTX 3070:
158 [X] MSI GeForce RTX 3070 Ventus 3X Intel Core i9-9900K 3.6GHz
NVIDIA GeForce RTX 3070
min:
35.9 fps, P0.1:
56.2 fps, P1:
94.2 fps, max:
279 fps
fps
84%
GeForce RTX 3080 Laptop GPU:
126 [X] Aorus 17G YD Intel Core i7-11800H 2.3GHz
GeForce RTX 3080 Laptop GPU
min:
39 fps, P0.1:
56.9 fps, P1:
73.8 fps, max:
273 fps
130 [X] Medion Erazer Beast X25 AMD Ryzen 9 5900HX 3.3GHz
GeForce RTX 3080 Laptop GPU
min:
31.3 fps, P0.1:
48 fps, P1:
68.3 fps, max:
282 fps
140 [X] Lenovo Legion 7 16ACHg6 AMD Ryzen 9 5900HX 3.3GHz
GeForce RTX 3080 Laptop GPU
min:
38.8 fps, P0.1:
50.2 fps, P1:
86.3 fps, max:
276 fps
~ 132 fps
100%
NVIDIA GeForce RTX 3070:
131 [X] MSI GeForce RTX 3070 Ventus 3X Intel Core i9-9900K 3.6GHz
NVIDIA GeForce RTX 3070
min:
36.5 fps, P0.1:
54.2 fps, P1:
84.6 fps, max:
223 fps
fps
77%
GeForce RTX 3080 Laptop GPU:
98.2 [X] Aorus 17G YD Intel Core i7-11800H 2.3GHz
GeForce RTX 3080 Laptop GPU
min:
35.4 fps, P0.1:
48.9 fps, P1:
62.3 fps, max:
221 fps
100 [X] Medion Erazer Beast X25 AMD Ryzen 9 5900HX 3.3GHz
GeForce RTX 3080 Laptop GPU
min:
30.8 fps, P0.1:
44.8 fps, P1:
56.3 fps, max:
234 fps
106 [X] Lenovo Legion 7 16ACHg6 AMD Ryzen 9 5900HX 3.3GHz
GeForce RTX 3080 Laptop GPU
min:
28.9 fps, P0.1:
54.4 fps, P1:
71.3 fps, max:
205 fps
~ 101 fps
100%
NVIDIA GeForce RTX 3070:
99.3 [X] MSI GeForce RTX 3070 Ventus 3X Intel Core i9-9900K 3.6GHz
NVIDIA GeForce RTX 3070
min:
34.7 fps, P0.1:
47.7 fps, P1:
68.2 fps, max:
207 fps
fps
80%
GeForce RTX 3080 Laptop GPU:
79.5 [X] Lenovo Legion 7 16ACHg6 AMD Ryzen 9 5900HX 3.3GHz
GeForce RTX 3080 Laptop GPU
min:
32.3 fps, P0.1:
43.9 fps, P1:
53.6 fps, max:
169 fps
fps
100%
NVIDIA GeForce RTX 3070:
57.8 [X] MSI GeForce RTX 3070 Ventus 3X Intel Core i9-9900K 3.6GHz
NVIDIA GeForce RTX 3070
min:
25 fps, P0.1:
35.8 fps, P1:
42 fps, max:
140 fps
fps
100%
NVIDIA GeForce RTX 3070:
129 [X] MSI GeForce RTX 3070 Ventus 3X Intel Core i9-9900K 3.6GHz
NVIDIA GeForce RTX 3070
min:
26 fps, P0.1:
46.8 fps, P1:
71.2 fps, max:
325 fps
fps
88%
NVIDIA GeForce RTX 3050:
114 [X] AMD Ryzen 9 5900X 3.7GHz
NVIDIA GeForce RTX 3050
min:
22.4 fps, P0.1:
51.6 fps, P1:
65.1 fps, max:
277 fps
fps
101%
GeForce RTX 3080 Laptop GPU:
124 [X] Lenovo Legion 7 16ACHg6 AMD Ryzen 9 5900HX 3.3GHz
GeForce RTX 3080 Laptop GPU
min:
23.5 fps, P0.1:
51.3 fps, P1:
68.6 fps, max:
335 fps
135 [X] Aorus 17G YD Intel Core i7-11800H 2.3GHz
GeForce RTX 3080 Laptop GPU
min:
24 fps, P0.1:
63.4 fps, P1:
73.9 fps, max:
391 fps
~ 130 fps
100%
NVIDIA GeForce RTX 3070:
123 [X] MSI GeForce RTX 3070 Ventus 3X Intel Core i9-9900K 3.6GHz
NVIDIA GeForce RTX 3070
min:
24.6 fps, P0.1:
49.7 fps, P1:
68.1 fps, max:
309 fps
fps
89%
NVIDIA GeForce RTX 3050:
110 [X] AMD Ryzen 9 5900X 3.7GHz
NVIDIA GeForce RTX 3050
min:
27.5 fps, P0.1:
41.9 fps, P1:
63.9 fps, max:
264 fps
fps
92%
GeForce RTX 3080 Laptop GPU:
109 [X] Medion Erazer Beast X25 AMD Ryzen 9 5900HX 3.3GHz
GeForce RTX 3080 Laptop GPU
min:
23.9 fps, P0.1:
42.5 fps, P1:
60.4 fps, max:
336 fps
115 [X] Lenovo Legion 7 16ACHg6 AMD Ryzen 9 5900HX 3.3GHz
GeForce RTX 3080 Laptop GPU
min:
23.4 fps, P0.1:
49.7 fps, P1:
66.4 fps, max:
304 fps
115 [X] Aorus 17G YD Intel Core i7-11800H 2.3GHz
GeForce RTX 3080 Laptop GPU
min:
26.1 fps, P0.1:
56.3 fps, P1:
64.6 fps, max:
365 fps
~ 113 fps
100%
NVIDIA GeForce RTX 3070:
123 [X] MSI GeForce RTX 3070 Ventus 3X Intel Core i9-9900K 3.6GHz
NVIDIA GeForce RTX 3070
min:
24.8 fps, P0.1:
43.3 fps, P1:
67.1 fps, max:
294 fps
fps
77%
NVIDIA GeForce RTX 3050:
94.2 [X] AMD Ryzen 9 5900X 3.7GHz
NVIDIA GeForce RTX 3050
min:
23.7 fps, P0.1:
37.1 fps, P1:
65.7 fps, max:
201 fps
fps
90%
GeForce RTX 3080 Laptop GPU:
111 [X] Lenovo Legion 7 16ACHg6 AMD Ryzen 9 5900HX 3.3GHz
GeForce RTX 3080 Laptop GPU
min:
24.3 fps, P0.1:
54 fps, P1:
63.2 fps, max:
299 fps
fps
100%
NVIDIA GeForce RTX 3070:
105 [X] MSI GeForce RTX 3070 Ventus 3X Intel Core i9-9900K 3.6GHz
NVIDIA GeForce RTX 3070
min:
24.4 fps, P0.1:
33.3 fps, P1:
64.5 fps, max:
294 fps
fps
49%
NVIDIA GeForce RTX 3050:
51.7 [X] AMD Ryzen 9 5900X 3.7GHz
NVIDIA GeForce RTX 3050
min:
32.8 fps, P0.1:
36.1 fps, P1:
44.3 fps, max:
112 fps
fps
GeForce RTX 3080 Laptop GPU:
195 [X] Lenovo Legion 7 16ACHg6 AMD Ryzen 9 5900HX 3.3GHz
GeForce RTX 3080 Laptop GPU
min:
59.7 fps, P0.1:
66 fps, P1:
150 fps, max:
244 fps
fps
100%
NVIDIA GeForce RTX 3070:
185 [X] MSI GeForce RTX 3070 Ventus 3X Intel Core i9-9900K 3.6GHz
NVIDIA GeForce RTX 3070
min:
112 fps, P0.1:
129 fps, P1:
142 fps, max:
242 fps
fps
103%
GeForce RTX 3080 Laptop GPU:
191 [X] Lenovo Legion 7 16ACHg6 AMD Ryzen 9 5900HX 3.3GHz
GeForce RTX 3080 Laptop GPU
min:
62.2 fps, P0.1:
70.4 fps, P1:
142 fps, max:
250 fps
fps
100%
NVIDIA GeForce RTX 3070:
183 [X] MSI GeForce RTX 3070 Ventus 3X Intel Core i9-9900K 3.6GHz
NVIDIA GeForce RTX 3070
min:
124 fps, P0.1:
131 fps, P1:
142 fps, max:
229 fps
fps
91%
GeForce RTX 3080 Laptop GPU:
155 [X] Medion Erazer Beast X25 AMD Ryzen 9 5900HX 3.3GHz
GeForce RTX 3080 Laptop GPU
min:
91.2 fps, P0.1:
98.2 fps, P1:
115 fps, max:
223 fps
163 [X] MSI GS76 Stealth 11UH Intel Core i9-11900H 2.5GHz
GeForce RTX 3080 Laptop GPU
min:
50.3 fps, P0.1:
70.8 fps, P1:
119 fps, max:
256 fps
184 [X] Lenovo Legion 7 16ACHg6 AMD Ryzen 9 5900HX 3.3GHz
GeForce RTX 3080 Laptop GPU
min:
63.4 fps, P0.1:
72.9 fps, P1:
143 fps, max:
227 fps
~ 167 fps
100%
NVIDIA GeForce RTX 3070:
183 [X] MSI GeForce RTX 3070 Ventus 3X Intel Core i9-9900K 3.6GHz
NVIDIA GeForce RTX 3070
min:
118 fps, P0.1:
133 fps, P1:
141 fps, max:
234 fps
fps
83%
GeForce RTX 3080 Laptop GPU:
144 [X] Medion Erazer Beast X25 AMD Ryzen 9 5900HX 3.3GHz
GeForce RTX 3080 Laptop GPU
min:
86.1 fps, P0.1:
94.7 fps, P1:
104 fps, max:
212 fps
145 [X] MSI GS76 Stealth 11UH Intel Core i9-11900H 2.5GHz
GeForce RTX 3080 Laptop GPU
min:
87.7 fps, P0.1:
103 fps, P1:
117 fps, max:
215 fps
168 [X] Lenovo Legion 7 16ACHg6 AMD Ryzen 9 5900HX 3.3GHz
GeForce RTX 3080 Laptop GPU
min:
61.2 fps, P0.1:
67.3 fps, P1:
136 fps, max:
214 fps
~ 152 fps
100%
NVIDIA GeForce RTX 3070:
142 [X] MSI GeForce RTX 3070 Ventus 3X Intel Core i9-9900K 3.6GHz
NVIDIA GeForce RTX 3070
min:
32 fps, P0.1:
116 fps, P1:
120 fps, max:
183 fps
fps
76%
GeForce RTX 3080 Laptop GPU:
99.4 [X] MSI GS76 Stealth 11UH Intel Core i9-11900H 2.5GHz
GeForce RTX 3080 Laptop GPU
min:
73.1 fps, P0.1:
80.7 fps, P1:
83.3 fps, max:
136 fps
116 [X] Lenovo Legion 7 16ACHg6 AMD Ryzen 9 5900HX 3.3GHz
GeForce RTX 3080 Laptop GPU
min:
71.2 fps, P0.1:
78.1 fps, P1:
97.5 fps, max:
152 fps
~ 108 fps
100%
NVIDIA GeForce RTX 3070:
70.8 [X] MSI GeForce RTX 3070 Ventus 3X Intel Core i9-9900K 3.6GHz
NVIDIA GeForce RTX 3070
min:
21.3 fps, P0.1:
33.5 fps, P1:
39.8 fps, max:
98.5 fps
fps
73%
GeForce RTX 3080 Laptop GPU:
51.7 [X] MSI GS76 Stealth 11UH Intel Core i9-11900H 2.5GHz
GeForce RTX 3080 Laptop GPU
min:
43.3 fps, P0.1:
44 fps, P1:
44.9 fps, max:
67.9 fps
fps
GeForce RTX 3080 Laptop GPU:
111 119 [X] Aorus 17G YD Intel Core i7-11800H 2.3GHz
GeForce RTX 3080 Laptop GPU
min:
20.3 fps, P0.1:
42.6 fps, P1:
55.1 fps, max:
212 fps
125 [X] Lenovo Legion 7 16ACHg6 AMD Ryzen 9 5900HX 3.3GHz
GeForce RTX 3080 Laptop GPU
min:
17.3 fps, P0.1:
39.6 fps, P1:
63.7 fps, max:
193 fps
~ 118 fps
GeForce RTX 3080 Laptop GPU:
101 [X] Aorus 17G YD Intel Core i7-11800H 2.3GHz
GeForce RTX 3080 Laptop GPU
min:
17.8 fps, P0.1:
29.9 fps, P1:
43.9 fps, max:
164 fps
102 123 [X] Lenovo Legion 7 16ACHg6 AMD Ryzen 9 5900HX 3.3GHz
GeForce RTX 3080 Laptop GPU
min:
31 fps, P0.1:
39.5 fps, P1:
53.8 fps, max:
197 fps
~ 109 fps
GeForce RTX 3080 Laptop GPU:
109 110 [X] Aorus 17G YD Intel Core i7-11800H 2.3GHz
GeForce RTX 3080 Laptop GPU
min:
23.1 fps, P0.1:
33.4 fps, P1:
50.6 fps, max:
203 fps
122 [X] Lenovo Legion 7 16ACHg6 AMD Ryzen 9 5900HX 3.3GHz
GeForce RTX 3080 Laptop GPU
min:
34.9 fps, P0.1:
37.6 fps, P1:
51.2 fps, max:
195 fps
~ 114 fps
GeForce RTX 3080 Laptop GPU:
98.9 106 [X] Aorus 17G YD Intel Core i7-11800H 2.3GHz
GeForce RTX 3080 Laptop GPU
min:
33.5 fps, P0.1:
39 fps, P1:
52.3 fps, max:
204 fps
124 [X] Lenovo Legion 7 16ACHg6 AMD Ryzen 9 5900HX 3.3GHz
GeForce RTX 3080 Laptop GPU
min:
34.3 fps, P0.1:
44.4 fps, P1:
64.6 fps, max:
195 fps
~ 110 fps
GeForce RTX 3080 Laptop GPU:
91.1 [X] Lenovo Legion 7 16ACHg6 AMD Ryzen 9 5900HX 3.3GHz
GeForce RTX 3080 Laptop GPU
min:
36.8 fps, P0.1:
39.8 fps, P1:
50.9 fps, max:
191 fps
fps
100%
NVIDIA GeForce RTX 3070:
171 [X] MSI GeForce RTX 3070 Ventus 3X Intel Core i9-9900K 3.6GHz
NVIDIA GeForce RTX 3070
min:
93 fps
fps
100%
NVIDIA GeForce RTX 3070:
167 [X] MSI GeForce RTX 3070 Ventus 3X Intel Core i9-9900K 3.6GHz
NVIDIA GeForce RTX 3070
min:
87 fps
fps
100%
NVIDIA GeForce RTX 3070:
165 [X] MSI GeForce RTX 3070 Ventus 3X Intel Core i9-9900K 3.6GHz
NVIDIA GeForce RTX 3070
max:
82 fps
fps
100%
NVIDIA GeForce RTX 3070:
140 [X] MSI GeForce RTX 3070 Ventus 3X Intel Core i9-9900K 3.6GHz
NVIDIA GeForce RTX 3070
min:
81 fps
fps
83%
GeForce RTX 3080 Laptop GPU:
115.9 fps
100%
NVIDIA GeForce RTX 3070:
77.5 [X] MSI GeForce RTX 3070 Ventus 3X Intel Core i9-9900K 3.6GHz
NVIDIA GeForce RTX 3070
min:
51 fps
fps
100%
NVIDIA GeForce RTX 3070:
125 132 [X] AMD Ryzen 9 5900X 3.7GHz
NVIDIA GeForce RTX 3070
min:
22.4 fps, P0.1:
76 fps, P1:
92.3 fps, max:
221 fps
~ 129 fps
60%
NVIDIA GeForce RTX 3050:
77 [X] AMD Ryzen 9 5900X 3.7GHz
NVIDIA GeForce RTX 3050
min:
31.2 fps, P0.1:
41.5 fps, P1:
63.7 fps, max:
213 fps
fps
93%
GeForce RTX 3080 Laptop GPU:
105 105 111.6 113 [X] Alienware m17 R4 Intel Core i9-10980HK 2.4GHz
GeForce RTX 3080 Laptop GPU
min:
19.3 fps, P0.1:
63.7 fps, P1:
76.7 fps, max:
216 fps
139 147 ~ 120 fps
100%
NVIDIA GeForce RTX 3070:
108 [X] AMD Ryzen 9 5900X 3.7GHz
NVIDIA GeForce RTX 3070
min:
20.3 fps, P0.1:
71.9 fps, P1:
82.9 fps, max:
187 fps
108 ~ 108 fps
59%
NVIDIA GeForce RTX 3050:
63.2 [X] AMD Ryzen 9 5900X 3.7GHz
NVIDIA GeForce RTX 3050
min:
27.7 fps, P0.1:
46.3 fps, P1:
52.1 fps, max:
84.7 fps
fps
93%
GeForce RTX 3080 Laptop GPU:
86 94.4 99.2 99.9 104 [X] Alienware m17 R4 Intel Core i9-10980HK 2.4GHz
GeForce RTX 3080 Laptop GPU
min:
15.4 fps, P0.1:
64.5 fps, P1:
78 fps, max:
159 fps
116 ~ 100 fps
100%
NVIDIA GeForce RTX 3070:
92.4 [X] AMD Ryzen 9 5900X 3.7GHz
NVIDIA GeForce RTX 3070
min:
20.7 fps, P0.1:
64 fps, P1:
72.2 fps, max:
162 fps
93.1 ~ 93 fps
54%
NVIDIA GeForce RTX 3050:
50.6 [X] AMD Ryzen 9 5900X 3.7GHz
NVIDIA GeForce RTX 3050
min:
27.6 fps, P0.1:
41.1 fps, P1:
43.9 fps, max:
80.1 fps
fps
100%
NVIDIA GeForce RTX 3070:
80.6 81 [X] AMD Ryzen 9 5900X 3.7GHz
NVIDIA GeForce RTX 3070
min:
8.01 fps, P0.1:
51.5 fps, P1:
63 fps, max:
143 fps
~ 81 fps
52%
NVIDIA GeForce RTX 3050:
41.9 [X] AMD Ryzen 9 5900X 3.7GHz
NVIDIA GeForce RTX 3050
min:
6.99 fps, P0.1:
31 fps, P1:
36.6 fps, max:
82 fps
fps
100%
NVIDIA GeForce RTX 3070:
53.7 54.8 [X] AMD Ryzen 9 5900X 3.7GHz
NVIDIA GeForce RTX 3070
min:
21.3 fps, P0.1:
42 fps, P1:
46.5 fps, max:
138 fps
~ 54 fps
48%
NVIDIA GeForce RTX 3050:
26 [X] AMD Ryzen 9 5900X 3.7GHz
NVIDIA GeForce RTX 3050
min:
7.09 fps, P0.1:
22.6 fps, P1:
23.5 fps, max:
91.2 fps
fps
100%
NVIDIA GeForce RTX 3070:
26.6 27.9 [X] AMD Ryzen 9 5900X 3.7GHz
NVIDIA GeForce RTX 3070
min:
6.44 fps, P0.1:
21.5 fps, P1:
24.6 fps, max:
186 fps
~ 27 fps
45%
NVIDIA GeForce RTX 3050:
12.2 [X] AMD Ryzen 9 5900X 3.7GHz
NVIDIA GeForce RTX 3050
min:
6.99 fps, P0.1:
10.7 fps, P1:
11.2 fps, max:
52.9 fps
fps
85%
GeForce RTX 3080 Laptop GPU:
19.7 21.4 [X] Gigabyte Aero 17 HDR YC Intel Core i9-10980HK 2.4GHz
GeForce RTX 3080 Laptop GPU
min:
13.7 fps, P0.1:
15.4 fps, P1:
17.1 fps, max:
64.3 fps
27.9 ~ 23 fps
100%
NVIDIA GeForce RTX 3070:
115 [X] AMD Ryzen 9 5900X 3.7GHz
NVIDIA GeForce RTX 3070
min:
33 fps, max:
188 fps
148 ~ 132 fps
104%
NVIDIA GeForce RTX 3050:
137 [X] AMD Ryzen 9 5900X 3.7GHz
NVIDIA GeForce RTX 3050
fps
110%
GeForce RTX 3080 Laptop GPU:
117 172 ~ 145 fps
100%
NVIDIA GeForce RTX 3070:
92 [X] AMD Ryzen 9 5900X 3.7GHz
NVIDIA GeForce RTX 3070
min:
26 fps, max:
161 fps
109 ~ 101 fps
85%
NVIDIA GeForce RTX 3050:
86 [X] AMD Ryzen 9 5900X 3.7GHz
NVIDIA GeForce RTX 3050
fps
114%
GeForce RTX 3080 Laptop GPU:
105 125 ~ 115 fps
100%
NVIDIA GeForce RTX 3070:
83 [X] AMD Ryzen 9 5900X 3.7GHz
NVIDIA GeForce RTX 3070
min:
28 fps, max:
134 fps
96 ~ 90 fps
87%
NVIDIA GeForce RTX 3050:
78 [X] AMD Ryzen 9 5900X 3.7GHz
NVIDIA GeForce RTX 3050
fps
110%
GeForce RTX 3080 Laptop GPU:
88 94 98 116 ~ 99 fps
100%
NVIDIA GeForce RTX 3070:
81 [X] AMD Ryzen 9 5900X 3.7GHz
NVIDIA GeForce RTX 3070
min:
29 fps, max:
147 fps
88 ~ 85 fps
82%
NVIDIA GeForce RTX 3050:
70 [X] AMD Ryzen 9 5900X 3.7GHz
NVIDIA GeForce RTX 3050
fps
109%
GeForce RTX 3080 Laptop GPU:
82 89 92 108 ~ 93 fps
100%
NVIDIA GeForce RTX 3070:
68 [X] AMD Ryzen 9 5900X 3.7GHz
NVIDIA GeForce RTX 3070
min:
28 fps, max:
125 fps
76 ~ 72 fps
76%
NVIDIA GeForce RTX 3050:
55 [X] AMD Ryzen 9 5900X 3.7GHz
NVIDIA GeForce RTX 3050
fps
97%
GeForce RTX 3080 Laptop GPU:
64 76 ~ 70 fps
100%
NVIDIA GeForce RTX 3070:
50 [X] AMD Ryzen 9 5900X 3.7GHz
NVIDIA GeForce RTX 3070
min:
18 fps, max:
102 fps
54 ~ 52 fps
65%
NVIDIA GeForce RTX 3050:
34 [X] AMD Ryzen 9 5900X 3.7GHz
NVIDIA GeForce RTX 3050
fps
90%
GeForce RTX 3080 Laptop GPU:
44 50 ~ 47 fps
100%
NVIDIA GeForce RTX 3070:
109 [X] AMD Ryzen 9 5900X 3.7GHz
NVIDIA GeForce RTX 3070
min:
31.8 fps, P0.1:
65.7 fps, P1:
77.7 fps, max:
152 fps
fps
131%
GeForce RTX 3080 Laptop GPU:
141 [X] Aorus 17G YD Intel Core i7-11800H 2.3GHz
GeForce RTX 3080 Laptop GPU
min:
74.5 fps, P0.1:
87.7 fps, P1:
104 fps, max:
166 fps
144 [X] Lenovo Legion 7 16ACHg6 AMD Ryzen 9 5900HX 3.3GHz
GeForce RTX 3080 Laptop GPU
min:
77.6 fps, P0.1:
88.2 fps, P1:
97.3 fps, max:
175 fps
~ 143 fps
100%
NVIDIA GeForce RTX 3070:
109 [X] AMD Ryzen 9 5900X 3.7GHz
NVIDIA GeForce RTX 3070
min:
37.8 fps, P0.1:
62.3 fps, P1:
76 fps, max:
145 fps
fps
119%
GeForce RTX 3080 Laptop GPU:
121 [X] Aorus 17G YD Intel Core i7-11800H 2.3GHz
GeForce RTX 3080 Laptop GPU
min:
67.8 fps, P0.1:
73.4 fps, P1:
88.2 fps, max:
165 fps
139 [X] Lenovo Legion 7 16ACHg6 AMD Ryzen 9 5900HX 3.3GHz
GeForce RTX 3080 Laptop GPU
min:
76.1 fps, P0.1:
85.8 fps, P1:
97.2 fps, max:
172 fps
~ 130 fps
100%
NVIDIA GeForce RTX 3070:
116 [X] AMD Ryzen 9 5900X 3.7GHz
NVIDIA GeForce RTX 3070
min:
26.2 fps, P0.1:
67.4 fps, P1:
79.2 fps, max:
154 fps
fps
105%
GeForce RTX 3080 Laptop GPU:
112 117 [X] Aorus 17G YD Intel Core i7-11800H 2.3GHz
GeForce RTX 3080 Laptop GPU
min:
62.5 fps, P0.1:
71.5 fps, P1:
86 fps, max:
158 fps
138 [X] Lenovo Legion 7 16ACHg6 AMD Ryzen 9 5900HX 3.3GHz
GeForce RTX 3080 Laptop GPU
min:
69.3 fps, P0.1:
83.7 fps, P1:
94.5 fps, max:
171 fps
~ 122 fps
100%
NVIDIA GeForce RTX 3070:
111 [X] AMD Ryzen 9 5900X 3.7GHz
NVIDIA GeForce RTX 3070
min:
54.6 fps, P0.1:
63.5 fps, P1:
78.1 fps, max:
140 fps
fps
101%
GeForce RTX 3080 Laptop GPU:
101 108 [X] Aorus 17G YD Intel Core i7-11800H 2.3GHz
GeForce RTX 3080 Laptop GPU
min:
62.2 fps, P0.1:
69.4 fps, P1:
80.6 fps, max:
154 fps
126 [X] Lenovo Legion 7 16ACHg6 AMD Ryzen 9 5900HX 3.3GHz
GeForce RTX 3080 Laptop GPU
min:
59.9 fps, P0.1:
65.1 fps, P1:
82.5 fps, max:
169 fps
~ 112 fps
100%
NVIDIA GeForce RTX 3070:
96 [X] AMD Ryzen 9 5900X 3.7GHz
NVIDIA GeForce RTX 3070
min:
36.7 fps, P0.1:
58.5 fps, P1:
63.5 fps, max:
135 fps
fps
79%
GeForce RTX 3080 Laptop GPU:
67.1 85.2 [X] Lenovo Legion 7 16ACHg6 AMD Ryzen 9 5900HX 3.3GHz
GeForce RTX 3080 Laptop GPU
min:
50.2 fps, P0.1:
51.2 fps, P1:
55.8 fps, max:
165 fps
~ 76 fps
100%
NVIDIA GeForce RTX 3070:
51.7 [X] AMD Ryzen 9 5900X 3.7GHz
NVIDIA GeForce RTX 3070
min:
26.1 fps, P0.1:
30.1 fps, P1:
37.7 fps, max:
98.6 fps
fps
69%
GeForce RTX 3080 Laptop GPU:
35.8 fps
100%
NVIDIA GeForce RTX 3070:
141 [X] AMD Ryzen 9 5900X 3.7GHz
NVIDIA GeForce RTX 3070
min:
41.9 fps, P0.1:
82.4 fps, P1:
98.9 fps, max:
247 fps
205 [X] AMD Ryzen 9 5900X 3.7GHz
NVIDIA GeForce RTX 3070
min:
33.3 fps, P0.1:
101 fps, P1:
128 fps, max:
519 fps
239 ~ 195 fps
100%
NVIDIA GeForce RTX 3070:
133 [X] AMD Ryzen 9 5900X 3.7GHz
NVIDIA GeForce RTX 3070
min:
34.3 fps, P0.1:
75.8 fps, P1:
87.9 fps, max:
266 fps
146 186 [X] AMD Ryzen 9 5900X 3.7GHz
NVIDIA GeForce RTX 3070
min:
57.2 fps, P0.1:
93.8 fps, P1:
110 fps, max:
463 fps
~ 155 fps
100%
NVIDIA GeForce RTX 3070:
117 [X] AMD Ryzen 9 5900X 3.7GHz
NVIDIA GeForce RTX 3070
min:
18.9 fps, P0.1:
21.5 fps, P1:
78.5 fps, max:
220 fps
124 132 [X] AMD Ryzen 9 5900X 3.7GHz
NVIDIA GeForce RTX 3070
min:
40.9 fps, P0.1:
61.9 fps, P1:
76.6 fps, max:
309 fps
~ 124 fps
77%
GeForce RTX 3080 Laptop GPU:
89.4 100 [X] Gigabyte Aero 17 HDR YC Intel Core i9-10980HK 2.4GHz
GeForce RTX 3080 Laptop GPU
min:
13.6 fps, P0.1:
16.5 fps, P1:
19.4 fps, max:
235 fps
~ 95 fps
100%
NVIDIA GeForce RTX 3070:
95.7 [X] AMD Ryzen 9 5900X 3.7GHz
NVIDIA GeForce RTX 3070
min:
21.6 fps, P0.1:
37.6 fps, P1:
58 fps, max:
166 fps
120 122 [X] AMD Ryzen 9 5900X 3.7GHz
NVIDIA GeForce RTX 3070
min:
45 fps, P0.1:
57.3 fps, P1:
67.9 fps, max:
301 fps
~ 113 fps
77%
GeForce RTX 3080 Laptop GPU:
81.7 92 [X] Gigabyte Aero 17 HDR YC Intel Core i9-10980HK 2.4GHz
GeForce RTX 3080 Laptop GPU
min:
13.4 fps, P0.1:
15.9 fps, P1:
18.8 fps, max:
244 fps
~ 87 fps
100%
NVIDIA GeForce RTX 3070:
83 [X] AMD Ryzen 9 5900X 3.7GHz
NVIDIA GeForce RTX 3070
min:
22.7 fps, P0.1:
30 fps, P1:
52.1 fps, max:
158 fps
89.5 107 [X] AMD Ryzen 9 5900X 3.7GHz
NVIDIA GeForce RTX 3070
min:
43.6 fps, P0.1:
54 fps, P1:
62.7 fps, max:
272 fps
~ 93 fps
71%
GeForce RTX 3080 Laptop GPU:
62.8 68.9 [X] Gigabyte Aero 17 HDR YC Intel Core i9-10980HK 2.4GHz
GeForce RTX 3080 Laptop GPU
min:
13.3 fps, P0.1:
15.8 fps, P1:
19.4 fps, max:
190 fps
~ 66 fps
100%
NVIDIA GeForce RTX 3070:
43.8 50.2 [X] AMD Ryzen 9 5900X 3.7GHz
NVIDIA GeForce RTX 3070
min:
16.1 fps, P0.1:
25.6 fps, P1:
36.1 fps, max:
146 fps
74 [X] AMD Ryzen 9 5900X 3.7GHz
NVIDIA GeForce RTX 3070
min:
32.6 fps, P0.1:
43.5 fps, P1:
50.6 fps, max:
270 fps
~ 56 fps
68%
GeForce RTX 3080 Laptop GPU:
36.9 39.8 [X] Gigabyte Aero 17 HDR YC Intel Core i9-10980HK 2.4GHz
GeForce RTX 3080 Laptop GPU
min:
15 fps, P0.1:
15.9 fps, P1:
19 fps, max:
81 fps
~ 38 fps
100%
NVIDIA GeForce RTX 3070:
125 [X] AMD Ryzen 9 5900X 3.7GHz
NVIDIA GeForce RTX 3070
min:
7 fps, max:
174 fps
130 133 [X] AMD Ryzen 9 5900X 3.7GHz
NVIDIA GeForce RTX 3070
min:
23 fps, max:
182 fps
~ 129 fps
82%
NVIDIA GeForce RTX 3050:
106 [X] AMD Ryzen 9 5900X 3.7GHz
NVIDIA GeForce RTX 3050
fps
105%
GeForce RTX 3080 Laptop GPU:
121 127 134 162 [X] Acemagic Tank03 Intel Core i9-12900H 1.8GHz
GeForce RTX 3080 Laptop GPU
min:
14 fps, P0.1:
79 fps, P1:
118 fps, max:
213 fps
~ 136 fps
100%
NVIDIA GeForce RTX 3070:
100 [X] AMD Ryzen 9 5900X 3.7GHz
NVIDIA GeForce RTX 3070
min:
21 fps, max:
154 fps
100 103 [X] AMD Ryzen 9 5900X 3.7GHz
NVIDIA GeForce RTX 3070
min:
40 fps, max:
171 fps
~ 101 fps
74%
NVIDIA GeForce RTX 3050:
75 [X] AMD Ryzen 9 5900X 3.7GHz
NVIDIA GeForce RTX 3050
fps
99%
GeForce RTX 3080 Laptop GPU:
93 93 98 115 [X] Acemagic Tank03 Intel Core i9-12900H 1.8GHz
GeForce RTX 3080 Laptop GPU
min:
55 fps, P0.1:
71 fps, P1:
86 fps, max:
179 fps
~ 100 fps
100%
NVIDIA GeForce RTX 3070:
85 87 [X] AMD Ryzen 9 5900X 3.7GHz
NVIDIA GeForce RTX 3070
min:
9 fps, max:
147 fps
87 [X] AMD Ryzen 9 5900X 3.7GHz
NVIDIA GeForce RTX 3070
min:
42 fps, max:
153 fps
~ 86 fps
72%
NVIDIA GeForce RTX 3050:
62 [X] AMD Ryzen 9 5900X 3.7GHz
NVIDIA GeForce RTX 3050
fps
94%
GeForce RTX 3080 Laptop GPU:
72 74 79 79 85 96 [X] Acemagic Tank03 Intel Core i9-12900H 1.8GHz
GeForce RTX 3080 Laptop GPU
min:
51 fps, max:
180 fps
~ 81 fps
100%
NVIDIA GeForce RTX 3070:
77 78 [X] AMD Ryzen 9 5900X 3.7GHz
NVIDIA GeForce RTX 3070
min:
15 fps, max:
139 fps
80 [X] AMD Ryzen 9 5900X 3.7GHz
NVIDIA GeForce RTX 3070
min:
40 fps, max:
147 fps
~ 78 fps
68%
NVIDIA GeForce RTX 3050:
53 [X] AMD Ryzen 9 5900X 3.7GHz
NVIDIA GeForce RTX 3050
fps
91%
GeForce RTX 3080 Laptop GPU:
64 65 68 69 76 84 [X] Acemagic Tank03 Intel Core i9-12900H 1.8GHz
GeForce RTX 3080 Laptop GPU
min:
41 fps, P0.1:
49 fps, P1:
58 fps, max:
168 fps
~ 71 fps
100%
NVIDIA GeForce RTX 3070:
65 [X] AMD Ryzen 9 5900X 3.7GHz
NVIDIA GeForce RTX 3070
min:
37 fps, max:
124 fps
65 67 [X] AMD Ryzen 9 5900X 3.7GHz
NVIDIA GeForce RTX 3070
min:
39 fps, max:
124 fps
~ 66 fps
61%
NVIDIA GeForce RTX 3050:
40 [X] AMD Ryzen 9 5900X 3.7GHz
NVIDIA GeForce RTX 3050
fps
86%
GeForce RTX 3080 Laptop GPU:
52 54 65 [X] Acemagic Tank03 Intel Core i9-12900H 1.8GHz
GeForce RTX 3080 Laptop GPU
min:
38 fps, P0.1:
40 fps, P1:
46 fps, max:
139 fps
~ 57 fps
100%
NVIDIA GeForce RTX 3070:
42 [X] AMD Ryzen 9 5900X 3.7GHz
NVIDIA GeForce RTX 3070
min:
30 fps, max:
108 fps
43 47 [X] AMD Ryzen 9 5900X 3.7GHz
NVIDIA GeForce RTX 3070
min:
31 fps, max:
92 fps
~ 44 fps
55%
NVIDIA GeForce RTX 3050:
24 [X] AMD Ryzen 9 5900X 3.7GHz
NVIDIA GeForce RTX 3050
fps
82%
GeForce RTX 3080 Laptop GPU:
33 36 39 [X] Acemagic Tank03 Intel Core i9-12900H 1.8GHz
GeForce RTX 3080 Laptop GPU
min:
26 fps, P0.1:
27 fps, P1:
29 fps, max:
105 fps
~ 36 fps
100%
NVIDIA GeForce RTX 3070:
169 [X] AMD Ryzen 9 5900X 3.7GHz
NVIDIA GeForce RTX 3070
min:
95 fps, P0.1:
127.4 fps, P1:
147.3 fps, max:
220.8 fps
179 [X] AMD Ryzen 9 5900X 3.7GHz
NVIDIA GeForce RTX 3070
min:
56.2 fps, P0.1:
126.2 fps, P1:
156.8 fps, max:
212.5 fps
248.1 ~ 199 fps
108%
NVIDIA GeForce RTX 3050:
214 [X] AMD Ryzen 9 5900X 3.7GHz
NVIDIA GeForce RTX 3050
fps
86%
GeForce RTX 3080 Laptop GPU:
110 155 178 [X] Aorus 17G YD Intel Core i7-11800H 2.3GHz
GeForce RTX 3080 Laptop GPU
min:
138.5 fps, P0.1:
144.1 fps, P1:
151.8 fps, max:
226.2 fps
190 193 [X] Lenovo Legion 7 16ACHg6 AMD Ryzen 9 5900HX 3.3GHz
GeForce RTX 3080 Laptop GPU
min:
17.6 fps, P0.1:
159.8 fps, P1:
167.9 fps, max:
233.5 fps
205.8 [X] Acemagic Tank03 Intel Core i9-12900H 1.8GHz
GeForce RTX 3080 Laptop GPU
min:
26.1 fps, P0.1:
162.2 fps, P1:
173.8 fps, max:
259.4 fps
~ 172 fps
100%
NVIDIA GeForce RTX 3070:
119 [X] AMD Ryzen 9 5900X 3.7GHz
NVIDIA GeForce RTX 3070
min:
66.6 fps, P0.1:
94.2 fps, P1:
104 fps, max:
176.1 fps
122 [X] AMD Ryzen 9 5900X 3.7GHz
NVIDIA GeForce RTX 3070
min:
50.3 fps, P0.1:
95.3 fps, P1:
105.8 fps, max:
148.4 fps
191.8 ~ 144 fps
72%
NVIDIA GeForce RTX 3050:
103 [X] AMD Ryzen 9 5900X 3.7GHz
NVIDIA GeForce RTX 3050
fps
87%
GeForce RTX 3080 Laptop GPU:
97.1 114 120 123 [X] Aorus 17G YD Intel Core i7-11800H 2.3GHz
GeForce RTX 3080 Laptop GPU
min:
55.2 fps, P0.1:
86.9 fps, P1:
93.5 fps, max:
173.2 fps
141 [X] Lenovo Legion 7 16ACHg6 AMD Ryzen 9 5900HX 3.3GHz
GeForce RTX 3080 Laptop GPU
min:
95.7 fps, P0.1:
104.9 fps, P1:
121.5 fps, max:
181.4 fps
152.4 [X] Acemagic Tank03 Intel Core i9-12900H 1.8GHz
GeForce RTX 3080 Laptop GPU
min:
25.4 fps, P0.1:
99.1 fps, P1:
124.8 fps, max:
203.5 fps
~ 125 fps
100%
NVIDIA GeForce RTX 3070:
102 [X] AMD Ryzen 9 5900X 3.7GHz
NVIDIA GeForce RTX 3070
min:
59.6 fps, P0.1:
75.5 fps, P1:
88 fps, max:
167.6 fps
106 [X] AMD Ryzen 9 5900X 3.7GHz
NVIDIA GeForce RTX 3070
min:
42 fps, P0.1:
83.8 fps, P1:
91.5 fps, max:
127.8 fps
157 ~ 122 fps
67%
NVIDIA GeForce RTX 3050:
82 [X] AMD Ryzen 9 5900X 3.7GHz
NVIDIA GeForce RTX 3050
fps
84%
GeForce RTX 3080 Laptop GPU:
85.6 93.3 97.3 99.3 104 [X] Aorus 17G YD Intel Core i7-11800H 2.3GHz
GeForce RTX 3080 Laptop GPU
min:
57.5 fps, P0.1:
75.7 fps, P1:
82.2 fps, max:
159.1 fps
117 [X] Lenovo Legion 7 16ACHg6 AMD Ryzen 9 5900HX 3.3GHz
GeForce RTX 3080 Laptop GPU
min:
85.5 fps, P0.1:
90 fps, P1:
102.4 fps, max:
147.9 fps
123.4 [X] Acemagic Tank03 Intel Core i9-12900H 1.8GHz
GeForce RTX 3080 Laptop GPU
min:
25 fps, P0.1:
90.7 fps, P1:
105.5 fps, max:
162.8 fps
~ 103 fps
100%
NVIDIA GeForce RTX 3070:
86 [X] AMD Ryzen 9 5900X 3.7GHz
NVIDIA GeForce RTX 3070
min:
56.3 fps, P0.1:
71.4 fps, P1:
74.7 fps, max:
152.9 fps
89.3 [X] AMD Ryzen 9 5900X 3.7GHz
NVIDIA GeForce RTX 3070
min:
64.9 fps, P0.1:
71.6 fps, P1:
77 fps, max:
109.6 fps
122.1 ~ 99 fps
62%
NVIDIA GeForce RTX 3050:
61 [X] AMD Ryzen 9 5900X 3.7GHz
NVIDIA GeForce RTX 3050
fps
90%
GeForce RTX 3080 Laptop GPU:
56.4 76.5 81 87.5 [X] Aorus 17G YD Intel Core i7-11800H 2.3GHz
GeForce RTX 3080 Laptop GPU
min:
58.8 fps, P0.1:
65.7 fps, P1:
71.2 fps, max:
139.1 fps
88.2 [X] Acer Nitro 5 AN517-41-R9S5 FW-Update
AMD Ryzen 7 5800H 3.2GHz
GeForce RTX 3080 Laptop GPU
min:
48.8 fps, P0.1:
69.4 fps, P1:
75.6 fps, max:
167.7 fps
92.4 95.2 [X] Acemagic Tank03 Intel Core i9-12900H 1.8GHz
GeForce RTX 3080 Laptop GPU
min:
23.9 fps, P0.1:
73.4 fps, P1:
81.2 fps, max:
132.2 fps
97.1 [X] Lenovo Legion 7 16ACHg6 AMD Ryzen 9 5900HX 3.3GHz
GeForce RTX 3080 Laptop GPU
min:
54.6 fps, P0.1:
78.8 fps, P1:
82.9 fps, max:
114.6 fps
108 [X] Lenovo Legion 7 16ACHg6 Leistung
AMD Ryzen 9 5900HX 3.3GHz
GeForce RTX 3080 Laptop GPU
min:
57.8 fps, P0.1:
84.2 fps, P1:
93.5 fps, max:
175.3 fps
110 [X] Lenovo Legion 7 16ACHg6 Leistung Overclocking
AMD Ryzen 9 5900HX 3.3GHz
GeForce RTX 3080 Laptop GPU
min:
58 fps, P0.1:
82.5 fps, P1:
95.1 fps, max:
186.2 fps
~ 89 fps
100%
NVIDIA GeForce RTX 3070:
74 [X] AMD Ryzen 9 5900X 3.7GHz
NVIDIA GeForce RTX 3070
min:
43.9 fps, P0.1:
60.2 fps, P1:
64.6 fps, max:
134 fps
75.9 [X] AMD Ryzen 9 5900X 3.7GHz
NVIDIA GeForce RTX 3070
min:
43.9 fps, P0.1:
62.6 fps, P1:
66.2 fps, max:
91.9 fps
99 ~ 83 fps
59%
NVIDIA GeForce RTX 3050:
49 [X] AMD Ryzen 9 5900X 3.7GHz
NVIDIA GeForce RTX 3050
fps
94%
GeForce RTX 3080 Laptop GPU:
42.7 77.5 [X] Acemagic Tank03 Intel Core i9-12900H 1.8GHz
GeForce RTX 3080 Laptop GPU
min:
25.7 fps, P0.1:
66.5 fps, P1:
62.6 fps, max:
100.2 fps
80.2 [X] Lenovo Legion 7 16ACHg6 AMD Ryzen 9 5900HX 3.3GHz
GeForce RTX 3080 Laptop GPU
min:
57.4 fps, P0.1:
59.3 fps, P1:
69.6 fps, max:
95 fps
92.4 [X] Lenovo Legion 7 16ACHg6 Leistung
AMD Ryzen 9 5900HX 3.3GHz
GeForce RTX 3080 Laptop GPU
min:
66.7 fps, P0.1:
70.4 fps, P1:
79.8 fps, max:
133.7 fps
96.5 [X] Lenovo Legion 7 16ACHg6 Leistung Overclocking
AMD Ryzen 9 5900HX 3.3GHz
GeForce RTX 3080 Laptop GPU
min:
62.3 fps, P0.1:
73 fps, P1:
81.6 fps, max:
152 fps
~ 78 fps
100%
NVIDIA GeForce RTX 3070:
52.9 [X] AMD Ryzen 9 5900X 3.7GHz
NVIDIA GeForce RTX 3070
min:
40.2 fps, P0.1:
41.7 fps, P1:
46.4 fps, max:
72.2 fps
54.7 [X] AMD Ryzen 9 5900X 3.7GHz
NVIDIA GeForce RTX 3070
min:
40.4 fps, P0.1:
46.3 fps, P1:
48.8 fps, max:
64.6 fps
65.3 ~ 58 fps
53%
NVIDIA GeForce RTX 3050:
31 [X] AMD Ryzen 9 5900X 3.7GHz
NVIDIA GeForce RTX 3050
fps
78%
GeForce RTX 3080 Laptop GPU:
39.6 49.6 [X] Acemagic Tank03 Intel Core i9-12900H 1.8GHz
GeForce RTX 3080 Laptop GPU
min:
14.8 fps, P0.1:
26.1 fps, P1:
43.7 fps, max:
62.4 fps
~ 45 fps
100%
NVIDIA GeForce RTX 3070:
100 [X] AMD Ryzen 9 5900X 3.7GHz
NVIDIA GeForce RTX 3070
min:
30.45 fps, P1:
71.11 fps, max:
167.43 fps
122 [X] AMD Ryzen 9 5900X 3.7GHz
NVIDIA GeForce RTX 3070
min:
43.27 fps, P1:
85.83 fps, max:
203.5 fps
125 129 ~ 119 fps
104%
NVIDIA GeForce RTX 3050:
124 [X] AMD Ryzen 9 5900X 3.7GHz
NVIDIA GeForce RTX 3050
fps
93%
GeForce RTX 3080 Laptop GPU:
93 112 [X] Acemagic Tank03 Intel Core i9-12900H 1.8GHz
GeForce RTX 3080 Laptop GPU
min:
38 fps, P0.1:
62 fps, P1:
81 fps, max:
185 fps
127 ~ 111 fps
100%
NVIDIA GeForce RTX 3070:
100 [X] AMD Ryzen 9 5900X 3.7GHz
NVIDIA GeForce RTX 3070
min:
46.29 fps, P1:
73.18 fps, max:
164.42 fps
118 [X] AMD Ryzen 9 5900X 3.7GHz
NVIDIA GeForce RTX 3070
min:
41.63 fps, P1:
81.53 fps, max:
198.14 fps
123 127 ~ 117 fps
73%
NVIDIA GeForce RTX 3050:
85 [X] AMD Ryzen 9 5900X 3.7GHz
NVIDIA GeForce RTX 3050
fps
92%
GeForce RTX 3080 Laptop GPU:
90.8 110 [X] Acemagic Tank03 Intel Core i9-12900H 1.8GHz
GeForce RTX 3080 Laptop GPU
min:
41 fps, P0.1:
74 fps, P1:
83 fps, max:
167 fps
123 ~ 108 fps
100%
NVIDIA GeForce RTX 3070:
88.9 [X] AMD Ryzen 9 5900X 3.7GHz
NVIDIA GeForce RTX 3070
min:
39.08 fps, P1:
62.58 fps, max:
145.79 fps
109 112 [X] AMD Ryzen 9 5900X 3.7GHz
NVIDIA GeForce RTX 3070
min:
18.04 fps, P1:
78.99 fps, max:
177.29 fps
113 ~ 106 fps
69%
NVIDIA GeForce RTX 3050:
73 [X] AMD Ryzen 9 5900X 3.7GHz
NVIDIA GeForce RTX 3050
fps
89%
GeForce RTX 3080 Laptop GPU:
79.9 82 97 [X] Acemagic Tank03 Intel Core i9-12900H 1.8GHz
GeForce RTX 3080 Laptop GPU
min:
1 fps, P0.1:
67 fps, P1:
75 fps, max:
145 fps
103 110 ~ 94 fps
100%
NVIDIA GeForce RTX 3070:
79 [X] AMD Ryzen 9 5900X 3.7GHz
NVIDIA GeForce RTX 3070
min:
42.91 fps, P1:
56.59 fps, max:
121.27 fps
84.9 86 [X] AMD Ryzen 9 5900X 3.7GHz
NVIDIA GeForce RTX 3070
min:
37.65 fps, P1:
66.32 fps, max:
130.48 fps
89 ~ 85 fps
84%
NVIDIA GeForce RTX 3050:
71 [X] AMD Ryzen 9 5900X 3.7GHz
NVIDIA GeForce RTX 3050
fps
87%
GeForce RTX 3080 Laptop GPU:
65 67.2 73 75 [X] Acemagic Tank03 Intel Core i9-12900H 1.8GHz
GeForce RTX 3080 Laptop GPU
min:
2 fps, P0.1:
50 fps, P1:
60 fps, max:
138 fps
91.1 ~ 74 fps
100%
NVIDIA GeForce RTX 3070:
65.3 65.7 [X] AMD Ryzen 9 5900X 3.7GHz
NVIDIA GeForce RTX 3070
min:
25.01 fps, P1:
51.86 fps, max:
96.9 fps
66.3 [X] AMD Ryzen 9 5900X 3.7GHz
NVIDIA GeForce RTX 3070
min:
41 fps, P1:
50.81 fps, max:
116.42 fps
67 ~ 66 fps
50%
NVIDIA GeForce RTX 3050:
33 [X] AMD Ryzen 9 5900X 3.7GHz
NVIDIA GeForce RTX 3050
fps
83%
GeForce RTX 3080 Laptop GPU:
52 56 56 [X] Acemagic Tank03 Intel Core i9-12900H 1.8GHz
GeForce RTX 3080 Laptop GPU
min:
6 fps, P0.1:
31 fps, P1:
46 fps, max:
133 fps
~ 55 fps
100%
NVIDIA GeForce RTX 3070:
37 [X] AMD Ryzen 9 5900X 3.7GHz
NVIDIA GeForce RTX 3070
min:
17.44 fps, P1:
25.32 fps, max:
81.3 fps
37 38.9 39.2 [X] AMD Ryzen 9 5900X 3.7GHz
NVIDIA GeForce RTX 3070
min:
17.54 fps, P1:
27.54 fps, max:
81.17 fps
~ 38 fps
50%
NVIDIA GeForce RTX 3050:
19 [X] AMD Ryzen 9 5900X 3.7GHz
NVIDIA GeForce RTX 3050
fps
84%
GeForce RTX 3080 Laptop GPU:
31 32 33 [X] Acemagic Tank03 Intel Core i9-12900H 1.8GHz
GeForce RTX 3080 Laptop GPU
min:
14 fps, P0.1:
19 fps, P1:
25 fps, max:
125 fps
~ 32 fps
100%
NVIDIA GeForce RTX 3070:
150 [X] AMD Ryzen 9 5900X 3.7GHz
NVIDIA GeForce RTX 3070
min:
33.6 fps, P0.1:
58.5 fps, P1:
75 fps, max:
273 fps
203 [X] AMD Ryzen 9 5900X 3.7GHz
NVIDIA GeForce RTX 3070
min:
10.3 fps, P0.1:
68.1 fps, P1:
118 fps, max:
342 fps
~ 177 fps
100%
NVIDIA GeForce RTX 3070:
152 [X] AMD Ryzen 9 5900X 3.7GHz
NVIDIA GeForce RTX 3070
min:
38.1 fps, P0.1:
57 fps, P1:
74.4 fps, max:
278 fps
195 [X] AMD Ryzen 9 5900X 3.7GHz
NVIDIA GeForce RTX 3070
min:
10 fps, P0.1:
77.3 fps, P1:
114 fps, max:
335 fps
~ 174 fps
100%
NVIDIA GeForce RTX 3070:
156 [X] AMD Ryzen 9 5900X 3.7GHz
NVIDIA GeForce RTX 3070
min:
54.6 fps, P0.1:
61.5 fps, P1:
85.9 fps, max:
277 fps
200 [X] AMD Ryzen 9 5900X 3.7GHz
NVIDIA GeForce RTX 3070
min:
49.4 fps, P0.1:
78.7 fps, P1:
118 fps, max:
356 fps
~ 178 fps
126%
GeForce RTX 3080 Laptop GPU:
198 227 [X] MSI GS76 Stealth 11UH Intel Core i9-11900H 2.5GHz
GeForce RTX 3080 Laptop GPU
min:
9.73 fps, P0.1:
119 fps, P1:
161 fps, max:
366 fps
249 [X] Gigabyte Aero 17 HDR YC Intel Core i9-10980HK 2.4GHz
GeForce RTX 3080 Laptop GPU
min:
22.4 fps, P0.1:
131 fps, P1:
177 fps, max:
359 fps
~ 225 fps
100%
NVIDIA GeForce RTX 3070:
152 [X] AMD Ryzen 9 5900X 3.7GHz
NVIDIA GeForce RTX 3070
min:
48.4 fps, P0.1:
61.3 fps, P1:
84.1 fps, max:
267 fps
191 [X] AMD Ryzen 9 5900X 3.7GHz
NVIDIA GeForce RTX 3070
min:
28 fps, P0.1:
75.8 fps, P1:
111 fps, max:
303 fps
~ 172 fps
128%
GeForce RTX 3080 Laptop GPU:
190 223 [X] MSI GS76 Stealth 11UH Intel Core i9-11900H 2.5GHz
GeForce RTX 3080 Laptop GPU
min:
37.4 fps, P0.1:
116 fps, P1:
155 fps, max:
387 fps
248 [X] Gigabyte Aero 17 HDR YC Intel Core i9-10980HK 2.4GHz
GeForce RTX 3080 Laptop GPU
min:
61.5 fps, P0.1:
118 fps, P1:
173 fps, max:
363 fps
~ 220 fps
100%
NVIDIA GeForce RTX 3070:
156 [X] AMD Ryzen 9 5900X 3.7GHz
NVIDIA GeForce RTX 3070
min:
29.7 fps, P0.1:
63 fps, P1:
82.3 fps, max:
263 fps
193 [X] AMD Ryzen 9 5900X 3.7GHz
NVIDIA GeForce RTX 3070
min:
24.3 fps, P0.1:
78.6 fps, P1:
120 fps, max:
317 fps
~ 175 fps
109%
GeForce RTX 3080 Laptop GPU:
156 177 [X] MSI GS76 Stealth 11UH Intel Core i9-11900H 2.5GHz
GeForce RTX 3080 Laptop GPU
min:
47.5 fps, P0.1:
81.1 fps, P1:
105 fps, max:
362 fps
241 [X] Gigabyte Aero 17 HDR YC Intel Core i9-10980HK 2.4GHz
GeForce RTX 3080 Laptop GPU
min:
38.5 fps, P0.1:
109 fps, P1:
173 fps, max:
332 fps
~ 191 fps
100%
NVIDIA GeForce RTX 3070:
160 [X] AMD Ryzen 9 5900X 3.7GHz
NVIDIA GeForce RTX 3070
min:
61.4 fps, P0.1:
69.9 fps, P1:
95.6 fps, max:
262 fps
194 [X] AMD Ryzen 9 5900X 3.7GHz
NVIDIA GeForce RTX 3070
min:
33.4 fps, P0.1:
78.4 fps, P1:
121 fps, max:
327 fps
~ 177 fps
75%
GeForce RTX 3080 Laptop GPU:
97.5 [X] MSI GS76 Stealth 11UH Intel Core i9-11900H 2.5GHz
GeForce RTX 3080 Laptop GPU
min:
28.8 fps, P0.1:
48.9 fps, P1:
50.9 fps, max:
318 fps
104 193 [X] Gigabyte Aero 17 HDR YC Intel Core i9-10980HK 2.4GHz
GeForce RTX 3080 Laptop GPU
min:
24.8 fps, P0.1:
87.3 fps, P1:
121 fps, max:
281 fps
~ 132 fps
100%
NVIDIA GeForce RTX 3070:
382 [X] AMD Ryzen 9 5900X 3.7GHz
NVIDIA GeForce RTX 3070
min:
93.4 fps, P0.1:
152 fps, P1:
208 fps, max:
712 fps
437 [X] AMD Ryzen 9 5900X 3.7GHz
NVIDIA GeForce RTX 3070
min:
30.2 fps, P0.1:
191 fps, P1:
249 fps, max:
717 fps
~ 410 fps
100%
NVIDIA GeForce RTX 3070:
316 [X] AMD Ryzen 9 5900X 3.7GHz
NVIDIA GeForce RTX 3070
min:
63.9 fps, P0.1:
144 fps, P1:
198 fps, max:
517 fps
344 [X] AMD Ryzen 9 5900X 3.7GHz
NVIDIA GeForce RTX 3070
min:
48.3 fps, P0.1:
189 fps, P1:
228 fps, max:
601 fps
~ 330 fps
100%
NVIDIA GeForce RTX 3070:
292 [X] AMD Ryzen 9 5900X 3.7GHz
NVIDIA GeForce RTX 3070
min:
53.7 fps, P0.1:
134 fps, P1:
226 fps, max:
457 fps
333 [X] AMD Ryzen 9 5900X 3.7GHz
NVIDIA GeForce RTX 3070
min:
58.1 fps, P0.1:
218 fps, P1:
250 fps, max:
523 fps
~ 313 fps
72%
GeForce RTX 3080 Laptop GPU:
198 228 [X] MSI GS76 Stealth 11UH Intel Core i9-11900H 2.5GHz
GeForce RTX 3080 Laptop GPU
min:
50.9 fps, P0.1:
138 fps, P1:
162 fps, max:
372 fps
246 [X] Gigabyte Aero 17 HDR YC Intel Core i9-10980HK 2.4GHz
GeForce RTX 3080 Laptop GPU
min:
78.4 fps, P0.1:
122 fps, P1:
170 fps, max:
409 fps
~ 224 fps
100%
NVIDIA GeForce RTX 3070:
268 [X] AMD Ryzen 9 5900X 3.7GHz
NVIDIA GeForce RTX 3070
min:
78.4 fps, P0.1:
124 fps, P1:
209 fps, max:
411 fps
312 [X] AMD Ryzen 9 5900X 3.7GHz
NVIDIA GeForce RTX 3070
min:
77 fps, P0.1:
197 fps, P1:
237 fps, max:
472 fps
~ 290 fps
74%
GeForce RTX 3080 Laptop GPU:
189 220 [X] MSI GS76 Stealth 11UH Intel Core i9-11900H 2.5GHz
GeForce RTX 3080 Laptop GPU
min:
129 fps, P0.1:
157 fps, P1:
173 fps, max:
359 fps
237 [X] Gigabyte Aero 17 HDR YC Intel Core i9-10980HK 2.4GHz
GeForce RTX 3080 Laptop GPU
min:
83.1 fps, P0.1:
122 fps, P1:
172 fps, max:
394 fps
~ 215 fps
100%
NVIDIA GeForce RTX 3070:
207 [X] AMD Ryzen 9 5900X 3.7GHz
NVIDIA GeForce RTX 3070
min:
77.6 fps, P0.1:
110 fps, P1:
163 fps, max:
308 fps
228 [X] AMD Ryzen 9 5900X 3.7GHz
NVIDIA GeForce RTX 3070
min:
84.3 fps, P0.1:
148 fps, P1:
172 fps, max:
337 fps
~ 218 fps
72%
GeForce RTX 3080 Laptop GPU:
134 162 [X] MSI GS76 Stealth 11UH Intel Core i9-11900H 2.5GHz
GeForce RTX 3080 Laptop GPU
min:
68.2 fps, P0.1:
117 fps, P1:
126 fps, max:
263 fps
176 [X] Gigabyte Aero 17 HDR YC Intel Core i9-10980HK 2.4GHz
GeForce RTX 3080 Laptop GPU
min:
89.4 fps, P0.1:
121 fps, P1:
143 fps, max:
263 fps
~ 157 fps
100%
NVIDIA GeForce RTX 3070:
128 [X] AMD Ryzen 9 5900X 3.7GHz
NVIDIA GeForce RTX 3070
min:
61.7 fps, P0.1:
83 fps, P1:
103 fps, max:
201 fps
136 [X] AMD Ryzen 9 5900X 3.7GHz
NVIDIA GeForce RTX 3070
min:
35.7 fps, P0.1:
82.7 fps, P1:
99.1 fps, max:
267 fps
~ 132 fps
71%
GeForce RTX 3080 Laptop GPU:
79.4 97.1 [X] MSI GS76 Stealth 11UH Intel Core i9-11900H 2.5GHz
GeForce RTX 3080 Laptop GPU
min:
61.1 fps, P0.1:
66.3 fps, P1:
73.4 fps, max:
148 fps
105 [X] Gigabyte Aero 17 HDR YC Intel Core i9-10980HK 2.4GHz
GeForce RTX 3080 Laptop GPU
min:
68.1 fps, P0.1:
76.2 fps, P1:
81.6 fps, max:
280 fps
~ 94 fps
100%
NVIDIA GeForce RTX 3070:
152 [X] AMD Ryzen 9 5900X 3.7GHz
NVIDIA GeForce RTX 3070
min:
35.1 fps, P0.1:
65.1 fps, P1:
94.9 fps, max:
264 fps
184 [X] AMD Ryzen 9 5900X 3.7GHz
NVIDIA GeForce RTX 3070
min:
33.3 fps, P0.1:
73.9 fps, P1:
113 fps, max:
342 fps
~ 168 fps
93%
NVIDIA GeForce RTX 3050:
157 [X] AMD Ryzen 9 5900X 3.7GHz
NVIDIA GeForce RTX 3050
min:
62 fps, P0.1:
72.1 fps, P1:
104 fps, max:
295 fps
fps
100%
NVIDIA GeForce RTX 3070:
128 [X] AMD Ryzen 9 5900X 3.7GHz
NVIDIA GeForce RTX 3070
min:
56.4 fps, P0.1:
67.3 fps, P1:
87.9 fps, max:
269 fps
140 [X] AMD Ryzen 9 5900X 3.7GHz
NVIDIA GeForce RTX 3070
min:
54.9 fps, P0.1:
70 fps, P1:
93.4 fps, max:
241 fps
~ 134 fps
60%
NVIDIA GeForce RTX 3050:
81 [X] AMD Ryzen 9 5900X 3.7GHz
NVIDIA GeForce RTX 3050
min:
53.9 fps, P0.1:
57.9 fps, P1:
65.4 fps, max:
149 fps
fps
100%
NVIDIA GeForce RTX 3070:
124 [X] AMD Ryzen 9 5900X 3.7GHz
NVIDIA GeForce RTX 3070
min:
57.4 fps, P0.1:
62.8 fps, P1:
82 fps, max:
251 fps
132 [X] AMD Ryzen 9 5900X 3.7GHz
NVIDIA GeForce RTX 3070
min:
57.5 fps, P0.1:
71.1 fps, P1:
88.3 fps, max:
259 fps
~ 128 fps
59%
NVIDIA GeForce RTX 3050:
75.6 [X] AMD Ryzen 9 5900X 3.7GHz
NVIDIA GeForce RTX 3050
min:
48.2 fps, P0.1:
50.2 fps, P1:
59.9 fps, max:
124 fps
fps
80%
GeForce RTX 3080 Laptop GPU:
98.7 102 [X] MSI GS76 Stealth 11UH Intel Core i9-11900H 2.5GHz
GeForce RTX 3080 Laptop GPU
min:
60.2 fps, P0.1:
60.9 fps, P1:
73.5 fps, max:
173 fps
104 [X] Medion Erazer Beast X25 AMD Ryzen 9 5900HX 3.3GHz
GeForce RTX 3080 Laptop GPU
min:
52.3 fps, P0.1:
58.5 fps, P1:
72.6 fps, max:
166 fps
~ 102 fps
100%
NVIDIA GeForce RTX 3070:
98.1 [X] AMD Ryzen 9 5900X 3.7GHz
NVIDIA GeForce RTX 3070
min:
34.5 fps, P0.1:
57.7 fps, P1:
68.6 fps, max:
174 fps
98.7 [X] AMD Ryzen 9 5900X 3.7GHz
NVIDIA GeForce RTX 3070
min:
45.2 fps, P0.1:
55.9 fps, P1:
69.4 fps, max:
191 fps
~ 98 fps
51%
NVIDIA GeForce RTX 3050:
50.4 [X] AMD Ryzen 9 5900X 3.7GHz
NVIDIA GeForce RTX 3050
min:
35.4 fps, P0.1:
38.3 fps, P1:
42.6 fps, max:
80.2 fps
fps
71%
GeForce RTX 3080 Laptop GPU:
69.3 [X] MSI GS76 Stealth 11UH Intel Core i9-11900H 2.5GHz
GeForce RTX 3080 Laptop GPU
min:
26.5 fps, P0.1:
37.4 fps, P1:
50 fps, max:
143 fps
70.7 ~ 70 fps
100%
NVIDIA GeForce RTX 3070:
55.2 [X] AMD Ryzen 9 5900X 3.7GHz
NVIDIA GeForce RTX 3070
min:
19.3 fps, P0.1:
34.2 fps, P1:
45.2 fps, max:
133 fps
56.6 [X] AMD Ryzen 9 5900X 3.7GHz
NVIDIA GeForce RTX 3070
min:
34.7 fps, P0.1:
37.9 fps, P1:
44.2 fps, max:
177 fps
~ 56 fps
46%
NVIDIA GeForce RTX 3050:
25.8 [X] AMD Ryzen 9 5900X 3.7GHz
NVIDIA GeForce RTX 3050
min:
21.8 fps, P0.1:
21.8 fps, P1:
23.2 fps, max:
31 fps
fps
66%
GeForce RTX 3080 Laptop GPU:
37.2 37.4 [X] MSI GS76 Stealth 11UH Intel Core i9-11900H 2.5GHz
GeForce RTX 3080 Laptop GPU
min:
24.3 fps, P0.1:
25.8 fps, P1:
30.8 fps, max:
108 fps
~ 37 fps
100%
NVIDIA GeForce RTX 3070:
148.8 [X] AMD Ryzen 9 5900X 3.7GHz
NVIDIA GeForce RTX 3070
161.2 [X] AMD Ryzen 9 5900X 3.7GHz
NVIDIA GeForce RTX 3070
~ 155 fps
91%
GeForce RTX 3080 Laptop GPU:
112 137 [X] Acer Nitro 5 AN517-41-R9S5 AMD Ryzen 7 5800H 3.2GHz
GeForce RTX 3080 Laptop GPU
min:
17.4 fps, P0.1:
41.2 fps, P1:
88.7 fps, max:
242 fps
152 [X] Aorus 17G YD Intel Core i7-11800H 2.3GHz
GeForce RTX 3080 Laptop GPU
min:
8.19 fps, P0.1:
24.2 fps, P1:
75 fps, max:
292 fps
162 ~ 141 fps
100%
NVIDIA GeForce RTX 3070:
122 [X] AMD Ryzen 9 5900X 3.7GHz
NVIDIA GeForce RTX 3070
130.6 [X] AMD Ryzen 9 5900X 3.7GHz
NVIDIA GeForce RTX 3070
~ 126 fps
82%
GeForce RTX 3080 Laptop GPU:
91.1 96.2 [X] Acer Nitro 5 AN517-41-R9S5 AMD Ryzen 7 5800H 3.2GHz
GeForce RTX 3080 Laptop GPU
min:
7.95 fps, P0.1:
18.8 fps, P1:
62.1 fps, max:
169 fps
107 [X] Aorus 17G YD Intel Core i7-11800H 2.3GHz
GeForce RTX 3080 Laptop GPU
min:
8.47 fps, P0.1:
20.7 fps, P1:
69.9 fps, max:
205 fps
118 ~ 103 fps
100%
NVIDIA GeForce RTX 3070:
120.9 [X] AMD Ryzen 9 5900X 3.7GHz
NVIDIA GeForce RTX 3070
121.3 [X] AMD Ryzen 9 5900X 3.7GHz
NVIDIA GeForce RTX 3070
~ 121 fps
77%
GeForce RTX 3080 Laptop GPU:
74.8 90 [X] Acer Nitro 5 AN517-41-R9S5 AMD Ryzen 7 5800H 3.2GHz
GeForce RTX 3080 Laptop GPU
min:
10.7 fps, P0.1:
33.9 fps, P1:
51.6 fps, max:
158 fps
93.3 93.6 [X] Aorus 17G YD Intel Core i7-11800H 2.3GHz
GeForce RTX 3080 Laptop GPU
min:
16.6 fps, P0.1:
34.3 fps, P1:
51 fps, max:
187 fps
111 ~ 93 fps
100%
NVIDIA GeForce RTX 3070:
99 [X] AMD Ryzen 9 5900X 3.7GHz
NVIDIA GeForce RTX 3070
104.2 [X] AMD Ryzen 9 5900X 3.7GHz
NVIDIA GeForce RTX 3070
~ 102 fps
84%
GeForce RTX 3080 Laptop GPU:
72.6 80.2 83.8 [X] Acer Nitro 5 AN517-41-R9S5 AMD Ryzen 7 5800H 3.2GHz
GeForce RTX 3080 Laptop GPU
min:
7.27 fps, P0.1:
30.4 fps, P1:
47.1 fps, max:
133 fps
85 [X] Aorus 17G YD Intel Core i7-11800H 2.3GHz
GeForce RTX 3080 Laptop GPU
min:
6.49 fps, P0.1:
30.4 fps, P1:
54.9 fps, max:
166 fps
107 ~ 86 fps
100%
NVIDIA GeForce RTX 3070:
91.3 [X] AMD Ryzen 9 5900X 3.7GHz
NVIDIA GeForce RTX 3070
92 [X] AMD Ryzen 9 5900X 3.7GHz
NVIDIA GeForce RTX 3070
~ 92 fps
73%
GeForce RTX 3080 Laptop GPU:
67.2 fps
100%
NVIDIA GeForce RTX 3070:
66.6 [X] AMD Ryzen 9 5900X 3.7GHz
NVIDIA GeForce RTX 3070
67.6 [X] AMD Ryzen 9 5900X 3.7GHz
NVIDIA GeForce RTX 3070
~ 67 fps
100%
NVIDIA GeForce RTX 3070:
221 [X] AMD Ryzen 9 5900X 3.7GHz
NVIDIA GeForce RTX 3070
min:
53.1 fps, P0.1:
83.2 fps, P1:
138 fps, max:
430 fps
fps
121%
NVIDIA GeForce RTX 3050:
268 [X] AMD Ryzen 9 5900X 3.7GHz
NVIDIA GeForce RTX 3050
min:
49.3 fps, P0.1:
90 fps, P1:
129 fps, max:
547 fps
fps
100%
NVIDIA GeForce RTX 3070:
182 [X] AMD Ryzen 9 5900X 3.7GHz
NVIDIA GeForce RTX 3070
min:
49 fps, P0.1:
59 fps, P1:
113 fps, max:
416 fps
fps
80%
NVIDIA GeForce RTX 3050:
146 [X] AMD Ryzen 9 5900X 3.7GHz
NVIDIA GeForce RTX 3050
min:
44.3 fps, P0.1:
58.6 fps, P1:
66.6 fps, max:
519 fps
fps
100%
NVIDIA GeForce RTX 3070:
97.7 [X] AMD Ryzen 9 5900X 3.7GHz
NVIDIA GeForce RTX 3070
min:
36.3 fps, P0.1:
39.8 fps, P1:
53.2 fps, max:
192 fps
fps
65%
NVIDIA GeForce RTX 3050:
63.2 [X] AMD Ryzen 9 5900X 3.7GHz
NVIDIA GeForce RTX 3050
min:
45.3 fps, P0.1:
46.7 fps, P1:
51.3 fps, max:
258 fps
fps
84%
GeForce RTX 3080 Laptop GPU:
78.8 [X] MSI GS76 Stealth 11UH Intel Core i9-11900H 2.5GHz
GeForce RTX 3080 Laptop GPU
min:
22.4 fps, P0.1:
24.9 fps, P1:
27.5 fps, max:
190 fps
79.2 88.9 [X] Gigabyte Aero 17 HDR YC Intel Core i9-10980HK 2.4GHz
GeForce RTX 3080 Laptop GPU
min:
40 fps, P0.1:
46.7 fps, P1:
56.2 fps, max:
152 fps
~ 82 fps
100%
NVIDIA GeForce RTX 3070:
75.8 [X] AMD Ryzen 9 5900X 3.7GHz
NVIDIA GeForce RTX 3070
min:
46.1 fps, P0.1:
48.5 fps, P1:
54.2 fps, max:
148 fps
fps
78%
NVIDIA GeForce RTX 3050:
58.9 [X] AMD Ryzen 9 5900X 3.7GHz
NVIDIA GeForce RTX 3050
min:
45.1 fps, P0.1:
46.3 fps, P1:
47.5 fps, max:
89.2 fps
fps
77%
GeForce RTX 3080 Laptop GPU:
54.3 [X] MSI GS76 Stealth 11UH Intel Core i9-11900H 2.5GHz
GeForce RTX 3080 Laptop GPU
min:
33.7 fps, P0.1:
35 fps, P1:
43.7 fps, max:
89.5 fps
56.9 61.5 [X] Gigabyte Aero 17 HDR YC Intel Core i9-10980HK 2.4GHz
GeForce RTX 3080 Laptop GPU
min:
14 fps, P0.1:
34.1 fps, P1:
40.4 fps, max:
98.4 fps
~ 58 fps
100%
NVIDIA GeForce RTX 3070:
64.3 [X] AMD Ryzen 9 5900X 3.7GHz
NVIDIA GeForce RTX 3070
min:
42.4 fps, P0.1:
47.6 fps, P1:
52.8 fps, max:
102 fps
fps
66%
NVIDIA GeForce RTX 3050:
42.2 [X] AMD Ryzen 9 5900X 3.7GHz
NVIDIA GeForce RTX 3050
min:
33.5 fps, P0.1:
34.1 fps, P1:
35.1 fps, max:
54.2 fps
fps
72%
GeForce RTX 3080 Laptop GPU:
44 [X] MSI GS76 Stealth 11UH Intel Core i9-11900H 2.5GHz
GeForce RTX 3080 Laptop GPU
min:
30.9 fps, P0.1:
31 fps, P1:
34.8 fps, max:
64.1 fps
45.2 49.3 [X] Gigabyte Aero 17 HDR YC Intel Core i9-10980HK 2.4GHz
GeForce RTX 3080 Laptop GPU
min:
12.8 fps, P0.1:
27.3 fps, P1:
34 fps, max:
74.3 fps
~ 46 fps
100%
NVIDIA GeForce RTX 3070:
38.9 [X] AMD Ryzen 9 5900X 3.7GHz
NVIDIA GeForce RTX 3070
min:
21.9 fps, P0.1:
28 fps, P1:
31.1 fps, max:
58.6 fps
fps
61%
NVIDIA GeForce RTX 3050:
23.7 [X] AMD Ryzen 9 5900X 3.7GHz
NVIDIA GeForce RTX 3050
min:
19.9 fps, P0.1:
19.9 fps, P1:
20.3 fps, max:
29.7 fps
fps
75%
GeForce RTX 3080 Laptop GPU:
28 [X] MSI GS76 Stealth 11UH Intel Core i9-11900H 2.5GHz
GeForce RTX 3080 Laptop GPU
min:
21.5 fps, P0.1:
22.8 fps, P1:
24.6 fps, max:
34.1 fps
29.3 [X] Gigabyte Aero 17 HDR YC Intel Core i9-10980HK 2.4GHz
GeForce RTX 3080 Laptop GPU
min:
22.7 fps, P0.1:
23 fps, P1:
25.1 fps, max:
36.1 fps
29.4 ~ 29 fps
100%
NVIDIA GeForce RTX 3070:
115 [X] AMD Ryzen 9 5900X 3.7GHz
NVIDIA GeForce RTX 3070
min:
7.09 fps, P0.1:
43.4 fps, P1:
81.7 fps, max:
141 fps
fps
100%
NVIDIA GeForce RTX 3070:
97.4 [X] AMD Ryzen 9 5900X 3.7GHz
NVIDIA GeForce RTX 3070
min:
8.65 fps, P0.1:
39.1 fps, P1:
67.1 fps, max:
121 fps
fps
100%
NVIDIA GeForce RTX 3070:
79.9 [X] AMD Ryzen 9 5900X 3.7GHz
NVIDIA GeForce RTX 3070
min:
9.96 fps, P0.1:
35.5 fps, P1:
59 fps, max:
98.4 fps
fps
100%
NVIDIA GeForce RTX 3070:
62.8 [X] AMD Ryzen 9 5900X 3.7GHz
NVIDIA GeForce RTX 3070
min:
6.79 fps, P0.1:
32.1 fps, P1:
50 fps, max:
76.3 fps
fps
100%
NVIDIA GeForce RTX 3070:
55.6 [X] AMD Ryzen 9 5900X 3.7GHz
NVIDIA GeForce RTX 3070
min:
6.88 fps, P0.1:
30.7 fps, P1:
44.2 fps, max:
68.6 fps
fps
100%
NVIDIA GeForce RTX 3070:
37.3 [X] AMD Ryzen 9 5900X 3.7GHz
NVIDIA GeForce RTX 3070
min:
10.6 fps, P0.1:
19.7 fps, P1:
31 fps, max:
59.8 fps
fps
100%
NVIDIA GeForce RTX 3070:
172 [X] AMD Ryzen 9 5900X 3.7GHz
NVIDIA GeForce RTX 3070
189 [X] AMD Ryzen 9 5900X 3.7GHz
NVIDIA GeForce RTX 3070
min:
29 fps, max:
341 fps
~ 181 fps
90%
NVIDIA GeForce RTX 3050:
162 [X] AMD Ryzen 9 5900X 3.7GHz
NVIDIA GeForce RTX 3050
fps
77%
GeForce RTX 3080 Laptop GPU:
127 [X] Acer Nitro 5 AN517-41-R9S5 AMD Ryzen 7 5800H 3.2GHz
GeForce RTX 3080 Laptop GPU
min:
45 fps, max:
236 fps
133 [X] Aorus 17G YD Intel Core i7-11800H 2.3GHz
GeForce RTX 3080 Laptop GPU
min:
8 fps, max:
273 fps
157 [X] Acemagic Tank03 Intel Core i9-12900H 1.8GHz
GeForce RTX 3080 Laptop GPU
min:
36 fps, max:
290 fps
~ 139 fps
100%
NVIDIA GeForce RTX 3070:
152 [X] AMD Ryzen 9 5900X 3.7GHz
NVIDIA GeForce RTX 3070
153 [X] AMD Ryzen 9 5900X 3.7GHz
NVIDIA GeForce RTX 3070
min:
32 fps, max:
256 fps
~ 153 fps
63%
NVIDIA GeForce RTX 3050:
96 [X] AMD Ryzen 9 5900X 3.7GHz
NVIDIA GeForce RTX 3050
fps
76%
GeForce RTX 3080 Laptop GPU:
96 [X] Acer Nitro 5 AN517-41-R9S5 AMD Ryzen 7 5800H 3.2GHz
GeForce RTX 3080 Laptop GPU
min:
39 fps, max:
211 fps
119 [X] Aorus 17G YD Intel Core i7-11800H 2.3GHz
GeForce RTX 3080 Laptop GPU
min:
67 fps, max:
242 fps
137 [X] Acemagic Tank03 Intel Core i9-12900H 1.8GHz
GeForce RTX 3080 Laptop GPU
min:
41 fps, max:
223 fps
~ 117 fps
100%
NVIDIA GeForce RTX 3070:
132 [X] AMD Ryzen 9 5900X 3.7GHz
NVIDIA GeForce RTX 3070
138 [X] AMD Ryzen 9 5900X 3.7GHz
NVIDIA GeForce RTX 3070
min:
18 fps, max:
268 fps
~ 135 fps
59%
NVIDIA GeForce RTX 3050:
79 [X] AMD Ryzen 9 5900X 3.7GHz
NVIDIA GeForce RTX 3050
fps
77%
GeForce RTX 3080 Laptop GPU:
89 [X] Acer Nitro 5 AN517-41-R9S5 AMD Ryzen 7 5800H 3.2GHz
GeForce RTX 3080 Laptop GPU
min:
29 fps, max:
163 fps
93 109 [X] Aorus 17G YD Intel Core i7-11800H 2.3GHz
GeForce RTX 3080 Laptop GPU
min:
61 fps, max:
185 fps
124 [X] Acemagic Tank03 Intel Core i9-12900H 1.8GHz
GeForce RTX 3080 Laptop GPU
min:
41 fps, max:
218 fps
~ 104 fps
100%
NVIDIA GeForce RTX 3070:
124 [X] AMD Ryzen 9 5900X 3.7GHz
NVIDIA GeForce RTX 3070
min:
68 fps, max:
221 fps
125 [X] AMD Ryzen 9 5900X 3.7GHz
NVIDIA GeForce RTX 3070
~ 125 fps
53%
NVIDIA GeForce RTX 3050:
66 [X] AMD Ryzen 9 5900X 3.7GHz
NVIDIA GeForce RTX 3050
fps
76%
GeForce RTX 3080 Laptop GPU:
84 85 [X] Acer Nitro 5 AN517-41-R9S5 AMD Ryzen 7 5800H 3.2GHz
GeForce RTX 3080 Laptop GPU
min:
30 fps, max:
150 fps
100 [X] Aorus 17G YD Intel Core i7-11800H 2.3GHz
GeForce RTX 3080 Laptop GPU
min:
58 fps, max:
168 fps
109 [X] Acemagic Tank03 Intel Core i9-12900H 1.8GHz
GeForce RTX 3080 Laptop GPU
min:
42 fps, max:
176 fps
~ 95 fps
100%
NVIDIA GeForce RTX 3070:
104 [X] AMD Ryzen 9 5900X 3.7GHz
NVIDIA GeForce RTX 3070
min:
32 fps, max:
196 fps
109 [X] AMD Ryzen 9 5900X 3.7GHz
NVIDIA GeForce RTX 3070
~ 107 fps
49%
NVIDIA GeForce RTX 3050:
52 [X] AMD Ryzen 9 5900X 3.7GHz
NVIDIA GeForce RTX 3050
fps
72%
GeForce RTX 3080 Laptop GPU:
67 87 [X] Acemagic Tank03 Intel Core i9-12900H 1.8GHz
GeForce RTX 3080 Laptop GPU
min:
33 fps, max:
159 fps
~ 77 fps
100%
NVIDIA GeForce RTX 3070:
61 [X] AMD Ryzen 9 5900X 3.7GHz
NVIDIA GeForce RTX 3070
min:
41 fps, max:
103 fps
77 [X] AMD Ryzen 9 5900X 3.7GHz
NVIDIA GeForce RTX 3070
~ 69 fps
41%
NVIDIA GeForce RTX 3050:
28 [X] AMD Ryzen 9 5900X 3.7GHz
NVIDIA GeForce RTX 3050
fps
65%
GeForce RTX 3080 Laptop GPU:
41 48 [X] Acemagic Tank03 Intel Core i9-12900H 1.8GHz
GeForce RTX 3080 Laptop GPU
min:
25 fps, max:
93 fps
~ 45 fps
GeForce RTX 3080 Laptop GPU:
66 [X] Acemagic Tank03 Intel Core i9-12900H 1.8GHz
GeForce RTX 3080 Laptop GPU
min:
33 fps, max:
132 fps
fps
100%
NVIDIA GeForce RTX 3070:
224 [X] AMD Ryzen 9 5900X 3.7GHz
NVIDIA GeForce RTX 3070
min:
56.8 fps, P0.1:
155 fps, P1:
177 fps, max:
305 fps
fps
75%
NVIDIA GeForce RTX 3050:
167.8 [X] PNY GeForce RTX 3050 XLR8 AMD Ryzen 9 7950X 4.5GHz
NVIDIA GeForce RTX 3050
min:
103.7 fps, P0.1:
131.5 fps, P1:
145.9 fps, max:
267 fps
fps
75%
GeForce RTX 3080 Laptop GPU:
167.9 [X] Acemagic Tank03 Intel Core i9-12900H 1.8GHz
GeForce RTX 3080 Laptop GPU
min:
110.6 fps, P0.1:
120.4 fps, P1:
137.2 fps, max:
210 fps
fps
100%
NVIDIA GeForce RTX 3070:
190 [X] AMD Ryzen 9 5900X 3.7GHz
NVIDIA GeForce RTX 3070
min:
49.8 fps, P0.1:
135 fps, P1:
147 fps, max:
280 fps
fps
57%
NVIDIA GeForce RTX 3050:
108.5 [X] PNY GeForce RTX 3050 XLR8 AMD Ryzen 9 7950X 4.5GHz
NVIDIA GeForce RTX 3050
min:
75.6 fps, P0.1:
93.5 fps, P1:
99.2 fps, max:
163.8 fps
fps
77%
GeForce RTX 3080 Laptop GPU:
146.5 [X] Acemagic Tank03 Intel Core i9-12900H 1.8GHz
GeForce RTX 3080 Laptop GPU
min:
55.7 fps, P0.1:
112.3 fps, P1:
120.7 fps, max:
190.9 fps
fps
100%
NVIDIA GeForce RTX 3070:
173 [X] AMD Ryzen 9 5900X 3.7GHz
NVIDIA GeForce RTX 3070
min:
115 fps, P0.1:
128 fps, P1:
140 fps, max:
248 fps
fps
59%
NVIDIA GeForce RTX 3050:
101.6 [X] PNY GeForce RTX 3050 XLR8 AMD Ryzen 9 7950X 4.5GHz
NVIDIA GeForce RTX 3050
min:
83 fps, P0.1:
90 fps, P1:
93.1 fps, max:
112.2 fps
fps
67%
GeForce RTX 3080 Laptop GPU:
83.6 104 [X] MSI GS76 Stealth 11UH Intel Core i9-11900H 2.5GHz
GeForce RTX 3080 Laptop GPU
min:
46.1 fps, P0.1:
64.9 fps, P1:
83.9 fps, max:
169 fps
135 [X] Medion Erazer Beast X25 AMD Ryzen 9 5900HX 3.3GHz
GeForce RTX 3080 Laptop GPU
min:
52.4 fps, P0.1:
89.3 fps, P1:
106 fps, max:
236 fps
141.5 [X] Acemagic Tank03 Intel Core i9-12900H 1.8GHz
GeForce RTX 3080 Laptop GPU
min:
50.4 fps, P0.1:
105.1 fps, P1:
117.2 fps, max:
184 fps
~ 116 fps
100%
NVIDIA GeForce RTX 3070:
170 [X] AMD Ryzen 9 5900X 3.7GHz
NVIDIA GeForce RTX 3070
min:
106 fps, P0.1:
117 fps, P1:
136 fps, max:
255 fps
fps
58%
NVIDIA GeForce RTX 3050:
98.3 [X] PNY GeForce RTX 3050 XLR8 AMD Ryzen 9 7950X 4.5GHz
NVIDIA GeForce RTX 3050
min:
78.8 fps, P0.1:
87.4 fps, P1:
90.1 fps, max:
108.2 fps
fps
67%
GeForce RTX 3080 Laptop GPU:
82.3 102 [X] MSI GS76 Stealth 11UH Intel Core i9-11900H 2.5GHz
GeForce RTX 3080 Laptop GPU
min:
54.6 fps, P0.1:
65.1 fps, P1:
85.1 fps, max:
156 fps
134 [X] Medion Erazer Beast X25 AMD Ryzen 9 5900HX 3.3GHz
GeForce RTX 3080 Laptop GPU
min:
56.2 fps, P0.1:
91.6 fps, P1:
108 fps, max:
184 fps
138 [X] Acemagic Tank03 Intel Core i9-12900H 1.8GHz
GeForce RTX 3080 Laptop GPU
min:
100.5 fps, P0.1:
107.6 fps, P1:
114.1 fps, max:
192.9 fps
~ 114 fps
100%
NVIDIA GeForce RTX 3070:
126 [X] AMD Ryzen 9 5900X 3.7GHz
NVIDIA GeForce RTX 3070
min:
95.7 fps, P0.1:
99.5 fps, P1:
107 fps, max:
178 fps
fps
54%
NVIDIA GeForce RTX 3050:
68.2 [X] PNY GeForce RTX 3050 XLR8 AMD Ryzen 9 7950X 4.5GHz
NVIDIA GeForce RTX 3050
min:
47.9 fps, P0.1:
62.1 fps, P1:
63.4 fps, max:
99.5 fps
fps
72%
GeForce RTX 3080 Laptop GPU:
73.7 92.2 [X] MSI GS76 Stealth 11UH Intel Core i9-11900H 2.5GHz
GeForce RTX 3080 Laptop GPU
min:
43.7 fps, P0.1:
69 fps, P1:
78.8 fps, max:
123 fps
107.4 [X] Acemagic Tank03 Intel Core i9-12900H 1.8GHz
GeForce RTX 3080 Laptop GPU
min:
78.2 fps, P0.1:
82.2 fps, P1:
90.9 fps, max:
162.7 fps
~ 91 fps
100%
NVIDIA GeForce RTX 3070:
74.1 [X] AMD Ryzen 9 5900X 3.7GHz
NVIDIA GeForce RTX 3070
min:
62.4 fps, P0.1:
64.2 fps, P1:
66.4 fps, max:
84.5 fps
fps
50%
NVIDIA GeForce RTX 3050:
37.2 [X] PNY GeForce RTX 3050 XLR8 AMD Ryzen 9 7950X 4.5GHz
NVIDIA GeForce RTX 3050
min:
33 fps, P0.1:
33.4 fps, P1:
34.2 fps, max:
40.8 fps
fps
76%
GeForce RTX 3080 Laptop GPU:
52.1 55.8 [X] MSI GS76 Stealth 11UH Intel Core i9-11900H 2.5GHz
GeForce RTX 3080 Laptop GPU
min:
19.1 fps, P0.1:
42.4 fps, P1:
46.2 fps, max:
86 fps
59.6 [X] Acemagic Tank03 Intel Core i9-12900H 1.8GHz
GeForce RTX 3080 Laptop GPU
min:
48.3 fps, P0.1:
50.1 fps, P1:
53.4 fps, max:
89.2 fps
~ 56 fps
100%
NVIDIA GeForce RTX 3070:
321 [X] 692646
AMD Ryzen 9 5900X 3.7GHz
NVIDIA GeForce RTX 3070
min:
250 fps, max:
352 fps
327 [X] 712959
AMD Ryzen 9 5900X 3.7GHz
NVIDIA GeForce RTX 3070
min:
253 fps, max:
364 fps
351 ~ 333 fps
121%
NVIDIA GeForce RTX 3050:
379 [X] 759689
AMD Ryzen 9 5900X 3.7GHz
NVIDIA GeForce RTX 3050
min:
328 fps, max:
430 fps
424 [X] PNY GeForce RTX 3050 XLR8 759689
AMD Ryzen 9 7950X 4.5GHz
NVIDIA GeForce RTX 3050
min:
385 fps, max:
473 fps
~ 402 fps
80%
GeForce RTX 3080 Laptop GPU:
235 [X] 728712
AMD Ryzen 9 5980HS 3GHz
GeForce RTX 3080 Laptop GPU
min:
186 fps, max:
256 fps
256 268 [X] 728712
AMD Ryzen 9 5980HS 3GHz
GeForce RTX 3080 Laptop GPU
min:
208 fps, max:
295 fps
301 [X] Acemagic Tank03 759689
Intel Core i9-12900H 1.8GHz
GeForce RTX 3080 Laptop GPU
min:
270 fps, max:
326 fps
~ 265 fps
100%
NVIDIA GeForce RTX 3070:
268 [X] 712959
AMD Ryzen 9 5900X 3.7GHz
NVIDIA GeForce RTX 3070
min:
219 fps, max:
310 fps
288 [X] 692646
AMD Ryzen 9 5900X 3.7GHz
NVIDIA GeForce RTX 3070
min:
217 fps, max:
336 fps
302 ~ 286 fps
72%
NVIDIA GeForce RTX 3050:
200 [X] 759689
AMD Ryzen 9 5900X 3.7GHz
NVIDIA GeForce RTX 3050
min:
169 fps, max:
225 fps
214 [X] PNY GeForce RTX 3050 XLR8 759689
AMD Ryzen 9 7950X 4.5GHz
NVIDIA GeForce RTX 3050
min:
183 fps, max:
246 fps
~ 207 fps
74%
GeForce RTX 3080 Laptop GPU:
182 [X] 728712
AMD Ryzen 9 5980HS 3GHz
GeForce RTX 3080 Laptop GPU
min:
153 fps, max:
203 fps
199 220 [X] 728712
AMD Ryzen 9 5980HS 3GHz
GeForce RTX 3080 Laptop GPU
min:
180 fps, max:
260 fps
251 [X] Acemagic Tank03 759689
Intel Core i9-12900H 1.8GHz
GeForce RTX 3080 Laptop GPU
min:
213 fps, max:
283 fps
~ 213 fps
100%
NVIDIA GeForce RTX 3070:
249 [X] 692646
AMD Ryzen 9 5900X 3.7GHz
NVIDIA GeForce RTX 3070
min:
198 fps, max:
283 fps
252 [X] 712959
AMD Ryzen 9 5900X 3.7GHz
NVIDIA GeForce RTX 3070
min:
188 fps, max:
279 fps
288 ~ 263 fps
60%
NVIDIA GeForce RTX 3050:
153 [X] 759689
AMD Ryzen 9 5900X 3.7GHz
NVIDIA GeForce RTX 3050
min:
129 fps, max:
174 fps
163.7 [X] PNY GeForce RTX 3050 XLR8 759689
AMD Ryzen 9 7950X 4.5GHz
NVIDIA GeForce RTX 3050
min:
138 fps, max:
188 fps
~ 158 fps
73%
GeForce RTX 3080 Laptop GPU:
162 178 [X] 728712
AMD Ryzen 9 5980HS 3GHz
GeForce RTX 3080 Laptop GPU
min:
150 fps, max:
198 fps
191 215 [X] 728712
AMD Ryzen 9 5980HS 3GHz
GeForce RTX 3080 Laptop GPU
min:
174 fps, max:
242 fps
221 [X] Acemagic Tank03 759689
Intel Core i9-12900H 1.8GHz
GeForce RTX 3080 Laptop GPU
min:
195 fps, max:
246 fps
~ 193 fps
100%
NVIDIA GeForce RTX 3070:
179 [X] 692646
AMD Ryzen 9 5900X 3.7GHz
NVIDIA GeForce RTX 3070
min:
153 fps, max:
213 fps
181 [X] 712959
AMD Ryzen 9 5900X 3.7GHz
NVIDIA GeForce RTX 3070
min:
145 fps, max:
211 fps
215 ~ 192 fps
56%
NVIDIA GeForce RTX 3050:
104 [X] 759689
AMD Ryzen 9 5900X 3.7GHz
NVIDIA GeForce RTX 3050
min:
83 fps, max:
124 fps
109.2 [X] PNY GeForce RTX 3050 XLR8 759689
AMD Ryzen 9 7950X 4.5GHz
NVIDIA GeForce RTX 3050
min:
87 fps, max:
131 fps
~ 107 fps
80%
GeForce RTX 3080 Laptop GPU:
131 148 [X] 728712
AMD Ryzen 9 5980HS 3GHz
GeForce RTX 3080 Laptop GPU
min:
128 fps, max:
168 fps
150 160.7 [X] Acemagic Tank03 759689
Intel Core i9-12900H 1.8GHz
GeForce RTX 3080 Laptop GPU
min:
131 fps, max:
190 fps
180 [X] 728712
AMD Ryzen 9 5980HS 3GHz
GeForce RTX 3080 Laptop GPU
min:
150 fps, max:
209 fps
~ 154 fps
100%
NVIDIA GeForce RTX 3070:
143 [X] 712959
AMD Ryzen 9 5900X 3.7GHz
NVIDIA GeForce RTX 3070
min:
123 fps, max:
164 fps
146 [X] 692646
AMD Ryzen 9 5900X 3.7GHz
NVIDIA GeForce RTX 3070
min:
121 fps, max:
168 fps
162.2 ~ 150 fps
52%
NVIDIA GeForce RTX 3050:
76.5 [X] 759689
AMD Ryzen 9 5900X 3.7GHz
NVIDIA GeForce RTX 3050
min:
62 fps, max:
89 fps
79.9 [X] PNY GeForce RTX 3050 XLR8 759689
AMD Ryzen 9 7950X 4.5GHz
NVIDIA GeForce RTX 3050
min:
65 fps, max:
94 fps
~ 78 fps
81%
GeForce RTX 3080 Laptop GPU:
103 119 120.9 [X] Acemagic Tank03 759689
Intel Core i9-12900H 1.8GHz
GeForce RTX 3080 Laptop GPU
min:
100 fps, max:
140 fps
140 [X] 728712
AMD Ryzen 9 5980HS 3GHz
GeForce RTX 3080 Laptop GPU
min:
117 fps, max:
163 fps
~ 121 fps
100%
NVIDIA GeForce RTX 3070:
88.7 [X] 712959
AMD Ryzen 9 5900X 3.7GHz
NVIDIA GeForce RTX 3070
min:
76 fps, max:
101 fps
89.2 [X] 692646
AMD Ryzen 9 5900X 3.7GHz
NVIDIA GeForce RTX 3070
min:
73 fps, max:
104 fps
92.7 ~ 90 fps
49%
NVIDIA GeForce RTX 3050:
43.1 [X] 759689
AMD Ryzen 9 5900X 3.7GHz
NVIDIA GeForce RTX 3050
min:
36 fps, max:
51 fps
44.3 [X] PNY GeForce RTX 3050 XLR8 759689
AMD Ryzen 9 7950X 4.5GHz
NVIDIA GeForce RTX 3050
min:
36 fps, max:
53 fps
~ 44 fps
79%
GeForce RTX 3080 Laptop GPU:
60 69.3 [X] Acemagic Tank03 759689
Intel Core i9-12900H 1.8GHz
GeForce RTX 3080 Laptop GPU
min:
53 fps, max:
81 fps
73 83.5 [X] 728712
AMD Ryzen 9 5980HS 3GHz
GeForce RTX 3080 Laptop GPU
min:
71 fps, max:
97 fps
~ 71 fps
100%
NVIDIA GeForce RTX 3070:
342.6 fps
37%
GeForce RTX 3080 Laptop GPU:
127.6 fps
100%
NVIDIA GeForce RTX 3070:
204.9 fps
92%
GeForce RTX 3080 Laptop GPU:
187.8 fps
100%
NVIDIA GeForce RTX 3070:
150.8 fps
92%
GeForce RTX 3080 Laptop GPU:
136 138 142.8 ~ 139 fps
100%
NVIDIA GeForce RTX 3070:
136.2 fps
79%
GeForce RTX 3080 Laptop GPU:
103 107 114.7 ~ 108 fps
100%
NVIDIA GeForce RTX 3070:
98.2 fps
100%
NVIDIA GeForce RTX 3070:
53.5 fps
100%
NVIDIA GeForce RTX 3070:
246 [X] AMD Ryzen 9 5900X 3.7GHz
NVIDIA GeForce RTX 3070
P1:
114.9 fps
246 [X] AMD Ryzen 9 5900X 3.7GHz
NVIDIA GeForce RTX 3070
P1:
114.9 fps
547 ~ 346 fps
79%
GeForce RTX 3080 Laptop GPU:
211 289 323.2 ~ 274 fps
100%
NVIDIA GeForce RTX 3070:
246 [X] AMD Ryzen 9 5900X 3.7GHz
NVIDIA GeForce RTX 3070
P1:
131.6 fps
246 [X] AMD Ryzen 9 5900X 3.7GHz
NVIDIA GeForce RTX 3070
P1:
131.6 fps
358 ~ 283 fps
70%
GeForce RTX 3080 Laptop GPU:
197 197.5 199 ~ 198 fps
100%
NVIDIA GeForce RTX 3070:
244 [X] AMD Ryzen 9 5900X 3.7GHz
NVIDIA GeForce RTX 3070
P1:
147.1 fps
244 [X] AMD Ryzen 9 5900X 3.7GHz
NVIDIA GeForce RTX 3070
P1:
147.1 fps
322 ~ 270 fps
100%
NVIDIA GeForce RTX 3070:
237 [X] AMD Ryzen 9 5900X 3.7GHz
NVIDIA GeForce RTX 3070
P1:
128.2 fps
237 [X] AMD Ryzen 9 5900X 3.7GHz
NVIDIA GeForce RTX 3070
P1:
128.2 fps
311 ~ 262 fps
100%
NVIDIA GeForce RTX 3070:
208 [X] AMD Ryzen 9 5900X 3.7GHz
NVIDIA GeForce RTX 3070
P1:
140.8 fps
208 [X] AMD Ryzen 9 5900X 3.7GHz
NVIDIA GeForce RTX 3070
P1:
140.8 fps
244 ~ 220 fps
61%
GeForce RTX 3080 Laptop GPU:
123 145.8 ~ 134 fps
100%
NVIDIA GeForce RTX 3070:
116 [X] AMD Ryzen 9 5900X 3.7GHz
NVIDIA GeForce RTX 3070
P1:
96.2 fps
116 [X] AMD Ryzen 9 5900X 3.7GHz
NVIDIA GeForce RTX 3070
P1:
96.2 fps
136 ~ 123 fps
62%
GeForce RTX 3080 Laptop GPU:
68 83.4 ~ 76 fps
100%
NVIDIA GeForce RTX 3070:
174 [X] AMD Ryzen 9 5900X 3.7GHz
NVIDIA GeForce RTX 3070
min:
148 fps, max:
200 fps
216 [X] AMD Ryzen 9 5900X 3.7GHz
NVIDIA GeForce RTX 3070
min:
181 fps, max:
264 fps
~ 195 fps
100%
NVIDIA GeForce RTX 3070:
152 [X] AMD Ryzen 9 5900X 3.7GHz
NVIDIA GeForce RTX 3070
min:
131 fps, max:
176 fps
192 [X] AMD Ryzen 9 5900X 3.7GHz
NVIDIA GeForce RTX 3070
min:
162 fps, max:
215 fps
~ 172 fps
100%
NVIDIA GeForce RTX 3070:
137 [X] AMD Ryzen 9 5900X 3.7GHz
NVIDIA GeForce RTX 3070
min:
115 fps, max:
159 fps
180 [X] AMD Ryzen 9 5900X 3.7GHz
NVIDIA GeForce RTX 3070
min:
161 fps, max:
206 fps
~ 159 fps
72%
GeForce RTX 3080 Laptop GPU:
110 [X] MSI GS76 Stealth 11UH Intel Core i9-11900H 2.5GHz
GeForce RTX 3080 Laptop GPU
min:
45.1 fps, P0.1:
49.4 fps, P1:
72.7 fps, max:
189 fps
111 122 [X] Medion Erazer Beast X25 AMD Ryzen 9 5900HX 3.3GHz
GeForce RTX 3080 Laptop GPU
min:
48.9 fps, P0.1:
76.5 fps, P1:
85.9 fps, max:
219 fps
~ 114 fps
100%
NVIDIA GeForce RTX 3070:
128 [X] AMD Ryzen 9 5900X 3.7GHz
NVIDIA GeForce RTX 3070
min:
108 fps, max:
139 fps
138 [X] AMD Ryzen 9 5900X 3.7GHz
NVIDIA GeForce RTX 3070
min:
131 fps, max:
144 fps
~ 133 fps
56%
GeForce RTX 3080 Laptop GPU:
71.4 77.9 [X] MSI GS76 Stealth 11UH Intel Core i9-11900H 2.5GHz
GeForce RTX 3080 Laptop GPU
min:
12.1 fps, P0.1:
51.3 fps, P1:
59.6 fps, max:
143 fps
~ 75 fps
100%
NVIDIA GeForce RTX 3070:
70.2 [X] AMD Ryzen 9 5900X 3.7GHz
NVIDIA GeForce RTX 3070
min:
67 fps, max:
75 fps
74.2 [X] AMD Ryzen 9 5900X 3.7GHz
NVIDIA GeForce RTX 3070
min:
72 fps, max:
77 fps
~ 72 fps
51%
GeForce RTX 3080 Laptop GPU:
36.8 37.8 [X] MSI GS76 Stealth 11UH Intel Core i9-11900H 2.5GHz
GeForce RTX 3080 Laptop GPU
min:
10 fps, P0.1:
21.2 fps, P1:
28 fps, max:
59 fps
~ 37 fps
100%
NVIDIA GeForce RTX 3070:
156.5 [X] AMD Ryzen 9 5900X 3.7GHz
NVIDIA GeForce RTX 3070
min:
80 fps, max:
301 fps
168 [X] AMD Ryzen 9 5900X 3.7GHz
NVIDIA GeForce RTX 3070
min:
87 fps, max:
284 fps
175 ~ 167 fps
100%
NVIDIA GeForce RTX 3070:
149 [X] AMD Ryzen 9 5900X 3.7GHz
NVIDIA GeForce RTX 3070
156 [X] AMD Ryzen 9 5900X 3.7GHz
NVIDIA GeForce RTX 3070
min:
83 fps, max:
209 fps
160 ~ 155 fps
100%
NVIDIA GeForce RTX 3070:
112.8 [X] AMD Ryzen 9 5900X 3.7GHz
NVIDIA GeForce RTX 3070
min:
40 fps, max:
160 fps
118 119 [X] AMD Ryzen 9 5900X 3.7GHz
NVIDIA GeForce RTX 3070
min:
82 fps, max:
119 fps
~ 117 fps
76%
GeForce RTX 3080 Laptop GPU:
85.1 93.1 ~ 89 fps
100%
NVIDIA GeForce RTX 3070:
76.2 [X] AMD Ryzen 9 5900X 3.7GHz
NVIDIA GeForce RTX 3070
min:
33 fps, max:
116 fps
77.9 78 [X] AMD Ryzen 9 5900X 3.7GHz
NVIDIA GeForce RTX 3070
min:
38 fps, max:
126 fps
~ 77 fps
77%
GeForce RTX 3080 Laptop GPU:
57.5 61 ~ 59 fps
100%
NVIDIA GeForce RTX 3070:
63.2 63.4 [X] AMD Ryzen 9 5900X 3.7GHz
NVIDIA GeForce RTX 3070
min:
32 fps, max:
90 fps
65 [X] AMD Ryzen 9 5900X 3.7GHz
NVIDIA GeForce RTX 3070
min:
33 fps, max:
100 fps
~ 64 fps
77%
GeForce RTX 3080 Laptop GPU:
46.9 50.3 ~ 49 fps
100%
NVIDIA GeForce RTX 3070:
42.1 [X] AMD Ryzen 9 5900X 3.7GHz
NVIDIA GeForce RTX 3070
min:
31 fps, max:
54 fps
42.6 44 [X] AMD Ryzen 9 5900X 3.7GHz
NVIDIA GeForce RTX 3070
min:
32 fps, max:
55 fps
~ 43 fps
74%
GeForce RTX 3080 Laptop GPU:
31.2 32.8 ~ 32 fps
100%
NVIDIA GeForce RTX 3070:
106 [X] AMD Ryzen 9 5900X 3.7GHz
NVIDIA GeForce RTX 3070
min:
60 fps, max:
141 fps
130 [X] AMD Ryzen 9 5900X 3.7GHz
NVIDIA GeForce RTX 3070
min:
87 fps, max:
145 fps
~ 118 fps
100%
NVIDIA GeForce RTX 3070:
106 [X] AMD Ryzen 9 5900X 3.7GHz
NVIDIA GeForce RTX 3070
min:
60 fps, max:
142 fps
128 [X] AMD Ryzen 9 5900X 3.7GHz
NVIDIA GeForce RTX 3070
min:
89 fps, max:
145 fps
~ 117 fps
85%
GeForce RTX 3080 Laptop GPU:
97.8 102 [X] Gigabyte Aero 17 HDR YC Intel Core i9-10980HK 2.4GHz
GeForce RTX 3080 Laptop GPU
min:
18.8 fps, P0.1:
43.7 fps, P1:
59.8 fps, max:
160 fps
~ 100 fps
100%
NVIDIA GeForce RTX 3070:
104 [X] AMD Ryzen 9 5900X 3.7GHz
NVIDIA GeForce RTX 3070
min:
55 fps, max:
134 fps
128 [X] AMD Ryzen 9 5900X 3.7GHz
NVIDIA GeForce RTX 3070
min:
82 fps, max:
145 fps
~ 116 fps
82%
GeForce RTX 3080 Laptop GPU:
91.5 98.4 [X] Gigabyte Aero 17 HDR YC Intel Core i9-10980HK 2.4GHz
GeForce RTX 3080 Laptop GPU
min:
44.1 fps, P0.1:
49.7 fps, P1:
61 fps, max:
146 fps
~ 95 fps
100%
NVIDIA GeForce RTX 3070:
102 [X] AMD Ryzen 9 5900X 3.7GHz
NVIDIA GeForce RTX 3070
min:
59 fps, max:
133 fps
125 [X] AMD Ryzen 9 5900X 3.7GHz
NVIDIA GeForce RTX 3070
min:
81 fps, max:
145 fps
~ 114 fps
73%
GeForce RTX 3080 Laptop GPU:
79 86.1 [X] Gigabyte Aero 17 HDR YC Intel Core i9-10980HK 2.4GHz
GeForce RTX 3080 Laptop GPU
min:
39.9 fps, P0.1:
46.7 fps, P1:
58.4 fps, max:
122 fps
~ 83 fps
100%
NVIDIA GeForce RTX 3070:
67.6 [X] AMD Ryzen 9 5900X 3.7GHz
NVIDIA GeForce RTX 3070
min:
56 fps, max:
76 fps
70.1 [X] AMD Ryzen 9 5900X 3.7GHz
NVIDIA GeForce RTX 3070
min:
60 fps, max:
82 fps
~ 69 fps
67%
GeForce RTX 3080 Laptop GPU:
42.1 49.1 [X] Gigabyte Aero 17 HDR YC Intel Core i9-10980HK 2.4GHz
GeForce RTX 3080 Laptop GPU
min:
14.5 fps, P0.1:
14.6 fps, P1:
18.1 fps, max:
91.8 fps
~ 46 fps
GeForce RTX 3080 Laptop GPU:
94.3 97.5 [X] Gigabyte Aero 17 HDR YC Intel Core i9-10980HK 2.4GHz
GeForce RTX 3080 Laptop GPU
min:
11.1 fps, P0.1:
43.1 fps, P1:
56.7 fps, max:
140 fps
~ 96 fps
GeForce RTX 3080 Laptop GPU:
89.4 93.4 [X] Gigabyte Aero 17 HDR YC Intel Core i9-10980HK 2.4GHz
GeForce RTX 3080 Laptop GPU
min:
38.8 fps, P0.1:
49.9 fps, P1:
64.6 fps, max:
126 fps
~ 91 fps
GeForce RTX 3080 Laptop GPU:
67.9 77.5 [X] Gigabyte Aero 17 HDR YC Intel Core i9-10980HK 2.4GHz
GeForce RTX 3080 Laptop GPU
min:
26.2 fps, P0.1:
38.7 fps, P1:
53 fps, max:
122 fps
~ 73 fps
GeForce RTX 3080 Laptop GPU:
40.7 51 [X] Gigabyte Aero 17 HDR YC Intel Core i9-10980HK 2.4GHz
GeForce RTX 3080 Laptop GPU
min:
28.8 fps, P0.1:
36.8 fps, P1:
40.5 fps, max:
89.5 fps
~ 46 fps
GeForce RTX 3080 Laptop GPU:
113 fps
GeForce RTX 3080 Laptop GPU:
84.8 fps
GeForce RTX 3080 Laptop GPU:
69.8 fps
GeForce RTX 3080 Laptop GPU:
48.7 fps
100%
NVIDIA GeForce RTX 3070:
134 [X] AMD Ryzen 9 5900X 3.7GHz
NVIDIA GeForce RTX 3070
142 [X] AMD Ryzen 9 5900X 3.7GHz
NVIDIA GeForce RTX 3070
149 [X] Intel Core i7-10700 2.9GHz
NVIDIA GeForce RTX 3070
169 171.5 ~ 153 fps
139%
NVIDIA GeForce RTX 3050:
174 [X] AMD Ryzen 9 5900X 3.7GHz
NVIDIA GeForce RTX 3050
252 [X] PNY GeForce RTX 3050 XLR8 AMD Ryzen 9 7950X 4.5GHz
NVIDIA GeForce RTX 3050
~ 213 fps
104%
GeForce RTX 3080 Laptop GPU:
158.7 fps
100%
NVIDIA GeForce RTX 3070:
123 [X] AMD Ryzen 9 5900X 3.7GHz
NVIDIA GeForce RTX 3070
129 [X] AMD Ryzen 9 5900X 3.7GHz
NVIDIA GeForce RTX 3070
132 [X] Intel Core i7-10700 2.9GHz
NVIDIA GeForce RTX 3070
144.7 150 ~ 136 fps
88%
NVIDIA GeForce RTX 3050:
114 [X] AMD Ryzen 9 5900X 3.7GHz
NVIDIA GeForce RTX 3050
123 [X] PNY GeForce RTX 3050 XLR8 AMD Ryzen 9 7950X 4.5GHz
NVIDIA GeForce RTX 3050
~ 119 fps
99%
GeForce RTX 3080 Laptop GPU:
135.2 fps
100%
NVIDIA GeForce RTX 3070:
94.5 [X] AMD Ryzen 9 5900X 3.7GHz
NVIDIA GeForce RTX 3070
111 [X] AMD Ryzen 9 5900X 3.7GHz
NVIDIA GeForce RTX 3070
118 [X] Intel Core i7-10700 2.9GHz
NVIDIA GeForce RTX 3070
126 127.9 ~ 115 fps
66%
NVIDIA GeForce RTX 3050:
74.1 [X] AMD Ryzen 9 5900X 3.7GHz
NVIDIA GeForce RTX 3050
77.2 [X] PNY GeForce RTX 3050 XLR8 AMD Ryzen 9 7950X 4.5GHz
NVIDIA GeForce RTX 3050
~ 76 fps
100%
NVIDIA GeForce RTX 3070:
95.3 [X] AMD Ryzen 9 5900X 3.7GHz
NVIDIA GeForce RTX 3070
95.8 [X] AMD Ryzen 9 5900X 3.7GHz
NVIDIA GeForce RTX 3070
98.8 [X] Intel Core i7-10700 2.9GHz
NVIDIA GeForce RTX 3070
104 108.9 ~ 101 fps
56%
NVIDIA GeForce RTX 3050:
55.7 [X] AMD Ryzen 9 5900X 3.7GHz
NVIDIA GeForce RTX 3050
57.6 [X] PNY GeForce RTX 3050 XLR8 AMD Ryzen 9 7950X 4.5GHz
NVIDIA GeForce RTX 3050
~ 57 fps
83%
GeForce RTX 3080 Laptop GPU:
76.5 85.5 90 ~ 84 fps
100%
NVIDIA GeForce RTX 3070:
75.1 [X] AMD Ryzen 9 5900X 3.7GHz
NVIDIA GeForce RTX 3070
75.5 [X] Intel Core i7-10700 2.9GHz
NVIDIA GeForce RTX 3070
75.9 [X] AMD Ryzen 9 5900X 3.7GHz
NVIDIA GeForce RTX 3070
79 82.9 ~ 78 fps
51%
NVIDIA GeForce RTX 3050:
40.3 [X] PNY GeForce RTX 3050 XLR8 AMD Ryzen 9 7950X 4.5GHz
NVIDIA GeForce RTX 3050
40.4 [X] AMD Ryzen 9 5900X 3.7GHz
NVIDIA GeForce RTX 3050
~ 40 fps
100%
NVIDIA GeForce RTX 3070:
42.7 [X] Intel Core i7-10700 2.9GHz
NVIDIA GeForce RTX 3070
43.8 [X] AMD Ryzen 9 5900X 3.7GHz
NVIDIA GeForce RTX 3070
44.2 [X] AMD Ryzen 9 5900X 3.7GHz
NVIDIA GeForce RTX 3070
44.5 46.3 ~ 44 fps
50%
NVIDIA GeForce RTX 3050:
21.5 [X] PNY GeForce RTX 3050 XLR8 AMD Ryzen 9 7950X 4.5GHz
NVIDIA GeForce RTX 3050
21.8 [X] AMD Ryzen 9 5900X 3.7GHz
NVIDIA GeForce RTX 3050
~ 22 fps
77%
GeForce RTX 3080 Laptop GPU:
32.3 34.9 36 ~ 34 fps
100%
NVIDIA GeForce RTX 3070:
238 [X] AMD Ryzen 9 5900X 3.7GHz
NVIDIA GeForce RTX 3070
min:
214 fps, max:
242 fps
238 [X] AMD Ryzen 9 5900X 3.7GHz
NVIDIA GeForce RTX 3070
min:
228 fps, max:
242 fps
240 ~ 239 fps
97%
NVIDIA GeForce RTX 3050:
226 [X] AMD Ryzen 9 5900X 3.7GHz
NVIDIA GeForce RTX 3050
min:
101 fps, P0.1:
128 fps, P1:
136 fps, max:
513 fps
236 [X] PNY GeForce RTX 3050 XLR8 AMD Ryzen 9 7950X 4.5GHz
NVIDIA GeForce RTX 3050
min:
72.6 fps, P0.1:
105.7 fps, P1:
158.2 fps, max:
879 fps
~ 231 fps
100%
GeForce RTX 3080 Laptop GPU:
239 [X] Acemagic Tank03 Intel Core i9-12900H 1.8GHz
GeForce RTX 3080 Laptop GPU
min:
27.3 fps, P0.1:
56.4 fps, P1:
130.8 fps, max:
609 fps
fps
100%
NVIDIA GeForce RTX 3070:
147 [X] AMD Ryzen 9 5900X 3.7GHz
NVIDIA GeForce RTX 3070
min:
99 fps, max:
180 fps
149 [X] AMD Ryzen 9 5900X 3.7GHz
NVIDIA GeForce RTX 3070
min:
128 fps, max:
174 fps
167.7 ~ 155 fps
52%
NVIDIA GeForce RTX 3050:
78.8 [X] AMD Ryzen 9 5900X 3.7GHz
NVIDIA GeForce RTX 3050
min:
33.6 fps, P0.1:
55 fps, P1:
58.6 fps, max:
313 fps
84.1 [X] PNY GeForce RTX 3050 XLR8 AMD Ryzen 9 7950X 4.5GHz
NVIDIA GeForce RTX 3050
min:
44.6 fps, P0.1:
56.8 fps, P1:
69.1 fps, max:
409 fps
~ 81 fps
80%
GeForce RTX 3080 Laptop GPU:
124.7 [X] Acemagic Tank03 Intel Core i9-12900H 1.8GHz
GeForce RTX 3080 Laptop GPU
min:
44.1 fps, P0.1:
70.6 fps, P1:
92.7 fps, max:
398 fps
fps
100%
NVIDIA GeForce RTX 3070:
117 [X] AMD Ryzen 9 5900X 3.7GHz
NVIDIA GeForce RTX 3070
min:
100 fps, max:
135 fps
122 [X] AMD Ryzen 9 5900X 3.7GHz
NVIDIA GeForce RTX 3070
min:
103 fps, max:
138 fps
124.9 ~ 121 fps
50%
NVIDIA GeForce RTX 3050:
59.1 [X] AMD Ryzen 9 5900X 3.7GHz
NVIDIA GeForce RTX 3050
min:
38.3 fps, P0.1:
45.4 fps, P1:
49.6 fps, max:
75.9 fps
61.2 [X] PNY GeForce RTX 3050 XLR8 AMD Ryzen 9 7950X 4.5GHz
NVIDIA GeForce RTX 3050
min:
40.7 fps, P0.1:
42.5 fps, P1:
51.2 fps, max:
190.3 fps
~ 60 fps
74%
GeForce RTX 3080 Laptop GPU:
82.3 91.3 [X] Acemagic Tank03 Intel Core i9-12900H 1.8GHz
GeForce RTX 3080 Laptop GPU
min:
36.3 fps, P0.1:
54.1 fps, P1:
70.9 fps, max:
428 fps
94.8 ~ 89 fps
100%
NVIDIA GeForce RTX 3070:
79.8 [X] AMD Ryzen 9 5900X 3.7GHz
NVIDIA GeForce RTX 3070
min:
68 fps, max:
91 fps
81.3 82.5 [X] AMD Ryzen 9 5900X 3.7GHz
NVIDIA GeForce RTX 3070
min:
72 fps, max:
96 fps
~ 81 fps
47%
NVIDIA GeForce RTX 3050:
38 [X] AMD Ryzen 9 5900X 3.7GHz
NVIDIA GeForce RTX 3050
min:
27.8 fps, P0.1:
31.7 fps, P1:
32.5 fps, max:
50.7 fps
38.5 [X] PNY GeForce RTX 3050 XLR8 AMD Ryzen 9 7950X 4.5GHz
NVIDIA GeForce RTX 3050
min:
26 fps, P0.1:
26.7 fps, P1:
32.7 fps, max:
69.7 fps
~ 38 fps
73%
GeForce RTX 3080 Laptop GPU:
55.7 58.2 [X] Acemagic Tank03 Intel Core i9-12900H 1.8GHz
GeForce RTX 3080 Laptop GPU
min:
34.7 fps, P0.1:
43.7 fps, P1:
47.1 fps, max:
150.6 fps
62.3 ~ 59 fps
100%
NVIDIA GeForce RTX 3070:
40.6 41 [X] AMD Ryzen 9 5900X 3.7GHz
NVIDIA GeForce RTX 3070
42.3 [X] AMD Ryzen 9 5900X 3.7GHz
NVIDIA GeForce RTX 3070
min:
37 fps, max:
49 fps
~ 41 fps
46%
NVIDIA GeForce RTX 3050:
18.6 [X] PNY GeForce RTX 3050 XLR8 AMD Ryzen 9 7950X 4.5GHz
NVIDIA GeForce RTX 3050
min:
14.4 fps, P0.1:
14.7 fps, P1:
16.3 fps, max:
23.8 fps
18.7 [X] AMD Ryzen 9 5900X 3.7GHz
NVIDIA GeForce RTX 3050
min:
15.5 fps, P0.1:
15.8 fps, P1:
16.3 fps, max:
38.8 fps
~ 19 fps
73%
GeForce RTX 3080 Laptop GPU:
29 29.1 [X] Acemagic Tank03 Intel Core i9-12900H 1.8GHz
GeForce RTX 3080 Laptop GPU
min:
20 fps, P0.1:
20.4 fps, P1:
23.8 fps, max:
78.4 fps
30.9 ~ 30 fps
NVIDIA GeForce RTX 3050:
22.7 [X] PNY GeForce RTX 3050 XLR8 AMD Ryzen 9 7950X 4.5GHz
NVIDIA GeForce RTX 3050
min:
20.5 fps, P0.1:
20.6 fps, P1:
20.9 fps, max:
25.6 fps
fps
100%
NVIDIA GeForce RTX 3070:
371.5 fps
73%
GeForce RTX 3080 Laptop GPU:
270.2 fps
100%
NVIDIA GeForce RTX 3070:
206.4 fps
72%
GeForce RTX 3080 Laptop GPU:
148.6 fps
100%
NVIDIA GeForce RTX 3070:
136 fps
80%
GeForce RTX 3080 Laptop GPU:
108.4 fps
100%
NVIDIA GeForce RTX 3070:
103.5 fps
81%
GeForce RTX 3080 Laptop GPU:
83.8 fps
100%
NVIDIA GeForce RTX 3070:
67.5 fps
84%
GeForce RTX 3080 Laptop GPU:
56.8 fps
100%
NVIDIA GeForce RTX 3070:
33.1 fps
88%
GeForce RTX 3080 Laptop GPU:
29 fps
100%
NVIDIA GeForce RTX 3070:
264 [X] AMD Ryzen 9 5900X 3.7GHz
NVIDIA GeForce RTX 3070
P1:
138.9 fps
fps
100%
NVIDIA GeForce RTX 3070:
192 [X] AMD Ryzen 9 5900X 3.7GHz
NVIDIA GeForce RTX 3070
P1:
135.1 fps
fps
100%
NVIDIA GeForce RTX 3070:
168 [X] AMD Ryzen 9 5900X 3.7GHz
NVIDIA GeForce RTX 3070
P1:
129.9 fps
fps
69%
GeForce RTX 3080 Laptop GPU:
116 fps
100%
NVIDIA GeForce RTX 3070:
163 [X] AMD Ryzen 9 5900X 3.7GHz
NVIDIA GeForce RTX 3070
P1:
119 fps
fps
71%
GeForce RTX 3080 Laptop GPU:
115 fps
100%
NVIDIA GeForce RTX 3070:
110 [X] AMD Ryzen 9 5900X 3.7GHz
NVIDIA GeForce RTX 3070
P1:
87.7 fps
fps
69%
GeForce RTX 3080 Laptop GPU:
75.5 fps
100%
NVIDIA GeForce RTX 3070:
56.7 [X] AMD Ryzen 9 5900X 3.7GHz
NVIDIA GeForce RTX 3070
P1:
51.8 fps
fps
67%
GeForce RTX 3080 Laptop GPU:
37.8 fps
100%
NVIDIA GeForce RTX 3070:
115 [X] AMD Ryzen 9 5900X 3.7GHz
NVIDIA GeForce RTX 3070
min:
103 fps, max:
135 fps
167.5 170 [X] AMD Ryzen 9 5900X 3.7GHz
NVIDIA GeForce RTX 3070
min:
143 fps, max:
189 fps
~ 151 fps
85%
NVIDIA GeForce RTX 3050:
129 [X] AMD Ryzen 9 5900X 3.7GHz
NVIDIA GeForce RTX 3050
min:
79.4 fps, P0.1:
89 fps, P1:
103 fps, max:
164 fps
fps
89%
GeForce RTX 3080 Laptop GPU:
134.9 [X] Acemagic Tank03 Intel Core i9-12900H 1.8GHz
GeForce RTX 3080 Laptop GPU
min:
53.3 fps, P0.1:
97.6 fps, P1:
110.3 fps, max:
170.9 fps
fps
100%
NVIDIA GeForce RTX 3070:
112 [X] AMD Ryzen 9 5900X 3.7GHz
NVIDIA GeForce RTX 3070
min:
94 fps, max:
137 fps
147 [X] AMD Ryzen 9 5900X 3.7GHz
NVIDIA GeForce RTX 3070
min:
118 fps, max:
170 fps
164.1 ~ 141 fps
87%
NVIDIA GeForce RTX 3050:
123 [X] AMD Ryzen 9 5900X 3.7GHz
NVIDIA GeForce RTX 3050
min:
70.7 fps, P0.1:
79.4 fps, P1:
95.8 fps, max:
162 fps
fps
89%
GeForce RTX 3080 Laptop GPU:
126 [X] Acemagic Tank03 Intel Core i9-12900H 1.8GHz
GeForce RTX 3080 Laptop GPU
min:
37.5 fps, P0.1:
76.8 fps, P1:
100.7 fps, max:
157.1 fps
fps
100%
NVIDIA GeForce RTX 3070:
82.7 [X] AMD Ryzen 9 5900X 3.7GHz
NVIDIA GeForce RTX 3070
min:
66 fps, max:
107 fps
100 [X] AMD Ryzen 9 5900X 3.7GHz
NVIDIA GeForce RTX 3070
min:
85 fps, max:
121 fps
130.8 ~ 105 fps
79%
NVIDIA GeForce RTX 3050:
83.1 [X] AMD Ryzen 9 5900X 3.7GHz
NVIDIA GeForce RTX 3050
min:
39.8 fps, P0.1:
45.8 fps, P1:
51.3 fps, max:
120 fps
fps
85%
GeForce RTX 3080 Laptop GPU:
77.6 83.3 [X] Gigabyte Aero 17 HDR YC Intel Core i9-10980HK 2.4GHz
GeForce RTX 3080 Laptop GPU
min:
51.1 fps, P0.1:
58.3 fps, P1:
67 fps, max:
104 fps
105.2 [X] Acemagic Tank03 Intel Core i9-12900H 1.8GHz
GeForce RTX 3080 Laptop GPU
min:
58.1 fps, P0.1:
75.8 fps, P1:
85.9 fps, max:
136 fps
~ 89 fps
100%
NVIDIA GeForce RTX 3070:
46.5 [X] AMD Ryzen 9 5900X 3.7GHz
NVIDIA GeForce RTX 3070
min:
34 fps, max:
66 fps
52 [X] AMD Ryzen 9 5900X 3.7GHz
NVIDIA GeForce RTX 3070
min:
42 fps, max:
66 fps
74.7 ~ 58 fps
70%
NVIDIA GeForce RTX 3050:
40.8 [X] AMD Ryzen 9 5900X 3.7GHz
NVIDIA GeForce RTX 3050
min:
19.4 fps, P0.1:
20.9 fps, P1:
27.1 fps, max:
61.1 fps
fps
86%
GeForce RTX 3080 Laptop GPU:
44.3 47 [X] Gigabyte Aero 17 HDR YC Intel Core i9-10980HK 2.4GHz
GeForce RTX 3080 Laptop GPU
min:
26.8 fps, P0.1:
30.1 fps, P1:
35.2 fps, max:
62.3 fps
59 [X] Acemagic Tank03 Intel Core i9-12900H 1.8GHz
GeForce RTX 3080 Laptop GPU
min:
41 fps, P0.1:
43.3 fps, P1:
45.9 fps, max:
76.6 fps
~ 50 fps
100%
NVIDIA GeForce RTX 3070:
46.2 [X] AMD Ryzen 9 5900X 3.7GHz
NVIDIA GeForce RTX 3070
min:
37 fps, max:
58 fps
50.5 [X] AMD Ryzen 9 5900X 3.7GHz
NVIDIA GeForce RTX 3070
min:
42 fps, max:
66 fps
69.3 ~ 55 fps
52%
NVIDIA GeForce RTX 3050:
28.6 [X] AMD Ryzen 9 5900X 3.7GHz
NVIDIA GeForce RTX 3050
min:
9.42 fps, P0.1:
15.1 fps, P1:
20.4 fps, max:
54.3 fps
fps
85%
GeForce RTX 3080 Laptop GPU:
37.9 45.6 [X] Gigabyte Aero 17 HDR YC Intel Core i9-10980HK 2.4GHz
GeForce RTX 3080 Laptop GPU
min:
23.9 fps, P0.1:
30.2 fps, P1:
36.7 fps, max:
63.5 fps
56.5 [X] Acemagic Tank03 Intel Core i9-12900H 1.8GHz
GeForce RTX 3080 Laptop GPU
min:
40.6 fps, P0.1:
41.9 fps, P1:
44.1 fps, max:
72.2 fps
~ 47 fps
100%
NVIDIA GeForce RTX 3070:
34.3 [X] AMD Ryzen 9 5900X 3.7GHz
NVIDIA GeForce RTX 3070
min:
25 fps, max:
40 fps
35 [X] AMD Ryzen 9 5900X 3.7GHz
NVIDIA GeForce RTX 3070
min:
23 fps, max:
40 fps
41.8 ~ 37 fps
47%
NVIDIA GeForce RTX 3050:
17.4 [X] AMD Ryzen 9 5900X 3.7GHz
NVIDIA GeForce RTX 3050
min:
4.54 fps, P0.1:
4.56 fps, P1:
13 fps, max:
56.1 fps
fps
95%
GeForce RTX 3080 Laptop GPU:
25.2 30.5 [X] Gigabyte Aero 17 HDR YC Intel Core i9-10980HK 2.4GHz
GeForce RTX 3080 Laptop GPU
min:
10.4 fps, P0.1:
18.2 fps, P1:
23.4 fps, max:
46.8 fps
50 [X] Acemagic Tank03 Intel Core i9-12900H 1.8GHz
GeForce RTX 3080 Laptop GPU
min:
15.4 fps, P0.1:
27.3 fps, P1:
32.1 fps, max:
71.5 fps
~ 35 fps
100%
NVIDIA GeForce RTX 3070:
220 [X] AMD Ryzen 9 5900X 3.7GHz
NVIDIA GeForce RTX 3070
fps
100%
NVIDIA GeForce RTX 3070:
173 [X] AMD Ryzen 9 5900X 3.7GHz
NVIDIA GeForce RTX 3070
fps
100%
NVIDIA GeForce RTX 3070:
142 [X] AMD Ryzen 9 5900X 3.7GHz
NVIDIA GeForce RTX 3070
fps
80%
GeForce RTX 3080 Laptop GPU:
105 123 ~ 114 fps
100%
NVIDIA GeForce RTX 3070:
112 [X] AMD Ryzen 9 5900X 3.7GHz
NVIDIA GeForce RTX 3070
fps
79%
GeForce RTX 3080 Laptop GPU:
82 96 ~ 89 fps
100%
NVIDIA GeForce RTX 3070:
82 [X] AMD Ryzen 9 5900X 3.7GHz
NVIDIA GeForce RTX 3070
fps
77%
GeForce RTX 3080 Laptop GPU:
56 69 ~ 63 fps
100%
NVIDIA GeForce RTX 3070:
49 [X] AMD Ryzen 9 5900X 3.7GHz
NVIDIA GeForce RTX 3070
fps
71%
GeForce RTX 3080 Laptop GPU:
31 38 ~ 35 fps
100%
NVIDIA GeForce RTX 3070:
126 [X] Intel Core i7-10700 2.9GHz
NVIDIA GeForce RTX 3070
min:
96 fps, max:
186 fps
131 [X] AMD Ryzen 9 5900X 3.7GHz
NVIDIA GeForce RTX 3070
min:
91 fps, max:
206 fps
152 [X] AMD Ryzen 9 5900X 3.7GHz
NVIDIA GeForce RTX 3070
min:
101 fps, max:
237 fps
162 ~ 143 fps
119%
NVIDIA GeForce RTX 3050:
158 [X] AMD Ryzen 9 5900X 3.7GHz
NVIDIA GeForce RTX 3050
min:
118 fps, max:
221 fps
181 [X] PNY GeForce RTX 3050 XLR8 AMD Ryzen 9 7950X 4.5GHz
NVIDIA GeForce RTX 3050
min:
143 fps, max:
238 fps
~ 170 fps
76%
GeForce RTX 3080 Laptop GPU:
80 [X] AMD Ryzen 9 5980HS 3GHz
GeForce RTX 3080 Laptop GPU
min:
61 fps, max:
111 fps
106 [X] AMD Ryzen 9 5980HS 3GHz
GeForce RTX 3080 Laptop GPU
min:
79 fps, max:
161 fps
142 [X] Acemagic Tank03 Intel Core i9-12900H 1.8GHz
GeForce RTX 3080 Laptop GPU
min:
72 fps, max:
204 fps
~ 109 fps
100%
NVIDIA GeForce RTX 3070:
110 [X] Intel Core i7-10700 2.9GHz
NVIDIA GeForce RTX 3070
min:
86 fps, max:
163 fps
112 [X] AMD Ryzen 9 5900X 3.7GHz
NVIDIA GeForce RTX 3070
min:
84 fps, max:
166 fps
135 [X] AMD Ryzen 9 5900X 3.7GHz
NVIDIA GeForce RTX 3070
min:
103 fps, max:
199 fps
140 ~ 124 fps
89%
NVIDIA GeForce RTX 3050:
109 [X] AMD Ryzen 9 5900X 3.7GHz
NVIDIA GeForce RTX 3050
min:
91 fps, max:
127 fps
111 [X] PNY GeForce RTX 3050 XLR8 AMD Ryzen 9 7950X 4.5GHz
NVIDIA GeForce RTX 3050
min:
93 fps, max:
128 fps
~ 110 fps
77%
GeForce RTX 3080 Laptop GPU:
70 [X] AMD Ryzen 9 5980HS 3GHz
GeForce RTX 3080 Laptop GPU
min:
55 fps, max:
95 fps
92 [X] AMD Ryzen 9 5980HS 3GHz
GeForce RTX 3080 Laptop GPU
min:
65 fps, max:
139 fps
123 [X] Acemagic Tank03 Intel Core i9-12900H 1.8GHz
GeForce RTX 3080 Laptop GPU
min:
100 fps, max:
178 fps
~ 95 fps
100%
NVIDIA GeForce RTX 3070:
106 [X] Intel Core i7-10700 2.9GHz
NVIDIA GeForce RTX 3070
min:
82 fps, max:
154 fps
112 [X] AMD Ryzen 9 5900X 3.7GHz
NVIDIA GeForce RTX 3070
min:
80 fps, max:
177 fps
130 [X] AMD Ryzen 9 5900X 3.7GHz
NVIDIA GeForce RTX 3070
min:
99 fps, max:
188 fps
135 ~ 121 fps
85%
NVIDIA GeForce RTX 3050:
102 [X] AMD Ryzen 9 5900X 3.7GHz
NVIDIA GeForce RTX 3050
min:
84 fps, max:
117 fps
103 [X] PNY GeForce RTX 3050 XLR8 AMD Ryzen 9 7950X 4.5GHz
NVIDIA GeForce RTX 3050
min:
87 fps, max:
120 fps
~ 103 fps
81%
GeForce RTX 3080 Laptop GPU:
68 [X] AMD Ryzen 9 5980HS 3GHz
GeForce RTX 3080 Laptop GPU
min:
54 fps, max:
96 fps
90 [X] AMD Ryzen 9 5980HS 3GHz
GeForce RTX 3080 Laptop GPU
min:
69 fps, max:
133 fps
101 113 118 [X] Acemagic Tank03 Intel Core i9-12900H 1.8GHz
GeForce RTX 3080 Laptop GPU
min:
94 fps, max:
170 fps
~ 98 fps
100%
NVIDIA GeForce RTX 3070:
95 [X] Intel Core i7-10700 2.9GHz
NVIDIA GeForce RTX 3070
min:
66 fps, max:
149 fps
97 [X] AMD Ryzen 9 5900X 3.7GHz
NVIDIA GeForce RTX 3070
min:
61 fps, max:
166 fps
116 [X] AMD Ryzen 9 5900X 3.7GHz
NVIDIA GeForce RTX 3070
min:
77 fps, max:
187 fps
121 ~ 107 fps
88%
NVIDIA GeForce RTX 3050:
93 [X] AMD Ryzen 9 5900X 3.7GHz
NVIDIA GeForce RTX 3050
min:
72 fps, max:
111 fps
95 [X] PNY GeForce RTX 3050 XLR8 AMD Ryzen 9 7950X 4.5GHz
NVIDIA GeForce RTX 3050
min:
73 fps, max:
113 fps
~ 94 fps
82%
GeForce RTX 3080 Laptop GPU:
62 [X] AMD Ryzen 9 5980HS 3GHz
GeForce RTX 3080 Laptop GPU
min:
44 fps, max:
94 fps
81 [X] AMD Ryzen 9 5980HS 3GHz
GeForce RTX 3080 Laptop GPU
min:
55 fps, max:
131 fps
90 100 106 [X] Acemagic Tank03 Intel Core i9-12900H 1.8GHz
GeForce RTX 3080 Laptop GPU
min:
78 fps, max:
162 fps
~ 88 fps
100%
NVIDIA GeForce RTX 3070:
92 [X] Intel Core i7-10700 2.9GHz
NVIDIA GeForce RTX 3070
min:
67 fps, max:
138 fps
94 [X] AMD Ryzen 9 5900X 3.7GHz
NVIDIA GeForce RTX 3070
min:
64 fps, max:
138 fps
107 [X] AMD Ryzen 9 5900X 3.7GHz
NVIDIA GeForce RTX 3070
min:
76 fps, max:
148 fps
113 ~ 102 fps
68%
NVIDIA GeForce RTX 3050:
68 [X] AMD Ryzen 9 5900X 3.7GHz
NVIDIA GeForce RTX 3050
min:
55 fps, max:
82 fps
69 [X] PNY GeForce RTX 3050 XLR8 AMD Ryzen 9 7950X 4.5GHz
NVIDIA GeForce RTX 3050
min:
54 fps, max:
83 fps
~ 69 fps
84%
GeForce RTX 3080 Laptop GPU:
78 80 [X] AMD Ryzen 9 5980HS 3GHz
GeForce RTX 3080 Laptop GPU
min:
55 fps, max:
130 fps
90 96 [X] Acemagic Tank03 Intel Core i9-12900H 1.8GHz
GeForce RTX 3080 Laptop GPU
min:
76 fps, max:
124 fps
~ 86 fps
100%
NVIDIA GeForce RTX 3070:
70 [X] AMD Ryzen 9 5900X 3.7GHz
NVIDIA GeForce RTX 3070
min:
52 fps, max:
86 fps
70 [X] Intel Core i7-10700 2.9GHz
NVIDIA GeForce RTX 3070
min:
58 fps, max:
86 fps
72 [X] AMD Ryzen 9 5900X 3.7GHz
NVIDIA GeForce RTX 3070
min:
61 fps, max:
86 fps
74 ~ 72 fps
51%
NVIDIA GeForce RTX 3050:
36 [X] PNY GeForce RTX 3050 XLR8 AMD Ryzen 9 7950X 4.5GHz
NVIDIA GeForce RTX 3050
min:
30 fps, max:
44 fps
37 [X] AMD Ryzen 9 5900X 3.7GHz
NVIDIA GeForce RTX 3050
min:
31 fps, max:
44 fps
~ 37 fps
81%
GeForce RTX 3080 Laptop GPU:
50 58 58 [X] Acemagic Tank03 Intel Core i9-12900H 1.8GHz
GeForce RTX 3080 Laptop GPU
min:
49 fps, max:
71 fps
65 [X] AMD Ryzen 9 5980HS 3GHz
GeForce RTX 3080 Laptop GPU
min:
54 fps, max:
80 fps
~ 58 fps
100%
NVIDIA GeForce RTX 3070:
156 [X] AMD Ryzen 9 5900X 3.7GHz
NVIDIA GeForce RTX 3070
min:
84.62 fps, max:
247.28 fps
166 [X] Intel Core i7-10700 2.9GHz
NVIDIA GeForce RTX 3070
min:
92.98 fps, max:
251.64 fps
193 [X] AMD Ryzen 9 5900X 3.7GHz
NVIDIA GeForce RTX 3070
min:
108.31 fps, max:
293.17 fps
197 224 ~ 187 fps
88%
NVIDIA GeForce RTX 3050:
157 [X] AMD Ryzen 9 5900X 3.7GHz
NVIDIA GeForce RTX 3050
min:
76.1 fps, max:
274.05 fps
170 [X] PNY GeForce RTX 3050 XLR8 AMD Ryzen 9 7950X 4.5GHz
NVIDIA GeForce RTX 3050
min:
83.26 fps, max:
290.19 fps
~ 164 fps
89%
GeForce RTX 3080 Laptop GPU:
147 [X] AMD Ryzen 9 5980HS 3GHz
GeForce RTX 3080 Laptop GPU
min:
81.54 fps, max:
223.46 fps
162 [X] AMD Ryzen 9 5980HS 3GHz
GeForce RTX 3080 Laptop GPU
min:
87.86 fps, max:
246 fps
193 ~ 167 fps
100%
NVIDIA GeForce RTX 3070:
136 [X] AMD Ryzen 9 5900X 3.7GHz
NVIDIA GeForce RTX 3070
min:
62.19 fps, max:
220.9 fps
136 [X] Intel Core i7-10700 2.9GHz
NVIDIA GeForce RTX 3070
min:
61.07 fps, max:
208.64 fps
148 [X] AMD Ryzen 9 5900X 3.7GHz
NVIDIA GeForce RTX 3070
min:
71.58 fps, max:
228.99 fps
154 156.8 ~ 146 fps
55%
NVIDIA GeForce RTX 3050:
78 [X] AMD Ryzen 9 5900X 3.7GHz
NVIDIA GeForce RTX 3050
min:
36.1 fps, max:
145.88 fps
82.8 [X] PNY GeForce RTX 3050 XLR8 AMD Ryzen 9 7950X 4.5GHz
NVIDIA GeForce RTX 3050
min:
39.85 fps, max:
163.48 fps
~ 80 fps
88%
GeForce RTX 3080 Laptop GPU:
125 [X] AMD Ryzen 9 5980HS 3GHz
GeForce RTX 3080 Laptop GPU
min:
63.51 fps, max:
180.05 fps
126.3 [X] Acemagic Tank03 Intel Core i9-12900H 1.8GHz
GeForce RTX 3080 Laptop GPU
min:
58.18 fps, max:
213.95 fps
132 [X] AMD Ryzen 9 5980HS 3GHz
GeForce RTX 3080 Laptop GPU
min:
63.91 fps, max:
197.24 fps
~ 128 fps
100%
NVIDIA GeForce RTX 3070:
113 [X] AMD Ryzen 9 5900X 3.7GHz
NVIDIA GeForce RTX 3070
min:
54.14 fps, max:
178.54 fps
116 [X] Intel Core i7-10700 2.9GHz
NVIDIA GeForce RTX 3070
min:
58.17 fps, max:
182.15 fps
117 [X] AMD Ryzen 9 5900X 3.7GHz
NVIDIA GeForce RTX 3070
min:
53.16 fps, max:
187.55 fps
118 121.9 ~ 117 fps
50%
NVIDIA GeForce RTX 3050:
57.5 [X] AMD Ryzen 9 5900X 3.7GHz
NVIDIA GeForce RTX 3050
min:
29.18 fps, max:
100.64 fps
60.5 [X] PNY GeForce RTX 3050 XLR8 AMD Ryzen 9 7950X 4.5GHz
NVIDIA GeForce RTX 3050
min:
31.09 fps, max:
101.68 fps
~ 59 fps
83%
GeForce RTX 3080 Laptop GPU:
85 92.5 96.1 [X] Acemagic Tank03 Intel Core i9-12900H 1.8GHz
GeForce RTX 3080 Laptop GPU
min:
47.07 fps, max:
167.03 fps
104 [X] AMD Ryzen 9 5980HS 3GHz
GeForce RTX 3080 Laptop GPU
min:
52.55 fps, max:
158.4 fps
109 [X] AMD Ryzen 9 5980HS 3GHz
GeForce RTX 3080 Laptop GPU
min:
52.76 fps, max:
168.58 fps
~ 97 fps
100%
NVIDIA GeForce RTX 3070:
91.3 [X] AMD Ryzen 9 5900X 3.7GHz
NVIDIA GeForce RTX 3070
min:
46.36 fps, max:
152.74 fps
93.1 [X] Intel Core i7-10700 2.9GHz
NVIDIA GeForce RTX 3070
min:
45.73 fps, max:
151.06 fps
93.6 93.7 [X] AMD Ryzen 9 5900X 3.7GHz
NVIDIA GeForce RTX 3070
min:
46.52 fps, max:
161.6 fps
97.7 ~ 94 fps
49%
NVIDIA GeForce RTX 3050:
44.8 [X] AMD Ryzen 9 5900X 3.7GHz
NVIDIA GeForce RTX 3050
min:
24.23 fps, max:
81.11 fps
47.2 [X] PNY GeForce RTX 3050 XLR8 AMD Ryzen 9 7950X 4.5GHz
NVIDIA GeForce RTX 3050
min:
26.16 fps, max:
77.62 fps
~ 46 fps
84%
GeForce RTX 3080 Laptop GPU:
68.7 74.2 75.8 [X] Acemagic Tank03 Intel Core i9-12900H 1.8GHz
GeForce RTX 3080 Laptop GPU
min:
39.88 fps, max:
125.2 fps
85.9 [X] AMD Ryzen 9 5980HS 3GHz
GeForce RTX 3080 Laptop GPU
min:
41.99 fps, max:
132.61 fps
87.9 [X] AMD Ryzen 9 5980HS 3GHz
GeForce RTX 3080 Laptop GPU
min:
45.07 fps, max:
140.25 fps
~ 79 fps
100%
NVIDIA GeForce RTX 3070:
74.4 [X] AMD Ryzen 9 5900X 3.7GHz
NVIDIA GeForce RTX 3070
min:
38.95 fps, max:
129.85 fps
74.8 [X] AMD Ryzen 9 5900X 3.7GHz
NVIDIA GeForce RTX 3070
min:
41.41 fps, max:
120.5 fps
75.4 76.1 [X] Intel Core i7-10700 2.9GHz
NVIDIA GeForce RTX 3070
min:
40.35 fps, max:
120.19 fps
78.3 ~ 76 fps
47%
NVIDIA GeForce RTX 3050:
35.7 [X] AMD Ryzen 9 5900X 3.7GHz
NVIDIA GeForce RTX 3050
min:
20.94 fps, max:
59.28 fps
36.9 [X] PNY GeForce RTX 3050 XLR8 AMD Ryzen 9 7950X 4.5GHz
NVIDIA GeForce RTX 3050
min:
21.92 fps, max:
58.25 fps
~ 36 fps
71%
GeForce RTX 3080 Laptop GPU:
45.1 [X] AMD Ryzen 9 5980HS 3GHz
GeForce RTX 3080 Laptop GPU
min:
26.66 fps, max:
85.25 fps
53.8 57.9 59.4 [X] Acemagic Tank03 Intel Core i9-12900H 1.8GHz
GeForce RTX 3080 Laptop GPU
min:
34.09 fps, max:
95.17 fps
~ 54 fps
100%
NVIDIA GeForce RTX 3070:
48.3 48.6 [X] AMD Ryzen 9 5900X 3.7GHz
NVIDIA GeForce RTX 3070
min:
29.82 fps, max:
99.64 fps
49 [X] Intel Core i7-10700 2.9GHz
NVIDIA GeForce RTX 3070
min:
30.54 fps, max:
96.98 fps
49.1 [X] AMD Ryzen 9 5900X 3.7GHz
NVIDIA GeForce RTX 3070
min:
30.24 fps, max:
89.89 fps
49.7 ~ 49 fps
47%
NVIDIA GeForce RTX 3050:
22.4 [X] AMD Ryzen 9 5900X 3.7GHz
NVIDIA GeForce RTX 3050
min:
14.23 fps, max:
32.78 fps
22.7 [X] PNY GeForce RTX 3050 XLR8 AMD Ryzen 9 7950X 4.5GHz
NVIDIA GeForce RTX 3050
min:
14.57 fps, max:
33 fps
~ 23 fps
80%
GeForce RTX 3080 Laptop GPU:
35.4 36.8 [X] Acemagic Tank03 Intel Core i9-12900H 1.8GHz
GeForce RTX 3080 Laptop GPU
min:
23.91 fps, max:
55.65 fps
38.2 45.1 [X] AMD Ryzen 9 5980HS 3GHz
GeForce RTX 3080 Laptop GPU
min:
28.36 fps, max:
78.45 fps
~ 39 fps
100%
NVIDIA GeForce RTX 3070:
144 [X] AMD Ryzen 9 5900X 3.7GHz
NVIDIA GeForce RTX 3070
144 [X] AMD Ryzen 9 5900X 3.7GHz
NVIDIA GeForce RTX 3070
~ 144 fps
100%
NVIDIA GeForce RTX 3070:
144 [X] AMD Ryzen 9 5900X 3.7GHz
NVIDIA GeForce RTX 3070
144 [X] AMD Ryzen 9 5900X 3.7GHz
NVIDIA GeForce RTX 3070
~ 144 fps
100%
NVIDIA GeForce RTX 3070:
144 [X] AMD Ryzen 9 5900X 3.7GHz
NVIDIA GeForce RTX 3070
144 [X] AMD Ryzen 9 5900X 3.7GHz
NVIDIA GeForce RTX 3070
~ 144 fps
100%
GeForce RTX 3080 Laptop GPU:
144 [X] Gigabyte Aero 17 HDR YC Intel Core i9-10980HK 2.4GHz
GeForce RTX 3080 Laptop GPU
min:
69.8 fps, P0.1:
85.3 fps, P1:
113 fps, max:
659 fps
144 ~ 144 fps
100%
NVIDIA GeForce RTX 3070:
144 [X] AMD Ryzen 9 5900X 3.7GHz
NVIDIA GeForce RTX 3070
144 [X] AMD Ryzen 9 5900X 3.7GHz
NVIDIA GeForce RTX 3070
min:
142 fps, max:
145 fps
~ 144 fps
100%
GeForce RTX 3080 Laptop GPU:
144 [X] Gigabyte Aero 17 HDR YC Intel Core i9-10980HK 2.4GHz
GeForce RTX 3080 Laptop GPU
min:
64.5 fps, P0.1:
81.5 fps, P1:
114 fps, max:
506 fps
144 ~ 144 fps
100%
NVIDIA GeForce RTX 3070:
144 [X] AMD Ryzen 9 5900X 3.7GHz
NVIDIA GeForce RTX 3070
min:
142 fps, max:
145 fps
144 [X] AMD Ryzen 9 5900X 3.7GHz
NVIDIA GeForce RTX 3070
min:
141 fps, max:
145 fps
~ 144 fps
90%
GeForce RTX 3080 Laptop GPU:
120 138 [X] Gigabyte Aero 17 HDR YC Intel Core i9-10980HK 2.4GHz
GeForce RTX 3080 Laptop GPU
min:
70.8 fps, P0.1:
79.1 fps, P1:
108 fps, max:
609 fps
~ 129 fps
100%
NVIDIA GeForce RTX 3070:
106 [X] AMD Ryzen 9 5900X 3.7GHz
NVIDIA GeForce RTX 3070
min:
97 fps, max:
119 fps
107 [X] AMD Ryzen 9 5900X 3.7GHz
NVIDIA GeForce RTX 3070
min:
98 fps, max:
117 fps
~ 107 fps
69%
GeForce RTX 3080 Laptop GPU:
69.2 78 [X] Gigabyte Aero 17 HDR YC Intel Core i9-10980HK 2.4GHz
GeForce RTX 3080 Laptop GPU
min:
38 fps, P0.1:
61.3 fps, P1:
65.4 fps, max:
322 fps
~ 74 fps
100%
NVIDIA GeForce RTX 3070:
177.5 [X] AMD Ryzen 9 5900X 3.7GHz
NVIDIA GeForce RTX 3070
188.9 [X] AMD Ryzen 9 5900X 3.7GHz
NVIDIA GeForce RTX 3070
~ 183 fps
100%
NVIDIA GeForce RTX 3070:
144.3 [X] AMD Ryzen 9 5900X 3.7GHz
NVIDIA GeForce RTX 3070
154.3 [X] AMD Ryzen 9 5900X 3.7GHz
NVIDIA GeForce RTX 3070
~ 149 fps
100%
NVIDIA GeForce RTX 3070:
125.8 [X] AMD Ryzen 9 5900X 3.7GHz
NVIDIA GeForce RTX 3070
137.4 [X] AMD Ryzen 9 5900X 3.7GHz
NVIDIA GeForce RTX 3070
~ 132 fps
106%
GeForce RTX 3080 Laptop GPU:
131 149 [X] Gigabyte Aero 17 HDR YC Intel Core i9-10980HK 2.4GHz
GeForce RTX 3080 Laptop GPU
min:
18.3 fps, P0.1:
47.2 fps, P1:
87.4 fps, max:
283 fps
~ 140 fps
100%
NVIDIA GeForce RTX 3070:
113.6 [X] AMD Ryzen 9 5900X 3.7GHz
NVIDIA GeForce RTX 3070
125.2 [X] AMD Ryzen 9 5900X 3.7GHz
NVIDIA GeForce RTX 3070
~ 119 fps
113%
GeForce RTX 3080 Laptop GPU:
125 142 [X] Gigabyte Aero 17 HDR YC Intel Core i9-10980HK 2.4GHz
GeForce RTX 3080 Laptop GPU
min:
31.2 fps, P0.1:
49.4 fps, P1:
86.4 fps, max:
266 fps
~ 134 fps
100%
NVIDIA GeForce RTX 3070:
98.8 [X] AMD Ryzen 9 5900X 3.7GHz
NVIDIA GeForce RTX 3070
106.8 [X] AMD Ryzen 9 5900X 3.7GHz
NVIDIA GeForce RTX 3070
~ 103 fps
105%
GeForce RTX 3080 Laptop GPU:
98.3 117 [X] Gigabyte Aero 17 HDR YC Intel Core i9-10980HK 2.4GHz
GeForce RTX 3080 Laptop GPU
min:
22.7 fps, P0.1:
50.2 fps, P1:
72.8 fps, max:
248 fps
~ 108 fps
100%
NVIDIA GeForce RTX 3070:
69 [X] AMD Ryzen 9 5900X 3.7GHz
NVIDIA GeForce RTX 3070
70.9 [X] AMD Ryzen 9 5900X 3.7GHz
NVIDIA GeForce RTX 3070
~ 70 fps
96%
GeForce RTX 3080 Laptop GPU:
59.2 74.9 [X] Gigabyte Aero 17 HDR YC Intel Core i9-10980HK 2.4GHz
GeForce RTX 3080 Laptop GPU
min:
35.4 fps, P0.1:
45.2 fps, P1:
55 fps, max:
229 fps
~ 67 fps
100%
NVIDIA GeForce RTX 3070:
149 fps
90%
GeForce RTX 3080 Laptop GPU:
134 [X] Acemagic Tank03 Intel Core i9-12900H 1.8GHz
GeForce RTX 3080 Laptop GPU
min:
44 fps, max:
203 fps
fps
100%
NVIDIA GeForce RTX 3070:
125 fps
98%
GeForce RTX 3080 Laptop GPU:
122 [X] Acemagic Tank03 Intel Core i9-12900H 1.8GHz
GeForce RTX 3080 Laptop GPU
min:
43 fps, max:
196 fps
fps
100%
NVIDIA GeForce RTX 3070:
107 fps
97%
GeForce RTX 3080 Laptop GPU:
104 [X] Acemagic Tank03 Intel Core i9-12900H 1.8GHz
GeForce RTX 3080 Laptop GPU
min:
25 fps, max:
176 fps
fps
100%
NVIDIA GeForce RTX 3070:
81 fps
96%
GeForce RTX 3080 Laptop GPU:
78 [X] Acemagic Tank03 Intel Core i9-12900H 1.8GHz
GeForce RTX 3080 Laptop GPU
min:
22 fps, max:
147 fps
fps
100%
NVIDIA GeForce RTX 3070:
68 fps
87%
GeForce RTX 3080 Laptop GPU:
59 [X] Acemagic Tank03 Intel Core i9-12900H 1.8GHz
GeForce RTX 3080 Laptop GPU
min:
32 fps, max:
130 fps
fps
100%
NVIDIA GeForce RTX 3070:
48 fps
90%
GeForce RTX 3080 Laptop GPU:
43 [X] Acemagic Tank03 Intel Core i9-12900H 1.8GHz
GeForce RTX 3080 Laptop GPU
min:
27 fps, max:
87 fps
fps
GeForce RTX 3080 Laptop GPU:
219 fps
GeForce RTX 3080 Laptop GPU:
193 fps
GeForce RTX 3080 Laptop GPU:
187 fps
GeForce RTX 3080 Laptop GPU:
158 fps
GeForce RTX 3080 Laptop GPU:
130 fps
GeForce RTX 3080 Laptop GPU:
87 fps
100%
NVIDIA GeForce RTX 3070:
155 [X] AMD Ryzen 9 5900X 3.7GHz
NVIDIA GeForce RTX 3070
max:
270.2 fps
165 194.8 200 [X] AMD Ryzen 9 5900X 3.7GHz
NVIDIA GeForce RTX 3070
max:
392.9 fps
~ 179 fps
136%
NVIDIA GeForce RTX 3050:
231 [X] AMD Ryzen 9 5900X 3.7GHz
NVIDIA GeForce RTX 3050
max:
350.8 fps
255 [X] PNY GeForce RTX 3050 XLR8 AMD Ryzen 9 7950X 4.5GHz
NVIDIA GeForce RTX 3050
max:
426.1 fps
~ 243 fps
82%
GeForce RTX 3080 Laptop GPU:
89.3 [X] AMD Ryzen 9 5980HS 3GHz
GeForce RTX 3080 Laptop GPU
max:
125.9 fps
130 131 [X] AMD Ryzen 9 5980HS 3GHz
GeForce RTX 3080 Laptop GPU
max:
189.6 fps
140 140 146 152 159 162.6 170 181 ~ 146 fps
100%
NVIDIA GeForce RTX 3070:
143 [X] AMD Ryzen 9 5900X 3.7GHz
NVIDIA GeForce RTX 3070
max:
244.9 fps
161 173.8 176 [X] AMD Ryzen 9 5900X 3.7GHz
NVIDIA GeForce RTX 3070
max:
289.2 fps
~ 163 fps
65%
NVIDIA GeForce RTX 3050:
106 [X] AMD Ryzen 9 5900X 3.7GHz
NVIDIA GeForce RTX 3050
max:
177.2 fps
106.9 [X] PNY GeForce RTX 3050 XLR8 AMD Ryzen 9 7950X 4.5GHz
NVIDIA GeForce RTX 3050
max:
175.4 fps
~ 106 fps
79%
GeForce RTX 3080 Laptop GPU:
81.6 [X] AMD Ryzen 9 5980HS 3GHz
GeForce RTX 3080 Laptop GPU
max:
117.4 fps
108 116 123 125 [X] AMD Ryzen 9 5980HS 3GHz
GeForce RTX 3080 Laptop GPU
max:
180 fps
127 130 141 143.2 150 164 ~ 128 fps
100%
NVIDIA GeForce RTX 3070:
143 [X] AMD Ryzen 9 5900X 3.7GHz
NVIDIA GeForce RTX 3070
max:
248.7 fps
157 166.8 168 [X] AMD Ryzen 9 5900X 3.7GHz
NVIDIA GeForce RTX 3070
max:
275.8 fps
~ 159 fps
60%
NVIDIA GeForce RTX 3050:
94.7 [X] AMD Ryzen 9 5900X 3.7GHz
NVIDIA GeForce RTX 3050
max:
149.9 fps
96.4 [X] PNY GeForce RTX 3050 XLR8 AMD Ryzen 9 7950X 4.5GHz
NVIDIA GeForce RTX 3050
max:
153 fps
~ 96 fps
77%
GeForce RTX 3080 Laptop GPU:
79.4 [X] AMD Ryzen 9 5980HS 3GHz
GeForce RTX 3080 Laptop GPU
max:
112.9 fps
103 111 113 121 122 [X] AMD Ryzen 9 5980HS 3GHz
GeForce RTX 3080 Laptop GPU
max:
174.4 fps
124 127 131 136.7 138 160 ~ 122 fps
100%
NVIDIA GeForce RTX 3070:
138 [X] AMD Ryzen 9 5900X 3.7GHz
NVIDIA GeForce RTX 3070
max:
254.8 fps
150 157.1 160 [X] AMD Ryzen 9 5900X 3.7GHz
NVIDIA GeForce RTX 3070
max:
279.9 fps
~ 151 fps
52%
NVIDIA GeForce RTX 3050:
70.8 [X] AMD Ryzen 9 5900X 3.7GHz
NVIDIA GeForce RTX 3050
min:
33.2 fps, P0.1:
59.8 fps, P1:
61.2 fps, max:
85.4 fps
87.4 [X] PNY GeForce RTX 3050 XLR8 AMD Ryzen 9 7950X 4.5GHz
NVIDIA GeForce RTX 3050
max:
142.1 fps
~ 79 fps
77%
GeForce RTX 3080 Laptop GPU:
76.6 [X] AMD Ryzen 9 5980HS 3GHz
GeForce RTX 3080 Laptop GPU
max:
108.9 fps
100 106 106 115 116 118 119 [X] AMD Ryzen 9 5980HS 3GHz
GeForce RTX 3080 Laptop GPU
max:
172.3 fps
128 129.1 132 151 ~ 116 fps
100%
NVIDIA GeForce RTX 3070:
108 [X] AMD Ryzen 9 5900X 3.7GHz
NVIDIA GeForce RTX 3070
max:
175.7 fps
114 114.8 116 [X] AMD Ryzen 9 5900X 3.7GHz
NVIDIA GeForce RTX 3070
max:
180.1 fps
~ 113 fps
51%
NVIDIA GeForce RTX 3050:
57.8 [X] AMD Ryzen 9 5900X 3.7GHz
NVIDIA GeForce RTX 3050
max:
90 fps
58.8 [X] PNY GeForce RTX 3050 XLR8 AMD Ryzen 9 7950X 4.5GHz
NVIDIA GeForce RTX 3050
max:
90.8 fps
~ 58 fps
85%
GeForce RTX 3080 Laptop GPU:
79 89.1 93 98 102 [X] AMD Ryzen 9 5980HS 3GHz
GeForce RTX 3080 Laptop GPU
max:
163.5 fps
113 ~ 96 fps
100%
NVIDIA GeForce RTX 3070:
61 [X] AMD Ryzen 9 5900X 3.7GHz
NVIDIA GeForce RTX 3070
max:
91.5 fps
62 62.6 63.5 [X] AMD Ryzen 9 5900X 3.7GHz
NVIDIA GeForce RTX 3070
max:
95.9 fps
~ 62 fps
48%
NVIDIA GeForce RTX 3050:
29.6 [X] AMD Ryzen 9 5900X 3.7GHz
NVIDIA GeForce RTX 3050
max:
43.9 fps
30.7 [X] PNY GeForce RTX 3050 XLR8 AMD Ryzen 9 7950X 4.5GHz
NVIDIA GeForce RTX 3050
max:
45.2 fps
~ 30 fps
82%
GeForce RTX 3080 Laptop GPU:
43 48.1 55 56.3 [X] AMD Ryzen 9 5980HS 3GHz
GeForce RTX 3080 Laptop GPU
max:
84 fps
~ 51 fps
100%
NVIDIA GeForce RTX 3070:
413 [X] 1.47.22.14 D3D12
AMD Ryzen 9 5900X 3.7GHz
NVIDIA GeForce RTX 3070
min:
107 fps, P1:
293 fps, max:
701 fps
430 [X] 1.47.22.14 D3D12
Intel Core i7-10700 2.9GHz
NVIDIA GeForce RTX 3070
min:
215 fps, P1:
319 fps, max:
674 fps
439 [X] 1.47.22.14 D3D12
AMD Ryzen 9 5900X 3.7GHz
NVIDIA GeForce RTX 3070
min:
105 fps, P1:
319 fps, max:
705 fps
466 ~ 437 fps
81%
NVIDIA GeForce RTX 3050:
340 [X] 1.47.22.14 D3D12
AMD Ryzen 9 5900X 3.7GHz
NVIDIA GeForce RTX 3050
min:
60.4 fps, P1:
273 fps, max:
525 fps
364 [X] PNY GeForce RTX 3050 XLR8 1.47.22.14 D3D12
AMD Ryzen 9 7950X 4.5GHz
NVIDIA GeForce RTX 3050
min:
60.4 fps, P1:
318 fps, max:
702 fps
~ 352 fps
96%
GeForce RTX 3080 Laptop GPU:
313 318 [X] 1.47.22.14 D3D12
AMD Ryzen 9 5980HS 3GHz
GeForce RTX 3080 Laptop GPU
min:
200 fps, P1:
245 fps, max:
476 fps
332 [X] Medion Erazer Beast X25 1.47.22.14 D3D12
AMD Ryzen 9 5900HX 3.3GHz
GeForce RTX 3080 Laptop GPU
min:
76.2 fps, P1:
264 fps, max:
531 fps
337 343 [X] Lenovo Legion 7 16ACHg6 1.47.22.14 D3D12, Leistung Overclocking
AMD Ryzen 9 5900HX 3.3GHz
GeForce RTX 3080 Laptop GPU
min:
141 fps, P1:
242 fps, max:
563 fps
344 346 387 [X] Acemagic Tank03 1.47.22.14 D3D12
Intel Core i9-12900H 1.8GHz
GeForce RTX 3080 Laptop GPU
min:
154.5 fps, P1:
289 fps, max:
531 fps
388 [X] 1.47.22.14 D3D12
AMD Ryzen 9 5980HS 3GHz
GeForce RTX 3080 Laptop GPU
min:
92.1 fps, P1:
285 fps, max:
651 fps
390 [X] Alienware m17 R4 1.47.22.14 D3D12
Intel Core i9-10980HK 2.4GHz
GeForce RTX 3080 Laptop GPU
min:
101 fps, P1:
258 fps, max:
656 fps
409 [X] MSI GE76 Raider 10UH 1.47.22.14 D3D12
Intel Core i7-10870H 2.2GHz
GeForce RTX 3080 Laptop GPU
min:
164 fps, P1:
303 fps, max:
678 fps
414 [X] Lenovo Legion 7 16ACHg6 1.47.22.14 D3D12
AMD Ryzen 9 5900HX 3.3GHz
GeForce RTX 3080 Laptop GPU
min:
234 fps, P1:
314 fps, max:
670 fps
414 [X] Lenovo Legion 7 16ACHg6 1.47.22.14 D3D12, Leistung
AMD Ryzen 9 5900HX 3.3GHz
GeForce RTX 3080 Laptop GPU
min:
146 fps, P1:
314 fps, max:
675 fps
420 [X] Aorus 17G YD 1.47.22.14 D3D12
Intel Core i7-11800H 2.3GHz
GeForce RTX 3080 Laptop GPU
min:
43.3 fps, P1:
320 fps, max:
767 fps
424 437 442 [X] Gigabyte Aero 17 HDR YD 1.47.22.14 D3D12
Intel Core i9-11980HK 3.3GHz
GeForce RTX 3080 Laptop GPU
min:
37.7 fps, P1:
324 fps, max:
735 fps
446 454 [X] Aorus 15P YD 1.47.22.14 D3D12
Intel Core i7-11800H 2.3GHz
GeForce RTX 3080 Laptop GPU
min:
80.9 fps, P1:
352 fps, max:
723 fps
456 465 471 472 480 492 [X] MSI GP66 Leopard 11UH-028 1.47.22.14 D3D12
Intel Core i7-11800H 2.3GHz
GeForce RTX 3080 Laptop GPU
min:
73.7 fps, P1:
370 fps, max:
774 fps
507 521 535 ~ 420 fps
100%
NVIDIA GeForce RTX 3070:
302 [X] 1.47.22.14 D3D12
AMD Ryzen 9 5900X 3.7GHz
NVIDIA GeForce RTX 3070
min:
85.2 fps, P1:
230 fps, max:
471 fps
311 [X] 1.47.22.14 D3D12
AMD Ryzen 9 5900X 3.7GHz
NVIDIA GeForce RTX 3070
min:
113 fps, P1:
244 fps, max:
494 fps
311 [X] 1.47.22.14 D3D12
Intel Core i7-10700 2.9GHz
NVIDIA GeForce RTX 3070
min:
185 fps, P1:
256 fps, max:
437 fps
328 ~ 313 fps
50%
NVIDIA GeForce RTX 3050:
151 [X] 1.47.22.14 D3D12
AMD Ryzen 9 5900X 3.7GHz
NVIDIA GeForce RTX 3050
min:
103 fps, P1:
126 fps, max:
331 fps
160.7 [X] PNY GeForce RTX 3050 XLR8 1.47.22.14 D3D12
AMD Ryzen 9 7950X 4.5GHz
NVIDIA GeForce RTX 3050
min:
49.3 fps, P1:
139.3 fps, max:
511 fps
~ 156 fps
81%
GeForce RTX 3080 Laptop GPU:
186 196 [X] 1.47.22.14 D3D12
AMD Ryzen 9 5980HS 3GHz
GeForce RTX 3080 Laptop GPU
min:
113 fps, P1:
146 fps, max:
347 fps
199 [X] Medion Erazer Beast X25 1.47.22.14 D3D12
AMD Ryzen 9 5900HX 3.3GHz
GeForce RTX 3080 Laptop GPU
min:
88.3 fps, P1:
145 fps, max:
360 fps
205 205 212 225 [X] Aorus 17G YD 1.47.22.14 D3D12
Intel Core i7-11800H 2.3GHz
GeForce RTX 3080 Laptop GPU
min:
66.3 fps, P1:
188 fps, max:
339 fps
236 [X] Gigabyte Aero 17 HDR YD 1.47.22.14 D3D12
Intel Core i9-11980HK 3.3GHz
GeForce RTX 3080 Laptop GPU
min:
128 fps, P1:
197 fps, max:
367 fps
244 253 253 254 256 [X] Aorus 15P YD 1.47.22.14 D3D12
Intel Core i7-11800H 2.3GHz
GeForce RTX 3080 Laptop GPU
min:
67.7 fps, P1:
203 fps, max:
388 fps
260 [X] Acemagic Tank03 1.47.22.14 D3D12
Intel Core i9-12900H 1.8GHz
GeForce RTX 3080 Laptop GPU
min:
94.9 fps, P1:
215 fps, max:
421 fps
261 265 267 [X] MSI GP66 Leopard 11UH-028 1.47.22.14 D3D12
Intel Core i7-11800H 2.3GHz
GeForce RTX 3080 Laptop GPU
min:
60.3 fps, P1:
206 fps, max:
434 fps
268 269 274 [X] Lenovo Legion 7 16ACHg6 1.47.22.14 D3D12
AMD Ryzen 9 5900HX 3.3GHz
GeForce RTX 3080 Laptop GPU
min:
150 fps, P1:
166 fps, max:
501 fps
277 [X] Lenovo Legion 7 16ACHg6 1.47.22.14 D3D12, Leistung Overclocking
AMD Ryzen 9 5900HX 3.3GHz
GeForce RTX 3080 Laptop GPU
min:
156 fps, P1:
197 fps, max:
432 fps
278 287 [X] Alienware m17 R4 1.47.22.14 D3D12
Intel Core i9-10980HK 2.4GHz
GeForce RTX 3080 Laptop GPU
min:
38.6 fps, P1:
192 fps, max:
483 fps
289 292 [X] 1.47.22.14 D3D12
AMD Ryzen 9 5980HS 3GHz
GeForce RTX 3080 Laptop GPU
min:
175 fps, P1:
230 fps, max:
416 fps
293 [X] Lenovo Legion 7 16ACHg6 1.47.22.14 D3D12 Leistung
AMD Ryzen 9 5900HX 3.3GHz
GeForce RTX 3080 Laptop GPU
min:
128 fps, P1:
178 fps, max:
440 fps
305 306 [X] MSI GE76 Raider 10UH 1.47.22.14 D3D12
Intel Core i7-10870H 2.2GHz
GeForce RTX 3080 Laptop GPU
min:
32.9 fps, P1:
247 fps, max:
460 fps
~ 254 fps
100%
NVIDIA GeForce RTX 3070:
251 [X] 1.47.22.14 D3D12
AMD Ryzen 9 5900X 3.7GHz
NVIDIA GeForce RTX 3070
min:
118 fps, P1:
188 fps, max:
423 fps
253 [X] 1.47.22.14 D3D12
Intel Core i7-10700 2.9GHz
NVIDIA GeForce RTX 3070
min:
169 fps, P1:
187 fps, max:
410 fps
256 [X] 1.47.22.14 D3D12
AMD Ryzen 9 5900X 3.7GHz
NVIDIA GeForce RTX 3070
min:
139 fps, P1:
191 fps, max:
449 fps
268 ~ 257 fps
48%
NVIDIA GeForce RTX 3050:
121 [X] 1.47.22.14 D3D12
AMD Ryzen 9 5900X 3.7GHz
NVIDIA GeForce RTX 3050
min:
34.1 fps, P1:
89.1 fps, max:
178 fps
125.8 [X] PNY GeForce RTX 3050 XLR8 1.47.22.14 D3D12
AMD Ryzen 9 7950X 4.5GHz
NVIDIA GeForce RTX 3050
min:
52.9 fps, P1:
94.8 fps, max:
508 fps
~ 123 fps
82%
GeForce RTX 3080 Laptop GPU:
165 180 [X] Medion Erazer Beast X25 1.47.22.14 D3D12
AMD Ryzen 9 5900HX 3.3GHz
GeForce RTX 3080 Laptop GPU
min:
70.1 fps, P1:
121 fps, max:
349 fps
181 [X] 1.47.22.14 D3D12
AMD Ryzen 9 5980HS 3GHz
GeForce RTX 3080 Laptop GPU
min:
71.5 fps, P1:
120 fps, max:
345 fps
184 [X] Aorus 17G YD 1.47.22.14 D3D12
Intel Core i7-11800H 2.3GHz
GeForce RTX 3080 Laptop GPU
min:
68.7 fps, P1:
140 fps, max:
304 fps
185 [X] MSI GS76 Stealth 11UH 1.47.22.14 D3D12
Intel Core i9-11900H 2.5GHz
GeForce RTX 3080 Laptop GPU
min:
31.9 fps, P1:
133 fps, max:
319 fps
188 189 191 193 [X] Gigabyte Aero 17 HDR YD 1.47.22.14 D3D12
Intel Core i9-11980HK 3.3GHz
GeForce RTX 3080 Laptop GPU
min:
86.6 fps, P1:
142 fps, max:
359 fps
201 204 204 210 212 [X] Aorus 15P YD 1.47.22.14 D3D12
Intel Core i7-11800H 2.3GHz
GeForce RTX 3080 Laptop GPU
min:
72 fps, P1:
159 fps, max:
353 fps
213 [X] Acemagic Tank03 1.47.22.14 D3D12
Intel Core i9-12900H 1.8GHz
GeForce RTX 3080 Laptop GPU
min:
87.7 fps, P1:
159.3 fps, max:
356 fps
216 219 221 222 [X] Lenovo Legion 7 16ACHg6 1.47.22.14 D3D12
AMD Ryzen 9 5900HX 3.3GHz
GeForce RTX 3080 Laptop GPU
min:
141 fps, P1:
164 fps, max:
404 fps
223 223 [X] MSI GP66 Leopard 11UH-028 1.47.22.14 D3D12
Intel Core i7-11800H 2.3GHz
GeForce RTX 3080 Laptop GPU
min:
101 fps, P1:
162 fps, max:
427 fps
225 233 240 [X] 1.47.22.14 D3D12
AMD Ryzen 9 5980HS 3GHz
GeForce RTX 3080 Laptop GPU
min:
66.9 fps, P1:
179 fps, max:
379 fps
240 [X] Alienware m17 R4 1.47.22.14 D3D12
Intel Core i9-10980HK 2.4GHz
GeForce RTX 3080 Laptop GPU
min:
42.9 fps, P1:
162 fps, max:
414 fps
242 [X] Lenovo Legion 7 16ACHg6 1.47.22.14 D3D12, Leistung
AMD Ryzen 9 5900HX 3.3GHz
GeForce RTX 3080 Laptop GPU
min:
135 fps, P1:
164 fps, max:
471 fps
243 [X] Lenovo Legion 7 16ACHg6 1.47.22.14 D3D12, Leistung Overclocking
AMD Ryzen 9 5900HX 3.3GHz
GeForce RTX 3080 Laptop GPU
min:
141 fps, P1:
183 fps, max:
403 fps
247 248 [X] MSI GE76 Raider 10UH 1.47.22.14 D3D12
Intel Core i7-10870H 2.2GHz
GeForce RTX 3080 Laptop GPU
min:
22.4 fps, P1:
180 fps, max:
392 fps
~ 212 fps
100%
NVIDIA GeForce RTX 3070:
222 [X] 1.47.22.14 D3D12
AMD Ryzen 9 5900X 3.7GHz
NVIDIA GeForce RTX 3070
min:
106 fps, P1:
167 fps, max:
343 fps
222 [X] 1.47.22.14 D3D12
Intel Core i7-10700 2.9GHz
NVIDIA GeForce RTX 3070
min:
155 fps, P1:
168 fps, max:
324 fps
223 [X] 1.47.22.14 D3D12
AMD Ryzen 9 5900X 3.7GHz
NVIDIA GeForce RTX 3070
min:
74.2 fps, P1:
168 fps, max:
381 fps
233 ~ 225 fps
47%
NVIDIA GeForce RTX 3050:
104 [X] 1.47.22.14 D3D12
AMD Ryzen 9 5900X 3.7GHz
NVIDIA GeForce RTX 3050
min:
67.8 fps, P1:
78.6 fps, max:
201 fps
108.6 [X] PNY GeForce RTX 3050 XLR8 1.47.22.14 D3D12
AMD Ryzen 9 7950X 4.5GHz
NVIDIA GeForce RTX 3050
min:
34 fps, P1:
83.9 fps, max:
505 fps
~ 106 fps
82%
GeForce RTX 3080 Laptop GPU:
117 [X] SCHENKER XMG Pro 15 (Late 2021) 1.47.22.14 D3D12, Stromsparmodus
Intel Core i7-11800H 2.3GHz
GeForce RTX 3080 Laptop GPU
min:
64.7 fps, P1:
84.9 fps, max:
281 fps
151 157 [X] SCHENKER XMG Pro 15 (Late 2021) 1.47.22.14 D3D12, Lautlosmodus
Intel Core i7-11800H 2.3GHz
GeForce RTX 3080 Laptop GPU
min:
106 fps, P1:
116 fps, max:
299 fps
159 [X] Acer Nitro 5 AN517-41-R9S5 1.47.22.14 D3D12, FW-Update
AMD Ryzen 7 5800H 3.2GHz
GeForce RTX 3080 Laptop GPU
min:
50.9 fps, P1:
120 fps, max:
298 fps
163 [X] Aorus 17G YD 1.47.22.14 D3D12
Intel Core i7-11800H 2.3GHz
GeForce RTX 3080 Laptop GPU
min:
119 fps, P1:
123 fps, max:
273 fps
165 [X] MSI GS76 Stealth 11UH 1.47.22.14 D3D12
Intel Core i9-11900H 2.5GHz
GeForce RTX 3080 Laptop GPU
min:
97.3 fps, P1:
123 fps, max:
287 fps
168 [X] Medion Erazer Beast X25 1.47.22.14 D3D12
AMD Ryzen 9 5900HX 3.3GHz
GeForce RTX 3080 Laptop GPU
min:
63.8 fps, P1:
123 fps, max:
334 fps
168 [X] SCHENKER XMG Pro 15 (Late 2021) 1.47.22.14 D3D12, Unterhaltungsmodus
Intel Core i7-11800H 2.3GHz
GeForce RTX 3080 Laptop GPU
min:
61.5 fps, P1:
124 fps, max:
285 fps
169 [X] 1.47.22.14 D3D12
AMD Ryzen 9 5980HS 3GHz
GeForce RTX 3080 Laptop GPU
min:
64.2 fps, P1:
119 fps, max:
319 fps
172 [X] Gigabyte Aero 17 HDR YD 1.47.22.14 D3D12
Intel Core i9-11980HK 3.3GHz
GeForce RTX 3080 Laptop GPU
min:
86 fps, P1:
125 fps, max:
285 fps
174 174 175 176 179 182 186 186.1 [X] Acemagic Tank03 1.47.22.14 D3D12
Intel Core i9-12900H 1.8GHz
GeForce RTX 3080 Laptop GPU
min:
120.7 fps, P1:
141.6 fps, max:
394 fps
188 [X] Aorus 15P YD 1.47.22.14 D3D12
Intel Core i7-11800H 2.3GHz
GeForce RTX 3080 Laptop GPU
min:
69.8 fps, P1:
143 fps, max:
294 fps
190 195 [X] Lenovo Legion 7 16ACHg6 1.47.22.14 D3D12
AMD Ryzen 9 5900HX 3.3GHz
GeForce RTX 3080 Laptop GPU
min:
120 fps, P1:
147 fps, max:
364 fps
196 197 197 197 [X] MSI GP66 Leopard 11UH-028 1.47.22.14 D3D12
Intel Core i7-11800H 2.3GHz
GeForce RTX 3080 Laptop GPU
min:
45.8 fps, P1:
145 fps, max:
442 fps
199 204 209 [X] 1.47.22.14 D3D12
AMD Ryzen 9 5980HS 3GHz
GeForce RTX 3080 Laptop GPU
min:
69.5 fps, P1:
158 fps, max:
322 fps
212 [X] Alienware m17 R4 1.47.22.14 D3D12
Intel Core i9-10980HK 2.4GHz
GeForce RTX 3080 Laptop GPU
min:
79.6 fps, P1:
151 fps, max:
362 fps
213 [X] Lenovo Legion 7 16ACHg6 1.47.22.14 D3D12, Leistung
AMD Ryzen 9 5900HX 3.3GHz
GeForce RTX 3080 Laptop GPU
min:
127 fps, P1:
158 fps, max:
429 fps
217 [X] Lenovo Legion 7 16ACHg6 1.47.22.14 D3D12, Leistung Overclocking
AMD Ryzen 9 5900HX 3.3GHz
GeForce RTX 3080 Laptop GPU
min:
132 fps, P1:
162 fps, max:
317 fps
218 219 [X] MSI GE76 Raider 10UH 1.47.22.14 D3D12
Intel Core i7-10870H 2.2GHz
GeForce RTX 3080 Laptop GPU
min:
61.6 fps, P1:
161 fps, max:
342 fps
~ 184 fps
100%
NVIDIA GeForce RTX 3070:
165 [X] 1.47.22.14 D3D12
Intel Core i7-10700 2.9GHz
NVIDIA GeForce RTX 3070
min:
53.6 fps, P1:
133 fps, max:
285 fps
166 [X] 1.47.22.14 D3D12
AMD Ryzen 9 5900X 3.7GHz
NVIDIA GeForce RTX 3070
min:
82.9 fps, P1:
134 fps, max:
264 fps
166 [X] 1.47.22.14 D3D12
AMD Ryzen 9 5900X 3.7GHz
NVIDIA GeForce RTX 3070
min:
92.5 fps, P1:
133 fps, max:
284 fps
173.2 ~ 168 fps
46%
NVIDIA GeForce RTX 3050:
76.2 [X] 1.47.22.14 D3D12
AMD Ryzen 9 5900X 3.7GHz
NVIDIA GeForce RTX 3050
min:
54.1 fps, P1:
61 fps, max:
143 fps
79 [X] PNY GeForce RTX 3050 XLR8 1.47.22.14 D3D12
AMD Ryzen 9 7950X 4.5GHz
NVIDIA GeForce RTX 3050
min:
33.1 fps, P1:
64 fps, max:
537 fps
~ 78 fps
85%
GeForce RTX 3080 Laptop GPU:
123 [X] MSI GS76 Stealth 11UH 1.47.22.14 D3D12
Intel Core i9-11900H 2.5GHz
GeForce RTX 3080 Laptop GPU
min:
36.9 fps, P1:
94.8 fps, max:
233 fps
129 [X] Gigabyte Aero 17 HDR YD 1.47.22.14 D3D12
Intel Core i9-11980HK 3.3GHz
GeForce RTX 3080 Laptop GPU
min:
86.2 fps, P1:
98.9 fps, max:
224 fps
130 136 136.7 [X] Acemagic Tank03 1.47.22.14 D3D12
Intel Core i9-12900H 1.8GHz
GeForce RTX 3080 Laptop GPU
min:
95.7 fps, P1:
110.3 fps, max:
255 fps
138 143 144 [X] Lenovo Legion 7 16ACHg6 1.47.22.14 D3D12
AMD Ryzen 9 5900HX 3.3GHz
GeForce RTX 3080 Laptop GPU
min:
107 fps, P1:
116 fps, max:
247 fps
151 152 156 [X] 1.47.22.14 D3D12
AMD Ryzen 9 5980HS 3GHz
GeForce RTX 3080 Laptop GPU
min:
55.2 fps, P1:
124 fps, max:
243 fps
160 [X] Lenovo Legion 7 16ACHg6 1.47.22.14 D3D12, Leistung
AMD Ryzen 9 5900HX 3.3GHz
GeForce RTX 3080 Laptop GPU
min:
77.8 fps, P1:
128 fps, max:
285 fps
165 [X] Lenovo Legion 7 16ACHg6 1.47.22.14 D3D12, Leistung Overclocking
AMD Ryzen 9 5900HX 3.3GHz
GeForce RTX 3080 Laptop GPU
min:
114 fps, P1:
132 fps, max:
226 fps
~ 143 fps
100%
NVIDIA GeForce RTX 3070:
96.8 [X] 1.47.22.14 D3D12
AMD Ryzen 9 5900X 3.7GHz
NVIDIA GeForce RTX 3070
min:
66.9 fps, P1:
82.6 fps, max:
127 fps
97.1 [X] 1.47.22.14 D3D12
Intel Core i7-10700 2.9GHz
NVIDIA GeForce RTX 3070
min:
68.9 fps, P1:
83 fps, max:
165 fps
97.6 [X] 1.47.22.14 D3D12
AMD Ryzen 9 5900X 3.7GHz
NVIDIA GeForce RTX 3070
min:
53.6 fps, P1:
84.9 fps, max:
282 fps
98.7 ~ 98 fps
46%
NVIDIA GeForce RTX 3050:
44 [X] 1.47.22.14 D3D12
AMD Ryzen 9 5900X 3.7GHz
NVIDIA GeForce RTX 3050
min:
37.3 fps, P1:
37.8 fps, max:
58.3 fps
45.6 [X] PNY GeForce RTX 3050 XLR8 1.47.22.14 D3D12
AMD Ryzen 9 7950X 4.5GHz
NVIDIA GeForce RTX 3050
min:
29.3 fps, P1:
39.8 fps, max:
171.8 fps
~ 45 fps
80%
GeForce RTX 3080 Laptop GPU:
55.9 [X] SCHENKER XMG Pro 15 (Late 2021) 1.47.22.14 D3D12, Stromsparmodus
Intel Core i7-11800H 2.3GHz
GeForce RTX 3080 Laptop GPU
min:
45.8 fps, P1:
47.4 fps, max:
74.5 fps
66.4 [X] SCHENKER XMG Pro 15 (Late 2021) 1.47.22.14 D3D12, Lautlosmodus
Intel Core i7-11800H 2.3GHz
GeForce RTX 3080 Laptop GPU
min:
54.4 fps, P1:
55.7 fps, max:
129 fps
72.1 [X] MSI GS76 Stealth 11UH 1.47.22.14 D3D12
Intel Core i9-11900H 2.5GHz
GeForce RTX 3080 Laptop GPU
min:
46.2 fps, P1:
60.4 fps, max:
140 fps
73.8 [X] SCHENKER XMG Pro 15 (Late 2021) 1.47.22.14 D3D12, Unterhaltungsmodus
Intel Core i7-11800H 2.3GHz
GeForce RTX 3080 Laptop GPU
min:
60.1 fps, P1:
63.1 fps, max:
97.3 fps
76 77 [X] Gigabyte Aero 17 HDR YD 1.47.22.14 D3D12
Intel Core i9-11980HK 3.3GHz
GeForce RTX 3080 Laptop GPU
min:
63.2 fps, P1:
64.3 fps, max:
103 fps
80.5 [X] Acemagic Tank03 1.47.22.14 D3D12
Intel Core i9-12900H 1.8GHz
GeForce RTX 3080 Laptop GPU
min:
62.2 fps, P1:
68.8 fps, max:
121.2 fps
84.1 84.2 91.6 91.7 [X] 1.47.22.14 D3D12
AMD Ryzen 9 5980HS 3GHz
GeForce RTX 3080 Laptop GPU
min:
71.6 fps, P1:
78.9 fps, max:
119 fps
~ 78 fps
100%
NVIDIA GeForce RTX 3070:
150 [X] Intel Core i7-10700 2.9GHz
NVIDIA GeForce RTX 3070
min:
118 fps, max:
203 fps
159 [X] AMD Ryzen 9 5900X 3.7GHz
NVIDIA GeForce RTX 3070
min:
120 fps, max:
225 fps
179 184 [X] AMD Ryzen 9 5900X 3.7GHz
NVIDIA GeForce RTX 3070
min:
142 fps, max:
254 fps
~ 168 fps
120%
NVIDIA GeForce RTX 3050:
191 [X] AMD Ryzen 9 5900X 3.7GHz
NVIDIA GeForce RTX 3050
min:
152 fps, max:
236 fps
212 [X] PNY GeForce RTX 3050 XLR8 AMD Ryzen 9 7950X 4.5GHz
NVIDIA GeForce RTX 3050
min:
169 fps, max:
249 fps
~ 202 fps
100%
NVIDIA GeForce RTX 3070:
133 [X] Intel Core i7-10700 2.9GHz
NVIDIA GeForce RTX 3070
min:
87 fps, max:
177 fps
139 [X] AMD Ryzen 9 5900X 3.7GHz
NVIDIA GeForce RTX 3070
min:
107 fps, max:
188 fps
159 161 [X] AMD Ryzen 9 5900X 3.7GHz
NVIDIA GeForce RTX 3070
min:
128 fps, max:
217 fps
~ 148 fps
80%
NVIDIA GeForce RTX 3050:
117 [X] AMD Ryzen 9 5900X 3.7GHz
NVIDIA GeForce RTX 3050
min:
102 fps, max:
132 fps
119 [X] PNY GeForce RTX 3050 XLR8 AMD Ryzen 9 7950X 4.5GHz
NVIDIA GeForce RTX 3050
min:
107 fps, max:
138 fps
~ 118 fps
100%
NVIDIA GeForce RTX 3070:
126 [X] Intel Core i7-10700 2.9GHz
NVIDIA GeForce RTX 3070
min:
100 fps, max:
169 fps
133 [X] AMD Ryzen 9 5900X 3.7GHz
NVIDIA GeForce RTX 3070
min:
104 fps, max:
183 fps
151 154 [X] AMD Ryzen 9 5900X 3.7GHz
NVIDIA GeForce RTX 3070
min:
124 fps, max:
205 fps
~ 141 fps
76%
NVIDIA GeForce RTX 3050:
104 [X] AMD Ryzen 9 5900X 3.7GHz
NVIDIA GeForce RTX 3050
min:
93 fps, max:
120 fps
109 [X] PNY GeForce RTX 3050 XLR8 AMD Ryzen 9 7950X 4.5GHz
NVIDIA GeForce RTX 3050
min:
95 fps, max:
127 fps
~ 107 fps
100%
NVIDIA GeForce RTX 3070:
117 [X] Intel Core i7-10700 2.9GHz
NVIDIA GeForce RTX 3070
min:
89 fps, max:
155 fps
127 [X] AMD Ryzen 9 5900X 3.7GHz
NVIDIA GeForce RTX 3070
min:
90 fps, max:
177 fps
141 143 [X] AMD Ryzen 9 5900X 3.7GHz
NVIDIA GeForce RTX 3070
min:
108 fps, max:
192 fps
~ 132 fps
75%
NVIDIA GeForce RTX 3050:
96 [X] AMD Ryzen 9 5900X 3.7GHz
NVIDIA GeForce RTX 3050
min:
84 fps, max:
109 fps
101 [X] PNY GeForce RTX 3050 XLR8 AMD Ryzen 9 7950X 4.5GHz
NVIDIA GeForce RTX 3050
min:
90 fps, max:
114 fps
~ 99 fps
86%
GeForce RTX 3080 Laptop GPU:
75 [X] AMD Ryzen 9 5980HS 3GHz
GeForce RTX 3080 Laptop GPU
min:
56 fps, max:
96 fps
93 100 [X] AMD Ryzen 9 5980HS 3GHz
GeForce RTX 3080 Laptop GPU
min:
77 fps, max:
134 fps
100 [X] Acer Nitro 5 AN517-41-R9S5 FW-Update
AMD Ryzen 7 5800H 3.2GHz
GeForce RTX 3080 Laptop GPU
min:
60 fps, max:
136 fps
103 104 107 108 [X] Aorus 17G YD Intel Core i7-11800H 2.3GHz
GeForce RTX 3080 Laptop GPU
min:
79 fps, max:
136 fps
109 [X] Razer Blade 15 Advanced Model Early 2021 Max.
Intel Core i7-10875H 2.3GHz
GeForce RTX 3080 Laptop GPU
min:
86 fps, max:
137 fps
110 110 111 111 112 113 114 [X] Lenovo Legion 7 16ACHg6 Leistung
AMD Ryzen 9 5900HX 3.3GHz
GeForce RTX 3080 Laptop GPU
min:
83 fps, max:
152 fps
114 [X] Lenovo Legion 7 16ACHg6 Leistung Overclocking
AMD Ryzen 9 5900HX 3.3GHz
GeForce RTX 3080 Laptop GPU
min:
83 fps, max:
152 fps
114 115 116 117 118 120 120 120 121 [X] Alienware m17 R4 Intel Core i9-10980HK 2.4GHz
GeForce RTX 3080 Laptop GPU
min:
93 fps, max:
158 fps
121 124 125 126 [X] Acemagic Tank03 Intel Core i9-12900H 1.8GHz
GeForce RTX 3080 Laptop GPU
min:
97 fps, max:
160 fps
127 146 ~ 113 fps
100%
NVIDIA GeForce RTX 3070:
112 [X] Intel Core i7-10700 2.9GHz
NVIDIA GeForce RTX 3070
min:
86 fps, max:
138 fps
113 [X] AMD Ryzen 9 5900X 3.7GHz
NVIDIA GeForce RTX 3070
min:
89 fps, max:
132 fps
125 [X] AMD Ryzen 9 5900X 3.7GHz
NVIDIA GeForce RTX 3070
min:
105 fps, max:
145 fps
125 ~ 119 fps
57%
NVIDIA GeForce RTX 3050:
66 [X] AMD Ryzen 9 5900X 3.7GHz
NVIDIA GeForce RTX 3050
min:
59 fps, max:
77 fps
69 [X] PNY GeForce RTX 3050 XLR8 AMD Ryzen 9 7950X 4.5GHz
NVIDIA GeForce RTX 3050
min:
61 fps, max:
81 fps
~ 68 fps
86%
GeForce RTX 3080 Laptop GPU:
86 90 95 96 96 98 [X] AMD Ryzen 9 5980HS 3GHz
GeForce RTX 3080 Laptop GPU
min:
75 fps, max:
126 fps
98 101 103 104 [X] Acemagic Tank03 Intel Core i9-12900H 1.8GHz
GeForce RTX 3080 Laptop GPU
min:
94 fps, max:
123 fps
106 107 110 111 [X] Lenovo Legion 7 16ACHg6 Leistung
AMD Ryzen 9 5900HX 3.3GHz
GeForce RTX 3080 Laptop GPU
min:
83 fps, max:
136 fps
111 [X] Lenovo Legion 7 16ACHg6 Leistung Overclocking
AMD Ryzen 9 5900HX 3.3GHz
GeForce RTX 3080 Laptop GPU
min:
83 fps, max:
136 fps
112 ~ 102 fps
100%
NVIDIA GeForce RTX 3070:
69 [X] AMD Ryzen 9 5900X 3.7GHz
NVIDIA GeForce RTX 3070
min:
61 fps, max:
81 fps
70 [X] AMD Ryzen 9 5900X 3.7GHz
NVIDIA GeForce RTX 3070
min:
63 fps, max:
84 fps
70 [X] Intel Core i7-10700 2.9GHz
NVIDIA GeForce RTX 3070
min:
62 fps, max:
85 fps
72 ~ 70 fps
50%
NVIDIA GeForce RTX 3050:
34 [X] AMD Ryzen 9 5900X 3.7GHz
NVIDIA GeForce RTX 3050
min:
30 fps, max:
41 fps
35 [X] PNY GeForce RTX 3050 XLR8 AMD Ryzen 9 7950X 4.5GHz
NVIDIA GeForce RTX 3050
min:
31 fps, max:
43 fps
~ 35 fps
81%
GeForce RTX 3080 Laptop GPU:
52 54 54 54 [X] Acemagic Tank03 Intel Core i9-12900H 1.8GHz
GeForce RTX 3080 Laptop GPU
min:
49 fps, max:
67 fps
56 59 62 [X] AMD Ryzen 9 5980HS 3GHz
GeForce RTX 3080 Laptop GPU
min:
52 fps, max:
76 fps
63 ~ 57 fps
100%
NVIDIA GeForce RTX 3070:
59.7 121 [X] Cooler Master MasterCase EG200 RTX 3070 Aorus 15G Intel Core i7-10875H 2.3GHz
NVIDIA GeForce RTX 3070
124 [X] Intel Core i7-10700 2.9GHz
NVIDIA GeForce RTX 3070
141 [X] AMD Ryzen 9 5900X 3.7GHz
NVIDIA GeForce RTX 3070
143 [X] AMD Ryzen 9 5900X 3.7GHz
NVIDIA GeForce RTX 3070
150.6 ~ 123 fps
154%
NVIDIA GeForce RTX 3050:
160 [X] AMD Ryzen 9 5900X 3.7GHz
NVIDIA GeForce RTX 3050
218 [X] PNY GeForce RTX 3050 XLR8 AMD Ryzen 9 7950X 4.5GHz
NVIDIA GeForce RTX 3050
~ 189 fps
95%
GeForce RTX 3080 Laptop GPU:
93.7 [X] AMD Ryzen 9 5980HS 3GHz
GeForce RTX 3080 Laptop GPU
95.8 [X] SCHENKER XMG Pro 15 (Late 2021) Lautlosmodus
Intel Core i7-11800H 2.3GHz
GeForce RTX 3080 Laptop GPU
96 [X] Lenovo Legion 7 16ACHg6 Leistung Overclocking
AMD Ryzen 9 5900HX 3.3GHz
GeForce RTX 3080 Laptop GPU
98.1 98.4 [X] AMD Ryzen 9 5980HS 3GHz
GeForce RTX 3080 Laptop GPU
99.5 [X] Acer Nitro 5 AN517-41-R9S5 FW-Update
AMD Ryzen 7 5800H 3.2GHz
GeForce RTX 3080 Laptop GPU
101 103 103 104 105 106 107 108 [X] SCHENKER XMG Pro 15 (Late 2021) Stromsparmodus
Intel Core i7-11800H 2.3GHz
GeForce RTX 3080 Laptop GPU
111 111 [X] Lenovo Legion 7 16ACHg6 Leistung
AMD Ryzen 9 5900HX 3.3GHz
GeForce RTX 3080 Laptop GPU
112 [X] Razer Blade 15 Advanced Model Early 2021 Max.
Intel Core i7-10875H 2.3GHz
GeForce RTX 3080 Laptop GPU
112 113.2 115 116 117 118 118 118 121 122 123 125 125 [X] Aorus 17G YD Turbo Mode
Intel Core i7-11800H 2.3GHz
GeForce RTX 3080 Laptop GPU
125 126 126 127 127 [X] SCHENKER XMG Pro 15 (Late 2021) Unterhaltungsmodus
Intel Core i7-11800H 2.3GHz
GeForce RTX 3080 Laptop GPU
128 129 132 133 135.2 138 142 146.1 156 ~ 117 fps
100%
NVIDIA GeForce RTX 3070:
55.4 106 [X] Cooler Master MasterCase EG200 RTX 3070 Aorus 15G Intel Core i7-10875H 2.3GHz
NVIDIA GeForce RTX 3070
110 [X] Intel Core i7-10700 2.9GHz
NVIDIA GeForce RTX 3070
117 [X] AMD Ryzen 9 5900X 3.7GHz
NVIDIA GeForce RTX 3070
123 [X] AMD Ryzen 9 5900X 3.7GHz
NVIDIA GeForce RTX 3070
137.4 ~ 108 fps
153%
NVIDIA GeForce RTX 3050:
137 [X] AMD Ryzen 9 5900X 3.7GHz
NVIDIA GeForce RTX 3050
192.7 [X] PNY GeForce RTX 3050 XLR8 AMD Ryzen 9 7950X 4.5GHz
NVIDIA GeForce RTX 3050
~ 165 fps
95%
GeForce RTX 3080 Laptop GPU:
80.6 [X] SCHENKER XMG Pro 15 (Late 2021) Lautlosmodus
Intel Core i7-11800H 2.3GHz
GeForce RTX 3080 Laptop GPU
81.1 [X] AMD Ryzen 9 5980HS 3GHz
GeForce RTX 3080 Laptop GPU
85.4 [X] AMD Ryzen 9 5980HS 3GHz
GeForce RTX 3080 Laptop GPU
85.8 87.4 88 88.3 [X] Acer Nitro 5 AN517-41-R9S5 FW-Update
AMD Ryzen 7 5800H 3.2GHz
GeForce RTX 3080 Laptop GPU
90.4 90.8 91.9 92.3 92.6 92.9 [X] SCHENKER XMG Pro 15 (Late 2021) Stromsparmodus
Intel Core i7-11800H 2.3GHz
GeForce RTX 3080 Laptop GPU
93 98.2 99 [X] Razer Blade 15 Advanced Model Early 2021 Max.
Intel Core i7-10875H 2.3GHz
GeForce RTX 3080 Laptop GPU
99.3 99.4 [X] Lenovo Legion 7 16ACHg6 Leistung
AMD Ryzen 9 5900HX 3.3GHz
GeForce RTX 3080 Laptop GPU
100 101 102 103 104 104 104 [X] Aorus 17G YD Turbo Mode
Intel Core i7-11800H 2.3GHz
GeForce RTX 3080 Laptop GPU
104 105 106 107 109 109 109 [X] SCHENKER XMG Pro 15 (Late 2021) Unterhaltungsmodus
Intel Core i7-11800H 2.3GHz
GeForce RTX 3080 Laptop GPU
110 110 110 113 114 117.6 118 123 128.9 132 139 ~ 103 fps
100%
NVIDIA GeForce RTX 3070:
53.7 88 [X] Cooler Master MasterCase EG200 RTX 3070 Aorus 15G Intel Core i7-10875H 2.3GHz
NVIDIA GeForce RTX 3070
91 [X] Intel Core i7-10700 2.9GHz
NVIDIA GeForce RTX 3070
95.4 [X] AMD Ryzen 9 5900X 3.7GHz
NVIDIA GeForce RTX 3070
95.4 [X] AMD Ryzen 9 5900X 3.7GHz
NVIDIA GeForce RTX 3070
111.3 ~ 89 fps
146%
NVIDIA GeForce RTX 3050:
110 [X] AMD Ryzen 9 5900X 3.7GHz
NVIDIA GeForce RTX 3050
149.2 [X] PNY GeForce RTX 3050 XLR8 AMD Ryzen 9 7950X 4.5GHz
NVIDIA GeForce RTX 3050
~ 130 fps
93%
GeForce RTX 3080 Laptop GPU:
65.6 [X] AMD Ryzen 9 5980HS 3GHz
GeForce RTX 3080 Laptop GPU
68.1 [X] SCHENKER XMG Pro 15 (Late 2021) Lautlosmodus
Intel Core i7-11800H 2.3GHz
GeForce RTX 3080 Laptop GPU
69 [X] AMD Ryzen 9 5980HS 3GHz
GeForce RTX 3080 Laptop GPU
72 72.1 72.4 72.7 [X] Acer Nitro 5 AN517-41-R9S5 FW-Update
AMD Ryzen 7 5800H 3.2GHz
GeForce RTX 3080 Laptop GPU
74 75.5 [X] SCHENKER XMG Pro 15 (Late 2021) Stromsparmodus
Intel Core i7-11800H 2.3GHz
GeForce RTX 3080 Laptop GPU
75.9 76 76.9 77 79.7 80 80.7 [X] Lenovo Legion 7 16ACHg6 Leistung
AMD Ryzen 9 5900HX 3.3GHz
GeForce RTX 3080 Laptop GPU
82.1 82.3 82.3 [X] Razer Blade 15 Advanced Model Early 2021 Max.
Intel Core i7-10875H 2.3GHz
GeForce RTX 3080 Laptop GPU
82.3 82.8 82.9 83.3 [X] Aorus 17G YD Turbo Mode
Intel Core i7-11800H 2.3GHz
GeForce RTX 3080 Laptop GPU
83.8 84.2 84.4 84.7 85.7 85.7 87.9 88 88.1 [X] SCHENKER XMG Pro 15 (Late 2021) Unterhaltungsmodus
Intel Core i7-11800H 2.3GHz
GeForce RTX 3080 Laptop GPU
88.5 88.8 88.9 89.2 89.3 92.3 96.7 97.3 102 102.3 113 ~ 83 fps
100%
NVIDIA GeForce RTX 3070:
78.8 [X] Intel Core i7-10700 2.9GHz
NVIDIA GeForce RTX 3070
81.1 [X] AMD Ryzen 9 5900X 3.7GHz
NVIDIA GeForce RTX 3070
84.3 [X] AMD Ryzen 9 5900X 3.7GHz
NVIDIA GeForce RTX 3070
98.4 ~ 86 fps
120%
NVIDIA GeForce RTX 3050:
91.6 [X] AMD Ryzen 9 5900X 3.7GHz
NVIDIA GeForce RTX 3050
113.9 [X] PNY GeForce RTX 3050 XLR8 AMD Ryzen 9 7950X 4.5GHz
NVIDIA GeForce RTX 3050
~ 103 fps
76%
GeForce RTX 3080 Laptop GPU:
39.9 51.4 [X] SCHENKER XMG Pro 15 (Late 2021) Lautlosmodus
Intel Core i7-11800H 2.3GHz
GeForce RTX 3080 Laptop GPU
56.9 60.2 [X] SCHENKER XMG Pro 15 (Late 2021) Stromsparmodus
Intel Core i7-11800H 2.3GHz
GeForce RTX 3080 Laptop GPU
60.9 61.3 [X] AMD Ryzen 9 5980HS 3GHz
GeForce RTX 3080 Laptop GPU
62.2 63.2 63.5 64 [X] SCHENKER XMG Pro 15 (Late 2021) Unterhaltungsmodus
Intel Core i7-11800H 2.3GHz
GeForce RTX 3080 Laptop GPU
67.9 67.9 72.1 79 83.1 88 ~ 65 fps
100%
NVIDIA GeForce RTX 3070:
167 [X] 1.3
Intel Core i7-10700 2.9GHz
NVIDIA GeForce RTX 3070
190 [X] 1.3
AMD Ryzen 9 5900X 3.7GHz
NVIDIA GeForce RTX 3070
195.8 209 [X] 1.3
AMD Ryzen 9 5900X 3.7GHz
NVIDIA GeForce RTX 3070
~ 190 fps
90%
NVIDIA GeForce RTX 3050:
167 [X] 1.3
AMD Ryzen 9 5900X 3.7GHz
NVIDIA GeForce RTX 3050
174.1 [X] PNY GeForce RTX 3050 XLR8 1.3
AMD Ryzen 9 7950X 4.5GHz
NVIDIA GeForce RTX 3050
~ 171 fps
100%
NVIDIA GeForce RTX 3070:
146 [X] 1.3
Intel Core i7-10700 2.9GHz
NVIDIA GeForce RTX 3070
148 [X] 1.3
AMD Ryzen 9 5900X 3.7GHz
NVIDIA GeForce RTX 3070
159 [X] 1.3
AMD Ryzen 9 5900X 3.7GHz
NVIDIA GeForce RTX 3070
172.3 ~ 156 fps
58%
NVIDIA GeForce RTX 3050:
91 [X] 1.3
AMD Ryzen 9 5900X 3.7GHz
NVIDIA GeForce RTX 3050
91.8 [X] PNY GeForce RTX 3050 XLR8 1.3
AMD Ryzen 9 7950X 4.5GHz
NVIDIA GeForce RTX 3050
~ 91 fps
100%
NVIDIA GeForce RTX 3070:
112 [X] 1.3
Intel Core i7-10700 2.9GHz
NVIDIA GeForce RTX 3070
115 [X] 1.3
AMD Ryzen 9 5900X 3.7GHz
NVIDIA GeForce RTX 3070
122 [X] 1.3
AMD Ryzen 9 5900X 3.7GHz
NVIDIA GeForce RTX 3070
129.7 ~ 120 fps
56%
NVIDIA GeForce RTX 3050:
66.5 [X] PNY GeForce RTX 3050 XLR8 1.3
AMD Ryzen 9 7950X 4.5GHz
NVIDIA GeForce RTX 3050
67.3 [X] 1.3
AMD Ryzen 9 5900X 3.7GHz
NVIDIA GeForce RTX 3050
~ 67 fps
83%
GeForce RTX 3080 Laptop GPU:
55.5 [X] SCHENKER XMG Pro 15 (Late 2021) 1.3, Lautlosmodus
Intel Core i7-11800H 2.3GHz
GeForce RTX 3080 Laptop GPU
63.6 [X] SCHENKER XMG Pro 15 (Late 2021) 1.3, Stromsparmodus
Intel Core i7-11800H 2.3GHz
GeForce RTX 3080 Laptop GPU
78.2 85.4 88 93.1 [X] SCHENKER XMG Pro 15 (Late 2021) 1.3, Unterhaltungsmodus
Intel Core i7-11800H 2.3GHz
GeForce RTX 3080 Laptop GPU
93.4 [X] Acer Nitro 5 AN517-41-R9S5 1.3, FW-Update
AMD Ryzen 7 5800H 3.2GHz
GeForce RTX 3080 Laptop GPU
93.8 [X] Aorus 17G YD 1.3
Intel Core i7-11800H 2.3GHz
GeForce RTX 3080 Laptop GPU
94.2 97 97.1 97.2 97.5 98.2 98.5 [X] Aorus 17G YD 1.3, Turbo Mode
Intel Core i7-11800H 2.3GHz
GeForce RTX 3080 Laptop GPU
99 105 105 [X] 1.3
AMD Ryzen 9 5980HS 3GHz
GeForce RTX 3080 Laptop GPU
105 105 105.4 106 106 106 [X] Aorus 15P YD 1.3
Intel Core i7-11800H 2.3GHz
GeForce RTX 3080 Laptop GPU
106 107.1 108 108 109 111 [X] 1.3
AMD Ryzen 9 5980HS 3GHz
GeForce RTX 3080 Laptop GPU
113 [X] Lenovo Legion 7 16ACHg6 1.3, Leistung
AMD Ryzen 9 5900HX 3.3GHz
GeForce RTX 3080 Laptop GPU
115 115 [X] Lenovo Legion 7 16ACHg6 1.3, Leistung Overclocking
AMD Ryzen 9 5900HX 3.3GHz
GeForce RTX 3080 Laptop GPU
~ 99 fps
100%
NVIDIA GeForce RTX 3070:
89.2 [X] 1.3
Intel Core i7-10700 2.9GHz
NVIDIA GeForce RTX 3070
93.9 [X] 1.3
AMD Ryzen 9 5900X 3.7GHz
NVIDIA GeForce RTX 3070
94.1 [X] 1.3
AMD Ryzen 9 5900X 3.7GHz
NVIDIA GeForce RTX 3070
99.3 ~ 94 fps
52%
NVIDIA GeForce RTX 3050:
48.6 [X] 1.3
AMD Ryzen 9 5900X 3.7GHz
NVIDIA GeForce RTX 3050
48.9 [X] PNY GeForce RTX 3050 XLR8 1.3
AMD Ryzen 9 7950X 4.5GHz
NVIDIA GeForce RTX 3050
~ 49 fps
84%
GeForce RTX 3080 Laptop GPU:
61.6 71.2 73.1 74.6 75.9 77.4 78.2 79.7 80.6 81 81.3 81.8 83.5 84.3 87.4 [X] 1.3
AMD Ryzen 9 5980HS 3GHz
GeForce RTX 3080 Laptop GPU
88.3 [X] Lenovo Legion 7 16ACHg6 1.3, Leistung
AMD Ryzen 9 5900HX 3.3GHz
GeForce RTX 3080 Laptop GPU
90.3 [X] Lenovo Legion 7 16ACHg6 1.3, Leistung Overclocking
AMD Ryzen 9 5900HX 3.3GHz
GeForce RTX 3080 Laptop GPU
~ 79 fps
100%
NVIDIA GeForce RTX 3070:
54.8 [X] 1.3
Intel Core i7-10700 2.9GHz
NVIDIA GeForce RTX 3070
56.9 [X] 1.3
AMD Ryzen 9 5900X 3.7GHz
NVIDIA GeForce RTX 3070
57.6 [X] 1.3
AMD Ryzen 9 5900X 3.7GHz
NVIDIA GeForce RTX 3070
58.2 ~ 57 fps
49%
NVIDIA GeForce RTX 3050:
28.2 [X] 1.3
AMD Ryzen 9 5900X 3.7GHz
NVIDIA GeForce RTX 3050
28.2 [X] PNY GeForce RTX 3050 XLR8 1.3
AMD Ryzen 9 7950X 4.5GHz
NVIDIA GeForce RTX 3050
~ 28 fps
75%
GeForce RTX 3080 Laptop GPU:
28.4 [X] SCHENKER XMG Pro 15 (Late 2021) 1.3, Lautlosmodus
Intel Core i7-11800H 2.3GHz
GeForce RTX 3080 Laptop GPU
29.2 [X] SCHENKER XMG Pro 15 (Late 2021) 1.3, Stromsparmodus
Intel Core i7-11800H 2.3GHz
GeForce RTX 3080 Laptop GPU
37.5 42.2 [X] SCHENKER XMG Pro 15 (Late 2021) 1.3, Unterhaltungsmodus
Intel Core i7-11800H 2.3GHz
GeForce RTX 3080 Laptop GPU
42.9 43.6 44.1 44.7 45 45 45.4 49.3 49.5 50.8 53.2 [X] 1.3
AMD Ryzen 9 5980HS 3GHz
GeForce RTX 3080 Laptop GPU
~ 43 fps
GeForce RTX 3080 Laptop GPU:
149 fps
GeForce RTX 3080 Laptop GPU:
126 fps
GeForce RTX 3080 Laptop GPU:
118 fps
GeForce RTX 3080 Laptop GPU:
102 fps
GeForce RTX 3080 Laptop GPU:
82 fps
GeForce RTX 3080 Laptop GPU:
52 fps
100%
NVIDIA GeForce RTX 3070:
135.5 171 [X] Cooler Master MasterCase EG200 RTX 3070 Aorus 15G Intel Core i7-10875H 2.3GHz
NVIDIA GeForce RTX 3070
~ 153 fps
100%
NVIDIA GeForce RTX 3070:
135 160 [X] Cooler Master MasterCase EG200 RTX 3070 Aorus 15G Intel Core i7-10875H 2.3GHz
NVIDIA GeForce RTX 3070
~ 148 fps
100%
NVIDIA GeForce RTX 3070:
118 155 [X] Cooler Master MasterCase EG200 RTX 3070 Aorus 15G Intel Core i7-10875H 2.3GHz
NVIDIA GeForce RTX 3070
~ 137 fps
100%
NVIDIA GeForce RTX 3070:
117 153 [X] Cooler Master MasterCase EG200 RTX 3070 Aorus 15G Intel Core i7-10875H 2.3GHz
NVIDIA GeForce RTX 3070
~ 135 fps
100%
NVIDIA GeForce RTX 3070:
226 [X] AMD Ryzen 9 5900X 3.7GHz
NVIDIA GeForce RTX 3070
min:
207 fps, max:
236 fps
336 [X] AMD Ryzen 9 5900X 3.7GHz
NVIDIA GeForce RTX 3070
min:
320 fps, max:
354 fps
376 ~ 313 fps
69%
NVIDIA GeForce RTX 3050:
215 [X] AMD Ryzen 9 5900X 3.7GHz
NVIDIA GeForce RTX 3050
min:
60 fps, P0.1:
165 fps, P1:
177 fps, max:
323 fps
fps
91%
GeForce RTX 3080 Laptop GPU:
283.7 fps
100%
NVIDIA GeForce RTX 3070:
159 [X] AMD Ryzen 9 5900X 3.7GHz
NVIDIA GeForce RTX 3070
min:
150 fps, max:
168 fps
252 [X] AMD Ryzen 9 5900X 3.7GHz
NVIDIA GeForce RTX 3070
min:
238 fps, max:
270 fps
266 ~ 226 fps
61%
NVIDIA GeForce RTX 3050:
138 [X] AMD Ryzen 9 5900X 3.7GHz
NVIDIA GeForce RTX 3050
min:
46.2 fps, P0.1:
102 fps, P1:
116 fps, max:
203 fps
fps
93%
GeForce RTX 3080 Laptop GPU:
210 fps
100%
NVIDIA GeForce RTX 3070:
156 [X] AMD Ryzen 9 5900X 3.7GHz
NVIDIA GeForce RTX 3070
min:
147 fps, max:
166 fps
182.9 197 [X] AMD Ryzen 9 5900X 3.7GHz
NVIDIA GeForce RTX 3070
min:
184 fps, max:
213 fps
~ 179 fps
47%
NVIDIA GeForce RTX 3050:
84.7 [X] AMD Ryzen 9 5900X 3.7GHz
NVIDIA GeForce RTX 3050
min:
31.6 fps, P0.1:
72.3 fps, P1:
75 fps, max:
104 fps
fps
88%
GeForce RTX 3080 Laptop GPU:
157.2 fps
100%
NVIDIA GeForce RTX 3070:
151 [X] AMD Ryzen 9 5900X 3.7GHz
NVIDIA GeForce RTX 3070
min:
131 fps, max:
163 fps
153.7 169 [X] AMD Ryzen 9 5900X 3.7GHz
NVIDIA GeForce RTX 3070
min:
153 fps, max:
188 fps
~ 158 fps
88%
GeForce RTX 3080 Laptop GPU:
139.5 fps
100%
NVIDIA GeForce RTX 3070:
76.7 80.9 [X] AMD Ryzen 9 5900X 3.7GHz
NVIDIA GeForce RTX 3070
min:
74 fps, max:
90 fps
83.8 [X] AMD Ryzen 9 5900X 3.7GHz
NVIDIA GeForce RTX 3070
min:
75 fps, max:
93 fps
~ 80 fps
44%
NVIDIA GeForce RTX 3050:
35 [X] AMD Ryzen 9 5900X 3.7GHz
NVIDIA GeForce RTX 3050
min:
29.2 fps, P0.1:
30.5 fps, P1:
31.5 fps, max:
41.9 fps
fps
100%
NVIDIA GeForce RTX 3070:
107.8 146.5 150.5 [X] Cooler Master MasterCase EG200 RTX 3070 Aorus 15G Intel Core i7-10875H 2.3GHz
NVIDIA GeForce RTX 3070
min:
130.2 fps, max:
-1 fps
162.9 [X] AMD Ryzen 9 5900X 3.7GHz
NVIDIA GeForce RTX 3070
min:
134.5 fps, max:
-1 fps
164.2 [X] Intel Core i7-10700 2.9GHz
NVIDIA GeForce RTX 3070
min:
143.5 fps, max:
-1 fps
171 [X] AMD Ryzen 9 5900X 3.7GHz
NVIDIA GeForce RTX 3070
min:
140 fps, max:
-1 fps
~ 150 fps
171%
NVIDIA GeForce RTX 3050:
203.9 [X] AMD Ryzen 9 5900X 3.7GHz
NVIDIA GeForce RTX 3050
min:
169.2 fps, max:
-1 fps
308.6 [X] PNY GeForce RTX 3050 XLR8 AMD Ryzen 9 7950X 4.5GHz
NVIDIA GeForce RTX 3050
min:
258.7 fps, max:
-1 fps
~ 256 fps
106%
GeForce RTX 3080 Laptop GPU:
132.7 [X] AMD Ryzen 9 5980HS 3GHz
GeForce RTX 3080 Laptop GPU
min:
118.4 fps, max:
-1 fps
133.3 [X] AMD Ryzen 9 5980HS 3GHz
GeForce RTX 3080 Laptop GPU
min:
119.4 fps, max:
-1 fps
133.5 138 [X] Acer Nitro 5 AN517-41-R9S5 FW-Update
AMD Ryzen 7 5800H 3.2GHz
GeForce RTX 3080 Laptop GPU
min:
118 fps, max:
-1 fps
141 [X] Razer Blade 15 Advanced Model Early 2021 Max.
Intel Core i7-10875H 2.3GHz
GeForce RTX 3080 Laptop GPU
min:
124.1 fps, max:
-1 fps
144 144 144 144 [X] SCHENKER XMG Pro 15 (Late 2021) Lautlosmodus
Intel Core i7-11800H 2.3GHz
GeForce RTX 3080 Laptop GPU
min:
117.9 fps, max:
-1 fps
147 147 148 148 150 150 152 153 153 157 [X] Lenovo Legion 7 16ACHg6 Leistung
AMD Ryzen 9 5900HX 3.3GHz
GeForce RTX 3080 Laptop GPU
min:
138.4 fps, max:
-1 fps
157 [X] Lenovo Legion 7 16ACHg6 Leistung Overclocking
AMD Ryzen 9 5900HX 3.3GHz
GeForce RTX 3080 Laptop GPU
min:
128.2 fps, max:
-1 fps
158 159 [X] SCHENKER XMG Pro 15 (Late 2021) Unterhaltungsmodus
Intel Core i7-11800H 2.3GHz
GeForce RTX 3080 Laptop GPU
min:
137.3 fps, max:
-1 fps
160 [X] Aorus 17G YD Turbo Mode
Intel Core i7-11800H 2.3GHz
GeForce RTX 3080 Laptop GPU
min:
136.3 fps, max:
-1 fps
162 [X] SCHENKER XMG Pro 15 (Late 2021) Stromsparmodus
Intel Core i7-11800H 2.3GHz
GeForce RTX 3080 Laptop GPU
min:
127.3 fps, max:
-1 fps
164 [X] Alienware m17 R4 Intel Core i9-10980HK 2.4GHz
GeForce RTX 3080 Laptop GPU
min:
142.7 fps, max:
-1 fps
164 [X] Aorus 17G YD Intel Core i7-11800H 2.3GHz
GeForce RTX 3080 Laptop GPU
min:
144.5 fps, max:
-1 fps
164 164 164 166 [X] Acemagic Tank03 Intel Core i9-12900H 1.8GHz
GeForce RTX 3080 Laptop GPU
min:
145.7 fps, max:
-1 fps
167 [X] Aorus 15P YD Intel Core i7-11800H 2.3GHz
GeForce RTX 3080 Laptop GPU
min:
145.8 fps, max:
-1 fps
168 168 171.3 [X] Acemagic Tank03 Intel Core i9-12900H 1.8GHz
GeForce RTX 3080 Laptop GPU
min:
150.9 fps, max:
-1 fps
171.4 [X] Acemagic Tank03 Intel Core i9-12900H 1.8GHz
GeForce RTX 3080 Laptop GPU
min:
150.8 fps, max:
-1 fps
172.8 173 174 175 176 178 179 182 183 ~ 159 fps
100%
NVIDIA GeForce RTX 3070:
99.2 125.3 [X] Cooler Master MasterCase EG200 RTX 3070 Aorus 15G Intel Core i7-10875H 2.3GHz
NVIDIA GeForce RTX 3070
min:
100 fps, max:
-1 fps
133.9 140.5 [X] AMD Ryzen 9 5900X 3.7GHz
NVIDIA GeForce RTX 3070
min:
115 fps, max:
-1 fps
143.8 [X] Intel Core i7-10700 2.9GHz
NVIDIA GeForce RTX 3070
min:
126.6 fps, max:
-1 fps
157 [X] AMD Ryzen 9 5900X 3.7GHz
NVIDIA GeForce RTX 3070
min:
124.8 fps, max:
-1 fps
~ 133 fps
168%
NVIDIA GeForce RTX 3050:
177.4 [X] AMD Ryzen 9 5900X 3.7GHz
NVIDIA GeForce RTX 3050
min:
147.6 fps, max:
-1 fps
268.7 [X] PNY GeForce RTX 3050 XLR8 AMD Ryzen 9 7950X 4.5GHz
NVIDIA GeForce RTX 3050
min:
230.8 fps, max:
-1 fps
~ 223 fps
106%
GeForce RTX 3080 Laptop GPU:
82.7 111 119 [X] SCHENKER XMG Pro 15 (Late 2021) Lautlosmodus
Intel Core i7-11800H 2.3GHz
GeForce RTX 3080 Laptop GPU
min:
99.5 fps, max:
-1 fps
122.2 [X] AMD Ryzen 9 5980HS 3GHz
GeForce RTX 3080 Laptop GPU
min:
107.8 fps, max:
-1 fps
124.4 [X] Acemagic Tank03 Intel Core i9-12900H 1.8GHz
GeForce RTX 3080 Laptop GPU
min:
108.7 fps, max:
-1 fps
129 [X] AMD Ryzen 9 5980HS 3GHz
GeForce RTX 3080 Laptop GPU
min:
114.5 fps, max:
-1 fps
129 [X] Acer Nitro 5 AN517-41-R9S5 FW-Update
AMD Ryzen 7 5800H 3.2GHz
GeForce RTX 3080 Laptop GPU
min:
110.9 fps, max:
-1 fps
132 133 133 [X] SCHENKER XMG Pro 15 (Late 2021) Stromsparmodus
Intel Core i7-11800H 2.3GHz
GeForce RTX 3080 Laptop GPU
min:
113.1 fps, max:
-1 fps
134 [X] Razer Blade 15 Advanced Model Early 2021 Max.
Intel Core i7-10875H 2.3GHz
GeForce RTX 3080 Laptop GPU
min:
114.5 fps, max:
-1 fps
136 137 137 137 137 139 139 140 140 [X] SCHENKER XMG Pro 15 (Late 2021) Unterhaltungsmodus
Intel Core i7-11800H 2.3GHz
GeForce RTX 3080 Laptop GPU
min:
114.7 fps, max:
-1 fps
141 143 [X] Lenovo Legion 7 16ACHg6 Leistung
AMD Ryzen 9 5900HX 3.3GHz
GeForce RTX 3080 Laptop GPU
min:
126.5 fps, max:
-1 fps
144 [X] Aorus 17G YD Turbo Mode
Intel Core i7-11800H 2.3GHz
GeForce RTX 3080 Laptop GPU
min:
124.6 fps, max:
-1 fps
145 [X] Alienware m17 R4 Intel Core i9-10980HK 2.4GHz
GeForce RTX 3080 Laptop GPU
min:
127.3 fps, max:
-1 fps
145 146 146 [X] Aorus 17G YD Intel Core i7-11800H 2.3GHz
GeForce RTX 3080 Laptop GPU
min:
129 fps, max:
-1 fps
146 147 147 [X] Lenovo Legion 7 16ACHg6 Leistung Overclocking
AMD Ryzen 9 5900HX 3.3GHz
GeForce RTX 3080 Laptop GPU
min:
126.7 fps, max:
-1 fps
148 151 [X] Aorus 15P YD Intel Core i7-11800H 2.3GHz
GeForce RTX 3080 Laptop GPU
min:
132.1 fps, max:
-1 fps
151 151 151 152.6 [X] Acemagic Tank03 Intel Core i9-12900H 1.8GHz
GeForce RTX 3080 Laptop GPU
min:
133.3 fps, max:
-1 fps
153.3 [X] Acemagic Tank03 Intel Core i9-12900H 1.8GHz
GeForce RTX 3080 Laptop GPU
min:
135.1 fps, max:
-1 fps
155 156.1 157 157 159 165 170 ~ 141 fps
100%
NVIDIA GeForce RTX 3070:
96.1 116.8 [X] Cooler Master MasterCase EG200 RTX 3070 Aorus 15G Intel Core i7-10875H 2.3GHz
NVIDIA GeForce RTX 3070
min:
95.9 fps, max:
-1 fps
129.3 137.6 [X] AMD Ryzen 9 5900X 3.7GHz
NVIDIA GeForce RTX 3070
min:
113.8 fps, max:
-1 fps
138.2 [X] Intel Core i7-10700 2.9GHz
NVIDIA GeForce RTX 3070
min:
121.1 fps, max:
-1 fps
153.6 [X] AMD Ryzen 9 5900X 3.7GHz
NVIDIA GeForce RTX 3070
min:
120.6 fps, max:
-1 fps
~ 129 fps
155%
NVIDIA GeForce RTX 3050:
169.2 [X] AMD Ryzen 9 5900X 3.7GHz
NVIDIA GeForce RTX 3050
min:
139.6 fps, max:
-1 fps
231.5 [X] PNY GeForce RTX 3050 XLR8 AMD Ryzen 9 7950X 4.5GHz
NVIDIA GeForce RTX 3050
min:
195.6 fps, max:
-1 fps
~ 200 fps
104%
GeForce RTX 3080 Laptop GPU:
108.1 113 [X] SCHENKER XMG Pro 15 (Late 2021) Lautlosmodus
Intel Core i7-11800H 2.3GHz
GeForce RTX 3080 Laptop GPU
min:
96 fps, max:
-1 fps
113.2 [X] AMD Ryzen 9 5980HS 3GHz
GeForce RTX 3080 Laptop GPU
min:
100.6 fps, max:
-1 fps
116.9 [X] AMD Ryzen 9 5980HS 3GHz
GeForce RTX 3080 Laptop GPU
min:
104.1 fps, max:
-1 fps
119.2 [X] Acemagic Tank03 Intel Core i9-12900H 1.8GHz
GeForce RTX 3080 Laptop GPU
min:
103.1 fps, max:
-1 fps
122 122 [X] Acer Nitro 5 AN517-41-R9S5 FW-Update
AMD Ryzen 7 5800H 3.2GHz
GeForce RTX 3080 Laptop GPU
min:
106.7 fps, max:
-1 fps
123 124 124 124 [X] Razer Blade 15 Advanced Model Early 2021 Max.
Intel Core i7-10875H 2.3GHz
GeForce RTX 3080 Laptop GPU
min:
107.8 fps, max:
-1 fps
126 126 126 [X] SCHENKER XMG Pro 15 (Late 2021) Stromsparmodus
Intel Core i7-11800H 2.3GHz
GeForce RTX 3080 Laptop GPU
min:
105.1 fps, max:
-1 fps
127 [X] SCHENKER XMG Pro 15 (Late 2021) Unterhaltungsmodus
Intel Core i7-11800H 2.3GHz
GeForce RTX 3080 Laptop GPU
min:
108.7 fps, max:
-1 fps
129 130 131 133 133 134 134 135 [X] Aorus 17G YD Turbo Mode
Intel Core i7-11800H 2.3GHz
GeForce RTX 3080 Laptop GPU
min:
117.2 fps, max:
-1 fps
137 137.6 [X] Acemagic Tank03 Intel Core i9-12900H 1.8GHz
GeForce RTX 3080 Laptop GPU
min:
120.9 fps, max:
-1 fps
139 139 [X] Lenovo Legion 7 16ACHg6 Leistung
AMD Ryzen 9 5900HX 3.3GHz
GeForce RTX 3080 Laptop GPU
min:
122.6 fps, max:
-1 fps
139 [X] Lenovo Legion 7 16ACHg6 Leistung Overclocking
AMD Ryzen 9 5900HX 3.3GHz
GeForce RTX 3080 Laptop GPU
min:
117.3 fps, max:
-1 fps
139 [X] Aorus 17G YD Intel Core i7-11800H 2.3GHz
GeForce RTX 3080 Laptop GPU
min:
121.9 fps, max:
-1 fps
140 [X] Alienware m17 R4 Intel Core i9-10980HK 2.4GHz
GeForce RTX 3080 Laptop GPU
min:
121.6 fps, max:
-1 fps
141 [X] Aorus 15P YD Intel Core i7-11800H 2.3GHz
GeForce RTX 3080 Laptop GPU
min:
123.6 fps, max:
-1 fps
141.5 142 143 143 144 145.7 146 147.4 [X] Acemagic Tank03 Intel Core i9-12900H 1.8GHz
GeForce RTX 3080 Laptop GPU
min:
128.5 fps, max:
-1 fps
148 148 151 154 161 ~ 134 fps
100%
NVIDIA GeForce RTX 3070:
92.1 107.1 [X] Cooler Master MasterCase EG200 RTX 3070 Aorus 15G Intel Core i7-10875H 2.3GHz
NVIDIA GeForce RTX 3070
min:
84.9 fps, max:
-1 fps
121.4 128.6 [X] AMD Ryzen 9 5900X 3.7GHz
NVIDIA GeForce RTX 3070
min:
99 fps, max:
-1 fps
129.7 [X] Intel Core i7-10700 2.9GHz
NVIDIA GeForce RTX 3070
min:
113.4 fps, max:
-1 fps
136.3 [X] AMD Ryzen 9 5900X 3.7GHz
NVIDIA GeForce RTX 3070
min:
108.9 fps, max:
-1 fps
~ 119 fps
152%
NVIDIA GeForce RTX 3050:
154.7 [X] AMD Ryzen 9 5900X 3.7GHz
NVIDIA GeForce RTX 3050
min:
128.2 fps, max:
-1 fps
207.9 [X] PNY GeForce RTX 3050 XLR8 AMD Ryzen 9 7950X 4.5GHz
NVIDIA GeForce RTX 3050
min:
166.8 fps, max:
-1 fps
~ 181 fps
106%
GeForce RTX 3080 Laptop GPU:
98 103 105 [X] SCHENKER XMG Pro 15 (Late 2021) Lautlosmodus
Intel Core i7-11800H 2.3GHz
GeForce RTX 3080 Laptop GPU
min:
88.9 fps, max:
-1 fps
108.9 [X] AMD Ryzen 9 5980HS 3GHz
GeForce RTX 3080 Laptop GPU
min:
96.5 fps, max:
-1 fps
110.7 [X] AMD Ryzen 9 5980HS 3GHz
GeForce RTX 3080 Laptop GPU
min:
97.8 fps, max:
-1 fps
112.3 [X] Acemagic Tank03 Intel Core i9-12900H 1.8GHz
GeForce RTX 3080 Laptop GPU
min:
97.4 fps, max:
-1 fps
114 [X] Acer Nitro 5 AN517-41-R9S5 FW-Update
AMD Ryzen 7 5800H 3.2GHz
GeForce RTX 3080 Laptop GPU
min:
98.1 fps, max:
-1 fps
116 117 [X] SCHENKER XMG Pro 15 (Late 2021) Stromsparmodus
Intel Core i7-11800H 2.3GHz
GeForce RTX 3080 Laptop GPU
min:
98.5 fps, max:
-1 fps
118 119 119 119 119 120 [X] Razer Blade 15 Advanced Model Early 2021 Max.
Intel Core i7-10875H 2.3GHz
GeForce RTX 3080 Laptop GPU
min:
104.1 fps, max:
-1 fps
122 123 123 [X] SCHENKER XMG Pro 15 (Late 2021) Unterhaltungsmodus
Intel Core i7-11800H 2.3GHz
GeForce RTX 3080 Laptop GPU
min:
103.3 fps, max:
-1 fps
125 126 127 128 128 [X] Lenovo Legion 7 16ACHg6 Leistung
AMD Ryzen 9 5900HX 3.3GHz
GeForce RTX 3080 Laptop GPU
min:
111.6 fps, max:
-1 fps
128 [X] Lenovo Legion 7 16ACHg6 Leistung Overclocking
AMD Ryzen 9 5900HX 3.3GHz
GeForce RTX 3080 Laptop GPU
min:
112.7 fps, max:
-1 fps
128 [X] Aorus 17G YD Turbo Mode
Intel Core i7-11800H 2.3GHz
GeForce RTX 3080 Laptop GPU
min:
111.9 fps, max:
-1 fps
128.2 [X] Acemagic Tank03 Intel Core i9-12900H 1.8GHz
GeForce RTX 3080 Laptop GPU
min:
111.8 fps, max:
-1 fps
130 [X] Aorus 17G YD Intel Core i7-11800H 2.3GHz
GeForce RTX 3080 Laptop GPU
min:
114.3 fps, max:
-1 fps
131 132 [X] Alienware m17 R4 Intel Core i9-10980HK 2.4GHz
GeForce RTX 3080 Laptop GPU
min:
114.9 fps, max:
-1 fps
132 133 [X] Aorus 15P YD Intel Core i7-11800H 2.3GHz
GeForce RTX 3080 Laptop GPU
min:
116.2 fps, max:
-1 fps
134 134.7 135 135 135 136 138 138 138.4 138.7 [X] Acemagic Tank03 Intel Core i9-12900H 1.8GHz
GeForce RTX 3080 Laptop GPU
min:
120.5 fps, max:
-1 fps
142 146 156 ~ 126 fps
100%
NVIDIA GeForce RTX 3070:
122.7 123.4 [X] AMD Ryzen 9 5900X 3.7GHz
NVIDIA GeForce RTX 3070
min:
98 fps, max:
-1 fps
127.4 [X] Intel Core i7-10700 2.9GHz
NVIDIA GeForce RTX 3070
min:
107.8 fps, max:
-1 fps
128.5 [X] AMD Ryzen 9 5900X 3.7GHz
NVIDIA GeForce RTX 3070
min:
102.9 fps, max:
-1 fps
~ 126 fps
75%
NVIDIA GeForce RTX 3050:
93.1 [X] AMD Ryzen 9 5900X 3.7GHz
NVIDIA GeForce RTX 3050
min:
80.6 fps, max:
-1 fps
94.4 [X] PNY GeForce RTX 3050 XLR8 AMD Ryzen 9 7950X 4.5GHz
NVIDIA GeForce RTX 3050
min:
87.1 fps, max:
-1 fps
~ 94 fps
83%
GeForce RTX 3080 Laptop GPU:
55.2 87.2 [X] SCHENKER XMG Pro 15 (Late 2021) Stromsparmodus
Intel Core i7-11800H 2.3GHz
GeForce RTX 3080 Laptop GPU
min:
72.7 fps, max:
-1 fps
92.4 [X] SCHENKER XMG Pro 15 (Late 2021) Lautlosmodus
Intel Core i7-11800H 2.3GHz
GeForce RTX 3080 Laptop GPU
min:
78.2 fps, max:
-1 fps
99.9 101 101.3 [X] Acemagic Tank03 Intel Core i9-12900H 1.8GHz
GeForce RTX 3080 Laptop GPU
min:
87.4 fps, max:
-1 fps
106 [X] SCHENKER XMG Pro 15 (Late 2021) Unterhaltungsmodus
Intel Core i7-11800H 2.3GHz
GeForce RTX 3080 Laptop GPU
min:
89.5 fps, max:
-1 fps
110 111 [X] AMD Ryzen 9 5980HS 3GHz
GeForce RTX 3080 Laptop GPU
min:
97.3 fps, max:
-1 fps
111 112.6 113.2 [X] Acemagic Tank03 Intel Core i9-12900H 1.8GHz
GeForce RTX 3080 Laptop GPU
min:
98.5 fps, max:
-1 fps
116 117.1 [X] Acemagic Tank03 Intel Core i9-12900H 1.8GHz
GeForce RTX 3080 Laptop GPU
min:
101.8 fps, max:
-1 fps
119 128 ~ 105 fps
100%
NVIDIA GeForce RTX 3070:
154 196.8 [X] Cooler Master MasterCase EG200 RTX 3070 Aorus 15G Intel Core i7-10875H 2.3GHz
NVIDIA GeForce RTX 3070
367 [X] Intel Core i7-10700 2.9GHz
NVIDIA GeForce RTX 3070
407 [X] AMD Ryzen 9 5900X 3.7GHz
NVIDIA GeForce RTX 3070
min:
351 fps, max:
466 fps
451 [X] AMD Ryzen 9 5900X 3.7GHz
NVIDIA GeForce RTX 3070
min:
397 fps, max:
505 fps
507 548 ~ 376 fps
97%
NVIDIA GeForce RTX 3050:
361 [X] AMD Ryzen 9 5900X 3.7GHz
NVIDIA GeForce RTX 3050
min:
23.6 fps, P0.1:
126 fps, P1:
225 fps, max:
1740 fps
364 [X] PNY GeForce RTX 3050 XLR8 AMD Ryzen 9 7950X 4.5GHz
NVIDIA GeForce RTX 3050
~ 363 fps
95%
GeForce RTX 3080 Laptop GPU:
151 293 309 [X] AMD Ryzen 9 5980HS 3GHz
GeForce RTX 3080 Laptop GPU
min:
279 fps, max:
353 fps
312 316 318.8 320.7 325 334 [X] Alienware m17 R4 Intel Core i9-10980HK 2.4GHz
GeForce RTX 3080 Laptop GPU
min:
152 fps, max:
422 fps
341.7 344.8 346 [X] AMD Ryzen 9 5980HS 3GHz
GeForce RTX 3080 Laptop GPU
min:
310 fps, max:
408 fps
350.8 355 [X] Lenovo Legion 7 16ACHg6 AMD Ryzen 9 5900HX 3.3GHz
GeForce RTX 3080 Laptop GPU
min:
15.7 fps, P0.1:
82.5 fps, P1:
241 fps, max:
592 fps
365 [X] Aorus 17G YD Intel Core i7-11800H 2.3GHz
GeForce RTX 3080 Laptop GPU
min:
13.7 fps, P0.1:
64.8 fps, P1:
203 fps, max:
687 fps
368 370.2 370.2 371 398.5 399 400 [X] Acemagic Tank03 Intel Core i9-12900H 1.8GHz
GeForce RTX 3080 Laptop GPU
min:
19.8 fps, P0.1:
125 fps, P1:
282 fps, max:
626 fps
418 427 439.6 453 465.4 ~ 358 fps
100%
NVIDIA GeForce RTX 3070:
128.2 [X] Cooler Master MasterCase EG200 RTX 3070 Aorus 15G Intel Core i7-10875H 2.3GHz
NVIDIA GeForce RTX 3070
141.2 316 [X] Intel Core i7-10700 2.9GHz
NVIDIA GeForce RTX 3070
350 [X] AMD Ryzen 9 5900X 3.7GHz
NVIDIA GeForce RTX 3070
min:
312 fps, max:
390 fps
363 [X] AMD Ryzen 9 5900X 3.7GHz
NVIDIA GeForce RTX 3070
min:
319 fps, max:
391 fps
408 449 ~ 308 fps
92%
NVIDIA GeForce RTX 3050:
226.5 [X] PNY GeForce RTX 3050 XLR8 AMD Ryzen 9 7950X 4.5GHz
NVIDIA GeForce RTX 3050
337 [X] AMD Ryzen 9 5900X 3.7GHz
NVIDIA GeForce RTX 3050
min:
65.3 fps, P0.1:
177 fps, P1:
250 fps, max:
845 fps
~ 282 fps
94%
GeForce RTX 3080 Laptop GPU:
236 [X] Alienware m17 R4 Intel Core i9-10980HK 2.4GHz
GeForce RTX 3080 Laptop GPU
min:
101 fps, max:
354 fps
259.2 261 262 262 262 267 [X] Aorus 17G YD Intel Core i7-11800H 2.3GHz
GeForce RTX 3080 Laptop GPU
min:
51 fps, P0.1:
92.9 fps, P1:
164 fps, max:
557 fps
270.1 276 276.5 285 288.6 293.2 294 295 [X] AMD Ryzen 9 5980HS 3GHz
GeForce RTX 3080 Laptop GPU
min:
262 fps, max:
345 fps
300 301.3 302 [X] Lenovo Legion 7 16ACHg6 AMD Ryzen 9 5900HX 3.3GHz
GeForce RTX 3080 Laptop GPU
min:
70.2 fps, P0.1:
146 fps, P1:
186 fps, max:
514 fps
311 313 [X] Acemagic Tank03 Intel Core i9-12900H 1.8GHz
GeForce RTX 3080 Laptop GPU
min:
17.4 fps, P0.1:
155.4 fps, P1:
207 fps, max:
509 fps
317.3 321.2 329 374 ~ 290 fps
100%
NVIDIA GeForce RTX 3070:
100 [X] Cooler Master MasterCase EG200 RTX 3070 Aorus 15G Intel Core i7-10875H 2.3GHz
NVIDIA GeForce RTX 3070
121.4 176 [X] AMD Ryzen 9 5900X 3.7GHz
NVIDIA GeForce RTX 3070
min:
161 fps, max:
189 fps
224 [X] AMD Ryzen 9 5900X 3.7GHz
NVIDIA GeForce RTX 3070
min:
207 fps, max:
243 fps
235 [X] Intel Core i7-10700 2.9GHz
NVIDIA GeForce RTX 3070
244 244 264 ~ 201 fps
84%
NVIDIA GeForce RTX 3050:
129.1 [X] PNY GeForce RTX 3050 XLR8 AMD Ryzen 9 7950X 4.5GHz
NVIDIA GeForce RTX 3050
207 [X] AMD Ryzen 9 5900X 3.7GHz
NVIDIA GeForce RTX 3050
min:
39.7 fps, P0.1:
124 fps, P1:
163 fps, max:
499 fps
~ 168 fps
95%
GeForce RTX 3080 Laptop GPU:
149 151 155 165.2 170 174 175 175 176 177 183 [X] Aorus 17G YD Intel Core i7-11800H 2.3GHz
GeForce RTX 3080 Laptop GPU
min:
68.1 fps, P0.1:
80.8 fps, P1:
115 fps, max:
443 fps
184.9 187.2 189 189.5 190 [X] AMD Ryzen 9 5980HS 3GHz
GeForce RTX 3080 Laptop GPU
min:
174 fps, max:
206 fps
192 196.4 [X] Acemagic Tank03 Intel Core i9-12900H 1.8GHz
GeForce RTX 3080 Laptop GPU
min:
15.6 fps, P0.1:
107.2 fps, P1:
138.9 fps, max:
369 fps
196.5 197.1 197.3 198 200 206 [X] Lenovo Legion 7 16ACHg6 AMD Ryzen 9 5900HX 3.3GHz
GeForce RTX 3080 Laptop GPU
min:
69.1 fps, P0.1:
95.8 fps, P1:
136 fps, max:
365 fps
208.1 210 211 [X] Alienware m17 R4 Intel Core i9-10980HK 2.4GHz
GeForce RTX 3080 Laptop GPU
min:
166 fps, max:
247 fps
212 [X] AMD Ryzen 9 5980HS 3GHz
GeForce RTX 3080 Laptop GPU
min:
189 fps, max:
232 fps
212.9 231.2 242 ~ 190 fps
100%
NVIDIA GeForce RTX 3070:
52.8 [X] Cooler Master MasterCase EG200 RTX 3070 Aorus 15G Intel Core i7-10875H 2.3GHz
NVIDIA GeForce RTX 3070
70.4 121 [X] AMD Ryzen 9 5900X 3.7GHz
NVIDIA GeForce RTX 3070
min:
112 fps, max:
134 fps
121 [X] Intel Core i7-10700 2.9GHz
NVIDIA GeForce RTX 3070
122 [X] AMD Ryzen 9 5900X 3.7GHz
NVIDIA GeForce RTX 3070
min:
110 fps, max:
138 fps
123 132.2 ~ 106 fps
61%
NVIDIA GeForce RTX 3050:
62.8 [X] AMD Ryzen 9 5900X 3.7GHz
NVIDIA GeForce RTX 3050
min:
45 fps, P0.1:
46 fps, P1:
52.8 fps, max:
116 fps
67.2 [X] PNY GeForce RTX 3050 XLR8 AMD Ryzen 9 7950X 4.5GHz
NVIDIA GeForce RTX 3050
~ 65 fps
99%
GeForce RTX 3080 Laptop GPU:
85.1 87.7 89.5 [X] SCHENKER XMG Pro 15 (Late 2021) Lautlosmodus
Intel Core i7-11800H 2.3GHz
GeForce RTX 3080 Laptop GPU
min:
32.5 fps, P0.1:
39.2 fps, P1:
54.9 fps, max:
170 fps
90.2 93.2 93.4 93.8 96.1 97.6 97.6 [X] Acer Nitro 5 AN517-41-R9S5 FW-Update
AMD Ryzen 7 5800H 3.2GHz
GeForce RTX 3080 Laptop GPU
min:
38.6 fps, P0.1:
41.9 fps, P1:
68.9 fps, max:
185 fps
97.9 98.7 [X] Razer Blade 15 Advanced Model Early 2021 Max.
Intel Core i7-10875H 2.3GHz
GeForce RTX 3080 Laptop GPU
min:
33.1 fps, P0.1:
55.5 fps, P1:
71.9 fps, max:
188 fps
100 102.4 [X] Acemagic Tank03 Intel Core i9-12900H 1.8GHz
GeForce RTX 3080 Laptop GPU
min:
58.9 fps, P0.1:
67.9 fps, P1:
81 fps, max:
201 fps
102.8 104.6 105.2 105.5 105.8 106 [X] Aorus 17G YD Intel Core i7-11800H 2.3GHz
GeForce RTX 3080 Laptop GPU
min:
43.4 fps, P0.1:
50.9 fps, P1:
68.2 fps, max:
195 fps
107 [X] Aorus 15P YD Intel Core i7-11800H 2.3GHz
GeForce RTX 3080 Laptop GPU
min:
86 fps
108 108.3 108.4 108.6 109 110.2 111 [X] AMD Ryzen 9 5980HS 3GHz
GeForce RTX 3080 Laptop GPU
min:
102 fps, max:
125 fps
112 112 112 113 114 [X] Lenovo Legion 7 16ACHg6 AMD Ryzen 9 5900HX 3.3GHz
GeForce RTX 3080 Laptop GPU
min:
60 fps, P0.1:
74.4 fps, P1:
86.2 fps, max:
231 fps
115 116 [X] AMD Ryzen 9 5980HS 3GHz
GeForce RTX 3080 Laptop GPU
min:
104 fps, max:
132 fps
120 121 [X] Lenovo Legion 7 16ACHg6 Leistung
AMD Ryzen 9 5900HX 3.3GHz
GeForce RTX 3080 Laptop GPU
min:
33.8 fps, P0.1:
63.1 fps, P1:
89.6 fps, max:
233 fps
123 123 [X] Lenovo Legion 7 16ACHg6 Leistung Overclocking
AMD Ryzen 9 5900HX 3.3GHz
GeForce RTX 3080 Laptop GPU
min:
55.7 fps, P0.1:
72.1 fps, P1:
90.3 fps, max:
259 fps
~ 105 fps
GeForce RTX 3080 Laptop GPU:
79 [X] Acemagic Tank03 Intel Core i9-12900H 1.8GHz
GeForce RTX 3080 Laptop GPU
min:
48.2 fps, P0.1:
57.5 fps, P1:
65.5 fps, max:
159.1 fps
fps
100%
NVIDIA GeForce RTX 3070:
84 [X] Intel Core i7-10700 2.9GHz
NVIDIA GeForce RTX 3070
88.2 [X] AMD Ryzen 9 5900X 3.7GHz
NVIDIA GeForce RTX 3070
min:
82 fps, max:
97 fps
89.6 90.9 [X] AMD Ryzen 9 5900X 3.7GHz
NVIDIA GeForce RTX 3070
min:
84 fps, max:
101 fps
93.9 ~ 89 fps
49%
NVIDIA GeForce RTX 3050:
43.8 [X] AMD Ryzen 9 5900X 3.7GHz
NVIDIA GeForce RTX 3050
min:
30.8 fps, P0.1:
34.5 fps, P1:
38.9 fps, max:
93.5 fps
44.1 [X] PNY GeForce RTX 3050 XLR8 AMD Ryzen 9 7950X 4.5GHz
NVIDIA GeForce RTX 3050
~ 44 fps
81%
GeForce RTX 3080 Laptop GPU:
60 62.2 66.7 67.5 69.4 [X] Acemagic Tank03 Intel Core i9-12900H 1.8GHz
GeForce RTX 3080 Laptop GPU
min:
34.5 fps, P0.1:
52.7 fps, P1:
59.2 fps, max:
233 fps
69.6 80 80.2 80.4 82.2 [X] AMD Ryzen 9 5980HS 3GHz
GeForce RTX 3080 Laptop GPU
min:
76 fps, max:
90 fps
~ 72 fps
100%
NVIDIA GeForce RTX 3070:
180 [X] Intel Core i7-10700 2.9GHz
NVIDIA GeForce RTX 3070
min:
3.38 fps, P1:
143 fps, max:
409 fps
182 [X] AMD Ryzen 9 5900X 3.7GHz
NVIDIA GeForce RTX 3070
min:
2.89 fps, P1:
125 fps, max:
455 fps
184 [X] AMD Ryzen 9 5900X 3.7GHz
NVIDIA GeForce RTX 3070
min:
2.18 fps, P1:
125 fps, max:
539 fps
184.7 ~ 183 fps
103%
NVIDIA GeForce RTX 3050:
187 [X] AMD Ryzen 9 5900X 3.7GHz
NVIDIA GeForce RTX 3050
min:
1.955 fps, P1:
200 fps, max:
459 fps
188.1 [X] PNY GeForce RTX 3050 XLR8 AMD Ryzen 9 7950X 4.5GHz
NVIDIA GeForce RTX 3050
min:
7.54 fps, P1:
200 fps, max:
708 fps
~ 188 fps
99%
GeForce RTX 3080 Laptop GPU:
164 [X] AMD Ryzen 9 5980HS 3GHz
GeForce RTX 3080 Laptop GPU
min:
4.45 fps, P1:
111 fps, max:
275 fps
173 [X] AMD Ryzen 9 5980HS 3GHz
GeForce RTX 3080 Laptop GPU
min:
3.97 fps, P1:
125 fps, max:
325 fps
177 177 178 179 179 180 [X] Alienware m17 R4 Intel Core i9-10980HK 2.4GHz
GeForce RTX 3080 Laptop GPU
min:
4.48 fps, P1:
125 fps, max:
363 fps
180 181 181 [X] MSI GE76 Raider 10UH Intel Core i7-10870H 2.2GHz
GeForce RTX 3080 Laptop GPU
min:
5.26 fps, P1:
143 fps, max:
268 fps
181 181.7 [X] Acemagic Tank03 Intel Core i9-12900H 1.8GHz
GeForce RTX 3080 Laptop GPU
min:
2.29 fps, P1:
125 fps, max:
276 fps
182 182 [X] Lenovo Legion 7 16ACHg6 Leistung
AMD Ryzen 9 5900HX 3.3GHz
GeForce RTX 3080 Laptop GPU
min:
3.14 fps, P1:
143 fps, max:
412 fps
182 183 [X] Aorus 17G YD Intel Core i7-11800H 2.3GHz
GeForce RTX 3080 Laptop GPU
min:
3.45 fps, P1:
143 fps, max:
275 fps
183 183 184 [X] Aorus 15P YD Intel Core i7-11800H 2.3GHz
GeForce RTX 3080 Laptop GPU
min:
2.69 fps, P1:
143 fps, max:
302 fps
184 184 184 185 185 186 186 186 ~ 181 fps
100%
NVIDIA GeForce RTX 3070:
172 [X] AMD Ryzen 9 5900X 3.7GHz
NVIDIA GeForce RTX 3070
min:
0.3776 fps, P1:
100 fps, max:
424 fps
173 [X] Intel Core i7-10700 2.9GHz
NVIDIA GeForce RTX 3070
min:
3.46 fps, P1:
125 fps, max:
371 fps
175 [X] AMD Ryzen 9 5900X 3.7GHz
NVIDIA GeForce RTX 3070
min:
4.2 fps, P1:
111 fps, max:
399 fps
181.6 ~ 175 fps
107%
NVIDIA GeForce RTX 3050:
186 [X] AMD Ryzen 9 5900X 3.7GHz
NVIDIA GeForce RTX 3050
min:
1.514 fps, P1:
167 fps, max:
522 fps
187.9 [X] PNY GeForce RTX 3050 XLR8 AMD Ryzen 9 7950X 4.5GHz
NVIDIA GeForce RTX 3050
min:
2.63 fps, P1:
200 fps, max:
658 fps
~ 187 fps
101%
GeForce RTX 3080 Laptop GPU:
167 [X] AMD Ryzen 9 5980HS 3GHz
GeForce RTX 3080 Laptop GPU
min:
5.15 fps, P1:
111 fps, max:
279 fps
171 172 172 174 176 [X] MSI GE76 Raider 10UH Intel Core i7-10870H 2.2GHz
GeForce RTX 3080 Laptop GPU
min:
4.54 fps, P1:
125 fps, max:
250 fps
176 [X] Alienware m17 R4 Intel Core i9-10980HK 2.4GHz
GeForce RTX 3080 Laptop GPU
min:
5.14 fps, P1:
111 fps, max:
393 fps
176 [X] Aorus 15P YD Intel Core i7-11800H 2.3GHz
GeForce RTX 3080 Laptop GPU
min:
3.71 fps, P1:
125 fps, max:
269 fps
176 [X] Aorus 17G YD Intel Core i7-11800H 2.3GHz
GeForce RTX 3080 Laptop GPU
min:
3.24 fps, P1:
111 fps, max:
240 fps
176 177 177 177 [X] Lenovo Legion 7 16ACHg6 Leistung
AMD Ryzen 9 5900HX 3.3GHz
GeForce RTX 3080 Laptop GPU
min:
4.54 fps, P1:
125 fps, max:
425 fps
177 177 177 178 179 179.4 [X] Acemagic Tank03 Intel Core i9-12900H 1.8GHz
GeForce RTX 3080 Laptop GPU
min:
3.42 fps, P1:
142.9 fps, max:
410 fps
180 180 180 181 182 ~ 177 fps
100%
NVIDIA GeForce RTX 3070:
157 [X] AMD Ryzen 9 5900X 3.7GHz
NVIDIA GeForce RTX 3070
min:
3.65 fps, P1:
90.9 fps, max:
354 fps
161 [X] Intel Core i7-10700 2.9GHz
NVIDIA GeForce RTX 3070
min:
6.66 fps, P1:
100 fps, max:
318 fps
170 [X] AMD Ryzen 9 5900X 3.7GHz
NVIDIA GeForce RTX 3070
min:
3.14 fps, P1:
100 fps, max:
356 fps
177.7 ~ 166 fps
105%
NVIDIA GeForce RTX 3050:
170 [X] AMD Ryzen 9 5900X 3.7GHz
NVIDIA GeForce RTX 3050
min:
2.21 fps, P1:
111 fps, max:
389 fps
178.9 [X] PNY GeForce RTX 3050 XLR8 AMD Ryzen 9 7950X 4.5GHz
NVIDIA GeForce RTX 3050
min:
4.74 fps, P1:
125 fps, max:
564 fps
~ 174 fps
98%
GeForce RTX 3080 Laptop GPU:
137 [X] AMD Ryzen 9 5980HS 3GHz
GeForce RTX 3080 Laptop GPU
min:
45.9 fps, P1:
90.9 fps, max:
254 fps
148 150 [X] AMD Ryzen 9 5980HS 3GHz
GeForce RTX 3080 Laptop GPU
min:
4.04 fps, P1:
100 fps, max:
292 fps
150 152 154 156 157 158 [X] Aorus 17G YD Intel Core i7-11800H 2.3GHz
GeForce RTX 3080 Laptop GPU
min:
5.15 fps, P1:
90.9 fps, max:
287 fps
160 [X] Alienware m17 R4 Intel Core i9-10980HK 2.4GHz
GeForce RTX 3080 Laptop GPU
min:
4.59 fps, P1:
90.9 fps, max:
355 fps
161 [X] Aorus 15P YD Intel Core i7-11800H 2.3GHz
GeForce RTX 3080 Laptop GPU
min:
4.32 fps, P1:
111 fps, max:
345 fps
162 [X] MSI GE76 Raider 10UH Intel Core i7-10870H 2.2GHz
GeForce RTX 3080 Laptop GPU
min:
12.2 fps, P1:
100 fps, max:
276 fps
163 164 164 164 [X] MSI GS76 Stealth 11UH Intel Core i9-11900H 2.5GHz
GeForce RTX 3080 Laptop GPU
min:
5.22 fps, P1:
100 fps, max:
283 fps
165 166 166 166 166 167 [X] Lenovo Legion 7 16ACHg6 Leistung
AMD Ryzen 9 5900HX 3.3GHz
GeForce RTX 3080 Laptop GPU
min:
3.93 fps, P1:
111 fps, max:
319 fps
168 172 172.2 [X] Acemagic Tank03 Intel Core i9-12900H 1.8GHz
GeForce RTX 3080 Laptop GPU
min:
4.06 fps, P1:
111.1 fps, max:
301 fps
173 175 176 176 ~ 162 fps
100%
NVIDIA GeForce RTX 3070:
91.1 [X] AMD Ryzen 9 5900X 3.7GHz
NVIDIA GeForce RTX 3070
min:
4.66 fps, P1:
52.6 fps, max:
233 fps
95.6 [X] Intel Core i7-10700 2.9GHz
NVIDIA GeForce RTX 3070
min:
6.11 fps, P1:
66.7 fps, max:
180 fps
108 [X] AMD Ryzen 9 5900X 3.7GHz
NVIDIA GeForce RTX 3070
min:
4.47 fps, P1:
71.4 fps, max:
218 fps
122.4 ~ 104 fps
78%
NVIDIA GeForce RTX 3050:
78.2 [X] AMD Ryzen 9 5900X 3.7GHz
NVIDIA GeForce RTX 3050
min:
16.9 fps, P1:
52.6 fps, max:
202 fps
83.6 [X] PNY GeForce RTX 3050 XLR8 AMD Ryzen 9 7950X 4.5GHz
NVIDIA GeForce RTX 3050
min:
7.6 fps, P1:
58.8 fps, max:
211 fps
~ 81 fps
93%
GeForce RTX 3080 Laptop GPU:
68.6 [X] SCHENKER XMG Pro 15 (Late 2021) Lautlosmodus
Intel Core i7-11800H 2.3GHz
GeForce RTX 3080 Laptop GPU
min:
15.8 fps, P1:
43.5 fps, max:
150 fps
77 [X] SCHENKER XMG Pro 15 (Late 2021) Stromsparmodus
Intel Core i7-11800H 2.3GHz
GeForce RTX 3080 Laptop GPU
min:
16.9 fps, P1:
50 fps, max:
155 fps
84 [X] AMD Ryzen 9 5980HS 3GHz
GeForce RTX 3080 Laptop GPU
min:
27.2 fps, P1:
58.8 fps, max:
156 fps
87.2 [X] AMD Ryzen 9 5980HS 3GHz
GeForce RTX 3080 Laptop GPU
min:
6.63 fps, P1:
62.5 fps, max:
160 fps
88.2 [X] Acer Nitro 5 AN517-41-R9S5 FW-Update
AMD Ryzen 7 5800H 3.2GHz
GeForce RTX 3080 Laptop GPU
min:
22.1 fps, P1:
58.8 fps, max:
154 fps
89.9 90 90.7 91.9 93 93.9 [X] Alienware m17 R4 Intel Core i9-10980HK 2.4GHz
GeForce RTX 3080 Laptop GPU
min:
6.12 fps, P1:
62.5 fps, max:
193 fps
94.5 95.1 [X] MSI GE76 Raider 10UH Intel Core i7-10870H 2.2GHz
GeForce RTX 3080 Laptop GPU
min:
5.28 fps, P1:
66.7 fps, max:
190 fps
95.7 [X] Aorus 17G YD Intel Core i7-11800H 2.3GHz
GeForce RTX 3080 Laptop GPU
min:
17.9 fps, P1:
66.7 fps, max:
174 fps
95.8 [X] Lenovo Legion 7 16ACHg6 Leistung Overclocking
AMD Ryzen 9 5900HX 3.3GHz
GeForce RTX 3080 Laptop GPU
min:
7.72 fps, P1:
66.7 fps, max:
181 fps
97.4 [X] Aorus 15P YD Intel Core i7-11800H 2.3GHz
GeForce RTX 3080 Laptop GPU
min:
6.21 fps, P1:
66.7 fps, max:
206 fps
98.1 98.2 98.5 [X] MSI GS76 Stealth 11UH Intel Core i9-11900H 2.5GHz
GeForce RTX 3080 Laptop GPU
min:
17.3 fps, P1:
62.5 fps, max:
209 fps
99.5 99.5 101 [X] SCHENKER XMG Pro 15 (Late 2021) Unterhaltungsmodus
Intel Core i7-11800H 2.3GHz
GeForce RTX 3080 Laptop GPU
min:
17.5 fps, P1:
71.4 fps, max:
208 fps
102 103 103 103 105 [X] Lenovo Legion 7 16ACHg6 Leistung
AMD Ryzen 9 5900HX 3.3GHz
GeForce RTX 3080 Laptop GPU
min:
10.3 fps, P1:
76.9 fps, max:
192 fps
109 109 110 111.1 [X] Acemagic Tank03 Intel Core i9-12900H 1.8GHz
GeForce RTX 3080 Laptop GPU
min:
21.2 fps, P1:
76.9 fps, max:
201 fps
112 112 ~ 97 fps
100%
NVIDIA GeForce RTX 3070:
86.5 [X] AMD Ryzen 9 5900X 3.7GHz
NVIDIA GeForce RTX 3070
min:
4.41 fps, P1:
52.6 fps, max:
212 fps
91.6 [X] Intel Core i7-10700 2.9GHz
NVIDIA GeForce RTX 3070
min:
4.49 fps, P1:
62.5 fps, max:
195 fps
98.3 [X] AMD Ryzen 9 5900X 3.7GHz
NVIDIA GeForce RTX 3070
min:
6.76 fps, P1:
62.5 fps, max:
249 fps
113.1 ~ 97 fps
59%
NVIDIA GeForce RTX 3050:
54.7 [X] AMD Ryzen 9 5900X 3.7GHz
NVIDIA GeForce RTX 3050
min:
13.4 fps, P1:
38.5 fps, max:
261 fps
59.1 [X] PNY GeForce RTX 3050 XLR8 AMD Ryzen 9 7950X 4.5GHz
NVIDIA GeForce RTX 3050
min:
5.94 fps, P1:
41.7 fps, max:
186.8 fps
~ 57 fps
94%
GeForce RTX 3080 Laptop GPU:
82.2 [X] AMD Ryzen 9 5980HS 3GHz
GeForce RTX 3080 Laptop GPU
min:
8.04 fps, P1:
55.6 fps, max:
168 fps
82.3 [X] MSI GS76 Stealth 11UH Intel Core i9-11900H 2.5GHz
GeForce RTX 3080 Laptop GPU
min:
16.3 fps, P1:
58.8 fps, max:
145 fps
85.7 85.7 89.2 92.5 94.8 [X] Lenovo Legion 7 16ACHg6 Leistung Overclocking
AMD Ryzen 9 5900HX 3.3GHz
GeForce RTX 3080 Laptop GPU
min:
8.02 fps, P1:
66.7 fps, max:
177 fps
95.6 96.3 [X] Acemagic Tank03 Intel Core i9-12900H 1.8GHz
GeForce RTX 3080 Laptop GPU
min:
19.4 fps, P1:
66.7 fps, max:
187.8 fps
97.4 [X] Lenovo Legion 7 16ACHg6 Leistung
AMD Ryzen 9 5900HX 3.3GHz
GeForce RTX 3080 Laptop GPU
min:
4.59 fps, P1:
66.7 fps, max:
189 fps
99.1 ~ 91 fps
100%
NVIDIA GeForce RTX 3070:
110 [X] Intel Core i7-10700 2.9GHz
NVIDIA GeForce RTX 3070
min:
9.32 fps, P1:
90.9 fps, max:
188 fps
112 [X] AMD Ryzen 9 5900X 3.7GHz
NVIDIA GeForce RTX 3070
min:
8.76 fps, P1:
76.9 fps, max:
213 fps
117 [X] AMD Ryzen 9 5900X 3.7GHz
NVIDIA GeForce RTX 3070
min:
9.24 fps, P1:
76.9 fps, max:
263 fps
125.9 ~ 116 fps
49%
NVIDIA GeForce RTX 3050:
55.8 [X] AMD Ryzen 9 5900X 3.7GHz
NVIDIA GeForce RTX 3050
min:
7.27 fps, P1:
41.7 fps, max:
187 fps
58.3 [X] PNY GeForce RTX 3050 XLR8 AMD Ryzen 9 7950X 4.5GHz
NVIDIA GeForce RTX 3050
min:
6.21 fps, P1:
43.5 fps, max:
273 fps
~ 57 fps
79%
GeForce RTX 3080 Laptop GPU:
64.8 [X] SCHENKER XMG Pro 15 (Late 2021) Stromsparmodus
Intel Core i7-11800H 2.3GHz
GeForce RTX 3080 Laptop GPU
min:
18.1 fps, P1:
50 fps, max:
193 fps
81.2 [X] SCHENKER XMG Pro 15 (Late 2021) Lautlosmodus
Intel Core i7-11800H 2.3GHz
GeForce RTX 3080 Laptop GPU
min:
18.2 fps, P1:
58.8 fps, max:
137 fps
86.5 [X] MSI GS76 Stealth 11UH Intel Core i9-11900H 2.5GHz
GeForce RTX 3080 Laptop GPU
min:
25.9 fps, P1:
62.5 fps, max:
195 fps
88 91.1 [X] SCHENKER XMG Pro 15 (Late 2021) Unterhaltungsmodus
Intel Core i7-11800H 2.3GHz
GeForce RTX 3080 Laptop GPU
min:
31.9 fps, P1:
62.5 fps, max:
198 fps
93 98.1 98.2 [X] Acemagic Tank03 Intel Core i9-12900H 1.8GHz
GeForce RTX 3080 Laptop GPU
min:
28.3 fps, P1:
71.4 fps, max:
266 fps
106 112 [X] AMD Ryzen 9 5980HS 3GHz
GeForce RTX 3080 Laptop GPU
min:
9.66 fps, P1:
83.3 fps, max:
193 fps
~ 92 fps
GeForce RTX 3080 Laptop GPU:
374 fps
GeForce RTX 3080 Laptop GPU:
186.2 fps
Average Gaming NVIDIA GeForce RTX 3070 → 100% Average Gaming 30-70 fps → 100%
Average Gaming NVIDIA GeForce RTX 3050 → 65% Average Gaming 30-70 fps → 56%
Average Gaming NVIDIA GeForce RTX 3080 Laptop GPU → 83% Average Gaming 30-70 fps → 81%
 Deutsch
 English
 Español
 Français
 Italiano
 Nederlands
 Polski
 Português
 Русский
 Türkçe
 Svenska
 Chinese
 Magyar