Notebookcheck Logo

Intel Atom N455 vs Intel Atom N435 vs Rockchip RK3188

Intel Atom N455

► remove from comparison Intel N455

The Intel Atom N455 is a small and cheap entry level CPU for Netbooks and small laptops. In the package is an integrated memory controller for DDR3 main memory (the difference to the Atom N450) and the GMA 3150 graphics card

The performance of the whole system (Atom N455 and integrated GMA 3150) is only sufficient for basic tasks like surfing the web, or office working. HD video, video cutting, advanced photo editing, multitasking and of course gaming may overstrain the GPU and CPU. Compared to the previous Atom generation, the performance gain is only marginally above a similar clocked Atom N280 / GMA 950.

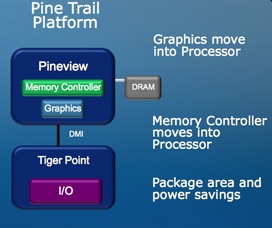
An advantage of the combination, is the small overall power consumption of the CPU, GPU and memory controller (only 6.5 Watt TDP). Intel states 20% power reduction and 60% package reduction. Therefore, the chip is ideally used in small Netbooks, MIDs, and thin laptops. Compared to the Z500 series combined with the US15W chipset (2.4+2.3 W), the power consumption is similar.

Intel Atom N435

► remove from comparison Intel N435

The Intel Atom N435 is a small and cheap entry level CPU for Netbooks and small laptops. In the package is an integrated memory controller for DDR2/DDR3 main memory and the GMA 3150 graphics card

The performance of the whole system (Atom N435 and integrated GMA 3150) is only sufficient for basic tasks like surfing the web, or office working. HD video, video cutting, advanced photo editing, multitasking and of course gaming may overstrain the GPU and CPU. Compared to the previous Atom generation, the performance of the CPU is on a level with the slow Atom Z520.

An advantage of the interation, is the small overall power consumption of the CPU, GPU and memory controller (only 5 Watt TDP). Therefore, the chip is ideally used in small Netbooks and thin laptops.

Rockchip RK3188

► remove from comparison

The Rockchip RK3188 is a fast ARM SoC primarily designed for tablets. It integrates four ARM Cortex A9 cores with NEON extension and a clock speed of up to 1.8 GHz, a Mali-400 MP4 graphics card (up to 600 MHz, 24 GFLOPS) and a low-power (LP-)DDR2/DDR3 memory controller. Due to the high clock rates, the performance of the CPU and GPU is superior to other Cortex-A9 quad-cores such as the Nvidia Tegra 3 and Samsung Exynos 4412. These high frequencies are possible due to the 28nm process (TSMC). However, this results in high power consumption and is thus not suited for compact smartphones.

ModelIntel Atom N455Intel Atom N435Rockchip RK3188
SeriesIntel AtomIntel Atom
CodenamePinetrailPinetrailCortex-A9
Series: Cortex-A9
Intel Atom D5251.8 GHz2 / 4 cores
Intel Atom N455 « 1.66 GHz1 / 2 cores
Intel Atom N4501.66 GHz1 / 2 cores
Intel Atom N4351.33 GHz1 / 2 cores
Intel Atom D5251.8 GHz2 / 4 cores
Intel Atom N4551.66 GHz1 / 2 cores
Intel Atom N4501.66 GHz1 / 2 cores
Intel Atom N435 « 1.33 GHz1 / 2 cores
HiSilicon Kirin 910T1.8 GHz4 / 4 cores Cortex-A9
Rockchip RK3188 « 1.8 GHz4 / 4 cores Cortex-A9
HiSilicon Kirin 9101.6 GHz4 / 4 cores Cortex-A9
Renesas MP52321.5 GHz2 / 2 cores Cortex-A9
Broadcom BCM21664T1.2 GHz2 / 2 cores Cortex-A9
Marvell PXA9861.2 GHz2 / 2 cores Cortex-A9
NXP i.MX 6SLL1 GHz1 / 1 cores Cortex-A9
WonderMedia PRIZM WM89501 GHz1 / 1 cores Cortex-A9
Clock1660 MHz1333 MHz1800 MHz
FSB533533
L2 Cache512 KB512 KB
Cores / Threads1 / 21 / 24 / 4
TDP6.5 Watt5 Watt
Technology45 nm45 nm28 nm
max. Temp.100 °C
SocketFCBGA559FCBGA559
Featuresintegrated DDR3 memory controller, integrated GMA 3150 GPU, Hyperthreadingintegrated DDR2/DDR3 memory controller, integrated GMA 3150 GPU, HyperthreadingMali-400 MP4 (600 MHz), DDR2/DDR3 Memory Controller (max. 2 GByte)
Architecturex86x86ARM
$64 U.S.
Announced
iGPUARM Mali-400 MP4 (600 MHz)
Manufacturerwww.rock-chips.com

Benchmarks

Cinebench R10 - Cinebench R10 Rend. Single (32bit)
100%
1 N455 +
min: 509     avg: 547     median: 564 (3%)     max: 568 Points
Cinebench R10 - Cinebench R10 Rend. Multi (32bit)
100%
1 N455 +
min: 840     avg: 856     median: 863 (1%)     max: 866 Points
wPrime 2.10 - wPrime 2.0 1024m *
100%
1 N455 +
min: 3712     avg: 3751     median: 3750.5 (44%)     max: 3789 s
wPrime 2.10 - wPrime 2.0 32m *
100%
1 N455 +
min: 118     avg: 119.5     median: 119.5 (24%)     max: 121 s
3DMark 06 - CPU - 3DMark 06 - CPU
100%
1 N455 +
min: 445     avg: 476.7     median: 490 (1%)     max: 495 Points
Super Pi mod 1.5 XS 1M - Super Pi mod 1.5 XS 1M *
100%
1 N455 +
min: 92     avg: 94     median: 95 (21%)     max: 95 s
Super Pi mod 1.5 XS 2M - Super Pi mod 1.5 XS 2M *
100%
1 N455 +
min: 202     avg: 213.7     median: 207 (9%)     max: 232 s
Super Pi Mod 1.5 XS 32M - Super Pi mod 1.5 XS 32M *
100%
1 N455 +
min: 4417     avg: 4523     median: 4533 (20%)     max: 4618 s
SiSoft Sandra Dhrystone (MIPS) - SiSoft Sandra Dhrystone (MIPS)
100%
1 N455 +
min: 4196     avg: 4197     median: 4198 (2%)     max: 4198 MIPS
SiSoft Sandra Whetstone (MFLOPS) - SiSoft Sandra Whetstone (MFLOPS)
100%
1 N455 +
min: 3505     avg: 3506     median: 3506 (3%)     max: 3506 MFLOPS
PCMark 05 - PCMark 05 - Standard
100%
1 N455 +
min: 1261     avg: 1317     median: 1266 (3%)     max: 1423 Points
Windows 7 Experience Index - Win7 CPU
100%
1 N455 +
min: 2.3     avg: 2.3     median: 2.3 (29%)     max: 2.4 Points
3DMark - 3DMark Ice Storm Physics
100%
1 RK3188 +
min: 5828     avg: 7773     median: 7936 (6%)     max: 8887 Points
3DMark - 3DMark Ice Storm Extreme Physics
100%
1 RK3188 +
min: 5434     avg: 7724     median: 8025.5 (7%)     max: 8812 Points
3DMark - 3DMark Ice Storm Unlimited Physics
100%
1 RK3188 +
min: 9142     avg: 9821     median: 9821 (8%)     max: 10500 Points
Geekbench 3 - Geekbench 3 32 Bit Multi-Core
100%
1 RK3188 +
min: 1316     avg: 1410     median: 1421 (3%)     max: 1493 Points
Geekbench 3 - Geekbench 3 32 Bit Single-Core
100%
1 RK3188 +
min: 476     avg: 498.7     median: 504 (10%)     max: 516 Points
Geekbench 2 - 32 Bit - Geekbench Stream
100%
1 RK3188 +
min: 182     avg: 320     median: 272 (2%)     max: 506 Points
Geekbench 2 - 32 Bit - Geekbench Memory
100%
1 RK3188 +
min: 326     avg: 687     median: 803 (7%)     max: 933 Points
Geekbench 2 - 32 Bit - Geekbench Floating Point
100%
1 RK3188 +
min: 1769     avg: 2044     median: 2035 (4%)     max: 2328 Points
Geekbench 2 - 32 Bit - Geekbench Integer
100%
1 RK3188 +
min: 924     avg: 1123     median: 1104 (2%)     max: 1341 Points
Geekbench 2 - 32 Bit - Geekbench Total Score
100%
1 RK3188 +
min: 1130     avg: 1275     median: 1182 (3%)     max: 1512 Points
Linpack Android / IOS - Linpack Multi Thread
100%
1 RK3188 +
min: 130     avg: 131.1     median: 131.1 (4%)     max: 132.1 MFLOPS
Linpack Android / IOS - Linpack Single Thread
100%
1 RK3188 +
min: 54.9     avg: 57.2     median: 57.2 (6%)     max: 59.4 MFLOPS
Mozilla Kraken 1.1 - Kraken 1.1 Total Score *
100%
1 RK3188 +
13698 ms (16%)
Sunspider - Sunspider 1.0 Total Score *
100%
1 RK3188 +
min: 849     avg: 1179     median: 1240 (14%)     max: 1388 ms
Sunspider - Sunspider 0.9.1 Total Score *
100%
1 RK3188 +
min: 702     avg: 986     median: 1086 (10%)     max: 1170 ms
Octane V2 - Octane V2 Total Score
100%
1 RK3188 +
min: 3092     avg: 3094     median: 3093.5 (3%)     max: 3095 Points
Quadrant Standard Edition 2.0 - Quadrant Standard 2.0 Total Score
100%
1 RK3188 +
5287 points (12%)
AnTuTu v3 - AnTuTu v3 CPU
100%
1 RK3188 +
min: 7505     avg: 7723     median: 7807 (51%)     max: 7856 Points
AnTuTu v4 - AnTuTu v4 Total Score
100%
1 RK3188 +
min: 2139     avg: 14154     median: 19571 (46%)     max: 20752 Points
AndEBench - AndEBench Java
100%
1 RK3188 +
min: 179     avg: 329     median: 374 (11%)     max: 434 Iter./s
AndEBench - AndEBench Native
100%
1 RK3188 +
min: 10329     avg: 11213     median: 11588 (38%)     max: 11722 Iter./s
PassMark PerformanceTest Mobile V1 - PerformanceTest Mobile V1 CPU Tests
100%
1 RK3188 +
min: 9258     avg: 10743     median: 10965 (1%)     max: 11782 Points

Average Benchmarks Intel Atom N455 → 0% n=

Average Benchmarks Rockchip RK3188 → 0% n=

- Range of benchmark values for this graphics card
- Average benchmark values for this graphics card
* Smaller numbers mean a higher performance
1 This benchmark is not used for the average calculation

v1.26
log 25. 19:40:24

#0 checking url part for id 602 +0s ... 0s

#1 checking url part for id 2692 +0s ... 0s

#2 checking url part for id 4137 +0s ... 0s

#3 not redirecting to Ajax server +0s ... 0s

#4 did not recreate cache, as it is less than 5 days old! Created at Thu, 25 Apr 2024 05:38:32 +0200 +0.001s ... 0.001s

#5 composed specs +0.057s ... 0.058s

#6 did output specs +0s ... 0.058s

#7 getting avg benchmarks for device 602 +0.003s ... 0.061s

#8 got single benchmarks 602 +0.05s ... 0.111s

#9 getting avg benchmarks for device 2692 +0.003s ... 0.113s

#10 got single benchmarks 2692 +0.006s ... 0.119s

#11 getting avg benchmarks for device 4137 +0.003s ... 0.122s

#12 got single benchmarks 4137 +0.025s ... 0.147s

#13 got avg benchmarks for devices +0s ... 0.147s

#14 min, max, avg, median took s +0.093s ... 0.24s

#15 return log +0s ... 0.24s

Please share our article, every link counts!
> Expert Reviews and News on Laptops, Smartphones and Tech Innovations > Benchmarks / Tech > Processor Comparison - Head 2 Head
Redaktion, 2017-09- 8 (Update: 2023-07- 1)