Notebookcheck Logo

Intel Atom N435 vs HiSilicon k3v2 Hi3620 vs Apple A6

Intel Atom N435

► remove from comparison Intel N435

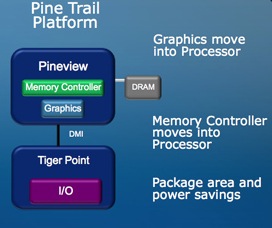
The Intel Atom N435 is a small and cheap entry level CPU for Netbooks and small laptops. In the package is an integrated memory controller for DDR2/DDR3 main memory and the GMA 3150 graphics card

The performance of the whole system (Atom N435 and integrated GMA 3150) is only sufficient for basic tasks like surfing the web, or office working. HD video, video cutting, advanced photo editing, multitasking and of course gaming may overstrain the GPU and CPU. Compared to the previous Atom generation, the performance of the CPU is on a level with the slow Atom Z520.

An advantage of the interation, is the small overall power consumption of the CPU, GPU and memory controller (only 5 Watt TDP). Therefore, the chip is ideally used in small Netbooks and thin laptops.

HiSilicon k3v2 Hi3620

► remove from comparison

Coretex A9 Quad-Core - max 1.5 GHz, im Huawei Mediapad 10 FHD mit 1.2 GHz

Apple A6

► remove from comparison

The Apple A6 is a dual-core SoC found in the iPhone 5 with ARM compatible CPU cores. The A6 was developed by Apple and supports the extended ARMv7s instruction set. The clock rate of the CPU is between 800 to 1200 MHz depending on the CPU load. The integrated GPU is a PowerVR SGX543MP3 at 266 MHz.

ModelIntel Atom N435HiSilicon k3v2 Hi3620Apple A6
SeriesIntel Atom Apple
CodenamePinetrail
Series:
Intel Atom D5251.8 GHz2 / 4 cores
Intel Atom N4551.66 GHz1 / 2 cores
Intel Atom N4501.66 GHz1 / 2 cores
Intel Atom N435 « 1.33 GHz1 / 2 cores
HiSilicon Kirin 9000W1.53 - 2.49 GHz12 / 12 cores
UNISOC Tiger T3101.8 - 2 GHz4 / 4 cores
Rockchip RK32881.8 GHz4 / 4 cores
Apple A6x1.4 GHzcores
Apple A61 GHzcores
Apple S52 / 2 cores
HiSilicon k3v2 Hi3620 « 1.2 GHz4 / 4 cores
Rockchip RK3066 1.5 GHz1.5 GHz2 / 2 cores
Amlogic AML8726-MX1.5 GHz2 / 2 cores
Rockchip RK31681.2 GHz2 / 2 cores
Rockchip RK2918 1.2 GHz1.2 GHz1 / 1 cores
ARM Cortex A8 1.2 GHz1.2 GHz1 / 1 cores
Telechips TCC8803 1GHz1 GHz1 / 1 cores
Loongson 2F 900MHz0.9 GHz1 / 1 cores
CSR86700.08 GHzcores
ARM Cortex-M4 cores
HiSilicon Hi6262 cores
DK3.5+STcores
unknown cores
HiSilicon Kirin 9000W1.53 - 2.49 GHz12 / 12 cores
UNISOC Tiger T3101.8 - 2 GHz4 / 4 cores
Rockchip RK32881.8 GHz4 / 4 cores
Apple A6x1.4 GHzcores
Apple A6 « 1 GHzcores
Apple S52 / 2 cores
HiSilicon k3v2 Hi36201.2 GHz4 / 4 cores
Rockchip RK3066 1.5 GHz1.5 GHz2 / 2 cores
Amlogic AML8726-MX1.5 GHz2 / 2 cores
Rockchip RK31681.2 GHz2 / 2 cores
Rockchip RK2918 1.2 GHz1.2 GHz1 / 1 cores
ARM Cortex A8 1.2 GHz1.2 GHz1 / 1 cores
Telechips TCC8803 1GHz1 GHz1 / 1 cores
Loongson 2F 900MHz0.9 GHz1 / 1 cores
CSR86700.08 GHzcores
ARM Cortex-M4 cores
HiSilicon Hi6262 cores
DK3.5+STcores
unknown cores
Clock1333 MHz1200 MHz1000 MHz
FSB533
L2 Cache512 KB
Cores / Threads1 / 24 / 42
TDP5 Watt
Technology45 nm40 nm32 nm
SocketFCBGA559
Featuresintegrated DDR2/DDR3 memory controller, integrated GMA 3150 GPU, HyperthreadingARMv7
Architecturex86ARMARM
Announced

Benchmarks

3DMark - 3DMark Ice Storm Physics
min: 3209     avg: 4477     median: 4894 (4%)     max: 5167 Points
163%
1 A6 +
7961 Points (6%)
3DMark - 3DMark Ice Storm Extreme Physics
min: 5354     avg: 5357     median: 5357 (4%)     max: 5360 Points
146%
1 A6 +
7816 Points (6%)
Geekbench 3 - Geekbench 3 32 Bit Multi-Core
1094 Points (2%)
116%
1 A6 +
1273 Points (2%)
Geekbench 3 - Geekbench 3 32 Bit Single-Core
327 Points (6%)
216%
1 A6 +
min: 701     avg: 706     median: 705.5 (14%)     max: 710 Points
Geekbench 2 - 32 Bit - Geekbench Stream
min: 439     avg: 489.9     median: 500 (4%)     max: 547 Points
188%
1 A6 +
940 Points (8%)
Geekbench 2 - 32 Bit - Geekbench Memory
min: 940     avg: 1187     median: 1218 (11%)     max: 1290 Points
153%
1 A6 +
1867 Points (17%)
Geekbench 2 - 32 Bit - Geekbench Floating Point
min: 1793     avg: 2360     median: 2351 (5%)     max: 2731 Points
90%
1 A6 +
2114 Points (4%)
Geekbench 2 - 32 Bit - Geekbench Integer
min: 1000     avg: 1317     median: 1275 (3%)     max: 1591 Points
99%
1 A6 +
1261 Points (3%)
Geekbench 2 - 32 Bit - Geekbench Total Score
min: 1209     avg: 1573     median: 1557 (4%)     max: 1819 Points
106%
1 A6 +
1648 Points (4%)
Linpack Android / IOS - Linpack Multi Thread
min: 92.3     avg: 133.3     median: 138.1 (5%)     max: 151.8 MFLOPS
384%
1 A6 +
min: 484     avg: 530     median: 529.5 (18%)     max: 575 MFLOPS
Linpack Android / IOS - Linpack Single Thread
min: 37.8     avg: 44.2     median: 46.6 (5%)     max: 48.71 MFLOPS
723%
1 A6 +
min: 309.4     avg: 337.3     median: 337.3 (33%)     max: 365.2 MFLOPS
Mozilla Kraken 1.1 - Kraken 1.1 Total Score *
26477 ms (31%)
120%
1 A6 +
14535 ms (17%)
Sunspider - Sunspider 1.0 Total Score *
min: 856     avg: 2197     median: 1610 (18%)     max: 4026 ms
112%
1 A6 +
min: 714     avg: 722     median: 722 (8%)     max: 730 ms
Sunspider - Sunspider 0.9.1 Total Score *
min: 1522     avg: 1643     median: 1540 (15%)     max: 2080 ms
107%
1 A6 +
935 ms (9%)
Quadrant Standard Edition 2.0 - Quadrant Standard 2.0 Total Score
min: 4404     avg: 4736     median: 4736 (11%)     max: 5068 points
AnTuTu v3 - AnTuTu v3 CPU
min: 4820     avg: 5667     median: 5662 (37%)     max: 6713 Points
AnTuTu v4 - AnTuTu v4 Total Score
14434 Points (34%)
AndEBench - AndEBench Java
min: 92     avg: 191     median: 191 (6%)     max: 290 Iter./s
AndEBench - AndEBench Native
min: 8740     avg: 8897     median: 8897 (29%)     max: 9054 Iter./s
PassMark PerformanceTest Mobile V1 - PerformanceTest Mobile V1 CPU Tests
min: 8223     avg: 8737     median: 8678 (1%)     max: 9118 Points
288%
1 A6 +
24996 Points (3%)

Average Benchmarks HiSilicon k3v2 Hi3620 → 0% n=

Average Benchmarks Apple A6 → 0% n=

- Range of benchmark values for this graphics card
- Average benchmark values for this graphics card
* Smaller numbers mean a higher performance
1 This benchmark is not used for the average calculation

v1.26
log 24. 17:38:44

#0 checking url part for id 2692 +0s ... 0s

#1 checking url part for id 3613 +0s ... 0s

#2 checking url part for id 3551 +0s ... 0s

#3 not redirecting to Ajax server +0s ... 0s

#4 did not recreate cache, as it is less than 5 days old! Created at Tue, 23 Apr 2024 05:40:15 +0200 +0.001s ... 0.001s

#5 composed specs +0.089s ... 0.089s

#6 did output specs +0s ... 0.089s

#7 getting avg benchmarks for device 2692 +0.003s ... 0.092s

#8 got single benchmarks 2692 +0.007s ... 0.099s

#9 getting avg benchmarks for device 3613 +0.003s ... 0.102s

#10 got single benchmarks 3613 +0.015s ... 0.117s

#11 getting avg benchmarks for device 3551 +0.003s ... 0.119s

#12 got single benchmarks 3551 +0.007s ... 0.127s

#13 got avg benchmarks for devices +0s ... 0.127s

#14 min, max, avg, median took s +0.076s ... 0.202s

#15 return log +0s ... 0.202s

Please share our article, every link counts!
> Expert Reviews and News on Laptops, Smartphones and Tech Innovations > Benchmarks / Tech > Processor Comparison - Head 2 Head
Redaktion, 2017-09- 8 (Update: 2023-07- 1)