 Deutsch
 English
 Español
 Français
 Italiano
 Nederlands
 Polski
 Português
 Русский
 Türkçe
 Svenska
 Chinese
 Magyar
Intel Celeron N3000 vs Intel Celeron N3150 vs Intel Celeron N3050
Intel Celeron N3000
► remove from comparison
The Intel Celeron N3000 is a low-end dual-core SoC for notebooks, which has been presented in April 2015. It is clocked at 1.04 - 2.08 GHz and part of the Braswell platform. Thanks to its new 14 nanometer low-power process (P1273) with tri-gate transistors, energy efficiency has been significantly improved compared to its predecessor Bay Trail (e.g. Celeron N2840). In addition to the CPU cores, the SoC offers a DirectX 11.2-capable GPU as well as a DDR3L Memory Controller (2x 64 bit, 25.6 GB/s).
Architecture
The processor cores are based on the Airmont architecture, which is basically a slightly modified shrink of the previous Silvermont core. While performance per clock (IPC) has not been improved, the more efficient 14 nm process may lead to a better utilization of the CPU Burst (alias Turbo Boost) and therefore a somewhat higher performance in certain situations.
Performance
Due to only two CPU cores, low clock rates and the weak IPC, the Celeron N3000 is not sufficient for demanding applications and may even struggle on complex websites. Overall, performance is similar to the old Celeron N2810.
Graphics
The HD Graphics (Braswell) is based on the Intel Gen8 architecture, which supports DirectX 11.2 and is also found in the Broadwell series (e.g. HD Graphics 5300). With 12 EUs (Execution Units) and a clock speed of up to 600 MHz, the GPU is significantly faster as the HD Graphics (Bay Trail), but still not powerful enough to handle modern 3D games. The GPU also supports 4K/H.265 video acceleration.
Power Consumption
The entire SoC is rated at an TDP of 4 watts (SDP 3 watts). Thus, the chip can be cooled passively.
Intel Celeron N3150
► remove from comparison
The Intel Celeron N3150 is a quad-core SoC for entry-level notebooks, which has been presented in early 2015. It is clocked at 1.6 - 2.08 GHz and part of the Braswell platform. Thanks to its new 14 nanometer low-power process (P1273) with tri-gate transistors, energy efficiency has been significantly improved compared to its predecessor Bay Trail (e.g. Celeron N2930). In addition to the CPU cores, the SoC offers a DirectX 11.2-capable GPU as well as a DDR3L Memory Controller (2x 64 bit, 25.6 GB/s).
Architecture
The processor cores are based on the Airmont architecture, which is basically a slightly modified shrink of the previous Silvermont core. While performance per clock has not been improved, the more efficient 14 nm process may lead to a better utilization of the CPU Burst (alias Turbo Boost) and therefore a somewhat higher performance in certain situations.
Performance
Compared to its predecessor Celeron N2930 (1.8 - 2.2 GHz) or the competing AMD APU E2-6110, the N3150 offers an almost identical performance. Using Windows, the CPU is adequate for everyday tasks such as Internet browsing or office applications, but may struggle in more demanding software.
Graphics
The HD Graphics (Braswell) is based on the Intel Gen8 architecture, which supports DirectX 11.2 and is also found in the Broadwell series (e.g. HD Graphics 5300). With 12 EUs (Execution Units) and a clock speed of up to 640 MHz, the GPU is almost twice as fast as the HD Graphics (Bay Trail), but still not powerful enough to handle demanding 3D games of 2015. The GPU also supports 4K/H.265 video acceleration.
Power Consumption
The entire SoC is rated at an TDP of 6 watts (SDP 4 watts). Thus, the chip can be cooled passively.
Intel Celeron N3050
► remove from comparison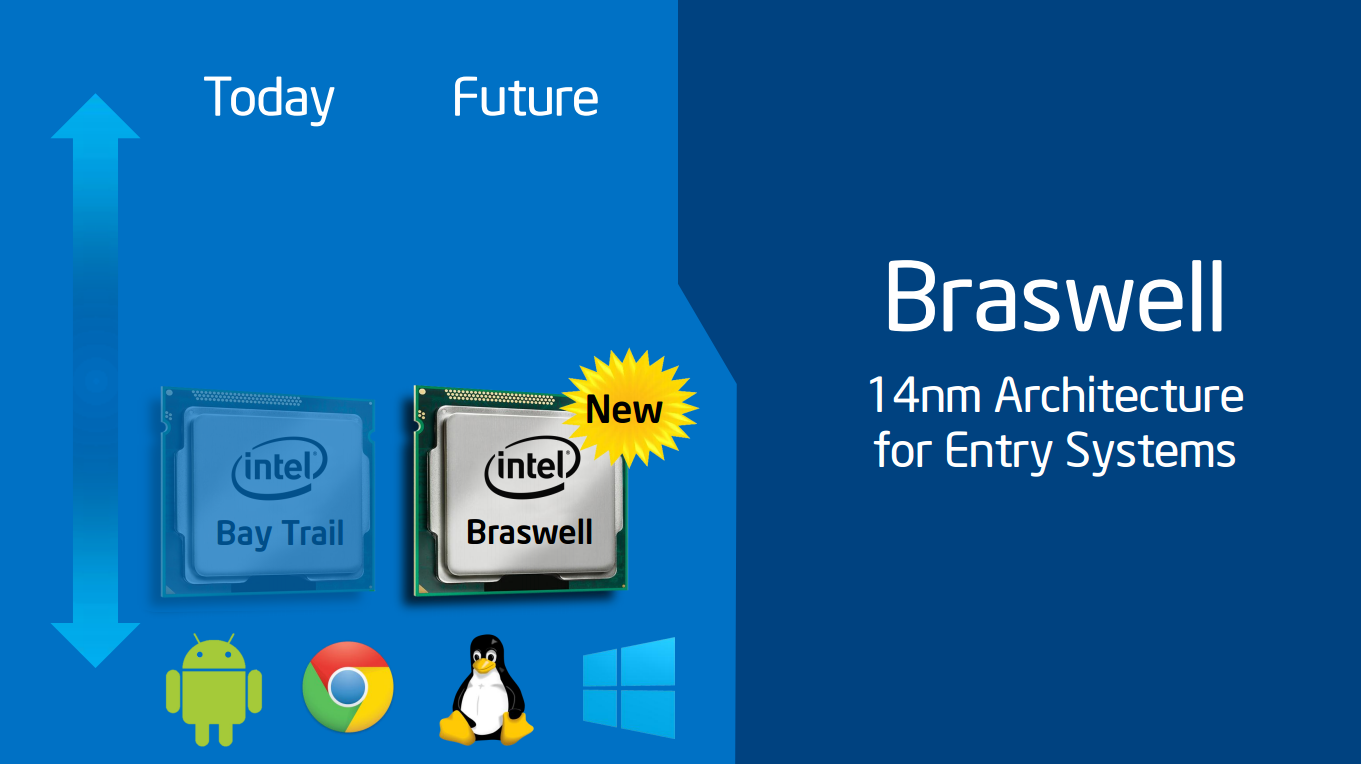
The Intel Celeron N3050 is a low-end dual-core SoC for notebooks, which has been presented in April 2015. It is clocked at 1.6 - 2.16 GHz and part of the Braswell platform. Thanks to its new 14 nanometer low-power process (P1273) with tri-gate transistors, energy efficiency has been significantly improved compared to its predecessor Bay Trail (e.g. Celeron N2840). In addition to the CPU cores, the SoC offers a DirectX 11.2-capable GPU as well as a DDR3L Memory Controller (2x 64 bit, 25.6 GB/s).
Architecture
The processor cores are based on the Airmont architecture, which is basically a slightly modified shrink of the previous Silvermont core. While performance per clock has not been improved, the more efficient 14 nm process leads to a better utilization of the CPU Burst (alias Turbo Boost) and a therefore somewhat higher overall performance.
Performance
Compared to its predecessor Celeron N2815 (1.86 - 2.13 GHz), the N3050 offers an almost identical performance. Using Windows, the CPU is adequate for simple everyday tasks such as light Internet browsing or office applications, but not for complex software or modern games.
Graphics
The HD Graphics (Braswell) is based on the Intel Gen8 architecture, which supports DirectX 11.2 and is also found in the Broadwell series (e.g. HD Graphics 5300). With 12 EUs (Execution Units) and a clock speed of up to 600 MHz, the GPU is almost twice as fast as the HD Graphics (Bay Trail), but still not powerful enough to handle modern 3D games. The GPU also supports 4K/H.265 video acceleration.
Power Consumption
The entire SoC is rated at an TDP of 6 watts (SDP 4 watts). Thus, the chip can be cooled passively.
| Model | Intel Celeron N3000 | Intel Celeron N3150 | Intel Celeron N3050 | ||||||||||||||||||||||||||||||||||||||||||||||||||||||||||||
| Series | Intel Celeron | Intel Celeron | Intel Celeron | ||||||||||||||||||||||||||||||||||||||||||||||||||||||||||||
| Codename | Braswell | Braswell | Braswell | ||||||||||||||||||||||||||||||||||||||||||||||||||||||||||||
| Series: Celeron Braswell |
|
|
| ||||||||||||||||||||||||||||||||||||||||||||||||||||||||||||
| Clock | 1040 - 2080 MHz | 1600 - 2080 MHz | 1600 - 2160 MHz | ||||||||||||||||||||||||||||||||||||||||||||||||||||||||||||
| L2 Cache | 2 MB | 2 MB | 2 MB | ||||||||||||||||||||||||||||||||||||||||||||||||||||||||||||
| Cores / Threads | 2 / 2 | 4 / 4 | 2 / 2 | ||||||||||||||||||||||||||||||||||||||||||||||||||||||||||||
| TDP | 4 Watt | 6 Watt | 6 Watt | ||||||||||||||||||||||||||||||||||||||||||||||||||||||||||||
| Technology | 14 nm | 14 nm | 14 nm | ||||||||||||||||||||||||||||||||||||||||||||||||||||||||||||
| max. Temp. | 90 °C | 90 °C | 90 °C | ||||||||||||||||||||||||||||||||||||||||||||||||||||||||||||
| Socket | FCBGA1170 | FCBGA1170 | FCBGA1170 | ||||||||||||||||||||||||||||||||||||||||||||||||||||||||||||
| Features | Intel HD Graphics (Braswell, 12 EUs, 320 - 600 MHz), Wireless Display, Quick Sync, AES-NI, max. 8 GB Dual-Channel DDR3L-1600 (25,6 GB/s), 5x USB 3.0, 4x PCIe 2.0, 2x SATA 6.0 Gbit/s | Intel HD Graphics (Braswell, 12 EUs, 320 - 640 MHz), Wireless Display, Quick Sync, AES-NI, max. 8 GB Dual-Channel DDR3L-1600 (25,6 GB/s), 5x USB 3.0, 4x PCIe 2.0, 2x SATA 6.0 Gbit/s | Intel HD Graphics (Braswell, 12 EUs, 320 - 600 MHz), Wireless Display, Quick Sync, AES-NI, max. 8 GB Dual-Channel DDR3L-1600 (25,6 GB/s), 5x USB 3.0, 4x PCIe 2.0, 2x SATA 6.0 Gbit/s | ||||||||||||||||||||||||||||||||||||||||||||||||||||||||||||
| iGPU | Intel HD Graphics (Braswell) (320 - 600 MHz) | Intel HD Graphics (Braswell) (320 - 640 MHz) | Intel HD Graphics (Braswell) (320 - 600 MHz) | ||||||||||||||||||||||||||||||||||||||||||||||||||||||||||||
| Architecture | x86 | x86 | x86 | ||||||||||||||||||||||||||||||||||||||||||||||||||||||||||||
| $107 U.S. | $107 U.S. | $107 U.S. | |||||||||||||||||||||||||||||||||||||||||||||||||||||||||||||
| Announced | |||||||||||||||||||||||||||||||||||||||||||||||||||||||||||||||
| Manufacturer | ark.intel.com | ark.intel.com | ark.intel.com |
