The Intel Celeron N2815 is a power efficient dual-core SoC for entry-level notebooks. It is clocked at 1.86 - 2.13 GHz and part of the Bay Trail-M platform. Thanks to the specially optimized 22 nanometer low-power process (P1271) with tri-gate transistors, performance and energy efficiency have been significantly improved compared to previous Intel Atom CPUs.
Architecture
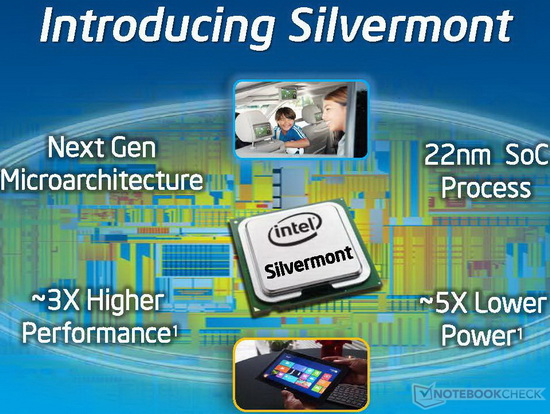
The processor cores are based on the new Silvermont architecture, which is an out-of-order design for the first time. The increased utilization of the pipeline and many other improvements (optimized branch prediction, increased buffers, enhanced decoders) have increased the performance per clock by about 50 percent. At the same time, however, the Hyper-Threading feature of the previous generation has been removed. Other major changes are the support for new instruction set extensions such as SSE 4.1 and 4.2 as well as AES-NI (depending on the model).
Performance
Thanks to the improved performance per clock, the Celeron N2815 is faster than previous Intel Atoms, e.g. the N2800. According to our benchmarks, the N2815 even competes with AMD APUs like the AMD A4-4355M. For simple everyday tasks such as Internet or Office the performance is adequate, but not for complex software or modern games.
Graphics
The graphics unit of Bay Trail is based on the Intel Gen7 architecture, which supports DirectX 11 and is also found in the Ivy Bridge series (e.g. HD Graphics 4000). With only 4 EUs (Execution Units) and a relatively low clock speed of up to 756 MHz, the GPU is even slower than the HD Graphics (Ivy Bridge). Therefore, only older and less demanding games will run fluently.
Power Consumption
The entire SoC is rated at a TDP of 7.5 watts. Thus, the chip can be used in compact subnotebooks.
The Intel Celeron N2820 is a power efficient dual-core SoC for entry-level notebooks. It is clocked at up to 2.4 GHz and part of the Bay Trail-M platform. Thanks to the specially optimized 22 nanometer low-power process (P1271) with tri-gate transistors, performance and energy efficiency have been significantly improved compared to previous Intel Atom CPUs.
Architecture
The processor cores are based on the new Silvermont architecture, which is an out-of-order design for the first time. The increased utilization of the pipeline and many other improvements (optimized branch prediction, increased buffers, enhanced decoders) have increased the performance per clock by about 50 percent. At the same time, however, the Hyper-Threading feature of the previous generation has been removed. Other major changes are the support for new instruction set extensions such as SSE 4.1 and 4.2 as well as AES-NI (depending on the model).
Performance
Thanks to the improved performance per clock, the Celeron N2820 is faster than previous Intel Atoms, e.g. the N2850. Therefore, the N2820 even competes with entry-level AMD APUs like the AMD E1-2500. For simple everyday tasks such as Internet or Office the performance is adequate, but not for complex software or modern games.
Graphics
The graphics unit of Bay Trail is based on the Intel Gen7 architecture, which supports DirectX 11 and is also found in the Ivy Bridge series (e.g. HD Graphics 4000). With only 4 EUs (Execution Units) and a relatively low clock speed of up to 756 MHz, the GPU is even slower than the HD Graphics (Ivy Bridge). Therefore, only older and less demanding games will run fluently.
Power Consumption
The entire SoC is rated at a TDP of 7.5 watts. Thus, the chip can be used in compact subnotebooks.
The Intel Celeron N2930 is a power efficient quad-core SoC for entry-level notebooks. It is clocked at 1.83 - 2.16 GHz and part of the Bay Trail-M platform. Thanks to the specially optimized 22 nanometer low-power process (P1271) with tri-gate transistors, performance and energy efficiency have been significantly improved compared to previous Intel Atom CPUs. The N2930 supports Quick Sync as well as Wireless Display.
Architecture
The processor cores are based on the new Silvermont architecture, which is an out-of-order design for the first time. The increased utilization of the pipeline and many other improvements (optimized branch prediction, increased buffers, enhanced decoders) have increased the performance per clock by about 50 percent. At the same time, however, the Hyper-Threading feature of the previous generation has been removed. Other major changes are the support for new instruction set extensions such as SSE 4.1 and 4.2 as well as AES-NI (depending on the model).
Performance
Thanks to the improved performance per clock and the 4 cores, the Celeron N2930 is significantly faster than previous Intel Atoms, e.g. the N2800. Depending on the benchmark, the N2930 competes with AMD Kabini APUs like the A4-5000. For most everyday tasks such as Internet or Office the performance is adequate, but not for complex software or modern games.
Graphics
The HD Graphics (Bay Trail) is based on the Intel Gen7 architecture, which supports DirectX 11 and is also found in the Ivy Bridge series (e.g. HD Graphics 4000). With only 4 EUs (Execution Units) and a relatively low clock speed of 313 - 854 MHz, the GPU is even slower than the HD Graphics (Ivy Bridge). Therefore, only older and less demanding games will run fluently.
Power Consumption
The entire SoC is rated at a TDP of 7.5 watts. Thus, the chip can be used in compact (and sometimes even passively cooled) subnotebooks and tablets.
- Range of benchmark values for this graphics card - Average benchmark values for this graphics card * Smaller numbers mean a higher performance 1 This benchmark is not used for the average calculation
v1.26
log 19. 05:07:46
#0 checking url part for id 4989 +0s ... 0s
#1 checking url part for id 4991 +0s ... 0s
#2 checking url part for id 5686 +0s ... 0s
#3 not redirecting to Ajax server +0s ... 0s
#4 did not recreate cache, as it is less than 5 days old! Created at Tue, 16 Apr 2024 05:37:29 +0200 +0.001s ... 0.001s
#5 composed specs +0.039s ... 0.04s
#6 did output specs +0s ... 0.04s
#7 getting avg benchmarks for device 4989 +0.003s ... 0.043s
#8 got single benchmarks 4989 +0.014s ... 0.056s
#9 getting avg benchmarks for device 4991 +0.018s ... 0.075s
#10 got single benchmarks 4991 +0.017s ... 0.092s
#11 getting avg benchmarks for device 5686 +0.003s ... 0.095s
#12 got single benchmarks 5686 +0.019s ... 0.114s
#13 got avg benchmarks for devices +0s ... 0.114s
#14 min, max, avg, median took s +0.46s ... 0.574s
 Deutsch
 English
 Español
 Français
 Italiano
 Nederlands
 Polski
 Português
 Русский
 Türkçe
 Svenska
 Chinese
 Magyar