ARM Mali-T760 MP2 vs ARM Mali-T720 MP2
ARM Mali-T760 MP2 ► remove from comparison
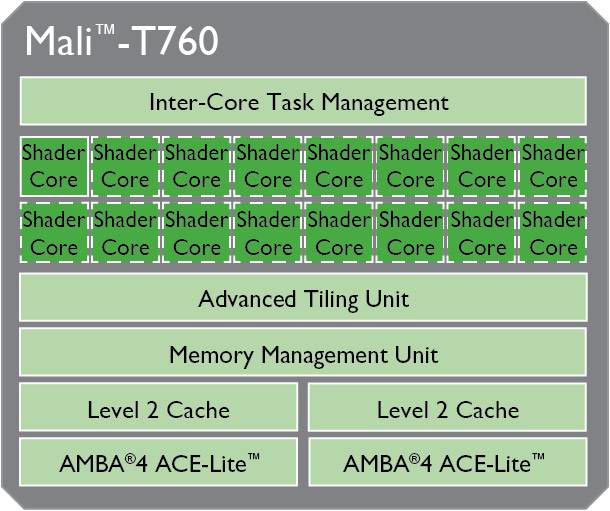
The ARM Mali-T760 MP2 is a mobile graphics solution for (mostly Android based) smartphones and tablets. The chip is available since Q1/2015 and for example integrated in the MediaTek MT6752 SoC. Besides OpenGL ES 3.1, the GPU supports OpenCL 1.1 as well as DirectX 11. According to ARM, the Mali-T760 can be scaled from 1 - 16 cores/clusters.
The MP2 version offers 2 clusters clocked at up to 700 MHz (48 GFLOPS). Therefore, it only offers one third of the theoretical performance of the T760MP6 version. The gaming performance should be similar to the Adreno 405 or PowerVR G6200 . Therefore, it is situated in the middle class in 2014 and all games of that year should run fluently.
Due to the only 2 cores, the GPU is also suited for small tablets and smartphones.
ARM Mali-T720 MP2 ► remove from comparison
The ARM Mali-T720 MP2 is a mobile graphics solution that can be found in ARM SoCs. The chip is available since Q1/2015. Besides OpenGL ES 3.1, the GPU supports OpenCL 1.1 as well as DirectX 11 FL9_3. According to ARM, the Mali-T720 can be scaled from 1 - 8 cores/clusters and clocks up to 650 MHz.
ARM Mali-T760 MP2 ARM Mali-T720 MP2 Mali-T700 Series Codename Midgard (3rd Generation) Midgard (3rd Generation) Architecture Midgard (3rd-gen) Midgard (3rd-gen) Pipelines 2 - unified 2 - unified Core Speed 700 MHz 650 MHz Shared Memory no no API DirectX 11.1, OpenGL ES 3.1 DirectX 9.3, OpenGL ES 3.1 Features OpenGL ES 3.1, OpenCL 1.1, DirectX 11.1, Renderscript, FSAA/MSAA OpenGL ES 3.1, OpenCL 1.1, DirectX 11.1, Renderscript, FSAA/MSAA Date of Announcement 01.10.2013 01.03.2015 Link to Manufacturer Page www.arm.com www.arm.com
Benchmarks 3DMark - 3DMark Ice Storm Unlimited Graphics
min: 7352 avg: 8363 median: 8041 (1%) max: 10019 Points
min: 2789 avg: 4940 median: 4680.5 (1%) max: 7542 Points
3DMark - 3DMark Ice Storm Extreme Graphics
min: 4310 avg: 4909 median: 4794.5 (1%) max: 6047 Points
min: 2646 avg: 3302 median: 2753 (0%) max: 4451 Points
3DMark - 3DMark Ice Storm Graphics
min: 8765 avg: 9158 median: 9135 (1%) max: 9573 Points
min: 2739 avg: 6176 median: 5677 (1%) max: 8329 Points
3DMark - 3DMark Sling Shot (ES 3.0) Unlimited
min: 88 avg: 221.1 median: 238 (1%) max: 333 Points
3DMark - 3DMark Sling Shot (ES 3.0) Unlimited Graphics
min: 70 avg: 182.5 median: 196.5 (0%) max: 273 Points
3DMark - 3DMark Sling Shot Extreme (ES 3.1) Unlimited
min: 38 avg: 140.2 median: 151 (1%) max: 190 Points
3DMark - 3DMark Sling Shot Extreme (ES 3.1) Unlimited Graphics
min: 62 avg: 114.4 median: 123 (0%) max: 154 Points
GFXBench - GFXBench 5.0 Aztec Ruins High Tier Offscreen
0 fps (0%)
GFXBench - GFXBench 5.0 Aztec Ruins Normal Tier Offscreen
0 fps (0%)
GFXBench - GFXBench Car Chase Offscreen
0 fps (0%)
GFXBench 3.1 - GFXBench Manhattan ES 3.1 Offscreen
min: 1.2 avg: 2.2 median: 2.3 (0%) max: 4.4 fps
GFXBench 3.0 - GFXBench 3.0 Manhattan Offscreen
min: 1 avg: 4.4 median: 5 (0%) max: 6.1 fps
min: 1.6 avg: 3.4 median: 3.6 (0%) max: 6.1 fps
GFXBench (DX / GLBenchmark) 2.7 + ARM Mali-T760 MP2 GFXBench (DX / GLBenchmark) 2.7 - GFXBench T-Rex HD Offscreen C24Z16
min: 13.2 avg: 16.1 median: 16 (0%) max: 19.2 fps
GFXBench T-Rex HD Offscreen C24Z16 + ARM Mali-T720 MP2 min: 5 avg: 9.3 median: 9.6 (0%) max: 14 fps
Basemark ES 2.0 - Basemark ES 2.0
min: 31.7 avg: 36.6 median: 36.6 (60%) max: 41.48 fps
min: 25.17 avg: 30.7 median: 32.5 (54%) max: 34.29 fps
Basemark X 1.1 - Basemark X 1.1 High Quality
min: 4327 avg: 4514 median: 4513.5 (10%) max: 4700 Points
min: 2852 avg: 3745 median: 4159 (9%) max: 4224 Points
Basemark X 1.1 - Basemark X 1.1 Medium Quality
min: 10969 avg: 11318 median: 11318 (25%) max: 11667 Points
min: 6359 avg: 7331 median: 7310 (16%) max: 8343 Points
NenaMark2 - NenaMark2 Score
min: 53 avg: 53.7 median: 53.7 (80%) max: 54.4 fps
min: 53.3 avg: 57.7 median: 59.6 (89%) max: 60.3 fps
PassMark PerformanceTest Mobile V1 - PerformanceTest Mobile V1 2D Graphics Tests
min: 3808 avg: 3882 median: 3881.5 (4%) max: 3955 Points
min: 2830 avg: 2950 median: 2914.5 (3%) max: 3140 Points
PassMark PerformanceTest Mobile V1 - PerformanceTest Mobile V1 3D Graphics Tests
min: 1250 avg: 1275 median: 1274.5 (2%) max: 1299 Points
min: 894 avg: 984 median: 956.5 (2%) max: 1128 Points
Smartbench 2012 - Smartbench 2012 Gaming Index
min: 3843 avg: 4239 median: 4320 (94%) max: 4489 Points
min: 2948 avg: 3878 median: 4007 (87%) max: 4368 Points
Average Benchmarks ARM Mali-T760 MP2 → 100% n=12 Average Benchmarks ARM Mali-T720 MP2 → 76% n=12
- Range of benchmark values for this graphics card
- Average benchmark values for this graphics card
* Smaller numbers mean a higher performance
1 This benchmark is not used for the average calculation
Game Benchmarks The following benchmarks stem from our benchmarks of review laptops. The performance depends on the used graphics memory, clock rate, processor, system settings, drivers, and operating systems. So the results don't have to be representative for all laptops with this GPU. For detailed information on the benchmark results, click on the fps number.
Mali-T720 MP2:
59 60 ~ 60 fps
ARM Mali-T720 MP2 low med. high ultra QHD 4K Arena of Valor 32 Dead Trigger 2 33 Asphalt 8: Airborne 27 22 Real Racing 3 58 35 Temple Run 2 60 < 30 fps < 60 fps < 120 fps ≥ 120 fps 1 2 1 2 1
For more games that might be playable and a list of all games and graphics cards visit our Gaming List
v1.26
log 18. 16:47:59
#0 checking url part for id 5997 +0s ... 0s
#1 checking url part for id 6399 +0s ... 0s
#2 not redirecting to Ajax server +0s ... 0s
#3 did not recreate cache, as it is less than 5 days old! Created at Tue, 16 Apr 2024 05:39:00 +0200 +0.001s ... 0.001s
#4 composed specs +0.068s ... 0.069s
#5 did output specs +0s ... 0.069s
#6 start showIntegratedCPUs +0s ... 0.069s
#7 getting avg benchmarks for device 5997 +0.029s ... 0.097s
#8 got single benchmarks 5997 +0.022s ... 0.12s
#9 getting avg benchmarks for device 6399 +0.002s ... 0.121s
#10 got single benchmarks 6399 +0.154s ... 0.275s
#11 got avg benchmarks for devices +0s ... 0.275s
#12 No cached benchmark found, getting uncached values +0.063s ... 0.337s
#13 No cached benchmark found, getting uncached values +0.002s ... 0.339s
#14 No cached benchmark found, getting uncached values +0.002s ... 0.341s
#15 min, max, avg, median took s +0.03s ... 0.371s
#16 before gaming benchmark output +0s ... 0.371s
#17 Got 39 rows for game benchmarks. +0.019s ... 0.39s
#18 composed SQL query for gamebenchmarks +0s ... 0.39s
#19 got data and put it in $dataArray +0.003s ... 0.393s
#20 benchmarks composed for output. +0.011s ... 0.404s
#21 calculated avg scores. +0s ... 0.404s
#22 return log +0.037s ... 0.441s
Please share our article, every link counts!
Redaktion, 2017-09- 8 (Update: 2023-07- 1)
 Deutsch
 English
 Español
 Français
 Italiano
 Nederlands
 Polski
 Português
 Русский
 Türkçe
 Svenska
 Chinese
 Magyar