Notebookcheck Logo

Apple M1 Pro 14-Core GPU vs Apple M1 7-Core GPU

Apple M1 Pro 14-Core GPU

► remove from comparison Apple M1 Pro 14-Core GPU

The Apple M1 Pro 14-Core-GPU is an integrated graphics card by Apple offering 14 of the 16 cores in the M1 Pro Chip. The 1792 ALUs offer a theoretical performance of up to 4.6 Teraflops (16 core variant with 2048 ALUs offers 5.3 Teraflops). 

The graphics card has no dedicated graphics memory but can use the fast LPDDR5-6400 unified memory with a 256 bit bus (up to 200 GBit/s).

The GPU clocks between 389 and 1296 MHz and offers no short term boost (389, 486, 648, 778, 972, 1296 MHz steps according to Powermetrics). The GPU is intended to use Apple Metal 2 API and could still be based on the older PowerVR architectures (last used in the Apple A10).

The Apple M1 Pro is manufactured in the modern 5nm process at TSMC and offers an excellent energy efficiency. According to the internal sensors, the GPU uses 15 Watt under full load.

Apple M1 7-Core GPU

► remove from comparison Apple M1 7-Core GPU

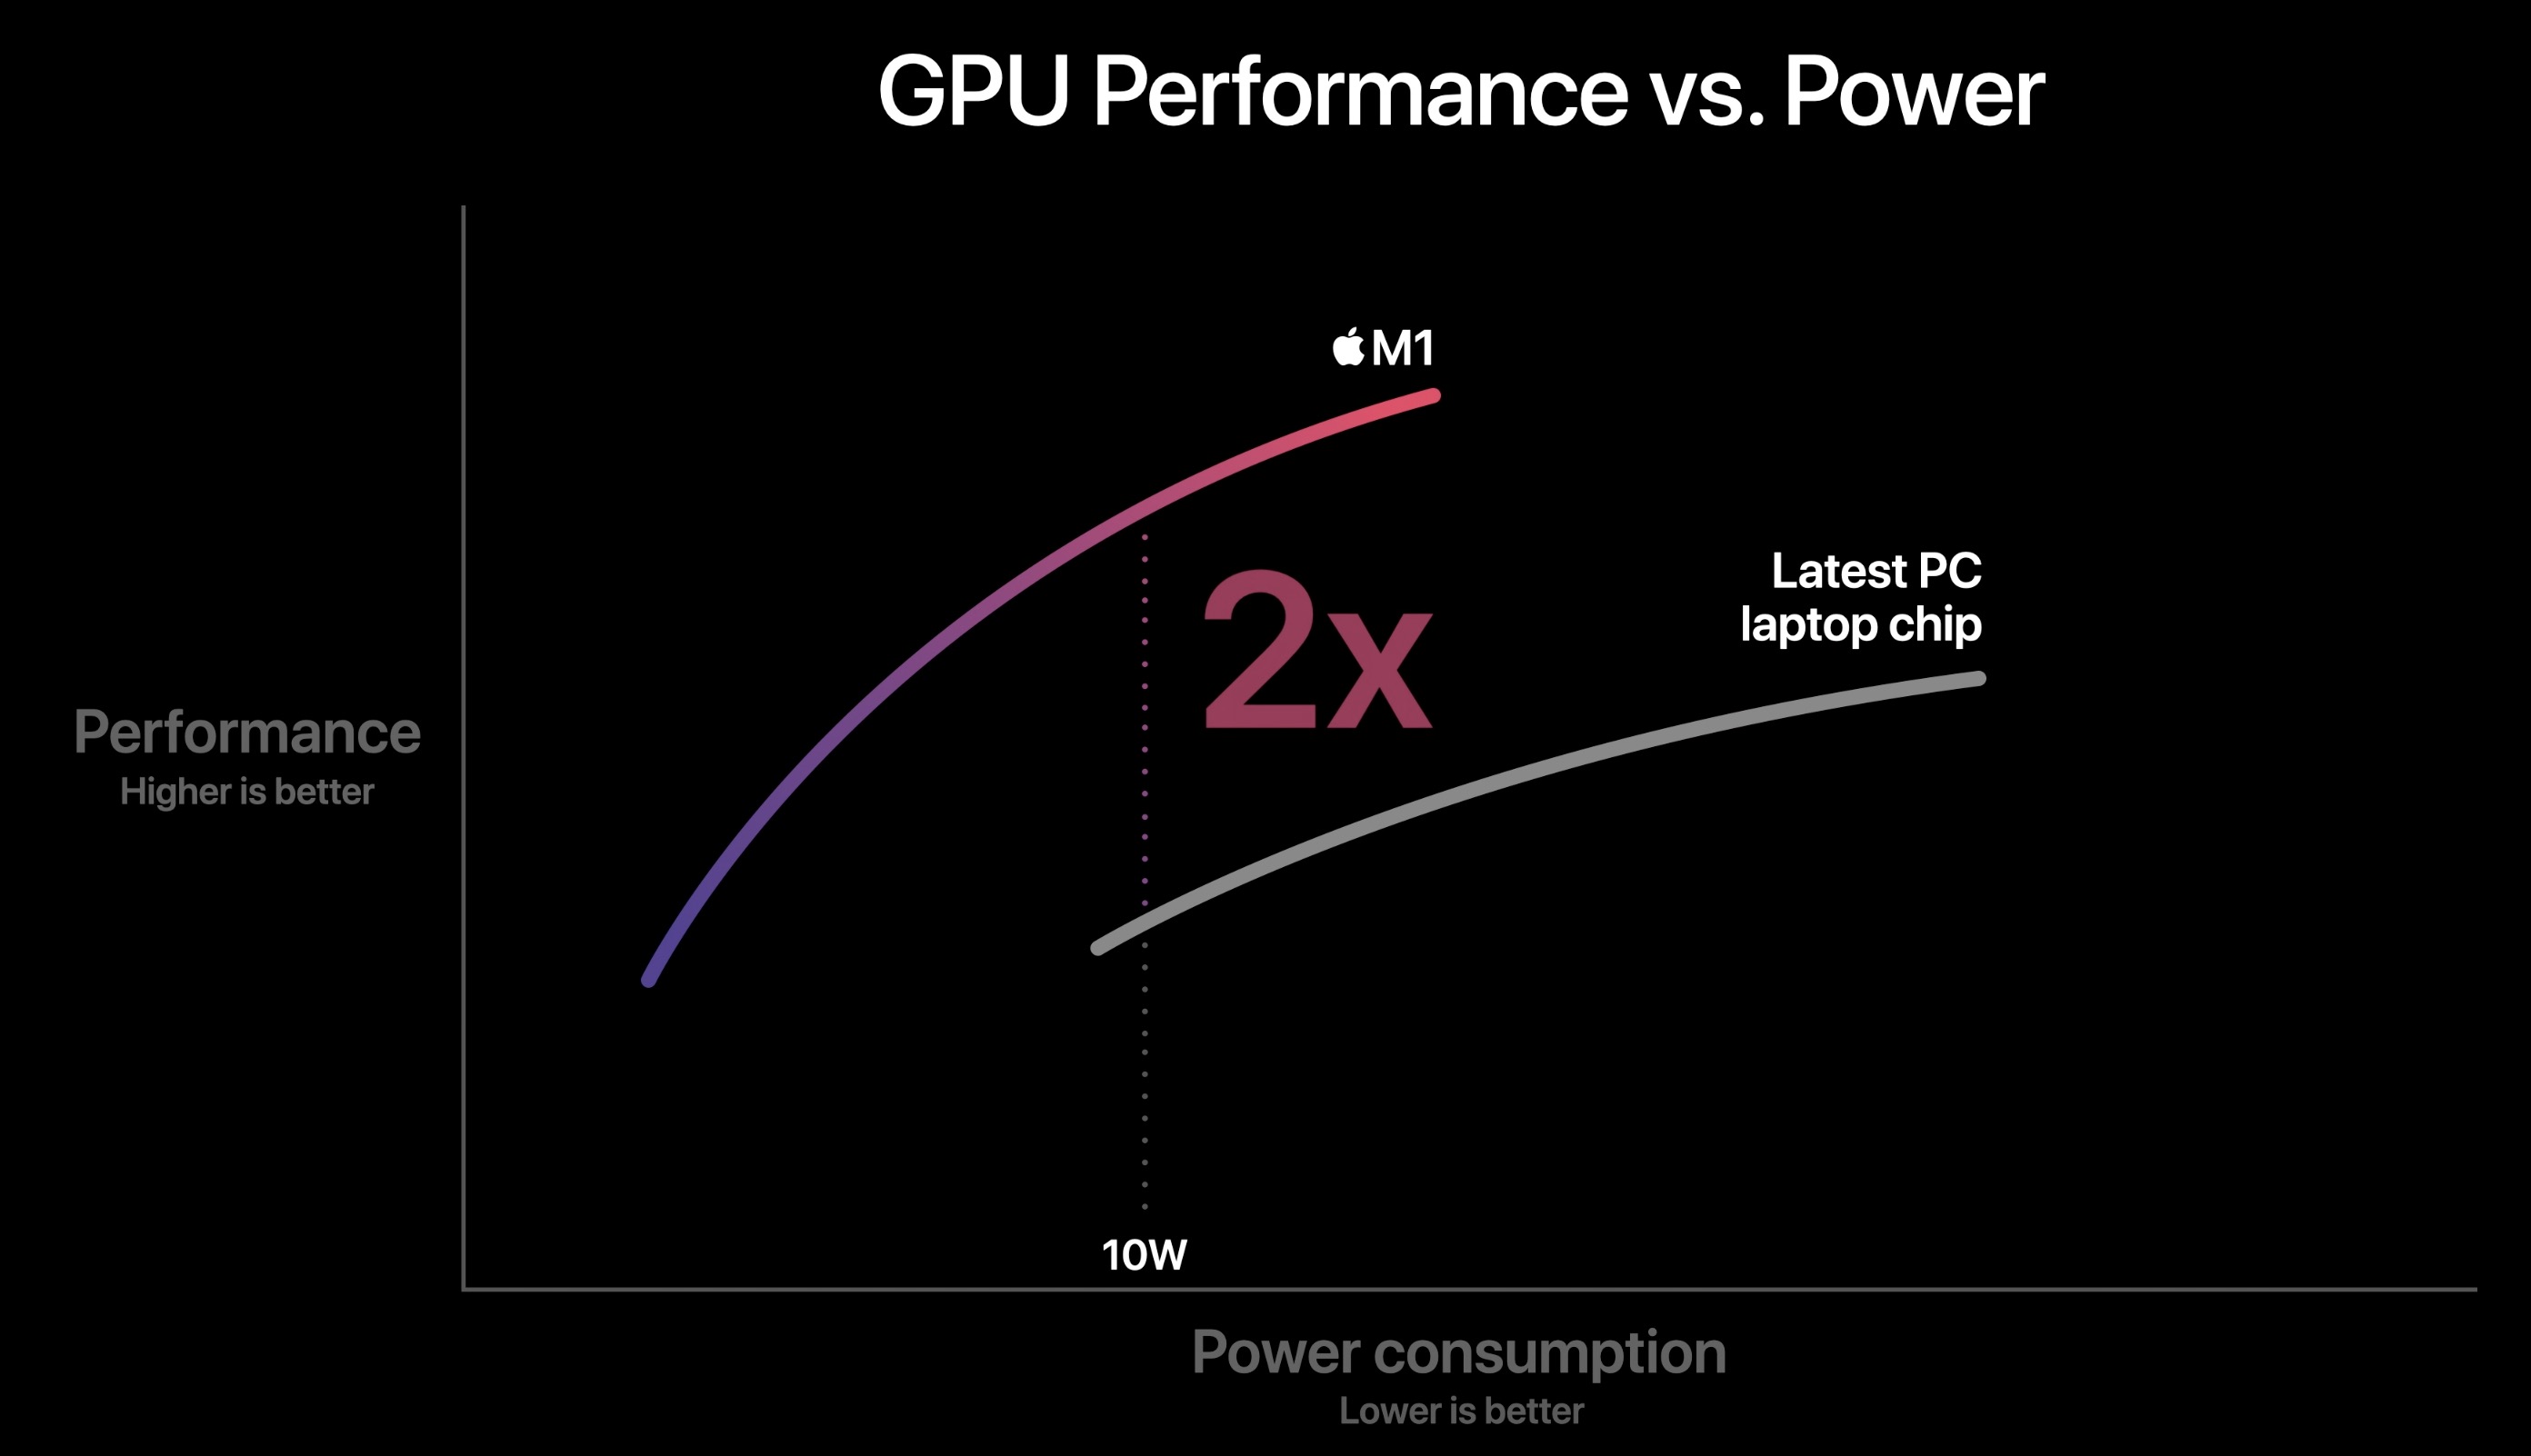
The Apple M1 GPU is an integrated graphics card offering 7 cores (1 deactivated core in the entry MacBook Air) designed by Apple and integrated in the Apple M1 SoC. According to Apple it is faster and more energy efficient as competing products (like the Tiger Lake Xe GPU). The peak performance of the high end variant with 8 cores is 2.6 teraflops, therefore the 7 core version should offer around 2.3 teraflops. Thanks to the unified memory architecture it should have fast access to the RAM.

The Apple M1 is manufactured in the modern 5nm process at TSMC and should offer an excellent energy efficiency.

Apple M1 Pro 14-Core GPUApple M1 7-Core GPU
Apple M1 Series
M1 Max 32-Core GPU compare 32 @ 1.3 GHz512 Bit
M1 Max 24-Core GPU compare 24 @ 1.3 GHz
M1 Pro 16-Core GPU compare 16 @ 1.3 GHz
M1 Pro 14-Core GPU 14 @ 1.3 GHz
M1 8-Core GPU compare 8 @ 1.28 GHz
M1 7-Core GPU 7 @ 1.28 GHz
M1 Max 32-Core GPU compare 32 @ 1.3 GHz512 Bit
M1 Max 24-Core GPU compare 24 @ 1.3 GHz
M1 Pro 16-Core GPU compare 16 @ 1.3 GHz
M1 Pro 14-Core GPU 14 @ 1.3 GHz
M1 8-Core GPU compare 8 @ 1.28 GHz
M1 7-Core GPU 7 @ 1.28 GHz
Pipelines14 - unified7 - unified
Core Speed1296 MHz1278 MHz
Theoretical Performance4.6 TFLOPS FP32
Memory TypeLPDDR5-6400LPDDR4X-4266
Shared Memorynono
Memory Bandwidth200 GB/s
Power Consumption15 Watt
technology5 nm5 nm
Date of Announcement10.11.2020 10.11.2020
CPU in M1 Pro 14-Core GPUGPU Base SpeedGPU Boost / Turbo
Apple M1 Pro 8-Core8 x 2060 MHz? MHz1296 MHz

Benchmarks

3DMark - 3DMark Wild Life Unlimited
16159 Points (8%)
3DMark - 3DMark Wild Life Extreme Unlimited
9267 Points (11%)
4515 Points (5%)
Unigine Heaven 3.0 - Unigine Heaven 3.0 OpenGL
36.4 fps (16%)
Blender - Blender 3.3 Classroom METAL *
956 Seconds (100%)
Cinebench R15
Cinebench R15 OpenGL 64 Bit + Apple M1 Pro 14-Core GPU
Cinebench R15 - Cinebench R15 OpenGL 64 Bit
91.8 fps (5%)
Cinebench R15 OpenGL 64 Bit + Apple M1 7-Core GPU
90 fps (5%)
Cinebench R15 OpenGL Ref. Match 64 Bit + Apple M1 Pro 14-Core GPU
Cinebench R15 - Cinebench R15 OpenGL Ref. Match 64 Bit
99.5 % (100%)
Cinebench R15 OpenGL Ref. Match 64 Bit + Apple M1 7-Core GPU
99.5 % (100%)
GFXBench - GFXBench 5.0 Aztec Ruins High Tier Offscreen
147 fps (27%)
72.4 fps (13%)
GFXBench - GFXBench 5.0 Aztec Ruins Normal Tier Offscreen
394 fps (29%)
192 fps (14%)
GFXBench - GFXBench Car Chase Offscreen
316 fps (36%)
162 fps (18%)
GFXBench 3.1 - GFXBench Manhattan ES 3.1 Offscreen
496 fps (10%)
240 fps (5%)
GFXBench 3.0 - GFXBench 3.0 Manhattan Offscreen
817 fps (48%)
376 fps (22%)
GFXBench (DX / GLBenchmark) 2.7
GFXBench T-Rex HD Offscreen C24Z16 + Apple M1 Pro 14-Core GPU
GFXBench (DX / GLBenchmark) 2.7 - GFXBench T-Rex HD Offscreen C24Z16
1457 fps (12%)
GFXBench T-Rex HD Offscreen C24Z16 + Apple M1 7-Core GPU
620 fps (5%)
Geekbench 6.2 - Geekbench 6.2 GPU OpenCL
18341 Points (5%)
Geekbench 6.2 - Geekbench 6.2 GPU Metal
30112 Points (19%)
Power Consumption - Witcher 3 Power Consumption *
58.2 Watt (13%)
Power Consumption - GFXBench Aztec Ruins Normal Tier Offscreen Power Consumption 150cd *
35 Watt (14%)
19.5 Watt (8%)
Emissions Witcher 3 Fan Noise + Apple M1 Pro 14-Core GPU
Emissions - Witcher 3 Fan Noise
27.8 dB(A) (44%)

Average Benchmarks Apple M1 Pro 14-Core GPU → 100% n=9

Average Benchmarks Apple M1 7-Core GPU → 59% n=9

- Range of benchmark values for this graphics card
- Average benchmark values for this graphics card
* Smaller numbers mean a higher performance
1 This benchmark is not used for the average calculation

Game Benchmarks

The following benchmarks stem from our benchmarks of review laptops. The performance depends on the used graphics memory, clock rate, processor, system settings, drivers, and operating systems. So the results don't have to be representative for all laptops with this GPU. For detailed information on the benchmark results, click on the fps number.

F1 2020

F1 2020

2020
low 1280x720
100%
M1 Pro 14-Core GPU:
65  fps
QHD 2560x1440
M1 7-Core GPU:
58  fps
low 1280x720
100%
M1 Pro 14-Core GPU:
61.9  fps
73%
M1 7-Core GPU:
45.2  fps
med. 1920x1080
100%
M1 Pro 14-Core GPU:
39.4  fps
71%
M1 7-Core GPU:
28  fps
high 1920x1080
100%
M1 Pro 14-Core GPU:
31.9  fps
55%
M1 7-Core GPU:
17.7  fps
ultra 1920x1080
100%
M1 Pro 14-Core GPU:
24.1  fps
low 1280x720
100%
M1 Pro 14-Core GPU:
171  fps
56%
M1 7-Core GPU:
95.2 (!)  fps
med. 1920x1080
100%
M1 Pro 14-Core GPU:
58  fps
45%
M1 7-Core GPU:
26.3 (!)  fps
high 1920x1080
100%
M1 Pro 14-Core GPU:
36  fps
48%
M1 7-Core GPU:
17.4 (!)  fps
ultra 1920x1080
100%
M1 Pro 14-Core GPU:
27  fps
low 1280x720
100%
M1 Pro 14-Core GPU:
122  fps
53%
M1 7-Core GPU:
65  fps
med. 1920x1080
100%
M1 Pro 14-Core GPU:
58  fps
38%
M1 7-Core GPU:
22  fps
high 1920x1080
100%
M1 Pro 14-Core GPU:
53  fps
ultra 1920x1080
100%
M1 Pro 14-Core GPU:
46  fps
QHD 2560x1440
100%
M1 Pro 14-Core GPU:
30  fps
F1 2017

F1 2017

2017
low 1280x720
M1 7-Core GPU:
60  fps
med. 1920x1080
M1 7-Core GPU:
54  fps
high 1920x1080
M1 7-Core GPU:
43  fps
low 1280x720
M1 7-Core GPU:
43.9  fps
med. 1920x1080
M1 7-Core GPU:
32.5  fps
low 1024x768
100%
M1 Pro 14-Core GPU:
120  fps
67%
M1 7-Core GPU:
80.3  fps
med. 1366x768
100%
M1 Pro 14-Core GPU:
72  fps
high 1920x1080
M1 7-Core GPU:
30.1  fps
ultra 1920x1080
M1 7-Core GPU:
27  fps
4K 3840x2160
M1 7-Core GPU:
15.8  fps
low 1280x720
M1 7-Core GPU:
47.6  fps
med. 1366x768
M1 7-Core GPU:
35.3  fps
high 1920x1080
M1 7-Core GPU:
19  fps
low 1024x768
M1 7-Core GPU:
109  fps
high 1366x768
M1 7-Core GPU:
69  fps
ultra 1920x1080
M1 7-Core GPU:
44.4  fps
high 1366x768
M1 7-Core GPU:
86  fps
ultra 1920x1080
M1 7-Core GPU:
47  fps

Average Gaming Apple M1 Pro 14-Core GPU → 100%

Average Gaming 30-70 fps → 100%

Average Gaming Apple M1 7-Core GPU → 56%

Average Gaming 30-70 fps → 63%

Apple M1 Pro 14-Core GPUlowmed.highultraQHD4K
F1 202065
Borderlands 361.939.431.924.1
Total War: Three Kingdoms171583627
Shadow of the Tomb Raider12258534630
Civilization VI12072
< 30 fps
< 60 fps
< 120 fps
≥ 120 fps


2
3

3
1

3

2
1


1


Apple M1 7-Core GPUlowmed.highultraQHD4K
Hearthstone58
Borderlands 345.22817.7
Total War: Three Kingdoms95.226.317.4
Shadow of the Tomb Raider6522
F1 2017605443
Warhammer 40.000: Dawn of War III43.932.5
Civilization VI80.330.12715.8
Deus Ex Mankind Divided47.635.319
Counter-Strike: GO1096944.4
Batman: Arkham City8647
< 30 fps
< 60 fps
< 120 fps
≥ 120 fps

3
5
3
3

3
2
2
1
2


1

1


For more games that might be playable and a list of all games and graphics cards visit our Gaming List

Add one or more devices and compare

In the following list you can select (and also search for) devices that should be added to the comparison. You can select more than one device.

restrict list:

show all (including archived), 2024, 2023
v1.26
log 16. 17:48:46

#0 checking url part for id 10965 +0s ... 0s

#1 checking url part for id 10560 +0s ... 0s

#2 not redirecting to Ajax server +0s ... 0s

#3 did not recreate cache, as it is less than 5 days old! Created at Tue, 16 Apr 2024 05:39:00 +0200 +0.001s ... 0.001s

#4 composed specs +0.101s ... 0.102s

#5 did output specs +0s ... 0.102s

#6 start showIntegratedCPUs +0s ... 0.102s

#7 getting avg benchmarks for device 10965 +0.026s ... 0.128s

#8 got single benchmarks 10965 +0.008s ... 0.136s

#9 getting avg benchmarks for device 10560 +0.002s ... 0.138s

#10 got single benchmarks 10560 +0.008s ... 0.147s

#11 got avg benchmarks for devices +0s ... 0.147s

#12 min, max, avg, median took s +0.071s ... 0.218s

#13 before gaming benchmark output +0s ... 0.218s

#14 Got 42 rows for game benchmarks. +0.011s ... 0.229s

#15 composed SQL query for gamebenchmarks +0s ... 0.229s

#16 got data and put it in $dataArray +0.01s ... 0.238s

#17 benchmarks composed for output. +0.03s ... 0.268s

#18 calculated avg scores. +0s ... 0.268s

#19 return log +0.051s ... 0.319s

Please share our article, every link counts!
> Expert Reviews and News on Laptops, Smartphones and Tech Innovations > Benchmarks / Tech > Graphics Card Comparison - Head 2 Head
Redaktion, 2017-09- 8 (Update: 2023-07- 1)